MIT Sloan School of Management
Working Paper 4414-03
February 2003
A Decomposition of Global Linkages
in Financial Markets Over Time
Kristin J. Forbes and Menzie D. Chinn
© 2003 by Kristin J. Forbes and Menzie D. Chinn. All rights reserved. Short sections of text, not to exceed two paragraphs, may be quoted without explicit permission, provided that full credit including © notice is given to the source.
This paper also can be downloaded without charge from the Social Science Research Network Electronic Paper Collection:
A Decomposition of Global Linkages
in Financial Markets Over Time*
By
Kristin J. Forbes
MIT and NBER
and
Menzie D. Chinn
University of California at Santa Cruz and NBER
February 24, 2003
Abstract: This paper tests if real and financial linkages between countries can explain why
movements in the world’s largest markets often have such large effects on other financial
markets, and how these cross-market linkages have changed over time. It estimates a factor model in which a country’s market returns are determined by: global, sectoral, and cross-country factors (returns in large financial markets), and country-specific effects. Then it uses a new data set on bilateral linkages between the world’s 5 largest economies and about 40 other markets to decompose the cross-country factor loadings into: direct trade flows, competition in third markets, bank lending, and foreign direct investment. Estimates suggest that both cross-country and sectoral factors are important determinants of stock and bond returns, and that the U.S. factor has recently gained importance, while the Japanese and U.K. factors have lost importance. From 1996-2000, real and financial linkages became more important determinants of how shocks are transmitted from large economies to other markets. In particular, bilateral trade flows are large and significant determinants of cross-country linkages in both stock and bond markets. Bilateral foreign investment is usually insignificant. Therefore, despite the recent growth in global
financial flows, direct trade still appears to be the most important determinant of how movements in the world’s largest markets affect financial markets around the globe.
JEL Codes: F36, G15, F15, F21,
Key words: trade linkages, bank lending, factor models, financial integration, interdependence
*Thanks to Robin Brooks, Ashoka Mody, Andy Rose, Beatrice Weder and participants at the Global Linkages conference for helpful comments and suggestions. We are also grateful to Andy Rose, Sergio Schmukler, and Frank Warnock for kindly sharing their data sets. Author contact information: Kristin Forbes, MIT-Sloan School of Management, Room E52-455, 50 Memorial Drive, Cambridge, MA 02142, email: kjforbes@mit.edu, web page: http://web.mit.edu/kjforbes/www. Menzie Chinn, NBER, 1050 Massachusetts Avenue, Cambridge, MA 02138, email: chinn@cats.ucsc.edu.
I. Introduction
In the first half of 2002, the U.S. was buffeted by a series of negative shocks — from
disappointing economic growth, to terrorist threats and uncertainty about a potential war with Iraq, to continued fallout from a series of financial scandals that raised broader concerns about corporate governance. As a result, the U.S. stock market fell by about 17 percent over the first 6 months of the year.1 Many other markets around the world declined in harmony; over the same
6-month period, Finland’s stock market fell by 30 percent, Ireland’s by 14 percent, Mexico’s by 11 percent, and Hong Kong’s by 6 percent. Other stock markets, however, performed relatively well and appeared to be isolated from the series of negative news in the U.S. For example, over the same period Iceland’s stock market experienced positive returns of 26 percent, South Africa’s of 21 percent, South Korea’s of 12 percent, and Colombia’s of 11 percent. Shocks to the world’s largest economies and their financial markets often spread to some markets, while markets in other countries are relatively isolated.
This paper examines if real and financial linkages between countries can explain why the world’s largest financial markets often appear to have such large, yet diverse, effects on other financial markets, and how these cross-market linkages have changed over time. More
specifically, the paper attempts to answer four questions. First, how important are cross-country linkages with large financial markets, as compared to global and sectoral factors, in explaining financial market returns in countries around the world? Second, how important are bilateral trade flows, trade competition in third markets, bank lending, and investment exposure in explaining these cross-country linkages? Third, how has the relative importance of these various global linkages changed over time? Finally, how does the relative importance of these global linkages differ across stock markets and bond markets?
In order to answer these questions, this paper begins by developing a factor model of market returns in different countries. It assumes that a country’s market returns are a function of: global factors (global interest rates, oil prices, gold prices, and commodity prices), sectoral factors (stock returns for 14 sectoral indices), cross-country factors (returns in other large financial markets), and country-specific effects. After estimating the importance of these factors for different countries and regions, the paper then focuses on the estimated cross-country linkages between the five largest economies (France, Germany, Japan, the U.K. and U.S) and about 40 developed countries and emerging markets around the world. It decomposes these cross-country linkages into four specific bilateral linkages: two real linkages (direct trade flows and competition in third markets) and two financial linkages (bank lending and foreign direct investment). After
measuring the importance of each of these factors and bilateral linkages in stock markets between 1986 and 2000, the paper than examines how their relative importance has changed over time and differs in bond markets.
The paper finds that both cross-country factors and sectoral factors are important
determinants of stock and bond returns in countries around the world (although it is often difficult to differentiate between these two sets of factors). Not surprisingly, movements in the largest regional economy tend be the most important cross-country factor for nearby countries (such as the U.S. market for the Americas), although movements in the U.S. market are also important for most regions. In the later half of the 1990’s, the U.S. factor and sectoral factors gained
importance in most regions, while the Japanese and U.K. factors lost importance.
Results from the second-stage regressions that decompose the cross-country factor loadings into different real and financial linkages find that between 1986-90 and 1991-95, bilateral linkages are fairly unimportant and estimation results are highly sensitive to model specification. From 1996-2000, however, bilateral linkages through trade and finance become more significant determinants of how shocks are transmitted from large economies to markets around the world. More specifically, direct trade flows appear to be the strongest and most important determinant of cross-country linkages in both stock and bond markets. Bilateral bank lending and trade competition in third markets can also be significant determinants of cross-country linkages, although the importance of these bilateral linkages fluctuates across asset markets and model specifications. Bilateral foreign investment, however, is generally not a significant determinant of cross-country linkages. These results establish a connection between high-frequency movements in financial markets and lower-frequency real variables. These results also suggest that despite the recent growth in capital flows across countries, direct trade linkages are still more important than financial linkages in determining how shocks to the world’s largest economies affect markets around the globe.
One of the contributions of this paper is a new data set on bilateral trade and financial linkages between the world’s largest economies and about 40 developed countries and emerging markets. Although information on bilateral trade flows has been widely available for years, other variables are fairly new to this literature, such as the statistics measuring bilateral investment positions and trade competition in third markets based on 4-digit SITC industry information.2
Perhaps most important, this is the first study to simultaneously control for direct trade flows,
1 Aggregate stock market indices reported by Datastream. See Section IV for additional data information. 2 Forbes (2002) also constructs this trade competition variable for a series of “crisis countries” between
trade competition in third markets, bank lending, and foreign direct investment, when attempting to explain cross-country linkages. Other papers have controlled for one or two of these linkages to examine a range of questions, but since the four bilateral linkage variables could be highly
correlated, omitting a subset of these variables could severely bias coefficient estimates.
Therefore, by simultaneously controlling for all four types of bilateral linkages, this paper should provide more accurate estimates of the relative importance of different types of trade and
financial channels in explaining cross-country comovement in financial markets.
The remainder of the paper is as follows. Section II briefly reviews related literature. Section III develops the models and estimation framework. Section IV describes the data set and construction of several new variables. It also examines trends in various bilateral linkages for different sets of countries. Section V provides initial results for stock markets over the full sample period from 1986 to 2000, and Section VI examines how the importance of various global
linkages has evolved over time. Section VII performs a similar analysis for bond markets and compares results to those for stock markets. Section VIII summarizes an extensive series of sensitivity tests. Section IX concludes by summarizing how this paper’s new dataset and the corresponding results provide insights on the changing nature of integration between the world’s largest economies and financial markets around the world.
II. Related Literature
This paper builds on an extensive literature that can be roughly grouped into four categories: asset market comovement and financial integration, business cycle synchronization and real
integration, firm-level exposure to real and financial shocks, and the international transmission of crises.3 The literature on cross-country correlations in asset returns can be traced back to Sharpe’s
(1964) and Lintner’s (1965) contributions to the international capital asset pricing model. This framework posits that in completely segmented markets, local asset returns will be based on local factors. With integrated capital markets, however, expected asset returns are determined by the asset’s covariance with the world market portfolio. A large body of research has therefore attempted to identify how the integration of previously segmented markets has changed patterns of cross-country equity correlations. Increased integration with global markets, however, does not necessarily generate increased correlations between domestic and global asset returns.
3 See Karolyi and Stulz (2002) for an excellent survey of related literature. Also see Bekaert and Harvey
One reason why integration may not generate increased correlations is differences in industrial structures between individual countries and the world average. Roll (1992) argues that industry structure and concentration are important determinants of a country’s stock market behavior, and that countries with more similar industrial compositions tend to have more highly correlated stock market returns. In subsequent work, there has been an active debate on the relative importance of industry effects versus country-specific effects in explaining cross-country correlations and volatility. Heston and Rouwenhorst (1994) argue that industrial structure
explains very little of the cross-sectional differences in country return volatility in Europe, and that the low correlation between country indices is almost completely due to country-specific sources of return variation. Griffin and Karolyi (1998) find that although industry effects are significant determinants of international stock returns, country-specific effects are the dominant factor. Cavaglia et al. (2000) argue that the importance of industry factors has recently grown, so that by the late 1990’s they dominated country factors. Brooks and Del Negro (2002a), however, argue that this recent increase is largely driven by cyclical effects from the bubble in
telecommunications, media, biotechnology and information technology (TMBT) in the U.S. Moreover, Brooks and del Negro (2002b) control for global shocks and use a more flexible modeling strategy to find that country-specific shocks are currently more important than industry shocks in explaining the international variation in returns.
In addition to the literature discussed above that focuses on stock market returns and financial market comovement, there is also an extensive literature examining “synchronization” and the cross-country comovement in business cycles and real variables.4 Some of these papers,
such as Kose et al. (2003), examine how global integration has affected cross-country correlations in output, consumption and investment. Other papers attempt to explain correlations between business cycles based on country characteristics and specific measures of integration. For
example, Frankel and Rose (1998) focus on the role of trade, Heathcote and Perri (2002) on asset diversification, and Imbs (2003) simultaneously examines the role of output compositions, trade patterns, and capital account fluctuations. A priori, it is unclear if greater integration would increase or decrease business cycle correlations. For example, greater integration could lead to greater industrial specialization, so that countries are more vulnerable to industry-specific shocks than common shocks. Most of the empirical work on this subject, however, has found that greater integration through trade and/or finance increases business cycle correlations.
Connecting this branch of literature on real integration and business cycles with the former literature on asset market comovement is a related literature on firm-level exposure to
exchange rate movements and real variables.5 Most of this work finds that only a small percent of firms are significantly exposed to exchange-rate movements, and that the relationship between exchange rate exposure and real linkages with other countries is either weak or nonexistent. For example, Dominguez and Tesar (2001b) argue that firms which engage in cross-country trade are not significantly more exposed to exchange rate movements. On the other hand, Brooks and Del Negro (2003) show that firms which operate internationally are more exposed to global market movements and less to country-specific factors. This is one of the few papers to document a significant relationship between trade exposure and firm-level stock returns over annual periods or longer, a connection that is also documented at the country level in this paper.
While most of the literature discussed above has focused on the determinants of cross-country correlations (in either financial markets or real variables) over long periods or around financial integration, another related literature has focused on asset market comovement during financial crises. Much of this work has focused on “contagion” and the international transmission of crises.6 Initially, papers attempted to simply document whether a crisis generated a significant increase in cross-market correlations between the crisis country and other countries—with a significant increase interpreted as evidence of contagion.7 More recent work has attempted to
document the specific channels by which a crisis in one country spreads to other countries, with certain transmission mechanisms defined as “contagion” (such as investor herding) and other mechanisms (such as trade flows) defined as “fundamentals” or interdependence”.
This body of literature attempting to measure the different channels by which a shock to one country spreads to other countries is most closely related to the decomposition of bilateral linkages performed in this paper (although this paper focuses on the transmission of shocks from the world’s largest economies during longer periods of time, instead of from smaller crisis economies during periods of financial market turmoil).8 Eichengreen and Rose (1999) and Glick
and Rose (1999) were the earliest papers to focus on the role of trade, versus a country’s macroeconomic characteristics, in explaining a country’s vulnerability to a crisis that originated elsewhere. Forbes (2002) builds on this work by decomposing trade into distinct channels, such as direct trade flows and industry-level competition in third markets, both of which affect the transmission of recent crises. Van Rijckeghem and Weder (2001) and (2002) were two of the first
4 See Imbs (2003) for a more thorough review of this literature.
5 See Dominguez and Tesar (2001a) for a detailed review of this literature.
6 See Claessens and Forbes (2001) for a series of papers on this subject. In particular, see Claessens et al.
(2001) for a detailed review of the literature on contagion.
7 See Forbes and Rigobon (2002) for a review of this literature and critical assessment of tests for contagion
based on correlation coefficients.
papers to examine the role of bank lending, as well as trade, in explaining contagion.9 Forbes (2003) is one of the only papers to attempt to measure the importance of these trade and financial channels in the transmission of crises at the firm level.
Many of these papers find that trade linkages between countries—whether direct trade flows or competition in third markets—were important determinants of how crises affected other countries. Some of the literature which has also included measures of bank lending between countries, however, has argued that bilateral financial flows may be even more important than trade flows, although it can be difficult to isolate their independent effects. One limitation of all of these studies (which most authors candidly admit) is that since many different bilateral linkages are highly correlated and difficult to measure, studies that only include a subset of these linkages could have problems with omitted-variable bias. For example, studies that control for trade linkages between countries, but not bank lending or investment, are likely to overstate the importance of trade linkages.
This paper is the first study, to the best of our knowledge, to simultaneously control for direct trade flows, competition in third markets, bank lending, and foreign direct investment when measuring asset market comovements and the international transmission of shocks. This approach should therefore reduce any omitted-variable bias in the estimated importance of each of these bilateral linkages. Even this more comprehensive analysis, however, is incomplete, since there are numerous other cross-country linkages that are not included in this study due to limited bilateral data availability. For example, Kaminsky et al. (2001) show that mutual fund investments can be important mechanisms for the cross-country transmission of crises. Karolyi (2003) shows that cross-listing through American Depositary Receipts (ADRs) can affect stock market integration. Multinational exposure across borders or trade credit could also be important transmission mechanisms. All of these variables are likely to be correlated with bilateral foreign investment or trade flows, potentially biasing the relevant coefficient estimates. Therefore, although this paper’s analysis of bilateral linkages is more complete than previous work, additional bilateral linkages that are not included in this analysis could still affect estimates.
III. Model and Estimation Framework
This section describes the two-stage modeling framework used to estimate the importance of different cross-country linkages over long periods, as well as how their importance has changed
9 Other papers which simultaneously control for cross-country linkages through trade as well as bank
over time. In the first stage, we estimate a factor model of returns, controlling for global, sectoral, and cross-country factors. In the second stage, we decompose the estimated cross-country factor loadings into four types of bilateral linkages: import demand, trade competition, bank lending, and foreign investment.
Returns in two countries could commove due to a number of factors. First, returns in both countries could be affected by global shocks, such as changes in: the world interest rate, oil prices, other commodity prices, or global risk aversion. Second, returns in both countries could be affected by sectoral shocks that simultaneously affect all countries that produce in or have
exposure to the given sector. As discussed in Section II, one sectoral shock that has recently received substantial attention is the “bubble” in technology, media, and telecommunications in the late 1990’s. Third, returns in two countries could co-move because shocks to one country are transmitted to other countries through cross-country linkages, such as bilateral trade, export competition in third markets, bilateral bank lending, or bilateral investment flows. Although these cross-country linkages are the focus of this paper, it is important to control for any global or sectoral shocks in order to accurately estimate the magnitude of these linkages and avoid spuriously capturing changes in other factors that affect country comovement.
In order to isolate the importance of cross-country linkages, this paper uses a factor model of returns that controls for three sets of factors: global, sectoral, and cross-country. It also allows market returns in each country to be determined by a country-specific effect. For each country i, asset returns (Rit) at each time t can be expressed as:
it C c c t c i S s s t s i G g g t g i i it f f f R =α + ∑φ +∑γ +∑β +ε = = =1 1 1 , (1)
with E
[ ]
εit =0 ,E[ ]
εit2 =σi2 ,and E[ ]
εitεjt =σij2 for each 2 countries i and j with i≠j. The ftg are the G global factors; the f are the S sectoral factors; the ts f are the C cross-country factors, tc corresponding to each large country c; φig, γis, and βic are the country-specific factor loadings for the global, sectoral and cross-country factors, respectively; αi is a country-specific effect; andεit is a normally-distributed error term, with errors not necessarily independent across countries. Factor loadings are therefore assumed to be constant across the given period for each country, but allowed to vary across countries.
The model in equation (1) is assumed to hold for each of the smaller countries i in the world, with i=1,2,…I. The C countries that are defined as the cross-country factors are large countries in which shocks are expected to have the greatest spillover effects in countries around the world. These C larger countries are then excluded from the set of countries included as i. For example, Chile and the Philippines could be two countries included as countries i, and the U.S. and Japan could be two countries included as countries c but not included as i. Estimates of
c i
β should therefore capture the effect of movements in the U.S. and Japanese markets on the Chilean and Philippine markets, with minimal feedback effect from Rit to f .tc 10 The model
focuses on the effect of shocks to larger countries on smaller countries, rather than estimating simultaneous equations between all countries in the world, due to limited data availability for bilateral linkages between most smaller countries in the world.
One potential problem with equation (1), however, is that the global, sectoral, and cross-country factors can be highly correlated, making it difficult to isolate the individual impact of each set of factors. More specifically, if a large country c that is a major producer (or purchaser) in a given industrial sector experiences a significant shock, the country-specific shock could not only affect other countries through cross-country linkages, but also simultaneously affect certain sectors on a global basis. For example, the U.S. produces a major share of global production and is a major consumer in the electronics industry. The impact of a shock to the U.S. economy on other countries could therefore be largely captured in the sectoral factor for electronics, reducing estimates of any direct cross-country effects of the U.S. on other economies. Similarly, if a shock to a major economy (such as the U.S.) spreads to most other countries in the world, this could appear to be a “global” shock, even though it is technically just a country-specific shock in a major economy. In order to control for this potential multicollinearity when estimating the factor loadings, we examine the correlation structure between each of the factors, as well as estimate equation (1) without the sectoral and/or global factors.
After obtaining estimates of the cross-country loadingsβic(either with or without controls for the full set of global and sectoral factors) for each pair of small countries i and large countries c (an I x C matrix of β’s), we decompose these cross-country loadings into different types of bilateral linkages. We focus on four different channels through which shocks to a large country c could affect a smaller country i. First, shocks to country c could affect country c’s demand for
10 There are, however, unusual occasions when shocks to smaller countries affect larger countries—such as
when the 1998 Russian crisis affected bond spreads in the U.S. In these cases, estimates of
β
icshould be interpreted as correlations between two countries c and i, instead of direct effects of country c on country i.imports from country i. Second, shocks to country c, and especially shocks to country c that affect country c’s exchange rate, could affect the relative price of country c’s exports and therefore affect country i through trade competition in third markets. Third, shocks to country c could affect bank lending from country c into smaller countries i. Finally, shocks to country c could affect flows of foreign investment from country c into country i. There are obviously other channels that could link large and small countries, such as portfolio investment, trade credit, or multinational exposure. We focus on these four channels, however, not only because they have been highlighted in previous literature (as discussed in Section II), but also because these are bilateral linkages for which data is available.11
In order to estimate the importance of these four different bilateral linkages in explaining the cross-country factor loadings, we use the following model:
ic c i c i c i c i c i c i Investment Foreign Lending Bank n Competitio Trade Demand Import η α α α α α β + + + + + + = Χ α5 4 3 2 1 0 (2)
where βicare the cross-country factor loadings (estimated in equation (1)) that measure the effect of asset returns in country c on country i after controlling for global and/or sectoral shocks; α0 is a constant term; Import Demandci measures the importance to country i of imports from country i into country c; Trade Competitionc
i measure the importance to country i of export competition in 3rd markets between country i and country c; Bank Lendingc
i measures the importance to country i of bank loans from country c; Foreign Investmentc
i measures the importance to country i of total investment from country c; Xc
i is a matrix including any country-specific factors in countries i
and/or c that could affect linkages with other countries (such as capital controls); and ηic is a normally-distributed error term.
This model developed in equations (1) and (2) can easily be extended to measure not only the average role of different global linkages over the full period, but also how their importance has changed over time. More specifically, the model can be estimated for different time periods to see if there is a significant change in coefficient estimates across periods. Or, instead of focusing on average values for each of the variables over a given period of time, it is possible to use annual data over the same period to estimate a panel model. More specifically, assume that equation (1)
11 To the best of our knowledge, bilateral data on variables such as portfolio investment, trade credit, and
is estimated using annual data, yielding annual estimates of the c iz
β
’s for each pair of countries i and c in each year z. Then equation (2) can be estimated as an annual panel:icz z c iz c iz c iz c iz c iz c iz Investment Foreign Lending Bank n Competitio Trade Demand Import η α α α α α β + + + + + + + = T α Χ α5 6 4 3 2 1 0 (2′)
where Tz is a vector of annual dummy variables and all other variables are defined above, except
each now represents the relevant variable over the year z instead of averaged over the full period. Both equations (2) and (2′) will be estimated for each of the model variations below.
Although, at first glance, one might expect that positive (negative) movements in large countries’ asset markets would have positive (negative) effects on other countries’ asset markets through each of the four bilateral linkage variables (so that α1, α2, α3, α4>0), theory suggests that
the signs of these coefficients are a priori indeterminate and can only be ascertained empirically. For example, negative news about a large economy’s growth prospects could cause negative returns in the large country’s asset market. This could generate a contraction in lending and investment by banks and firms based in the large country as they strengthen balance sheets and build reserves for the expected slowdown.12 The resulting contraction in lending and investment
in other countries would be expected to have a negative affect on asset returns in other countries, so that α3, α4>0. On the other hand, if the negative economic news on the large country caused
banks and investors to keep their total volume of lending/investment fairly constant, but shift exposure away from the large economy to other countries, then they could increase
lending/investment in other markets so that α3, α4<0.
The sign of the coefficient on Trade Competition is also difficult to predict. If the
negative economic news in the large country corresponded to a depreciation of the large country’s exchange rate, this could give its exports a competitive advantage, and therefore have a negative effect on expected asset returns in countries that are important trade competitors (so that α2>0). If
the exchange rate movement is not fully passed through into export prices (possibly due to pricing-to-market effects), or the exchange-rate movement is only expected to be short lived, however, any effect on competitors could be minimal. Moreover, if the negative news in the large economy is any factor potentially hurting firm competitiveness—such as disappointing
12 Peek and Rosengreen (1997) provide evidence of this and show that after the 1990 Japanese stock market
crash, Japanese banks reduced lending in the U.S. Goldfajn and Valdés (1997) develop a formal model of how a shock to one country can cause financial intermediaries to liquidate loans to other countries.
productivity growth, legislation increasing labor market rigidities, higher corporate taxes, or higher interest rates—this could improve the relative competitiveness of other countries’ exports and generate a positive shock to other countries’ asset markets, so that α2<0.
Even the sign of the coefficient on Import Demand is not clear-cut. In many cases, negative asset market returns in the large country reflect negative news about earnings prospects for domestic firms and reduced expectations for economic growth. This could indicate decreased demand for imports and therefore cause negative returns in other countries that export to the large country, so that α1>0. There is news, however, that could generate negative market movements in
the large country, but not signify any changes in expectations about real variables such as growth or import demand. There is also news that would cause negative returns in the large economy, but simultaneously increase the country’s demand for imports. For example, tariff reductions in the large economy might hurt earnings prospects of domestic firms (causing negative asset market returns in the large economy), but increase the ability of other countries to import into the large economy (causing positive returns in other countries), so that α1<0. Therefore, the signs of each
of the coefficient estimates for the bilateral linkage variables in equations (2) and (2′) are a priori indeterminate, and only empirical analysis will be able to establish the importance and direction of these bilateral linkages in the international transmission of asset market movements.
A final issue with the estimates of equations (1) and (2) or (2′) is that when coefficients are compared across different periods, changes in market volatility across periods will bias estimates of cross-country comovement.13 For example, if stock market volatility in countries i
and c is higher in period z than period y, than holding all else equal, c iz
β
>
c iyβ , even if the cross-market relation between i and c is constant in the two periods. To test if this is a problem, we calculate the average volatility in each market over each period. Volatility fluctuates across individual years, especially in stock markets. For example, the average variance of local currency stock market returns reaches a peak of 0.25 in 1998, and a low of 0.13 in 1996. Average market volatility across longer periods, however, is fairly constant. For example, the average variance in local currency stock market returns between 1991-1995 is 0.12, and between 1996-2000 is 0.14. The average variance in local currency bond market returns is 0.01 between 1994-97 as well in 1998-2000. Therefore, in the following analysis when we compare coefficient estimates across periods, we focus on comparisons across longer periods of 3-5 years (based on data availability) instead of across individual years, although we continue to report both sets of estimates.
IV. Data
In order to estimate the role of different global and bilateral linkages, we compile data from a number of sources. The data used to estimate the factor model of returns in equation (1) was compiled from DataStream, although many of the individual data series were based on different original sources that are incorporated into DataStream. Asset returns (Rit) are measured by weekly stock returns or weekly bond returns, both measured in either U.S. dollars or local currency.14
Stock returns are based on stock indices compiled by DataStream, which are weighted to be representative of all major markets in the given country. The bond data for developed countries is based on the total country return indices compiled by Morgan Stanley Capital International (MSCI) for 7-10 year bonds. The bond data for emerging markets is based on the EMBI Global total country return indices compiled by JPMorgan.15
The global, sectoral, and cross-country factors in the factor model of returns are also based on data series reported in DataStream.16 In our base estimates, we include four global
factors: global interest rates, oil prices, gold prices, and commodity prices. All factors are calculated as changes or returns for the relevant price. Global interest rates are calculated as the principal component from overnight discount rates in the U.S., U.K., and Japan.17 Oil prices are
the current dollar prices per barrel for Brent oil, calculated as freight-on-board. Gold prices are the prices of gold bullion in $/oz on the London Bullion Market. Gold prices are included as a global factor in order to capture any changes in global risk aversion. Commodity prices are an index calculated by the Economist based on U.S. dollar prices of a large basket of commodities. The sectoral factors are weekly returns based on the Morgan Stanley Capital International (MSCI) Industrial Sector Indices. These indices are calculated based on U.S. dollar stock returns in 45 countries, with country weights based on country production in the given industrial sector. Appendix A describes the creation of 14 sectoral factors from the original 36 MSCI indices
14 Returns are calculated as logarithmic differences.
15 To the best of our knowledge, identical data for bond returns in emerging markets and developed
countries is not available. The sample of emerging market bonds is: Argentina, Brazil, Chile, China, Colombia, Hungary, Korea, Malaysia, Mexico, Morocco, Philippines, Poland, Turkey, and Venezuela.
16 Certain factors, such as oil or gold prices, could be included as either global or sectoral factors. The
sensitivity analysis examines using different definitions and finds that it has no impact on the key results.
17 Overnight rates for other large European countries, such as Germany or France, are not included in the
calculation of the principal component due to the break in their series in January 1999 with the adoption of the euro. The principal component of the U.S., U.K. and Japanese interest rates accounts for about 75 percent of the variance of the three series, and a regression of this series on the simple average yields an adjusted R2 of 0.99. Moreover, repeating the calculation with the German interest rate (for the time period
available for the relevant period.18 The resulting 14 sectoral factors used to estimate equation (1) are: automobiles, chemicals, consumer goods, electronics, energy, forest products and paper, industrial components, financial, leisure and tourism, merchandising, metals,
telecommunications, textiles and apparel, and transportation.
The final set of factors, the cross-country factors, is returns for the large countries c in the asset market corresponding to the left-hand side variable. In other words, if Rit is U.S. dollar stock returns for country i, then f is U.S. dollar stock returns for country c. For the countries indexed tc by c, we include the five largest countries in the world as ranked by GDP measured in U.S. dollars at either the start or end of the sample period (1985 or 2000).19 These 5 large countries c
are: France, Germany, Japan, the U.K., and U.S.
For the second-stage regressions, when we estimate the cross-country factor loadings as a function of specific bilateral linkages in equations (2) or (2′), we construct a dataset from several sources. The GDP data used as a denominator for many of these statistics is taken from the World Bank’s World Development Indicators (and reported in U.S. dollars). The trade data used to calculate Import Demandc
i and Trade Competitionci is from the Statistics’ Canada database, accessed through the Worldview Trade Analyzer service. This database reports bilateral trade flows between most countries in the world by 4-digit SITC codes.20 More specifically, Import Demandc
i is measured as imports into country c from country i as a share of country i GDP:
i c i c i GDPΙmp Demand Import = , (3) where Impc
i is total imports into large-country c from country i, and GDPi is GDP for country i. All variables are measured in U.S. dollars.
The second cross-country linkage variable included in equations (2) and (2′), Trade Competitionc
i, is a weighted product of two terms. The first term is exports from country c in a given industry as a share of world exports in that industry. This term captures how important exports from country c are to the industry, and therefore the potential impact of shocks to country
18 As discussed in the sensitivity analysis, we also include each of the 36 MSCI sectoral indices as
independent sectoral factors. Including such a large number of factors, however, severally limits the degrees of freedom for the analysis. Moreover, some of these more disaggregated factors are even more highly correlated with the global factors and/or individual country factors.
19 We only include 5 countries due to data limitations. More specifically, the direct investment data is not
c on the industry as a whole. The second term is total exports from country i in the same industry, as a share of country i's GDP. This term captures the importance of each industry to country i. Finally, the products of these two terms are summed across all four-digit industries for each pair of countries i and c, and then weighted by the maximum calculated value (and multiplied by 100). This creates an index that can take values from 0 to 100. In other words, Trade Competitionc
i is calculated as: ∑ = k i i k W W k W c k W tition TradeCompe c i GDP Exp Exp Exp Max n Competitio Trade , , , * 100 (4) where Expc
W,k is exports from large-country c to every other country in the world (W) in industry
k; ExpW
W,k is exports from every country in the world to every other country in the world (i.e. total global exports) in industry k; Expi
W,k is exports from country i to every other country in the world in industry k; GDPi is GDP for country i; and MaxTradeCompetition is the maximum value of the product in parentheses for every country pair in the sample. All variables continue to be measured in U.S. dollars. The k industries are about 1000 4-digit SITC groups.
It is worth noting that this trade competition variable in equation (4) is a substantial improvement from that used in earlier work.21 Previous studies generally attempted to measure
trade competition by examining aggregate trade flows to common markets. This measure often misclassified countries as direct competitors if the two countries were highly dependent on a common market, even if the two countries did not directly compete in any specific industries. For example, if a high proportion of Saudi Arabia's oil and of Brazil's coffee goes to the same third market, Saudi Arabia and Brazil would have been classified as direct competitors. By focusing on trade in specific industries, instead of aggregate trade flows to common countries, this paper's statistics should provide more accurate measures of trade competition.
The data used to calculate the third cross-country linkage variable included in equations (2) and (2′), Bank Lendingc
i is based on lending data reported by the Bank of International Settlements (BIS). Bank Lendingc
i is measured as the total stock of bank lending from country c in country i as a share of country i GDP.22 The data used to calculate the final global linkage
20 The Worldview online database has the advantage of reporting more up-to-date information and longer
time series. See http://www.trademeasures.com/MSIEIndex.html for more information.
21 Forbes (2002) is the only other paper (to the best of our knowledge) to calculate a trade competition
variable based on 4-digit SITC information.
22 More specifically, the total stock of bank lending is the consolidated international claims of BIS
variable, Foreign Investmentci, is based on the OECD’s International Direct Investment Statistics
Yearbook.23 Foreign Investmentc
i is measured as the total stock of foreign investment from country c in country i as a share of country i GDP. These two global linkage variables can be written as: i c i c i LendingGDP Lending Bank = , (5) i c i c i InvestmentGDP Investment Foreign = , (6) where Lendingc
i is total bank lending from large-country c to country i; Investmentci is total foreign direct investment from large-country c to country i; and GDPi is GDP for country i. All variables are measured in U.S. dollars.24 It is worth noting that Foreign Investment does not
include “portfolio investment” and smaller investment flows across countries.25
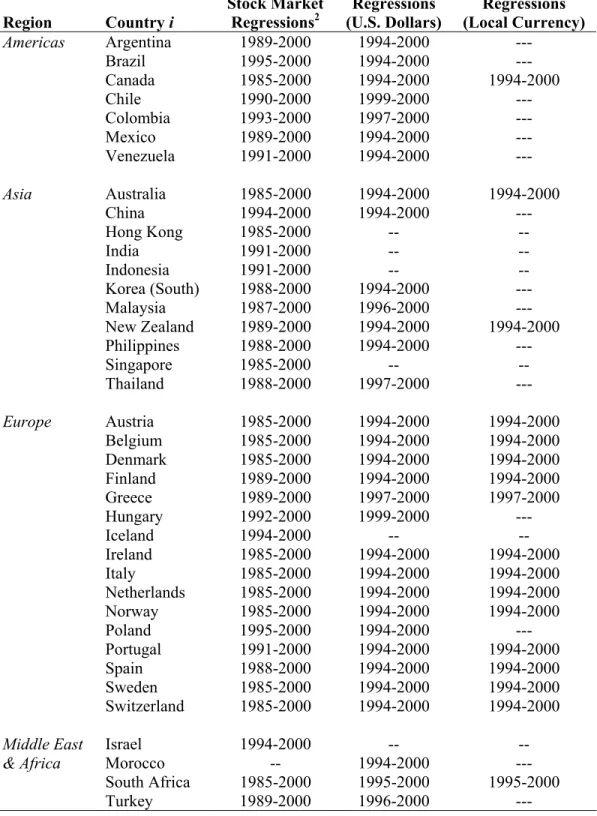
Combining the information for these four bilateral linkage variables defined in equations (3) through (6) with the weekly stock and bond return information yields a data set with
information for 38 countries i and 5 large countries c from 1985 through 2000. Information is not available for the full period for many countries—often because stock or bond markets did not exist at the start of the period. Table 1 reports the full sample of countries, by region, as well as the years for which data is available for the factor model regressions for different asset markets. Appendix B reports the correlation matrix for each of the 23 factors included in the factor model of stock returns.26 As expected, there is a high correlation between several of the sectoral indices and the Japanese and U.S. cross-country factors, suggesting that it may be difficult to isolate the direct impact of shocks to the U.S. and Japan on other countries from the impact of shocks to the U.S. and Japan working through these sectors. On a more positive note, the correlations between
23 More specifically, we use the 2001 CD-ROM. The data series is the total outward direct investment
position reported by each OECD country into other countries in the world.
24 Direct investment data is reported in local currency values, which are then converted to U.S. dollar
values using end-of-period U.S. dollar exchange rates, as also reported in the International Direct Investment Statistics Yearbook CD-ROM.
25 More specifically, direct investment is the “lasting interest of a resident entity in one economy (direct
investor) in an entity resident in another economy (direct investment enterprise).” Direct investment is generally defined as when a direct investor, who is resident in another economy, owns 10 percent or more of the ordinary shares, voting power, or equivalent, of a direct investment enterprise. Bank lending is generally classified as portfolio investment and not as direct investment. Also, the foreign investment data is based on statistics reported by each national government. Therefore, although the OECD attempts to ensure the same definitions and standards across countries, different reporting standards persist.
the 4 global factors and the cross-country factors are extremely low, suggesting that
multicollinearity between the global and cross-country factors should not affect estimates of the cross-country factor loadings.
As discussed in Sections I and II, many of the bilateral linkage variables used in the second-stage regressions and defined in equations (3) through (6) have not been widely used (and never used simultaneously) in previous work. Therefore, Tables 2 and 3 provide additional information on these four variables. The top panel of Table 2 reports means and standard deviations for the full period of time, as well as for several different sub-periods. Most of the trade and foreign investment linkages increased over the three periods from 1986 through 2000. Bank lending, however, fell substantially between 1986-90 and 1991-95. This undoubtedly reflects the decreased bank lending to emerging markets after the 1980’s debt crisis. Despite this decline, average bank lending from the 5 larger countries to smaller countries (as a share of smaller country GDP) is still greater than direct investment between the same sets of countries, although this gap has been closing over time.
The bottom panels of Table 2 report correlations between the 4 bilateral linkage variables, for the full period as well as different sub-periods (based on annual values). The two trade variables (Import Demand and Trade Competition) are the most highly correlated—with an average correlation of 66% over the full period from 1986-2000. Foreign Investment also tends to be highly correlated with the trade variables. Bank Lending tends to be the least correlated with the other variables—with a correlation of only 22% with Import Demand in the full period. Most of the correlations between the different cross-country linkage variables are fairly stable across the different sub-periods. The only exception is Bank Lending, whose correlation with the other three variables falls over time. For example, the correlation between Bank Lending and Foreign Investment falls from 67% in 1986-90, to 57% in 1991-95, to 26% in 1996-2000.
To better understand how these bilateral linkages fluctuate across different countries and periods, Table 3 reports a selection of values for the U.S. and Japan (two of the larger countries indexed by c) and a selection of 10 smaller countries indexed by i in 1985 and 2000. Most of the patterns are not surprising. For example, all four of the bilateral linkage variables are substantially lower for economies traditionally considered to be less integrated with the global economy, such as China and India. Import Demand for the U.S. and Mexico and Canada is very large and increased substantially between 1985 and 2000. Import Demand for many smaller Asian countries is fairly large for both Japan and the U.S. For some of these economies, such as
26 The table reports correlations for the full period when the cross-country factors are expressed in local
Malaysia and Thailand, reliance on imports into the U.S. increased substantially between 1985 and 2000, so that the U.S. is currently a more important export market than nearby Japan. Countries that produce more high-tech goods, such as Korea and Malaysia, tend to have higher values of Trade Competition with the U.S. and Japan. Bank Lending from both Japan and the U.S. has decreased between 1985 and 2000, as has Foreign Investment from Japan. In sharp contrast, many countries’ reliance on Foreign Investment from the U.S. has increased over time.
V. Estimation Results: Average Stock Market Linkages from 1986-2000 A. Factor Model of Stock Returns
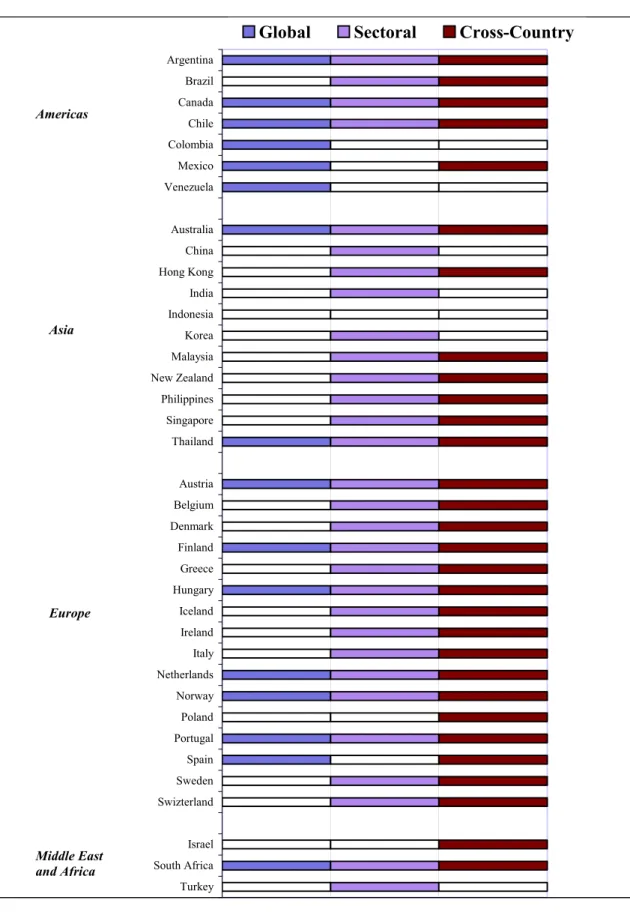
To estimate the relative importance of different global linkages, we begin by using the data set described in Section IV to estimate equation (1) over the full sample from 1986-2000.27 We begin by including the full set of 4 global factors, 14 sectoral factors, and 5 cross-country factors. We also begin by focusing on returns (Rit) in stock markets, due to greater data availability (as shown in Table 1). Results based on bond returns are discussed in Section VII. Figure 1 shows results from F-tests of the joint significance of the global, sectoral, and cross-country factors when the model is estimated using local currency stock returns. Results for U.S. dollar stock returns are similar. Colored bars indicate that the relevant group of factors are jointly significant for each country i. Table 4 reports the corresponding R2’s for the full regressions, and the coefficient
estimates and standard errors for each of the 5 cross-country factor loadings (theβic’s).
The results in Figure 1 and Table 4 show a number of patterns. First, the global, sectoral and cross-country factors are each often jointly significant, although the global factors are less often significant than the other two sets of factors. For example, out of the 37 regressions, the global factors are jointly significant at the 10 percent level in 16 cases, and the sectoral and cross-country factors are each significant in 30 cases. Second, the relative importance of the three different sets of factors fluctuates across regions. For example, the global factors are more often significant in the Americas, but rarely in Asia. The sectoral factors are most consistently significant in Asia (although still important in all regions). The cross-country factors are most consistently significant in Europe (although also still important in all regions).
Third, estimates of the individual cross-country factor loadings also tend to vary by region, with the major economy (or economies) in each region tending to be the most important for nearby markets. For example, the U.S. factor is most often positive and significant in the
Americas, and the French, German and U.K. factors are most often positive and significant in Europe. Fourth, many of the cross-country factors follow intuitive patterns based on cultural similarities or colonial origin. For example, the U.K. factor is large and significant in Australia, Canada, Hong Kong, New Zealand, Singapore, and South Africa, and the U.S. factor is large and significant in Israel. Fifth, the magnitude of the estimates suggests that the impact of stock market movements in large economies on small economies can be large. For example, the 0.87
coefficient on the U.S. factor for Argentina suggests that a 10% return in the U.S. stock market is correlated with an 8.7% return in the Argentine market.
A final pattern that emerges from Table 4 is the relative unimportance of the U.S. and Japanese factors for many countries. More specifically, the U.S. factor is never positive and significant (even at the 10% level) in the Asian markets, and only occasionally significant in markets outside of the Americas. The Japanese factor is also rarely significant, and Singapore is the only country in all of Asia for which the Japanese factor is significant. These counterintuitive results suggest that the concerns raised in Sections III and IV and supported by the correlation matrix in Appendix B may be valid. The high correlation between the Japanese/U.S. factors and the sectoral factors could cause imprecise estimates of the cross-country factor loadings. In other words, the sectoral factors may be capturing much of the direct cross-country effect of shocks to the Japanese and U.S. markets on other countries.
In order to test for this effect, we reestimate equation (1) but exclude the sectoral factors (while continuing to include the global factors). Resulting estimates of the cross-country factor loadings (continuing to focus on local currency returns) are reported in Table 5. Although many of the estimates and patterns are similar to those in Table 4, the estimated cross-country factor loadings for Japan and the U.S. change as predicted. More specifically, the estimated Japanese and U.S. factor loadings are now not only consistently positive, but often highly significant. The Japanese factor loading is now significant (at the 10% level) for 9 of the 11 Asian countries. The U.S. factor loading is also now more frequently significant in Asia, as well as in Europe. This change is even more striking for the estimates based on U.S. dollars (not reported), in which the U.S. factor is now significant for 7 of the 11 Asian countries. In fact, the cross-country factor loadings for all five large countries are now jointly significant (at the 10% level) for all of the countries in the sample except China and Colombia.
This comparison between Tables 4 and 5 of estimates of the factor model in equation (1) suggest that there are advantages and disadvantages to including the sectoral factors when
27 We focus on the period 1986-2000 instead of 1985-2000 since some of the explanatory variables in the
estimating cross-country linkages. On one hand, theory suggests that in order to obtain unbiased estimates of cross-country factor loadings, it is necessary to control for both global and sectoral shocks. On the other hand, the high correlation between the sectoral factors and cross-country factors could cause much of the direct impact of shocks to large countries on other countries to be captured in estimates of the sectoral loadings. Therefore, in the discussion and estimates in the remainder of this paper, we estimate the factor model both with and without the sectoral factors. We have also estimated each of the specifications with and without the global factors, but since this has no significant impact on the key results, we leave these results for the sensitivity tests.
As an extension to Tables 4 and 5 we re-estimate the factor model, both with and without the sectoral factors, but instead of estimating a cross-section for the full period, we estimate the model separately for each year between 1986-2000. More specifically, we estimate equation (1) separately for each one-year period for each country i. The estimated global, sectoral, and cross-country factor loadings fluctuate across individual years, although they follow the general patterns discussed above. These extensive coefficient estimates are not reported due to space constraints, but are used in the later part of Section B to estimate the panel model of how different bilateral trade and financial linkages affect the estimated cross-country factor loadings.
B. Decomposition of Cross-country Linkages
Before decomposing the estimated cross-country factor loadings into specific bilateral linkages, we examine the time-series characteristics of the variables to test for nonstationarity. There is a strong likelihood that some of the variables may drift upwards over time as global integration has increased. The short time series and wide panel nature of the dataset described in Section IV, however, complicate the standard unit root tests. Therefore, we use two different approaches to examine the time-series characteristics of the data: conduct unit root tests series-by-series using the univariate test of Elliott et al. (1996), and use the panel unit root test of Breitung and Meyer (1994), which can easily be applied to panels with a large cross-section and short time dimension.
These tests and their outcomes are discussed in detail in Appendix C. The results suggest that all of the variables are stationary except Foreign Investment. The evidence of nonstationarity in Foreign Investment is not surprising given the increase in foreign direct investment
documented in the top panel of Table 2. Consequently, the subsequent analysis uses the first difference (instead of the level) of foreign direct investment in order to estimate equations (2) and (2′).28 This series of results also suggests that inference based on OLS estimates is accurate and it
28 The sensitivity analysis also examines the impact of using levels instead of first differences for Foreign
is not necessary to use panel-cointegration methods.29 To be conservative, however, we report heteroscedasticity and serial-correlation robust standard errors for each of the estimates.
Next, we use the estimated cross-country factor loadings to estimate equation (2) and decompose these cross-country linkages into specific bilateral linkages. The top of Table 6 reports coefficient estimates when the dependent variables are the factor loadings from equation (1) based on local currency stock returns averaged over the full period, and Table 7 reports corresponding estimates based on U.S. dollar returns.30 The left side of each table shows results
when the factor model is estimated with the sectoral factors (as in Table 4), while the right side of the table excludes the sectoral factors (as in Table 5). As discussed in Section II, however, there is an extensive literature examining how integration with the global economy and capital controls can affect stock market returns and cross-market comovement. Therefore, we also estimate each specification including the Chinn and Ito (2002) measure of capital account openness in each country i.31 This statistic is calculated as a standardized principal component of four IMF dummy
variables measuring different types of external account restrictions, with an adjustment for the length of time that the capital controls were in place.32 This statistic is described in more detail in
Appendix D, and a higher value indicates greater capital account openness.
Although the results at the top of Tables 6 and 7 vary across specifications, the most consistent finding is that the coefficient on Import Demand is positive and highly significant (at the 5% level) in 6 of the 8 models. This suggests that on average between 1986 and 2000, direct trade may have been the most important bilateral linkage determining how shocks to the world’s largest economies affected other stock markets. The estimated coefficients on Bank Lending are positive, although usually insignificant, and on Trade Competition are negative, with fluctuating significance. The coefficients on Foreign Investment fluctuate in sign and are never significant at the 5% level. The explanatory power of these regressions is fairly low, with only 3-7% of the variance explained in the models including the sectoral factors, and a slightly better 10-14% of the variance explained in the models excluding the sectoral factors.33
29 See for instance Pedroni (1999), or Mark and Sul (2001).
30 The explanatory variables are each also averaged across the full period from 1986 to 2000. More
specifically, the flow variables (Import Demand and Trade Competition) are measured for each year from 1986 through 2000, while the stock variables (Bank Lending and Foreign Investment) are measured at the start of each year (or end of the previous year). Averages are then calculated based on these annual values.
31 We assume that financial markets in each of the large countries c have limited capital account restrictions
and are fairly well integrated with global financial markets.
32 The sensitivity analysis reports results using other measures of capital controls. These other measures,
however, are only available for a much more limited selection of countries.
33 Many models attempting to explain stock market movements have a low degree of explanatory power
As an extension to these results, instead of using variables averaged over the entire 15-year period from 1986-2000, we use the estimates of the annual cross-country factor loadings discussed at the end of Section IV.A to estimate the panel regression in equation (2′). We also include period dummy variables for each year (excluding the year 2000). Estimates are reported in Panel B of Tables 6 and 7. Despite the substantial increase in the number of observations, the regressions have an even lower degree of explanatory power than those based on the averaged data in Panel A. Estimates also continue to reflect a general lack of consistency across
specifications, with not only fluctuating significance, but also fluctuating signs.
VI. Estimation Results: Changes in Global Linkages in Stock Markets Over Time
One problem with the results reported in Section V, and which could explain the low explanatory power of the models, is that the specification imposes the constraint that each of the coefficients and their underlying relationships are constant between 1986 and 2000. Global linkages and the determinants of stock market returns, however, may have changed over this sample period. As discussed in Section II, trends in the TMT sector could have changed the importance of sectoral factors relative to other factors in the late 1990’s. Or, as also discussed in Section II, many emerging markets have only recently become integrated with global financial markets, causing significant changes in their relationships with other countries. Therefore, this section examines if the average results for the full sample period reported above mask important changes over time.
A. Factor Model of Stock Returns
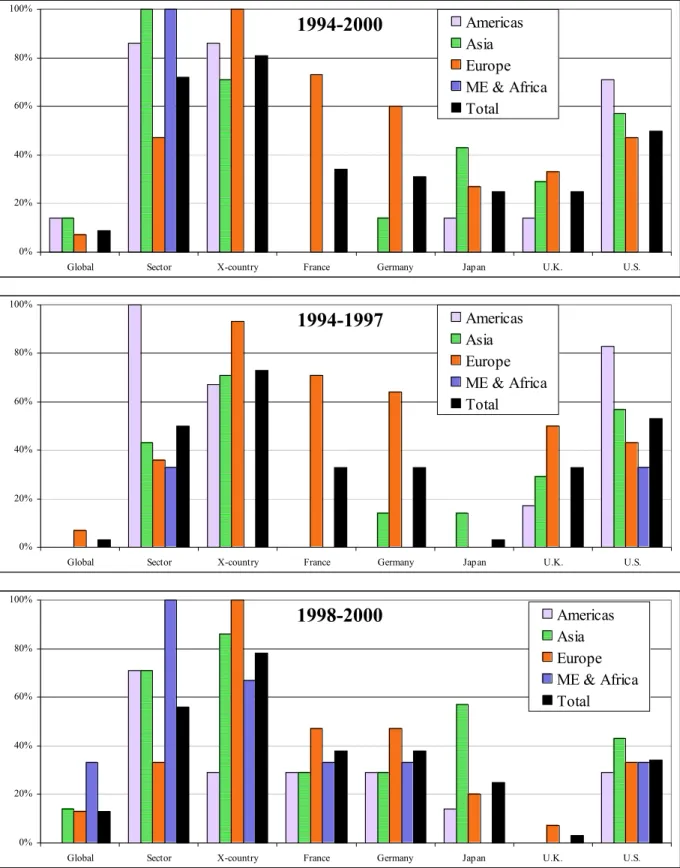
To test if the importance of the global, sectoral, and cross-country factors has changed between 1986 and 2000, we divide the full sample period into 3 sub-periods of equal length: 1986-1990, 1991-1995, and 1996-2000. Then we estimate equation (1), for each five-year period. Figure 2 summarizes the key results by reporting the percent of countries within each region and for the full sample for which the relevant factor(s) are significant (at the 5% level). More specifically, the left of the figure reports the percent of countries for which the full set of global, sectoral, or cross-country factors are jointly significant, and the right side of the figure reports the percent of countries for which the 5 cross-country betas are individually significant.34
Figure 2 shows a number of results. First, the cross-country factors continue to be highly significant. Moreover, their importance appears to have fallen from 1986-1990 to 1991-95, and
34 Results when the model is estimated without sectoral factors, or using U.S. dollar stock returns (instead
then increased substantially from 1991-1995 to 1996-2000.35 This pattern is especially strong in the Americas. Second, the sectoral factors appear to be more important in the later period from 1996-2000 than in early periods, especially in Asia. This could partially reflect the technology, media and telecommunications bubble discussed in Section II.
Third, the relative importance of the individual cross-country factors has changed across time. For example, the U.S. factor is significant more than twice as often in the latest period from 1996-2000 than in the earliest period from 1986-1990. In sharp contrast, the cases in which the Japanese factor is significant fell by more than half in the same period, with a particularly dramatic decline for Europe and the Americas. The importance of the U.K. factor also fell between 1986-1990 and 1996-2000 in most regions. These changes in the relative importance of the largest economies, and especially the U.S. versus Japan, undoubtedly reflect the stronger growth in the U.S. economy over the later half of the 1990’s and its increased importance as an export market for countries around the world.
B. Decomposition of Cross-Country Linkages
Next, we use the estimated cross-country factor loadings from Section A to estimate the
importance of the four real and financial linkage variables during the different five-year periods between 1986 and 2000. Results based on local currency estimates are reported in the middle and bottom of Table 6, and results based on U.S. dollar estimates are reported in Table 7. For each table, Panel C reports results based on average values during each of the five-year periods (i.e., equation (2)), and Panel D reports panel results using annual data for each of the five-year periods (i.e., equation (2′)), which include annual period dummy variables.
The coefficient estimates indicate that there were substantial changes in the importance of the bilateral linkage variables in the different sub-periods. In the earlier two periods (from 1986-90 and 1991-95), most of the coefficient estimates are insignificant, and of those that are significant, none are robust across even half the specifications. Not only does the coefficient significance vary across specifications, but even the estimated signs show a remarkable lack of stability. Not surprisingly, the proportion of the variance explained by the models in both of these periods is very low.
Estimates during the later period from 1996-2000, however, reflect very different patterns. There is a dramatic increase in the model’s explanatory power, with the proportion of
35 This pattern agrees with the results in Brooks and Del Negro (2002a) and (2003), which examine
firm-level stock returns and find that the importance of global effects (which include what we call cross-country effects) falls from the late 1980’s to early 1990’s, and then increases in the late 1990’s.
the variance explained by the period-averaged models now increasing to 12-21%. There is also a substantial increase in the consistency of some of the estimates across the different specifications. The most noteworthy change is that the coefficient on Import Demand is always positive and significant (usually at the 5% level). The coefficients on Bank Lending are also usually positive and significant, and the coefficients on Trade Competition are negative and usually significant. The estimates for Foreign Investment are the only ones that continue to be generally insignificant with fluctuating signs.
These results indicate that in the later half of the 1990’s bilateral linkages became more important determinants of how shocks to large financial markets are transmitted to smaller countries around the world. In particular, direct trade appears to be the most consistently significant bilateral linkage. One surprising result is that foreign investment, despite its rapid growth in recent years, does not appear to be a significant determinant of bilateral linkages in financial markets. This could partially be caused by noise in the bilateral data on foreign investment (as discussed in Section IV). If Foreign Investment is less accurately measured than the other bilateral linkage variables and any measurement error is not systematic, this could increase standard errors and make it more difficult for foreign investment to appear as a significant determinant of cross-country linkages.
The coefficient estimates also suggest that not only are bilateral linkages other than foreign direct investment significant determinants of stock market comovements, but that the magnitude of this impact can be large. For example, consider Chile, which is in the process of finalizing a free-trade agreement with the U.S. From 1996-2000, Import Demand for Chile with the U.S. was 4.0%, and the estimated U.S. cross-country factor loading was 0.26.36 Then assume
that Chile’s Import Demand variable increased to 25.1%, which is the value for Mexico with the U.S. from 1996-2000. Holding everything else constant, the U.S. factor loading for Chile would be predicted to increase to 0.62.37 A 10% return in the U.S. stock market, which previously would have been correlated with a 2.6% return in the Chilean market, would now be correlated with a 6.2% return in the Chilean market. These calculations are obviously only a rough approximation, but they do suggest that changes in bilateral linkages, and especially bilateral trade flows, can have large effects on how asset market movements are transmitted internationally.
36 Based on local currency stock market returns when equation (1) controls for global and cross-country
factors, but not sectoral factors.
37 This uses the estimated coefficient of 1.699 in Panel C of Table 6 (which is the specification including
the capital control variable). As shown in the sensitivity analysis, this is close to the average coefficient estimate for this variable, using a wide variety of model specifications.