HAL Id: hal-00541405
https://hal.archives-ouvertes.fr/hal-00541405
Submitted on 30 Nov 2010HAL is a multi-disciplinary open access archive for the deposit and dissemination of sci-entific research documents, whether they are pub-lished or not. The documents may come from teaching and research institutions in France or abroad, or from public or private research centers.
L’archive ouverte pluridisciplinaire HAL, est destinée au dépôt et à la diffusion de documents scientifiques de niveau recherche, publiés ou non, émanant des établissements d’enseignement et de recherche français ou étrangers, des laboratoires publics ou privés.
Simultaneous Measurements of Pressure, Flow and
Sound During Trumpet Playing
Vincent Fréour, René Caussé, Isabelle Cossette
To cite this version:
Vincent Fréour, René Caussé, Isabelle Cossette. Simultaneous Measurements of Pressure, Flow and Sound During Trumpet Playing. 10ème Congrès Français d’Acoustique, Apr 2010, Lyon, France. �hal-00541405�
10ème Congrès Français d'Acoustique
Lyon, 12-16 Avril 2010Simultaneous Measurements of Pressure, Flow
and Sound during
Trumpet Playing.
V. Fréour
1, R. Caussé
2, and I. Cossette
11Music Research Department, Schulich School of Music/CIRMMT, McGill University, 555 Sherbrooke Street West, QC H3A, 1E3 Montreal, Canada 2Sciences et Technologies de la Musique et du Son, 1 Place Igor Stravinsky 75004 Paris
Sound production during trumpet playing implies the interaction between the performer and his instrument which requires the coordination between physiological and physical parameters under the performer's direct control. For brass instruments, some of the main issues rely on the estimation of specific parameters such as mouth pressure, lip mechanical properties and driving volume flow. A few studies [1,2,4,5,6] estimated these parameters but the measurements were not simultaneous. Their results are partial and the effect on sound quality is not addressed. In respiratory mechanics, the standard methods to measure lung volumes and flows usually require the subject to breathe through a mouthpiece and a measuring device (flowmeter) or to have his/her body constrained in an unnatural posture (Head-out whole body plethysmography) [2]. Optoelectronic Plethysmograph (OEP) is an appropriate method to estimate performers’ respiratory volumes as a function of time during playing [3]. IRCAM Paris adapted an embedded air velocity sensor on the tuning slide of a Yamaha Bb trumpet. The combination of both set-ups gives simultaneous data of operating volumes and flows, radiated sound and mouth static pressure during advanced trumpet playing (Respiratory mechanics lab-CIRMMT, Schulich School of Music, McGill University and Instrumental Acoustics laboratory, IRCAM). It also allows to compare both processes and to evaluate their efficiency according to specific musical tasks. Previous studies showed that sound frequency and amplitude increase with pressure and flow. Average flows reported range from 180 to 630 ml/s [1,2,4,5, 6]. Preliminary analysis of our data showed peak flows up to 950 ml/s during low fortissimo notes. Correlations between these physical control parameters and some sound characteristics (pitch, sound pressure level, noisiness) are demonstrated.
1
Introduction
Characterization of trumpet performer's control parameters provides relevant information for modelization and development of pedagogical tools. Growing interest has been focusing on aerodynamic parameters involving control of intra-oral pressure and expiratory air flow associated with musical tasks. Previous works focusing on air-flow requirements during wind instruments performance reported flow magnitudes from 0.05 to 1.6 l/s and intra-oral pressures from 330 Pa to 21 kPa [1]. In the case of trumpet, Bouhuys measured air-flows from 200 to 500 ml/s and intra-oral pressures from 4 to 14 kPa. He particularly noticed an increase of intra-oral pressure with pitch and dynamic. Flow was assessed indirectly by using spirometer measurements. Another study [7], making use of a head-out whole body plethysmograph combined with a flow-meter to measure flow at the output of the instrument, concluded that sustained notes require constant intra-oral pressure and flow. An increase of both mouth pressure and air-flow with increase in loudness of the radiated sound was also reported. Other results [5] showed flows going from 100 ml/s to 600 ml/s for trumpet. Although these studies provide an interesting estimation of flow range for trumpet performance, measurement devices used there do not guarantee high accuracy for instantaneous estimation of flow. A more recent work conducted on trumpet players [4] reported intra-oral pressures from 1.7 kPa for a F3 pp to 25 kPa for Bb5 ff.
Nowadays, new technologies that aim at exploring respiratory parameters have emerged. They allow the estimation of respiratory volume variations without constraint and in a non-invasive way. These advantages make this new technology more suitable for measurements on musicians. However, estimation of flows in trumpet performance requires to cope with high pressures in the respiratory system, likely to interfere with the estimation of volume variations.
In this study, we compare the consistency of flow measurements between two techniques: an OptoElectronic Plethysmograph (OEP) making use of a setup of reflective markers set on the chest of the subject and tracked by a motion capture system, and a tachometer embedded in the tuning slide of a Bb trumpet. Measurements were conducted simultaneously to allow comparison between both methods. Intra-oral pressure and radiated sound were recorded as well. Results show optimal accordance between both systems according to embouchure resistance and significant discrepancy for most tasks involving high intra-oral pressures and low air-flows. Results will be discussed in perspective with physical and physiological phenomena such as air compressibility, jet turbulence and potential occurrence of vascular blood shift.
2
Materials and methods
2.1 Experimental set-up
Recordings include measurements of chest wall volumes (Vcw), air-flows (Q1 and Q2), intra-oral pressure
(Pm) and radiated sound. Chest wall volume measurements by OptoElectronic Plethysmography (OEP, Smart System,
BTS) encompass three compartments: the lung, the diaphragm-apposed parts of the rib cage (Vrc,p and Vrc,a,
respectively) and the abdomen (Vab).
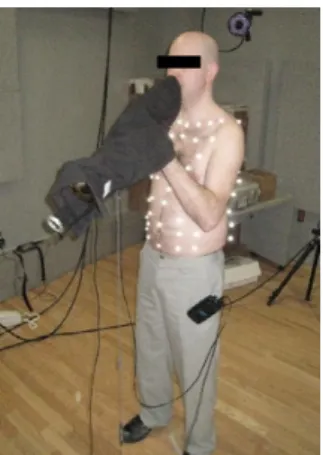
OEP measurements. The OEP consists of 9 infrared
video cameras (6 in front and 3 behind the subject at a distance of 1.4 to 2.2 m) tracking 89 hemispherical 10 mm diameter reflective markers (Fig. 1). These were applied to the area of the chest wall, front and back in seven rows between the clavicle and the iliac crest [8]. The three chest wall volumes are derived from the 3D coordinates of the 89 markers and the fitting of an appropriate mesh. The volume variations are calculated using Gauss’ theorem as described by Cala et al. [9]. The data from the OEP was recorded at a sample frequency of 60 Hz. “Instantaneous” flow (Q) is calculated from the OEP signal by applying a differentiation on volume tracing with a time step of 0.33 sec (20 samples). Linear interpolation is then performed between derived values of flow. In order to reduce the influence of air-compressibility in flow estimation, we calculate air-flow Q2 by applying equation (1), assuming an homogeneous repartition of pressures from the lungs to the mouth of the player.
Q2=−Q−
1
ρ.c
2.[
Pm.QVcw
dPm
dt
]
(1)with ρ the air density (1.2 kg/m3) and c the air-velocity (340 m/s).
Figure 1: Subject 3 with the 89 reflective markers during measurements. The trumpet is covered by a black bag to
avoid reflective perturbations from the instrument.
Figure 2: Bb Yamaha trumpet used for experiments. Pressure transducer, tachometer and studio microphone are
fixed on the instrument.
Tachometer measurements. A second measurement of
flow (Q1) is performed simultaneously using a tachometer (air velocity sensor) embedded on the tuning slide of the trumpet (Fig. 2). After calibration, the output signal provides a value of flow travelling through the sensor.
Intra-oral pressure. Intra-oral pressure (Pm) was
measured with a catheter (internal diameter: 1.4 mm) inserted at the corner of the mouth during playing and connected to a pressure transducer (± 300 cmH2O,
UT-PDP-300, Scireq Inc.). Pm was stored simultaneously on a
PC via the OEP system at a sample frequency of 960 Hz and through a National Acquisition card and Matlab at a sample rate of 25600Hz.
Radiated sound. Sound was recorded at 25600Hz with a
studio microphone (AMT P800) fixed about 10cm from the bell of the trumpet. We then calculated the “instantaneous” energy of the output signal on 256 sample size windows and took the logarithm of the result. This estimation of dynamics is not calibrated but allows comparison between tasks and subjects since amplifier gains were fixed all along the study.
Averaged values. For every note, we apply a rectangular
window and calculate the mean of intra-oral pressure, flow measured by the tachometer, and radiated sound energy. Averaged OEP flow is calculated from the volume trace with the following equation (2):
Q2=
V t1 −V t2
t2−t1
(2)with t2-t1which is the size of the window.
For each trial, the same window is applied to all signals. The window location and size are chosen according to pressure and flow curves, trying to match with the cleanest sustain part of all signals.
2.2 Experimental protocol
Results obtained for 3 players are reported in this study. Subjects all have a trumpet performance level equivalent to a first year of a master’s degree or higher. All players performed on the same Yamaha Bb trumpet and used their own mouthpiece. They were asked to spontaneously perform tones Bb3 (233 Hz), D5 (587 Hz) and Bb5 (932 Hz) at different intensities (pp, mf, ff) without specific instructions. Prior to trumpet playing, the subjects breathed quietly (qb) and performed two vital capacity (VC) manoeuvres recorded by the OEP system.
3
Results
3.1 Averaged intra-oral pressures and flows
Figure 3 shows the results obtained for subject 2 playing a Bb3 at three different dynamics (pp, mf and ff). Averaged intra-oral pressures reach, respectively, 1.27 kPa, 2.63 kPa and 2.67 kPa. Averaged flows, measured by the tachometer, reach respectively, 134.8 ml/s, 459.5 ml/s and 625.6 ml/s and averaged OEP flows, derived from the volume trace, respectively 125.1 ml/s, 379.5 ml/s and 470.5 ml/s. The difference between Q1 and Q2 appears to increase with dynamics (9.7 ml/s for pp, 79.9 ml/s for mf, 155.1 ml/s for
Figure 3: Bb3 played pp, mf and ff by subject 2; (from top to bottom) radiated sound waveform, intra-oral pressure,
flow measured by the flow-meter, chest wall volumes measured by OEP, flow derived from chest wall volume
variation.
Figure 4: Bb5 played pp, mf and ff by subject 2; (from top to bottom) radiated sound waveform, intra-oral pressure,
flow measured by the flow-meter, chest wall volumes measured by OEP, flow derived from chest wall volume
variation.
Figure 4 shows the results obtained for subject 2 playing a Bb5 at three different dynamics (pp, mf and ff). By performing the same average analysis, we obtain the following results: intra-oral pressure averages reach respectively 5.22 kPa, 7.75 kPa and 9.07 kPa. Averaged flows, measured by the tachometer, reach respectively 28 ml/s, 123.6 ml/s and 214.1 ml/s and averaged OEP flows, derived from volume trace, respectively 120.8 ml/s, 176.3 ml/s and 212.8 ml/s. Contrary to the results observed for Bb3, the difference between Q1 and Q2 decreases with dynamics (-92.8 ml/s for pp, -52.7 ml/s for mf, 1.4 ml/s for
ff).
3.2 Characteristics of the tachometer tracings
In the tachometer tracings of figure 3, we observe a delay for pp and mf before reaching a more steady section. This might be due to the low sensitivity of the sensor for small air-flows, as it is the case at the onset of Bb3 pp. The
two last notes (mf and ff), show a clear exponential decay of the signal which is related to the mechanical inertia of the tachometer. From these observations, it seems that the mechanical inertia of the flow-meter has a low-pass filtering effect that tends to absorb flow variations. Therefore, it makes this system less appropriate for transitory and variable conditions.
The same phenomena are observed on the tachometer traces of figure 4. Moreover, an air flow peak appears before the onset of mf and ff Bb5. This results from the player, slightly breathing in through the trumpet, who creates an input flow in the opposite direction that activates the transducer.
3.3 Characteristics of OEP volume trace
During the sustained section of Bb3 pp note, the volume tracing appears to be a quite regular slope (Fig. 3). At the end of the note, the slope increases toward a local minimum. This actually corresponds to a release of air contained in the lungs, after the note has been played and before inhaling for the second note. This last portion corresponds to the large peak at the end of each note on the derived flow trace (Q2). For Bb3 mf and ff, we also see this effect preceded by a small increase of volume that occurs with the decrease of intra-oral pressure. This might be due to air compressibility; decompression of air contained in the lungs is seen by the OEP system as an increase of volume. This effect of air compressibility is particularly obvious on the volume trace of Bb5 (Fig. 6) which requires higher levels of intra-oral pressure and in turn, boosts the effect induced by gas compression. This effect can also be observed at the onset of the note on the OEP flow trace; a large peak appears for each note, right before a more steady state corresponding to the regular slope on the volume curve. Furthermore, the release of the air can be clearly seen on Bb5 OEP flow trace as three large peaks at the end of each note as described previously for Bb3.
3.4 Flow derived from the OEP volume trace
In addition to the large flow peaks mentioned in the previous paragraph, the sustained portion of OEP flow shows important variability. In fact, despite low pass filtering applied to volume recordings, mathematical derivation of volume variations tends to emphasize variations in the derived flow.
Figure 5: Intra-oral pressure (Pm) as function of logarithmic radiated sound energy for three subjects playing Bb3, D5
3.5 Averaged intra-oral pressures along subjects and tasks
Figure 5 represents the 3 subjects' averaged intra-oral pressures as function of a logarithmic scale of radiated sound energy, for Bb3, D5 and Bb5 played at three different dynamics (pp, mf and ff). It is important to notice that the range of dynamics decreases with an increase in pitch. Nevertheless, results show an increase of Pm with both energy and pitch, with minimum value of 1.07 kPa observed for Bb3 subject 3 and higher value of 9.07 kPa for Bb5 subject 2. Furthermore, we observe unexpected results for Bb5 subject 1 (low values of Pm compared to subjects 2 and 3). This error comes either from a twist of the catheter by the teeth of the player, or from the tongue blocking the input of the catheter. It results in an under estimation of Pm that we also observe in D5 subject 3 for the middle dynamic (mf).
3.6 Averaged flow measurements along subjects and tasks
Figures 6, 7 and 8 present averaged flows, respectively for Bb3, D5 and Bb5, from both measurement systems as a function of logarithmic scale of radiated sound energy. Q1 represents flow recorded with the tachometer and Q2, flow derived from the volume variations acquired with the OEP system.
Figure 6: Tachometer flow Q1 and OEP flow Q2 averaged for Bb3 played pp, mf and ff.
Figure 7: Tachometer flow Q1 and OEP flow Q2 averaged for D5 played pp, mf and ff.
Minimum flow (28 ml/s) is recorded for subject 2 playing Bb5 pp and maximum flow (625.6 ml/s) for subject 2 playing Bb3 ff. Note that Q1 (subject3) (Fig. 7), Q1 (subject1) and Q1 (subject3) (Fig. 8) show a null flow for the lower dynamics. This is due to the fact that the tachometer is unable to detect any air-flow signal at such low magnitude. Furthermore, we observe unexpected high value for Q2 subject1 for the smaller dynamic (Fig.8). This possibly reflects either a wrong derivation of volume variations from the OEP system, or a windowing of the OEP volume curve on a section highly influenced by air-compressibility. Moreover, we see that Q1 tends to be greater than Q2 for Bb3 whereas it tends to smaller than Q2 for D5 and Bb5. This corroborates the hypothesis that for higher intra-oral pressures, compressibility of air contained into the lungs might result in an over-estimation of the output flow measured by the OEP system.
Figure 8: Tachometer flow Q1 and OEP flow Q2 averaged for Bb5 played pp, mf and ff.
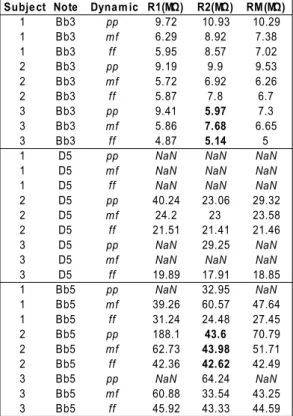
Table 1: Embouchure resistance R1 (calculated from Q1), R2 (calculated from Q2) and RM (calculated from M) for
every subjects and tasks.
Subje ct Note Dynam ic
1 Bb3 pp 9.72 10.93 10.29 1 Bb3 6.29 8.92 7.38 1 Bb3 ff 5.95 8.57 7.02 2 Bb3 pp 9.19 9.9 9.53 2 Bb3 5.72 6.92 6.26 2 Bb3 ff 5.87 7.8 6.7 3 Bb3 pp 9.41 5.97 7.3 3 Bb3 5.86 7.68 6.65 3 Bb3 ff 4.87 5.14 5 1 D5 pp 1 D5 1 D5 ff 2 D5 pp 40.24 23.06 29.32 2 D5 24.2 23 23.58 2 D5 ff 21.51 21.41 21.46 3 D5 pp 29.25 3 D5 3 D5 ff 19.89 17.91 18.85 1 Bb5 pp 32.95 1 Bb5 39.26 60.57 47.64 1 Bb5 ff 31.24 24.48 27.45 2 Bb5 pp 188.1 43.6 70.79 2 Bb5 62.73 43.98 51.71 2 Bb5 ff 42.36 42.62 42.49 3 Bb5 pp 64.24 3 Bb5 60.88 33.54 43.25 3 Bb5 ff 45.92 43.33 44.59 R1(MΩ) R2(MΩ) RM(MΩ) mf mf mf
NaN NaN NaN
mf NaN NaN NaN
NaN NaN NaN
mf
NaN NaN
mf NaN NaN NaN
NaN NaN
mf
mf
NaN NaN
From these data, we calculate M, the mean of Q1 and Q2, and e, the difference between Q1 and Q2. We then calculate embouchure resistance R, expressed in Mega Ohm (MΏ) defined as the ratio of intra-oral pressure over flow magnitude. Accordingly, R will be greater for notes requiring low intra-oral pressure and high flow (low and middle pitch range), and higher in the higher pitch range characterized by high mouth pressure and low flows. We calculate R1, the ratio of Pm over Q1, R2, the ratio of Pm over Q2, and RM, the ratio of Pm over M.
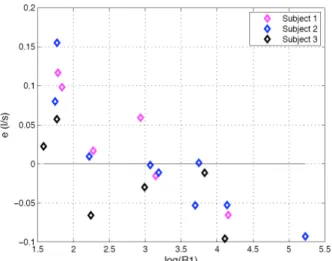
Figure 9: Difference between Q1 and Q2, e, as a function of Neperian logarithm of embouchure resistance calculated
from Q1: R1.
Values of R1, R2 and RM according to pitch and dynamic for all subjects are presented in Table (1). NaN values correspond to embouchure resistance not calculated because of a wrong intra-oral pressure or flow measurement. The range of values obtained fits within data shown by Elliot and Bowsher [10]. We observe maximum resistance for subject 2 playing Bb5 pp (188.1 MΏ, calculated from Q1) and minumun resistance for subject 3 playing Bb3 ff (4.87 MΏ calculated from Q1). In some situations, we observe important differences between R1 and R2, due to flow measurement discrepancies. We see that, for the three values (R1, R2 and RM), embouchure resistance increases with pitch and decreases with dynamic. This last observation is not true in R2 for subject 3 playing Bb3 and in R2 for subject 2 playing Bb5 (Boiled numbers). Whether or not this changing behaviour can be an estimator of the consistency of Q2 for these notes is discussable. In figure 9, we represent the evolution of e as a function of the Neperian logarithm of R1. This shows that maximum consistency between both flow measurements occurs on a delimited interval of log(R1), roughly around 3.5. We observe higher discrepancies for higher embouchure resistances; high level of intra-oral pressure might emphasize air-compressibility bias. We also observe higher values of e for low values of log(R1); the reasons for this behaviour remains unclear and might arise from jet turbulences.
4
Discussion
In this study we measured the evolution of two control parameters, intra-oral pressure and flow, during trumpet performance. Flow measurement was performed simultaneously by two methods: OEP system and tachometer. The range of intra-oral pressures obtained (1.07
– 9.07 kPa) corroborates values reported by previous studies [1, 2, 4, 5, 6, 7]. It appears to increase with both pitch and dynamic.
The range of flows measured is larger than what is reported in the literature; whereas Bouhuys [1, 2, 6, 7] and Pawlowski [5] found minimum values around 100 ml/s and maximum around 600 ml/s, we found minimum flow for Bb5 pp at 28 ml/s and maximum flow for Bb3 ff around 625 ml/s. These extremum magnitudes were extracted from the OEP volume trace derivations.
Tachometer recordings show significant mechanical inertia and poor sensitivity for low magnitudes of flow. Volume traces from the OEP system clearly display the influence of air compressibility on flow estimation. This particularly happens in the high register when the player uses higher mouth pressure.
Consistency between both methods of flow measurement appears to be dependent on embouchure resistance described as the ratio of intra-oral pressure over flow magnitude, but no clear relation can be derived at this stage. Dispersion in the distribution of error e possibly arises from different sources:
1- Calculation of averaged pressure and flow involves signal windowing matching stable sections of each trace. However, in some cases, windowing covers some bias on tachometer and OEP signals that arise from methods limitations enumerated. This might justify some errors in flow estimation but we expect windowing influence to be limited.
2- Cala et al. [9] showed that optoelectronic plethysmography (OEP) estimates lung volume (Vl) directly with a coefficient of variation of 2% for lung volume, 3.5% for a lung volume variation (ΔVL) and 1% for chest wall volumes (Vcw). Nevertheless, accuracy from OEP measurement is first strongly dependent from the quality of the acquisition as hidden markers during recording result in errors during computational tracking and reconstruction of the mesh. This is likely to induce artefacts and variability in volume calculated from OEP recordings. These drawbacks arise from the complexity of the set-up. When missing a marker after reconstruction, techniques of interpolation can be applied to recover its position. In a simple camera setup, this reduces the error in calculated volumes close to null. In our case, the trumpet and posture of the player required advanced arrangement of infra-red cameras to be able to track every markers properly. Despite this precise setup, some recordings required 2 specific markers (under the arms of the subject) to be reconstructed on a large number of frames. This might have affected the accuracy of these calculated volumes.
3- Air compressibility cannot be denied given the range of intra-oral pressures involved in these tasks. Despite taking into account this variable in the derivation of flow from volume traces, we observe lower values of OEP flow for Bb3 and higher values for D5 and Bb5, compared to the tachometer measurements. This could come from an over estimation of flow due to air compressibility for higher register involving higher intra-oral pressures. Other factors can also be influential such as blood shift. As a matter of fact, blood distribution is quite sensitive to pressure constraint such as the one enforced in the respiratory system during trumpet performance. Aliverti et al. [11] showed that, during tidal breathing, volume of blood shifts between
the splanchnic (visceral) compartment and the extremities lies around 50–75 ml. Abdominal pressure during quiet breathing are around 2KPa. It was also estimated that the blood shift would raise by 55ml/kPa of abdominal pressure increase [11, 12]. We are not able to estimate this parameter at this time. Nevertheless, it has to be considered to improve the accuracy of OEP flow estimation during high pressure conditions.
4- Despite a clear linear relation between output signal and flow (obtained after calibration of the tachometer) it is possible that this linear behaviour is not true for very small values of flow. Furthermore, we can assume that increase in pitch is correlated with higher turbulences in the air jet that tends to interfere with the performance of the tachometer and leads to under-estimation of air-flow magnitude.
Finally, preliminary measurements [13] have shown that the degree of noise in the sound is a function of flow magnitude; increase in flow, for a given fundamental frequency and loudness, results in an increase in noisiness, defined as the ratio of noise energy over total energy of the acoustic signal. In order to assess these first observations, we first need to enhance reliability of methods for flow measurements by taking benefit from the results presented here.
5
Conclusion
In conclusion, experimental results obtained in this study raise untackled questions about methods of evaluation of flow in trumpet performance. We mention particularly the influence of air compressibility, the characteristics of the jet in the trumpet and its influence on the tachometer. Importance of tracking and reconstruction when using OEP systems also appear as a crucial aspect of measurement quality. Furthermore, flow and intra-oral pressure data are rare in literature and results provided here allow us to confirm some hypothesis since we observe reproducible behaviours along subjects. Particularly, it appears that pressure increases with both pitch and loudness, that flow increases with pitch and tends to decrease with dynamic. Moreover, this kind of experiment, involving simultaneous measurements of different control parameters, opens the door to other studies enforcing additional recordings such as the force applied on the lips by the mouthpiece or electromyographic measurements of respiratory and facial muscle activity. These feedbacks will allow deduction of hidden parameters, for instance the opening area of the lips, and will lead to a better understanding of the performer's control for modelization and development of pedagogical tools. Finally, correlations with sound characteristics, should be explored to evaluate the influence of control parameters on advanced features of radiated sound related to timbre.
Acknowledgements
The authors are grateful to the trumpet players who participated to this study. This research was supported by the Canadian Foundation for Innovation and the Schulich School of Music.
References
[1] Bouhuys A. (1964). Lung volumes and breathing patterns in wind-instrument players. Journal of
Applied Physiology: 19(5): 967-975.
[2] Bouhuys A. (1969). Physiology and Musical Instruments. Nature, vol. 221: 1199-1204.
[3] Cossette I, Monaco P, Aliverti, A, Macklem, P. (2008). Chest wall dynamics and muscle recruitment during professional flute playing, Respiratory
Physiology and Neurobiology, vol160: 187-195.
[4] Fletcher NH and Tarnopolsky A. (1999). Blowing pressure, power, and spectrum in trumpet playing.
Journal of the Acoutical Society of America 105:
874-881.
[5] Pawlowski Z, Zoltowski M. (1985). Chosen problems of the aerodynamics of playing the wind instruments, Archives of Acoustics, 10/3: 215-228. [6] Bouhuys, A. (1965). Sound-Power production in
Wind Instruments, Journal of the Acoustical Society
of America, 37: 453–456.
[7] Bouhuys, A. (1968). Pressure-flow events during wind instrument playing. Ann. N. Y. Acad. Sci.
264-273.
[8] Aliverti A, Dellaca R, Pelosi P, Chiumello D, Pedotti A, Gattinoni L. (2000). Optoelectronic plethysmography in intensive care patients. Am J
Respir Crit Care Med, 161: 1546–1552.
[9] Cala S.J, Kenyon C.M, Ferrigno G, Carnevali P, Aliverti A, Pedotti A, Macklem P.T, Rochester D.F. (1996). Chest wall and lung volume estimation by optical reflectance motion analysis, Journal of
Applied Physiology, 81(6): 2680-2689.
[10] S. J. Elliott and J.M. Bowsher. (1982). Regeneration in Brass Wind Instruments, Journal of Sound and
Vibration, 83(2): 181-217.
[11] Aliverti A, Bovio D, Fullin I, Dellacà RL, Lo Mauro A, Pedotti A, and Macklem P T. (2009.) The Abdominal Circulatory Pump, PlosOne, 4(5): e5550. [12] Iandelli I, Aliverti A, Kayser B, Dellaca` R, Cala SJ,
et al. (2002). Determinants of exercise performance in normal men with externally imposed expiratory flow limitation. J Appl Physiol. 92: 1943–1952. [13] Causse R, Freour V. (May 2008). Study of brass
performer gestures, J. Acoust. Soc. Am. Volume 123, Issue 5: 3658-3658.