Comprehensive Performance Metrics for Complex Fenestration Systems
Using a Relative Approach
by Shreya H. Dave S.B. Mechanical Engineering Massachusetts Institute of Technology, 2009
SUBMITTED TO THE DEPARTMENT OF ENGINEERING SYSTEMS DIVISION AND THE DEPARTMENT OF MECHANICAL ENGINEERING IN PARTIAL FULFULLMENT OF THE
REQUIREMENTS FOR THE DEGREES OF
MASTER OF SCIENCE IN TECHNOLOGY AND POLICY AND MASTER OF SCIENCE IN MECHANICAL ENGINEERING
AT THE
MASSACHUSETTS INSTITUTE OF TECHNOLOGY
FEBRUARY 2012
© 2012 Massachusetts Institute of Technology. All Rights Reserved.
MASSACHUSETTS INSTITE OF TECHNOLOGY
LFEB
2 1 2012
LIBRA
RIES
ARCHP!JS
Signature of Author:Departm'ent of Engineering Systems Division Department of Mechanical Engineering
/2
/January 13, 2012
Certified by: Certified by: Accepted by: Accepted by: Marilyne Andersen Associate Professor of Sustainable Construction Technologies Ecole Polytechnique Fed6rale de LausanneThesis Supervisor
Leon Glicksman Professor of Building Technology & Mechanical Engineering Thesis Supervisor
Dava J. Newman Professor of A ronautics and Astronautics and Engineering Systems ,Ai}ctor, Technfay/fid ljfg*Program
David E. Hardt Ralph E. and Eloise F. Cross Professor of Mechanical Engineering Chairman, Committee on Graduate Students
Comprehensive Performance Metrics for Complex Fenestration Systems
Using a Relative Approach
by Shreya H. Dave
Submitted to the Departments of Engineering Systems Division and Mechanical Engineering on January 13, 2012 in Partial Fulfillment of the
Requirements for the Degree of Master of Science in Technology and Policy and Mechanical Engineering ABSTRACT
Buildings account for over 40% of the energy consumption in the United States, nearly 40% of which is attributed to lighting. The selection of a fenestration system for a building is a critical decision as it offsets electric lighting use as well as impacts energy performance through heating and cooling systems. Further, the fenestration system contributes to both occupant comfort and ambiance of the space. Complex Fenestration Systems (CFS) address these factors with a variety of innovative technologies but the language to describe, discuss, and compare them does not exist. Existing traditional metrics for fenestration systems are unable to reveal the benefits that characterize complex fenestration systems because they are rigid, do not reflect annual performance, and were developed for a different purpose. The framework presented in this research offers a solution to this problem by using an annual climate-based methodology to provide a comprehensive evaluation of a system by incorporating three of the most relevant performance aspects: energy efficiency, occupant visual comfort, and ability to view through. Three metrics, the Relative Energy Impact (REI), the Extent of Comfortable Daylight (ECD), and the View Through Potential (VTP), were derived from these three criteria to express, in relative terms, a fagade's contribution to building energy use, comfortable daylight conditions, and the degree of transparency, respectively. Several practical matters were considered when developing a policy-relevant set of metrics, including both ease of calculation for manufacturers and usability for consumers. As such, the calculation methodology evolved from its initial proposal into a simplified approach, analytical where possible, and into a label-like concept for visual representation. These metrics are intended to exist as a mechanism by which manufacturers can evaluate and compare fagade systems, provide high-level intuition of relative performance for designers and contractors, and enable the balance of performance objectives based on user preference. Ultimately, the creation of this comprehensive language is intended to stimulate innovation in fenestration systems and encourage their use in both new and retrofit building applications.
Thesis Supervisor: Marilyne Andersen
Title: Associate Professor of Sustainable Construction Technologies, EPFL Thesis Supervisor: Leon Glicksman
Acknowledgements
First, I would like to thank Marilyne Andersen, supervisor and mentor, for being the most encouraging and compassionate thesis advisor I could ask for. Thank you for teaching me about the world through amazing experiences, and for ceaselessly and tirelessly helping me to improve my work. These words cannot explain how much I have learned from you and how much I appreciate your support.
A hearty thank you also to my co-advisor Leon Glicksman for incredibly insightful feedback and a great
perspective on my work. I have had a wonderful experience in BT, and many thanks to you for facilitating that through your vision and dedication.
I would also like to acknowledge the contributions of Mike Rubin and Lisa Heschong in helping me understand what I was trying to achieve by patient conversations and invaluable pieces of advice.
Thank you to the whole BT family - especially to my fellow Illuminatis: Jaime Gagne, Siobhan Rockcastle, and Kevin Thuot - for company, advice, and friendly faces in the now daylit lab space. I would be remiss if I did not thank my great friends who have accompanied me on this graduate school journey. And finally, thank you to my family and especially my parents and sister, because without you I
Table of Contents
Chapter 1: Introduction... 13
1.1 Daylighting in Buildings... 14
1.2 M otivation for Using Daylight ... 15
1.2.1 Energy ... 15
1.2.2 Comfort, Health and Productivity... 15
1.3 Challenges of Using Daylight ... 16
1.4 Research Goals... 17
1.5 Thesis Overview ... ... ... 18
Chapter 2: Research Context...21
2.1 Complex Fenestration Systems... 22
2.2 The Bidirectional Transmission (Reflection) Distribution Function (BT(R)DF)...26
2.3 Policy Terminology ... 28
2.4 A Need for Relative Perform ance M etrics for CFS... 29
Chapter 3: State of the Art... 33
3.1 NFRC Rating System ... 34
3.2 Energy M etrics ... 34
3.2.1 U-factor/U-value... 34
3.2.2 Solar Heat Galn Factor (SHGF)... 35
3.2.3 W indow-to-W all Ratio (W W R)... 36
3.2.4 Solar Heat Scarcity/Surplus (SHS)... 36
3.2.5 Predictive Performance for W indows ... 37
3.3 Daylight and Visual Comfort M etrics... 38
3.3.1 Illum inance-Based M etrics ... 38
3.3.2. Glare-Based M etrics ... 41
3.4 View-Through M etrics... 42
3.2.1 Visible Transmittance (VT)... 43
3.4.2 Sample Viewing...43
3.4.3 Efforts to Quantify View... 43
Chapter 4: Framework for M etric Development... 45
4.1 Research Approach ... 46
4.1.2 Relative Approach...47
4.1.3 Simplification Methodology... ... 48
4.2 Basic and Full Resolution Inputs... ... 50
4.2.1 Generic Test M odule...50
4.2.2 Reference Fenestration System ... 52
4.2.3 Klem s Basis BTD F ... 52
4.2.4 14 U.S. Clim ate Zones...54
4.2.5 56 Representative Periods... 56
Chapter 5: Relative Energy Impact (REI)... 59
5.1 Defining the REI...60
5.2 Initial Calculation Approach... 61
5.2.1 Resistive Heat Transfer... 61
5.2.2 Solar Heat Gains ... 63
5.2.3 Heating and Cooling Load/Contribution... 66
5.2.4 Lighting Potential... 67
5.3 Reduction Approach ... ... 69
5.4 Analytical Assessm ent... 71
5.5 Validation Study ... 72
5.6 Sum mary of Results...74
Chapter 6: Extent of Comfortable Daylight (ECD) ... 77
6.1 Defining the ECD ... 78
6.2 Initial Calculation Approach... 79
6.1.1 Dynam ic Radiance ... 79
6.1.2 Calculating the ECD ... 81
6.3 Reduction Approach ... 82
6.4 Analytical Assessm ent... 85
6.4.1 Primary Causal Relationships... 85
6.4.2 Characterization of Regression ... 87
6.5 Validation Study...90
6.6 Summ ary of Results...91
Chapter 7: View Through Potential (VTP)... 95
7.1 Defining the VTP...96
7.2.1 Defining View Through ... 97
7.2.2 Calculating View Through...98
7.3 Reduction Approach ... 100
7.4 Validation Study ... 100
7.5 VTP Definition and Label Concept ... ... ... 103
Chapter 8: Policy Applications ... 107
8.1 NFRC Task Group ... 108
8.2 M anufacturer Adoption...109
8.3 Policy Considerations ... ... ... 110
8.3.1 M easures in a Top-Down Approach ... 110
8.3.2 Numbers in the Polis...111
Chapter 9: Conclusion...113
9.1 Achievements...114
9.2 Future W ork...115
9.3 Final Rem arks ... 116
Appendix A : General...117
Appendix B: Supplementary Information for REI M etric ... 119
Appendix C: Supplem entary Information for ECD M etric...127
Appendix D : Supplementary Information for VTP M etric...139
Sources...143
Table of Figures
Figure 1: Stained glass admits daylight in 10th century cathedral Notre Dame de Paris. ... 14
Figure 2: Five CFS used for analysis in this work: (a) Prismatic Panel, (b) Mirrored Blinds, (c) Holographic Optical Element, (d) Opalescent Plexiglass, and (e) Fabric Blinds...24
Figure 3: Schematic of photometric and geometric quantities in the definition of a BTDF (Andersen, 2002)... ... 27
Figure 4: Screenshot of measured BTDF (Andersen, 2004)...28
Figure 5: NFRC sample label for windows (NFRC, 2011). ... 34
Figure 6: SHS for an office building in Phoenix, AZ (left) and Fairbanks, AK (right) (Kleindienst et al., 20 10)...37
Figure 7: Daylight factor map for an existing building space...39
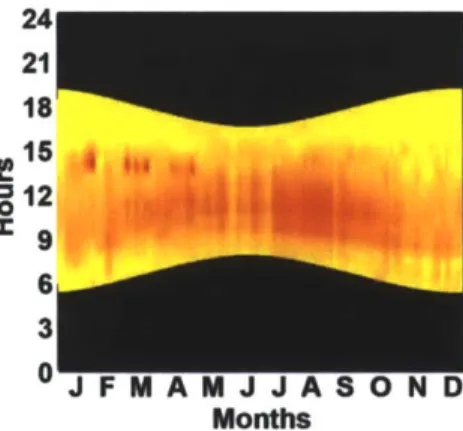
Figure 8: Acceptable Illuminance Extent represented on a temporal map (Kleindienst, 2010). ... 40
Figure 9: Glare temporal map for a classroom model in Sydney, Australia (Kleindienst, 2010)...42
Figure 10: Schematic of simplification methodology workflow. ... 49
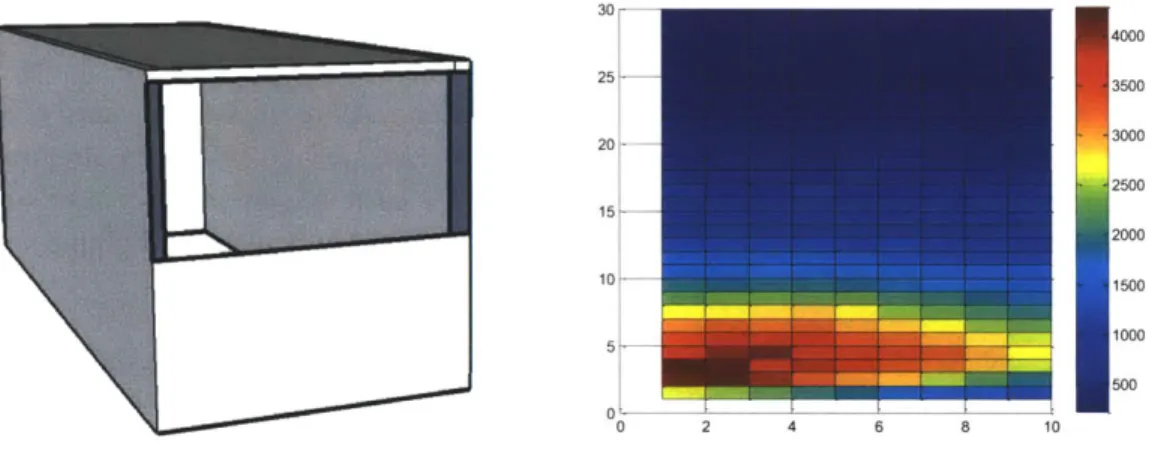
Figure 11: Generic test module and sample horizontal workplane illuminance plot, in lux, for a standard clear w indow ... 51
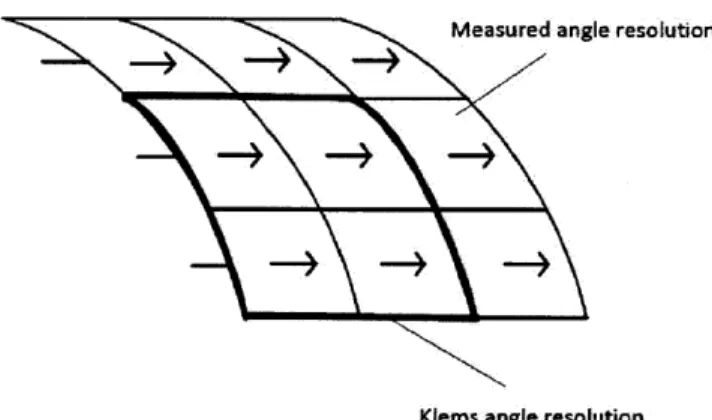
Figure 12: Schematic of condensing from measured to Klems basis BTDFs...53
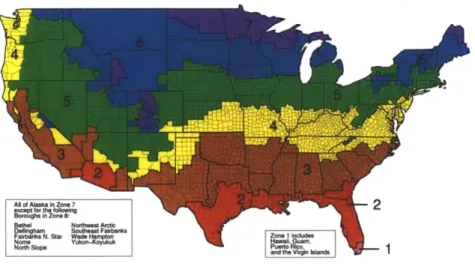
Figure 13: Eight climate zones in the United States as described by the IECC (EIA, 2004). ... 55
Figure 14: Energy Star climate zones (NFRC, 2004)... 55
Figure 15: Full and condensed direct normal solar radiation climate data (lux vs. hour of the year)...57
Figure 16: Schematic of net heat transfer (left), and a sample temporal map that shows the instantaneous net heat transfer for the entire year (right)...60
Figure 17: Flow diagram showing calculation of the resistive heat transfer across a fenestration system. 62 Figure 18: Daily average U-factor for a clear double-paned glazing in San Francisco, CA...63
Figure 19: Workflow for calculating solar gain heat flow across a fenestration system. ... 65
Figure 20: Workflow for determining REI from hourly heat transfer calculations. ... 67
Figure 21: Graphical representation of the lighting potential of a north-facing fenestration system at a specific m om ent...68
Figure 22: REI values for 14 climate zones...69
Figure 23: Map of United States split into 3 climate zones for REI evaluation. ... 70
Figure 24: REI label concept for five complex fenestration systems. ... 76
Figure 25: Gradated scoring system for determining the ECD metric (left), and a sample visual representation of the relationship between space and time that is comfortable (right)...78
Figure 26: Workflow for Radiance simulation that uses BTDF...81
Figure 27: Ranking of ECD for complex fenestration systems for 14 climate zones (south)...83
Figure 28: Hemispherical representation of rectangular generic test module...85
Figure 29: The sky hemisphere is divided into 145 patches (CIE, 1989)...86
Figure 30: Schematics show the relationship between sky patch luminance and interior window lum inance...86
Figure 31: Example of regressive predictions of ECD based on total vertical solar radiation. ... 88
Figure 32: Example of regressive predictions of ECD based on emerging window luminance...88
Figure 33: Example of regressive predictions of ECD based on average coefficients and total solar irradiation...89
Figure 34: Three-dimensional model of Reference Office building...90
Figure 35: ECD label concept for five complex fenestration system and the reference fenestration system. ... ... 93
Figure 36: Schematic of VTP calculation procedure... 96
Figure 37: Schematic of space view points as they relate to surface grid points...97
Figure 38: Workflow for calculation of the VTP metric... 99
Figure 39: View study setup and participant viewing samples...101
Figure 40: Average perception of view from 100 participants...101
Figure 41: Comparison between VTP calculated and VTP user study. Error bars refer to one standard deviation above and below the average results...102
Figure 42: Analytical correlation between perceived view through and calculated VTP...102
Figure 43: VTP values for five complex fenestration systems. ... 103
Chapter
1
Introduction
The sun's rays are the Earth's ultimate source of energy. They provide fuel for plants to convert to usable energy which becomes sustenance for animals and eventually humans. Sunlight enables decomposition of organic matter that in due course returns as a fuel source in the form of fertilizer, natural gas, oil, or coal. Photovoltaic panels convert solar rays directly into electricity for human use and wind energy requires pressure gradients caused by temperature differences that are a result of the sun's interactions with the physical environment. The position of the Earth with respect to the sun is responsible for changes in seasons, on which the cycle of life is based in many species. Humans have evolved circadian rhythms driven by a response to sunlight and calendars were established based on sun position. Using the sun is as innate as it is prevalent in every aspect of life and civilization.
1.1
Daylighting in Buildings
The term "daylighting" refers to the use of natural light from the sun inside buildings and has implications in various aspects of the building's performance. Many of these interactions have been investigated in both research and practice, and have often become an inherent part of architectural designs and building construction. The use of daylight in buildings is not a novel concept. However, the reasons for and the ways in which we use daylight have changed with technological advancement, resource availability, and social paradigm shifts. Initially, civilization lived by the solar day, relying on the sun's light and heat for survival and supplementing it with an earthly version- fire. Fifteenth century cathedrals incorporated aesthetic form with the necessity of functional light with the use of stained glass windows (Figure 1). Despite handheld torches, terra cotta lamps, and early candles, daylight remained the predominant source of light well into the 1700s. With the sperm whale rush of 1751 came a commodity energy source that enabled reliable interior lighting, but even as it gave way to kerosene lamps, daylight was viewed as a valuable resource (Tertzakian, 2006). It did not cost money, produce smoke, or risk fires.
Once Thomas Edison invented and popularized the electric lighting element, the requirement of daylight inside a building relaxed considerably. In fact, a 1930 article from the New York Times presented the exciting concept of a "windowless buildings" - a building so climate controlled and perfect that it did not need windows, daylight, or any connection to the untame outdoors! Electric lighting was so convenient that it was sure to be the way of the future (Tallman & Keally, 1930). While Tallman and Keally were certainly not wrong in their assessment of the huge potential of electric lighting, they did not anticipate a trend towards increased glazing areas and desire for natural light in buildings. Today, the discussion has turned to the efficiency of electric lighting fixtures; countries such the European Union and Switzerland have begun to phase out the inefficient incandescent bulbs in favor compact fluorescent lighting (called the "bulb-ban") and light emitting diodes (LEDs) are becoming tailored for indoor lighting applications (Kanter, 2009). Meanwhile, skyscraper office buildings today are frequently covered in glazing, providing occupants in an increasingly digital world with a connection to the outdoors and natural light. Today, a climate-controlled space with comfortable lighting conditions at any hour but a view to the outside offers the best of all worlds, albeit at a substantial energy cost.
Daylight affects energy performance of the building as well as occupant visual comfort, and subsequently to heath, well-being, and worker productivity. Daylight is a complex concept, dynamic in nature and subjective in interpretation. A number of innovative technologies have been developed to serve as fenestration systems (e.g. windows) to provide a modified, ideally more desirable, form of the raw daylight provided by the sun. The goal of this research is to develop and provide a language that can be used to evaluate and discuss these complex technologies in a framework that is intuitive and relevant to the building industry. The language is based on quantitative studies of daylight that provide insight into the complexity of its interactions with both the space and occupants. The following study acknowledges and appreciates both the quantitative impacts and qualitative aspects of daylight so that it can be enjoyed not only for its natural beauty but also for its ability to enhance the quality of an interior space.
1.2
Motivation for Using Daylight
1.2.1
Energy
Buildings in the United States account for about 42% of the nation's energy use (Energy Information Administration, 2010). Of this, an average of 38% can be attributed to lighting and 21% is due to the heating and cooling systems of a commercial building (EIA, 2010). Daylight affects these two aspects of a building's energy systems in specific and quantitative ways. First, using the sun's natural light can displace indoor electric lighting during the day. Artificial lighting provides a valuable service of lengthening the usable day and enhancing the ambiance of an interior space, but is dependent on electricity and affected by rising energy costs. Studies show that proper use of daylighting can reduce a building's total artificial lighting loads by 50 to 80% (Bodart & De Herde, 2002; Ihm et al., 2009), suggesting that a substantial portion of artificial lighting use can be eliminated. Even reducing the average artificial lighting load by just 10% for each building in the United States is equivalent to offsetting 1.8 billion gallons of gasoline over the course of a year (EIA, 2010).
Daylight also has potential benefits in heating applications. The sun's visible light corresponds to infrared heat that is also usable in its raw form. During heating seasons, contributions from the sun reduce the load for mechanical heating systems. Conversely, during cooling seasons, infrared solar heat adds to the load of mechanical cooling systems. Whether or not the overall heat gain is a net benefit to a space is highly dependent on system properties, climate, and seasonal operating conditions.
1.2.2 Comfort, Health and Productivity
In a talk she gave at MIT in 2011, Lisa Heschong commented that a study she conducted found that when considering daylight "more is better unless it is uncomfortable" (Heschong, 2011). This statement, although it might seem intuitive, summarizes the great implications of the role of daylight in the context of human factors. While occupant visual comfort is inherently a subjective concept, it is possible to value the benefits of comfort. Studies have shown that occupants prefer spaces with views (Keighley, 1973), perceive daylight as desirable (Kuller and Wetterberg, 1996), and that the presence of daylight contributes to overall well-being of the building's occupants (Farley and Veitch, 2001).
Attempts to measure well-being have been based in health benefits and worker productivity (Heschong et al., 2003; Edwards & Torcellini, 2002; Rashid & Zimring, 2008); studies are subsequently used to assess the cost-benefit tradeoffs of technologies and designs that improve daylighting conditions. Conversely, discomfort can be observed and measured using both user studies and predictive glare metrics (Wienold
and Christoffersen, 2006). A serious challenge to working with daylight indoors is balancing its benefits with its risk of discomfort (Vos, 1999).
Humans have evolved to respond to the cues of natural light, using it to establish the internal biological clock (Rea et al., 2002). With Americans spending increasing fraction of their time indoors, an emerging concern is being exposed to sufficient daylight to regulate their circadian rhythm (Rea et al., 2002). The amount of daylight exposure is also correlated with serotonin turnover in the brain, a deficiency of which causes Seasonal Affective Disorder (SAD), or severe mood impacts as a result of insufficient daylight (Lambert et al., 2002). Rosen et al. found that about 10% of survey respondents in Nashua, NH experienced mood change associated with SAD (1990).
Furthermore, students have been shown to work about 20 to 26% faster, improve 19 to 20% faster, and achieve scores about 7 to 18% higher on tests when sitting near daylight or being exposed to natural light (Heschong et al., 1999). In offices, workers were found to perform 10 to 25% better on tests that require mental function and memory recall and process work 6 to 12% faster (Heschong et al., 2003). Workers in daylit spaces report fewer ailments such as headaches or eyestrains and studies have shown a correlation between daylight and reduced absenteeism (Edwards & Torcellini, 2002; Rashid & Zimring, 2008). These staggering statistics can be valuated over the building's life of about 20 to 50 years to provide benchmarks for potentially huge monetary benefit of investing in daylighting or window technologies.
1-3
Challenges of Using Daylight
There are a number of characteristics of daylight that make working with it difficult, presenting both challenges and opportunities for architects and the designers of fenestration systems. These fundamental principles are presented here and provide insight into the crucial considerations of its behaviors that need
to be addressed when communicating about daylight.
Daylight is highly dynamic due to weather and other interruptions. From moving clouds to leaves rustling in the wind, the variables that interact with daylight between the sun and an interior space are entirely unpredictable and unique in almost every instance. The weather, the climate, and the obstructions between a window fagade and the sun present a substantial variety of potential daylight conditions. Assumptions of clear skies and constant solar radiation simply overestimate the role of daylight in a built space. But statistical climate data can be used to address aspects of uncertainty related to weather.
The sun's position is not static. As the sun moves across the sky over the course of a day, the shadows inside a space shift correspondingly. And, as a result of the Earth's orbit, the sun's position at noon on one day will not be exactly the same as noon the next. While an assumption about a single sun position is an over-simplification, its position can be predicted mathematically based on a location's position relative to the sun, both with respect to longitude and latitude as well as orientation.
Daylight can cause glare. Glare is a complex concept, fundamentally defined as the discomfort associated with high contrast ratios, and illustrated by the challenge of viewing a computer screen under direct sunlight (Ruck et al., 2000). Daylight is more difficult to control in this aspect than artificial lighting and often spaces are not designed to mitigate glare situations. Glare assessment methods and metrics are discussed in the following chapter and the benefits of daylight must be considered in parallel with the potential for discomfort of occupants.
Without redirection, daylight is concentrated near fagade openings. Whether next to a window or on the top floor of a building with skylights, daylight is limited to direct access to an opening. The bottom floor of a multi-story building will not benefit from a skylight and a desk far away from a window may not see any benefit at all from natural light. By contrast, light levels directly adjacent to the fagade may cause discomfort, forcing the closing of blinds and blocking much of the incoming light, affecting other areas that may have been comfortable. The role of daylight distribution is as important as quantity of light admitted into a space.
Finally, the way in which daylight is treated today is very dependent on human behavior, which is imperfect. Blinds or shades are the most common method of dealing with uncomfortable daylight, and typically these are manually operated. Unfortunately, occupants tend to adjust blinds manually only when discomfort is perceived. Once corrected, the blinds will often stay closed throughout the rest of the day's potentially comfortable conditions (Reinhart and Voss, 2003). Automatic blinds are sometimes introduced in commercial buildings, but have not achieved unilateral success as a result of unreliable machinery and the perceived lack of control for the occupants (Ruck et al., 2000). Reducing the reliance on occupant behavior to access the benefits of daylight has significant potential in addressing one of the most uncontrollable aspects of daylight.
1.4
Research Goals
Daylight, governed by laws of thermodynamics, characterized by seasonal and climate conditions, and perceived by humans with subjective judgment, is not a simple concept to describe or prescribe for buildings. Traditional metrics have been developed to describe technical specifications of standard fenestration systems, daylight distribution of a particular space, and general information about visible transmittance. Meanwhile, complex fenestration systems have been developed to address the many challenges of using daylight inside a space, utilizing dynamic, spectral, and angular response approaches. These traditional metrics, described in Chapter 3, cannot be used to describe complex fenestration systems because they do not consist of enough input detail to reveal subtle aspects of performance, rely on a user's ability to extrapolate behavior, and most fundamentally, have been developed for a different purpose.
The ability to converse about daylight and complex fenestration systems in a standard way would enable a transformation in the building industry in the understanding of daylight and its interactions with the built environment. Such an understanding presents opportunities for further technological innovation, knowledge-based design, and increased successful implementation of daylight in the building system. Complex fenestration systems present potential for increased performance of built space, but cannot be discussed because the language does not exist. The decision to use performance metrics as a basis for this language is discussed in greater detail in Chapter 2. The goal of the research presented in this thesis is to develop policy-relevant metrics that provide insight and intuition about the performance of complex fenestration systems. More specifically, we will propose metrics that can:
1) Reveal the dynamics and benefits of complex fenestration systems, concisely; 2) Provide intuition to the user about system performance;
3) Address both energy and human factor performance aspects in the same framework; 4) Exist in a structure that can be presented visually as on a label.
Three relative performance metrics have been proposed to address three separate criteria identified as being relevant to the performance of fenestration systems. The three criteria are energy performance, occupant visual comfort, and ability to view through. The three performance metrics are as follows:
1) Relative Energy Impact (REI): The total energy load attributed to the fenestration system,
reported as relative to a reference case.
2) Extent of Comfortable Daylight (ECD): The percent of time and space which achieves comfortable daylight conditions, reported for a fenestration system relative to a reference case. 3) View Through Potential (VTP): The degree of transparency of a fenestration system as it
relates to an occupants ability to see a faithful image of the view beyond the fagade.
These three performance metrics provide the basis for evaluation, comparison, and discussion of complex fenestration systems. They exist in the same framework such that inherent tradeoffs can be identified and provide users with the power to select their own priorities. In a world concerned with rising energy costs, the metrics presented here allow for reduced energy consumption by making compromises on other aspects of system performance that are deemed acceptable by decision-makers in the industry.
1.5
Thesis Overview
Chapter 2 presents further context for the research that leads to the development of the three relative performance metrics. It includes an introduction to complex fenestration systems, a discussion of the mathematical dataset used to describe the behavior of these systems, and an explanation of terminology used in the policy framework for the rest of the thesis. And it is followed by an overview of existing traditional metrics used to describe energy efficiency, daylighting, and view through fenestration systems (Chapter 3). Each of these metrics informs the development of new performance metrics, but exhibit limitations that make them, in their current form, insufficient.
Chapter 4 then presents the approach and research framework developed for defining, evaluating, and assessing the metrics, including a justification for use of a relative approach and a description of input parameters. In doing so, the challenges of working with daylight are addressed and considered in the context of rating the performance of fenestration systems according to the three performance criteria indicated previously.
Chapters 5, 6, and 7 each focus on the development of one metric: the REI, ECD, and VTP respectively. Each chapter first introduces the goal of the metric and describes the initial calculation methodology that is used to arrive at quantitative values. This method is then revisited through sensitivity analyses that identify critical parameters and an approach to reduce the complexity of the calculation process and increase the usability of the final form of the metrics. For the REI and ECD metrics, which rely on some degree of annual simulation, analytic analysis provides some additional insight into potential areas of further research. Finally, each metric is validated with a study that has been developed to assess a critical component of the metric definition and presented in its final form via a label concept that could be used to describe complex fenestration systems in practice.
The new work of this research concludes in Chapter 8 with an analysis of the role of these metrics in the current policy context. In addition to a summary of current efforts, a proposed workflow for engaging the use of these metrics in the context of policy frameworks is discussed. Further, important considerations of using numbers in the polis are summarized and discussed. Chapter 9 reviews the achievements and results of this research and provides a description of potential areas for future work.
Appendix A provides some generally applicable additional information for this thesis. Appendices B, C, and D include results from the REI, ECD, and VTP metric development processes respectively.
Chapter
2
Research Context
In this work, three relative performance metrics are presented as a viable approach to describe complex fenestration systems. In order to define these metrics, it is important to understand the degree of variety that exists in the category of complex fenestration systems, the data available for assessment, and the role of metrics in a policy context. This chapter introduces categories of complex fenestration systems, presents the specific systems used for the evaluation in this research, and presents the current mathematical description of their behavior, known as the BTDF. These fundamentals are used in the definition and analysis of the relative performance metrics. Finally, this chapter introduces the terminology used when describing aspects of fenestration systems, faeades, and buildings in policy and presents a case for the use of relative performance metrics for complex fenestration systems as opposed to the existing traditional metrics used for standard fenestration systems.
2.1
Complex Fenestration Systems
Complex fenestration systems (CFS) include a broad range of novel technologies that exert greater control of incoming daylight than a standard fenestration system can. The term "fenestration," by definition, refers to windows, skylights, and doors (NFRC, 2010), but for the purposes of this document, complex fenestration systems will refer to window fagade replacements, i.e. vertically oriented systems on walls. Five sample complex fenestration systems with varying properties were identified to represent a range of systems for evaluation.
CFS can be categorized by their physical installation requirements; some require modification of existing construction while others fit into the structure of standard fenestration systems. For example, light pipes bring light to lower floors of a multistory building by using optical reflections to guide sunlight through a cylindrical surface and exposing it below. By contrast, a diffusing panel is designed to produce more homogeneous illumination inside by redirecting light equally in many directions. This system can be considered physically as simply a "replacement window" with different properties (lower view, different light distribution etc.). A third category includes additional components to existing windows that modify the light and heat transfer across the fenestration system. For example, external blinds reject solar heat gains when the sun is above a certain angle, but allow skylight and direct sunlight from lower angles. Here, we look at complex fenestration systems that span the latter two categories described; comparing a structurally different system such as a light pipe to a standard window or skylight is not relevant because such a system is so involved in design decisions that are unrelated to the fenestration system.
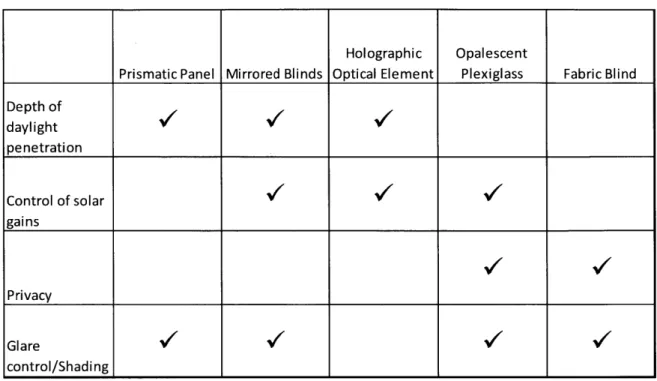
CFS have been developed by manufacturers to achieve a variety of optimized performance objectives (International Energy Agency, 2000; Kischkoweit-Lopin, 2002). A relevant way to categorize complex fenestration systems is according to their performance objectives. An interactive database of complex fenestration systems, D-LITE, uses four criteria to describe these objectives: depth of daylight penetration, control of solar gains, privacy, and glare control or shading (Rosa and Urbano, 2008). Deeper daylight penetration is typically be accomplished by redirecting incoming light in a manner such that it can illuminate a greater proportion of the interior space. Control of solar gains requires less admittance of direct light into the space during cooling seasons, which can be accomplished by shading or by a very low transmittance of light. Privacy indicates that the fenestration system disrupts or distorts the incoming light such that a view through from the outside is not permitted. And finally, glare control suggests that shading is implemented so that direct light will reach the eyes of occupants or surfaces that are highly reflective and may cause glare.
Complex fenestration systems are designed to achieve one or more of these criteria and so each should be revealed by the proposed performance metrics. Thus, a set of complex fenestration systems were selected to create a balanced performance objective portfolio. As shown in Table 1, each criterion has two or more systems whose properties were developed to achieve it.
Table 1: Complex fenestration systems that aim to address a variety of performance objectives.
Holographic Opalescent
Prismatic Panel Mirrored Blinds Optical Element Plexiglass Fabric Blind
Depth of
V/
daylight penetration Control of solar gains PrivacyGlare
V/
V
control/ShadingMore qualitatively, each system aims to achieve these objectives in unique ways.
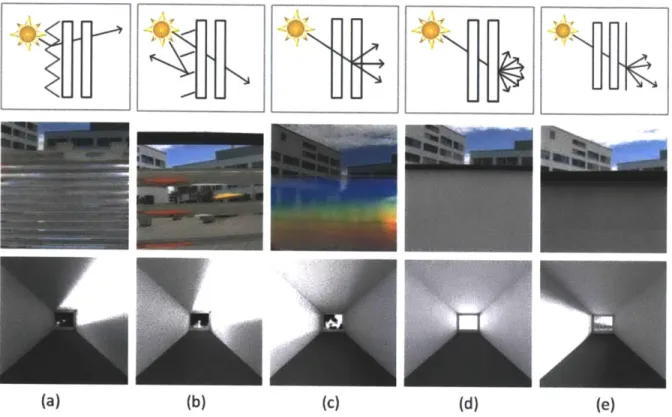
(a) Prismatic Panel: A prismatic panel is intended to increase the depth of daylight penetration by
redirecting incoming light toward the ceiling where it can then be reflected towards the work surface. Doing so also aims to reduce the direct light that may reach seated or standing occupants. The system is composed of horizontal prisms that appear as stripes and disrupt an occupant's view.
(b) Mirrored Blinds: Blinds are added to the exterior of an existing fenestration system to control solar gains as well as glare by reflecting incoming light above a certain angle away from the interior of the space. The blinds assessed are exterior blinds with a mirror surface and are user operated. The spacing of these blinds is about five centimeters and the unobscured portion of the fagade provides a clear view to the outside.
(c) Holographic Optical Element (HOE): A holographic optical element uses a film that refracts light to achieve distributional effects in a manner analogous to the three-dimensional images created by holograms. The system spreads the light inside the space, creates a rainbow effect on the fagade surface, and offers no protection to solar heat gains or glare.
(d) Opalescent Plexiglass: This diffusive surface provides very even distribution of light inside, but transmits very small quantities of light as compared to the other systems by exhibiting a near-perfect lambertien effect in redirecting incoming light in all emerging directions equally. It provides no view to the outside but reduces glare source risk and solar gains associated with
direct light considerably.
(e) Fabric Blinds: Fabric blinds are also used in addition to the existing standard fenestration system to reduce direct daylight that causes glare. They are interior, user operated, and do not control solar gains. These blinds are directionally diffusive, but a direct light source behind the blinds would be identifiable.
The visual perception of each fenestration system may be unique to each user, but certain traits can be characterized. Figure 2 shows three aspects of each fenestration system. The first row depicts a very simple schematic of the system's cross-section. The second row shows a photograph of each physical system, taken at normal incidence, and compared to the clear view obtained at the top of each frame. And the third row provides a light distribution rendering from the inside of a rectangular room for each fenestration system at 9:00am on December 21 in San Francisco, CA. The photographs and renderings both show the variety in physical and performance aspects of each complex fenestration system.
(a)
(b)
(c)
(d)
(e)
Figure 2: Five CFS used for analysis in this work: (a) Prismatic Panel, (b) Mirrored Blinds, (c) Holographic Optical Element, (d) Opalescent Plexiglass, and (e) Fabric Blinds.
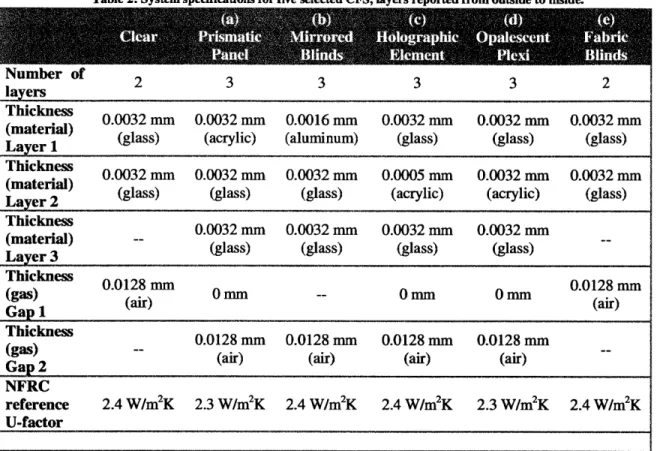
Quantitatively, cross-section schematics and quantitative system specifications for each of the five systems are shown below in Table 2. These, along with each system's unique BTDF (introduced in the next section), are considered material properties for each complex fenestration system evaluated in this work.
Table 2: System specifications for five selected CFS, layers reported from outside to inside.
Number Of 2 3 3 3 3 2
layers
Thickness 0.0032 mm 0.0032 mm 0.0016 mm 0.0032 mm 0.0032 mm 0.0032 mm
(material) (glass) (acrylic) (aluminum) (glass) (glass) (glass)
~Layer
1Thickness 0.0032 mm 0.0032 mm 0.0032 mm 0.0005 mm 0.0032 mm 0.0032 mm
(ae glass) (glass) (glass) (acrylic) (acrylic) (glass) Layer 2
Thickness 0.0032 mm 0.0032 mm 0.0032 mm
0.0032 mm
(material) (glass) (glass) (glass)
(glass) Layer 3 Thickness 0.0120 mm -- mm 0 mm (gas) 0.0128m m 0.12 mm0nu ar Gap 1(ar Thickness 0.0128 mm 0.0128 mm 0.0128 mm 0.0128 mm
(gas) (air) (air) (air)
(air)
~Gap
2 NFRCreference 2.4 W/m2K 2.3 W/m2K 2.4 W/m2K 2.4 W/m2K 2.3 W/m2K 2.4 W/m2K
2.2
The Bidirectional Transmission (Reflection) Distribution
Function (BT(R)DF)
Each metric proposed in this thesis is based most fundamentally on the mathematical description of the complex fenestration system behavior, known as the bidirectional transmission (reflection) distribution function (BT(R)DF). The transmission component of this dataset, the BTDF, relates incident and emerging angles of light transmission across a surface, angularly describing in discrete quantities where light is distributed on the emerging side. This enables a user to identify not only how much light is transmitted, but in what directions and is related to similar work in Fresnel lens development.
Originally proposed in 1970, BT(R)DF mathematically describes the behavior of light as it passes through or reflected from a fagade by the ratio between the emerging surface radiance (W/m2sr) and the incident surface irradiance (W/m2) (Nicodemus, 1970; Nicodemus et al., 1977). This thesis uses only the BTDF component, as datasets for the BRDF are even less available than those of the BTDF.
The following equation shows the BTDF, defined as a photometric quantity by the Comission Internationale de l'Eclairage (CfIE, 1977).
BTDF(9
1,01,62,0
2)
k(
101102102)-
(01101102102)
El (01) (01,#01) -cos 01 - do,
where,
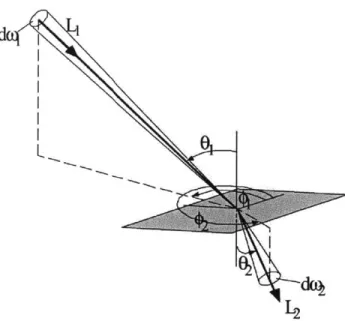
- (01,) and (02,02) correspond to incoming and emerging elevation and azimuth angles
respectively, expressed in radians;
- L-(O#01,) and 4(1,01,02,02)correspond to the luminances of incoming and emerging light flux, expressed in Cd/m2;
- dco is the solid angle subtended by the incoming light flux, expressed in steradians (sr);
- And El (0,) refers to the illuminance on the sample plane due to incident light flux, in lux. The BTDF angle convention used is defined for international use in the International Energy Agency's Task 21 (IEA, 2000). Care must be taken when switching between conventions from data sets to
applications. The IEA Task 21 convention used here is shown in the schematic representation of the BTDF shown below in Figure 3 (Andersen, 2002).
>41
Figure 3: Schematic of photometric and geometric quantities in the definition of a BTDF (Andersen, 2002). The BTDF exists in the form of quantitative datasets; a screenshot for a single incident condition is shown in Figure 4. These datasets can be generated either by measurement or by simulation. Measured data is a more accurate representation of a surface's behavior because simulations often rely on simplifying assumptions about ideal behavior (Window 6, 2010). For example, a simulated BTDF for a clear window achieves nearly 100% transmission with zero scattering (Window 6, 2010). Measured BTDFs are time consuming and often computationally expensive to generate, but provide insight about the actual properties of a material or fagade construction.
A bidirectional video-goniophotometer that uses a Charge-Coupled Device (CCD) camera has enabled the development of a relatively extensive database of BTDFs for a range of advanced fenestration systems (Andersen, 2004). This innovation allows the data collection to be gathered in a complete, rather than discrete, manner, and reduces the gathering time by more than 80% (Andersen and de Boer, 2006). It was from this database that samples were selected for analysis in this research.
dfq-Figure 4: Screenshot of measured BTDF (Andersen, 2004).
The improved accuracy of BTDF datasets is important to the future of metrics proposed in this work, but outside the scope of this study. The research presented here is a framework that will ultimately require accurate data inputs for veritable performance rankings but has been established based on current best available data. There is not yet a standard methodology for measurement and accuracy considerations of BTDFs that can be used across different manufacturers or research institutions. Moreover, a strong demand for BTDFs does not exist because they are large, unwieldy, and require significant analysis to provide useful information. Each of these creates barriers to development of widespread BTDF measurement and use. Efforts are currently underway to standardize the measurement and calibration of BTDF quantities (NFRC, 2011) and popularizing metrics that rely on measured BTDFs would encourage their creation and thus improve the quality of the databases and in turn, benefit the accuracy of the metrics.
2-3
Policy Terminology
To precede a discussion of metrics in policy, a number of terms are defined here in the context of buildings, the policy that governs them, and the work that follows in this thesis. This terminology, although potentially interchangeable, can be used to establish a baseline for understanding the contributions of this work.
Building codes are enforceable documents that are mandated by state and federal government regarding any critical component of a building. For example, structural codes ensure stability and fire codes govern aspects related to fire safety.
Building standards are created by independent organizations and provide guidelines for recommended performance. The American Society for Heating, Refrigeration and Air-Conditioning Engineering (ASHRAE) creates the building industry's most widely recognized standards in the United States. Although written in enforceable (code) language, these documents are not enforceable unless a code specifically references adherence to a particular standard.
N -iN File Edit Fort View Help Wmateral.hnePerf6O90'
#manufacturer: saumann- Hppe
4Isym - 3 symmetry indicator: 0 no symmetry (phi_1 0 '..360)
I rotary symmetry Conly for one phi-1) 2 synmetry to ph-t=0' and phi-leO' (phi-I.
~
10 3 synnetry to phi 90' and p hi 27G0 (phs.J -90'...90')4 symmetr to pho and phi-180 & to phi-90' and phi=270 (phi1 0'...90') #considered area [cm2l 16.71
#thickness (ct): 0
#Co ments: No 9: Laelle SOn. Spiegel / Grau Matt Keine PerforierUng. L nellenwinkel: 90'. #measurementSr done at the solar Eeey and Building Physics Laboratory, LEso-PB/EPFL #measurements and processing by Marilyne Andersen
#date of measuremett, 16.01.01
#contact mEarilyneAndersengepfl.ch for details #Ti ght incidence
oph: 90, (azimuth)
,#theta-.: 0* (altitude)
5
#ST0F values averaged over output dirctions from (phi-2 - 7.5) to (phi-2 + 7.5) in azimuth d#and from (theta-.2 - 5.0) to (theta.2 + 5.0) in altitude
.fneasurements not performed for theta-Z 4 95.4
#li ght tr ansmi ttance: 0.90o
#Tight transmittance calculated from BTDF values, with extrapolated values for 90 < theta_2 < 95.4
#data #phi2 theta& BTDF 15 100 0.000 90 100 0.000 35 100 0.000 40 100 0.000 60 100 o.o0o 75 100 0,035 90g 100 0.101 105 100 0.000 120 100 0.000 135 100 0.000 15 100 0.000 1150 100 0.000 ISO0 100 0.000 1195 100 0.000 4-W13M1
Technical specifications describe various components of building construction in quantitative terms.
While some specifications are intuitively accessible to a layperson, others appear disconnected from the aspects that affect an occupant. Users typically do not consider the load bearing ability of a beam unless they are concerned specifically with the structural integrity of the building. Meanwhile, the recommended depth of a step on a staircase is something that users do interact with on a regular basis. Specifications are reported in their most fundamental technical terms.
The term performance criteria refers to aspects of building performance that can be described qualitatively or defined quantitatively. A relevant performance criterion of a mechanical heating system may be internal thermal comfort for occupants which can then be measured using a number of different models for thermal comfort whereas the technical specification would be the fan throughput. An even less glamorous performance criteria is a roof's ability to prevent water from entering the space. Whereas the size or load rating of the mechanical heating system and the roof's total porosity are specifications, what they describe is often a relevant performance criteria.
Indicators of performance may also be quantitative or qualitative and describe performance criteria
indirectly. To continue the preceding examples, an indicator of thermal comfort may be users who do not complain or adjust the thermostat often. An indicator of roof's resistance to water penetration may be the absence of leaks. Indicators are indirect, and do not necessarily describe causal relationships, but may provide further insight into performance.
Finally, metrics are ways in which performance can be described in a quantitative manner. A metric for
artificial lighting energy efficiency is the Watts per square meter of floor area that are required to light the space. This value is directly comparable across different buildings and types of space, and provides a user with a specific component of performance. In this example, the performance criteria is artificial lighting energy efficiency, a technical specification is the power consumption per lumen produced by the bulbs selected for use, and an indicator may be cooling loads associated with the space (more inefficient lights require additional cooling of waste heat).
2.4
A Need for Relative Performance Metrics for CFS
Metrics as a category of quantitative measures can be further divided into two categories. In this work, relative performance metrics aim to replace traditional metrics to provide more insight, greater flexibility, and improved accuracy of complex fenestration behavior perception.
Traditional metrics are often be used interchangeably with technical specifications. A material property
that is easily categorized as a technical specification is its thermal conductivity (W/mK). This specification has been modified for surfaces to describe a material's resistance to heat flow across in the form of the U-factor; its reciprocal is also known as the R-value. The U-factor is a traditional metric that is used to describe wall constructions, insulation, fenestration systems, and basement foundations. Because traditional metrics are specific in their description, standards based on traditional metrics often prescribe a solution a priori. For example, energy standards that prescribe minimum U-factor and insist on achieving energy performance by reducing heat flow across the surface of materials.
By contrast, a performance metric describes the desired outcome, rather than the requirements for the process or approach to produce it (ASME, 2004). Where the performance criterion is energy efficiency, performance metrics that quantify and describe energy efficiency provide room for multiple methods of achieving it. Descriptive standards that are based on performance metrics allow for innovation and development in achieving the goal, whether it be structural integrity or energy efficiency. However, performance metrics in practice must also be wary of being too broad and not enforceable. Performance metrics that encompass too many components and potential choices for the user may provide little benefit to the policymaker.
In the case of complex fenestration systems, the traditional metrics that have been defined for standard fenestration systems rely on a certain amount of intuition and basic assumptions about behavior and thus, cannot be directly transferred to complex fenestration system. More specifically, traditional metrics that describe fenestration systems rely only on a single set of environmental and incident conditions (NFRC, 1999). This simplification necessarily assumes that users have the intuition to extrapolate behavior (or do not require it to make decisions), but these assumptions do not extend to more complex fenestration systems. For example, the window-to-wall ratio indicates the portion of a fagade that is dedicated to windows. For a standard fenestration system, this value is correlated with increased daylight, solar heat gains, and resistive heat transfer out in a predictable way for a given climate zone. Whereas a maximum window-to-wall ratio provides a mechanism for reducing energy use due to standard fenestration systems, it precludes the use of complex fenestration systems that do not behave as assumed by the metric.
In an effort to include non-typical components of buildings, such as complex fenestration systems, in building standards, certain standards provide dual approaches for adherence. ASHRAE 189.1, the standard for high-performance green buildings, provides prescriptive requirements as well as the option for full building energy simulation to predict performance (ASHRAE 189.1, 2009). This approach is not ideal for two reasons: First, the designated simulation software, EnergyPlus, does not use BTDFs in heating and cooling analysis of buildings and although it does use BTDFs for lighting, the interface is not yet seamless. Second, because of the complexity and interactions of the energy simulation software, decisions made about the fenestration system may be difficult to deduce from results. Incorrectly attributing an aspect of performance to the fenestration is worse than not assessing it at all. For these reasons, and in response to demand from the building industry, the National Fenestration Rating Council (NFRC) has specifically identified developing metrics for complex fenestration systems as a priority for Phase II of the Daylighting Subcommittee/Daylight Potential Task Force (McGowan, 2011).
Performance metrics that describe complex fenestration systems can address each of the issues presented in this section. Because they are not technical specifications, performance metrics will aid users in understanding the behavior of complex fenestrations intuitively. They will also contribute to reducing the dependency of "all or nothing" approaches to energy standards in terms of simulation; the select processes selected for determining the performance metrics enable descriptive standards without the use of full building energy simulation which does not yet have the functionality required to evaluate complex fenestration systems. Moreover, performance metrics do not rely on users to extrapolate behavior because they rely on actual data, creating a more comprehensive feedback loop where intuition may not
And finally, the performance metrics presented in this work provide a mechanism to allow assessment of multiple aspects of performance on a comparative basis. All three metrics presented are relative to a reference case, and are system-specific, rather than the current combination of system-specific energy metrics and space-specific daylighting metrics. Assuming full energy and daylighting analyses are both conducted, it is difficult to assess tradeoffs in each of these performance aspects; whereas energy metrics are system-specific, daylighting metrics are space-specific and without directly comparable metrics, intuition plays a significant role in evaluating tradeoffs. Furthermore, when these simulation analyses are used, they are often applied so late in the design process - because details about the building are required as inputs - that few significant changes can really be implemented. Creating the simulations and analyzing the results are also not necessarily feasible in all building design proposals as they require both time and expertise to conduct. Finally, relating the behavior of a complex fenestration system in a specific scenario (location or orientation) to the behavior of a simple fenestration system in the same scenario allows the user to perceive the system physically and understand it more intuitively.
The proposed metrics also enable users to dictate precedence in performance criteria. Although the Relative Energy Impact (REI) can reveal "better" energy performance with respect to another fagade, the metrics make no attempt to suggest that energy performance is a higher priority than visual comfort, described by the Extent of Comfortable Daylight (ECD), or a view to the outside, described by the View Through Potential (VTP). Manufacturers should not be required nor encouraged to develop systems that achieve high metric rankings but do not satisfy user priorities, the "demand" of the industry, whether they are a function of building codes or individual preference.
The building industry is a unique combination of technical engineering expertise and artistic form through architecture. Often, these disciplines clash, the former being preoccupied with optimized performance and the latter focusing on creating spaces for human occupants. There is a general lack of communication between the two groups, resulting in a design process that is fragmented, inefficient, and resulting in less than desirable outcomes. Projects at MIT and
@PFL,
among other institutions, traverse this boundary by developing software such as CoolVent or Lightsolve which enable designers and architects to make intelligent technical decisions about buildings without requiring significant expertise in each area (Menchaca and Glicksman, 2008; Andersen et al., 2006). The role of performance metrics complements these efforts by providing another mechanism for information transfer between technical experts and decision-maker designers.Chapter 3
State of the Art
Significant amounts of information can be obtained from the existing traditional metrics that are used to describe energy specifications of standard fenestration systems, daylight through simulation analysis and view through via visual observation of a building space and its fenestration system. However, each of these metrics has been developed for a specific purpose such that they cannot describe a complex fenestration system and its performance on an annual basis. Some energy metrics relate to the fenestration, while others reference the building system, and daylight metrics tend to be highly dependent on spatial geometry. These various frameworks, structures, and goals achieved by existing metrics do not allow a user to select a complex fenestration system based on his or her individual priorities in performance.
For example, a clear view to the outside might trump any other characteristic of the system (or, vice versa, privacy with good daylight performance might be a requirement). Meanwhile, in a highly-constrained environment, reducing cooling loads might be the single most critical design feature of not only the fenestration system, but the entire building. The information to make these comparisons is present in the literature, and although some metrics have been incorporated into industry practice, explicit rating systems for complex fenestration systems do not exist.
The ability to identify tradeoffs and select a fenestration system based on user-defined priorities are key components of the performance-based metrics presented in this research. The development of these metrics for complex fenestration systems builds on the substantial literature that describes validated energy and daylighting metrics. This relevant literature is summarized here.
3.1
NFRC Rating System
The National Fenestration Rating Council (NFRC) establishes guidelines and protocol for the calculation of the most widely used rating specifications for fenestration systems in the United States. The NFRC then regulates the fenestration industry by requiring manufacturers to calculate and display their products' specifications on a label that is designed for consumer understanding. An example label for a fictitious window is shown below in Figure 5 (NFRC, 2011).
World's Best
Window Co.
ENERGY PERFORMANCE RATINGSUFactrfSP I SOlarHeatGMitCoedkient
0.35 1 0.32
ADMONAL PRORMANCERAfTNGS
0.51
0.2
51
Figure 5: NFRC sample label for windows (NFRC, 2011).
These specifications are used as traditional metrics in building standards such as the ones published by the American Society of Heating, Refrigerating, and Air-Conditioning Engineers (ASHRAE) (ASHRAE, 1999; ASHRAE, 2009). Local and state governments then use selected standards for building codes and are responsible for enforcement. As mentioned previously, the building codes are the only enforceable documents, although ASHRAE standards are written in code language. While ASHRAE depends on the NFRC for the calculation methodologies of its system-specific traditional metrics, other descriptive quantities are used in its standards, such as the window-to-wall ratio (ASHRAE, 2009). Examples of both widely used and more recently developed metrics are presented in the next section.
3.2
Energy Metrics
3.2.1 U-factor/U-value
The U-factor is a measure of the window's heat transfer resistance across the indoor/outdoor temperature difference. A full fenestration system contains a number of different components including the frame, edges and dividers, and the glass itself. The NFRC provides guidance for the calculation of each of these individual U-factors as well as the Total Fenestration Product U-factor which is a function of all associated U-factors and their relative surface areas (NFRC, 1997). For NFRC purposes, specific environmental conditions are used to calculate the U-factor, including indoor and outdoor temperature and exterior windspeed (NFRC, 1997). The U-factor is determined by measuring the total heat transfer by conduction, convection, and radiation, and relating it to the surface area as shown in Equation 2, where A is the surface area of the window and Ti. and T,. refer to inside and outdoor temperatures, respectively.