A COMPREHENSIVE REVIEW ON ROCK BURST
byMartin M. Nussbaumer
Dipl. Ing. in Civil Engineering Technical University of Munich
Munich, Germany
(1998)
Submitted to the
Department of Civil and Environmental Engineering in partial fulfillment of the requirements for the degree of Master of Science in Civil and Environmental Engineering
at the
MASSACHUSETTS INSTITUTE OF TECHNOLOGY
August 2000
D Massachusetts Institute of Technology, 2000 All rights reserved.
Signature of Author
Department of Civil and Environmental Engineering, August 11, 2000
Certified by
Prof. Herbert. H. Einstein, Thesis Supervisor
Accepted by.
Prof. Daniele Veneziano Chairman, Departmental Committee on Graduate Studies
A COMPREHENSIVE REVIEW ON ROCK BURST By
Martin M. Nussbaumer
Submitted to the Department of Civil and Environmental Engineering on August 11, 2000
in partial fulfillment of the requirements for the degree of
Master of Science in Civil and Environmental Engineering
ABSTRACT
The term "rock burst" is commonly used to describe a wide range of rock failures, which occur in tunnels, shafts, caverns and mines. Rock burst is a sudden form of rock failure characterized
by the breaking up and expulsion of rock from its surroundings accompanied by a violent
release of energy. Rock bursts have been encountered frequently in mines and on few occasions in civil engineering tunnels. Rock bursts in tunnels represent a significant threat to the safety of tunnel workers and equipment, as well as a significant factor with respect to performance of tunneling contracts. The increasing amount of civil engineering tunnels built in difficult geologic conditions and under high overburden makes an understanding of rock bursts necessary.
A summary of available research on bursts, case studies, used and suggested support systems,
design methods, prevention and prediction procedures are presented. Several different mechanisms of rock bursting are described, and a clear distinction between source and damage mechanism is drawn. Criteria for identifying burst prone ground, conditions and thoughts concerning support of tunnels are presented. Practical implications from experiences in mining for permanent civil engineering structures are pointed out.
Support systems are evaluated with respect of their ability to withstand rock bursts. A rationale for designing support systems is given. It involves the identification of the likely modes of failure in the tunnel and the determination of support survival limits. Also, methods of rock burst prediction used in mining and methods that prevent rock bursts by eliminating the trigger mechanism are presented.
Thesis Supervisor: Prof. Herbert H. Einstein Title: A Comprehensive Review on Rock Burst
Acknowledgements
I would like to express appreciation to the following individuals for helping to make this thesis
possible:
Prof. Herbert H. Einstein, my thesis supervisor for his teaching, assisting and guiding me throughout all phases of my research. His insight lead me through this new and challenging experience. I will always be grateful for his high level of support with all the problems we encountered and for his positive and cheerful attitude that helped carry me through the tough times.
The faculty of the Mechanics and Material Group at M.I.T.
My friends and colleagues at M.I.T. who helped make this a memorable experience. Alex
Liakos, Jorge Gonzalez, Federico Pinto, Catalina Marulanda, Christoph Haas, Kurt Sjoblom, Sanjay Pahuja, Karim Karam, Yun Sun Kim, Greg DaRe, Hannes Lagger, Attasit "Pong" Korchaiyapruk, Suchatvee "Vince" Suwansawat, Maria Santagata, Dominic Assimaki, Babar Bhatti, Gouping Zhang, Laurent Levy, Cathy Castenson, Kortney Adams, Kartal Toker, Vladimir Ivanov, Alice Kalemkiarian and "The Greeks". Their friendship is a treasure that I will carry forever.
All dirtballs, labrats and geotechs that have come and gone.
Last but not least, I would like to thank my family, who has always supported, loved and believed in me throughout every step of my life.
TABLE OF CONTENTS
Chapter 1 Introduction...19
1.1 Background and Problem Statement ... 19
1.2 Research Objectives ... 21
1.3 Organization ... 22
Literature... 23
Chapter 2 Characteristics of Rock Bursts ... 25
2.1 General Characteristics of Rock Bursts... 25
2.1.1 Description... 25
2.1.2 Type I and Type II Rock Bursts... 30
2.1.3 Distinction from Other Seismic or Destructive Underground Events...32
2.1.4 Location ... 34
2.1.5 Magnitude or Seismic Energy from Rock Bursts...34
2.1.6 Peak Particle Velocity and Repetitive Dam age ... 42
2.1.7 Ejection Velocity ... 43 2.2 M echanism s ... 45 2.2.1 Source M echanisms... 46 2.2.2 Damage mechanism s ... 48 2.2.2.1 Strain Bursts... 49 2.2.2.2 Buckling ... 53 2.2.2.3 Ejection ... 55 2.2.2.4 Arch Collapse ... 57
2.2.2.5 Other Damage M echanisms ... 58
2.3 Depth of failure for Strain Bursts... 60
2.4 Causes of Rock Bursts... 65
2.5 Factors Influencing the Severity of Rock Bursts ... 66
2.5.1 In Situ Stress Condition ... 66
2.5.1.1 Interpretation of Results from Numerical Modeling ... 67
2.5.3 Impact of Petrology ... 78
2.5.4 Impact of Geologic Features... 79
2.5.5 Preconditioning ... 81
2.5.6 Extraordinary Factors Influencing Rock Bursts... 81
2.6 Impact of Rock Bursts... 82
2.6.1 W orkm en Safety and M achinery... 82
2.6.2 Tunnel Structure and Support ... 83
2.6.3 Effects on Project Schedule and Cost... 83
Literature...84
Chapter 3 Case Studies...89
3.1 Rock Bursts in Civil Engineering Structures... 89
3.1.1 N orwegian H ighway Tunnels ... 89
3.1.1.1 Hsyanger Linefjord Tunnel... 95
3.1.1.1.1 HsyangerSide ... 98
3.1.1.1.2 Lanefjord Side ... 103
3.1.1.1.3 Prevention, Support System, Construction Procedure... 104
3.1.1.1.4 Impact of rock bursts on construction tim e and cost ... 106
3.1.1.2 Heggura Tunnel in Tafjord ... 108
3.1.2 Kan Etsu Tunnel, Japan ... 119
3.1.3 Ertan Dam , China ... 131
3.1.4 N ew York City ... 147
Literature... 151
Chapter 4 Support ... 153
4.1 Observations of Support Dam age ... 153
4.2 Support System Functions ... 158
4.3 Components of Support System ... 160
4.3.1 Tendons... 162
4.3.1.3 Cement Grouted Cables ... 169
4.3.1.4 Resin Grouted Rebars ... 170
4.3.1.5 Split Sets Bolts ... 171
4.3.1.6 Swellex Bolts... 172
4.3.1.7 Cone Bolts... 173
4.3.1.8 Yielding Hydraulic Props ... 175
4.3.2 Shell... 177
4.3.2.1 M esh ... 177
4.3.2.2 Shotcrete ... 178
4.3.2.2.1 Shotcrete on Unfractured Rock ... 179
4.3.2.2.2 Shotcrete on Fractured Rock ... 180
4.3.2.2.3 Shotcrete as a Supermesh... 184
4.4 Support Systems Used in M ines ... 186
4.4.1 Canadian Practice ... 186
4.4.2 South African Practice ... 189
4.4.3 U .S.A., Chilean and Australian Practice... 191
4.4.4 Summary of Behavior of Support Elements under Bursting Conditions in Mines 192 4.5 Desired Support Characteristics for Bursting Ground ... 193
4.6 Design of Support System s for Rock Burst Environments ... 195
4.6.1 Current Design Rationales for Support in Burst Prone Ground... 195
4.6.2 Conceptual Design Considerations ... 198
4.6.2.1 Engineering Design Approach ... 198
4.6.2.2 Factors to Consider for M ode II and III Support Design...200
4.6.3 Design Examples for M ode I and II... 201
4.6.3.1 Design Considerations for Strain Burst Conditions ... 202
4.6.3.2 Design Considerations for Ejection Conditions ... 203
4.6.4 Summ ary ... 209
Chapter 5 Prediction and Prevention of Rock Burst...215
5.1 Prediction... 215
5.2 Prevention...216
5.2.1 Elim ination of Triggering M echanism s... 216
5.2.1.1 Designing and Building a Tunnel to Minimize Stress... 216
5.2.1.2 Reinforce the Rock M ass ... 217
5.2.1.3 Energy Release Control ... 217
5.2.1.4 Use of Destress Blasting ... 217
5.2.2 M inim ization of Rock Burst Consequences ... 220
Literature... 221
LIST OF FIGURES Page r 2 Figure Chapte Figure Figure Figure Figure Figure Figure Figure Figure Figure Figure Figure Figure Figure Figure Figure Figure Figure Figure Figure Figure Figure Figure Figure 2.23: Figure 2.24: ... 7 3
Modulus of Elasticity -Relative Violence of Rupture - Relationship...74
Poisson's Ratio - Relative Violence of Rupture -Relationship... 74
2.1: Rock Burst Damage in a Gallery (U.S. Bureau of Mines, Spokane) ... 26
2.2: Rock Burst Damage in a Gallery (U.S. Bureau of Mines, Spokane) ... 26
2.3: Heavy Rock Burst Damage (U.S. Bureau of Mines, Spokane)...27
2.4: Heavy Rock Burst Damage (U.S. Bureau of Mines, Spokane)...27
2.5: Centers of Rock Bursts W orldwide ... 29
2.6: Cross Section Through Spherical Cavity Model by Duvall and Stephenson ... 36
2.7: Seismic Energy Ws as a Function of Stress and Involved Rock Volume Vac for Stresses from S=5 MN/m2 to S=150 MN/m2 ...41
2.8: Magnitude over Time at Creighton Mine (Kaiser et al., 1992)...42
2.9: Geometry of a Strain Burst Event (Ortlepp&Stacey, 1994) ... 49
2.10: Effect of Stress Field and Cavity Profile and Damage Location (Martin et al., 19 9 9 ) ... . . 50
2.11: Strain B urst Fragm ent ... 51
2.12: Geometry of a Buckling Event (Ortlepp&Stacey, 1994)...53
2.13: Buckling at the Strathcona Mine, Canada (Ortlepp&Stacey, 1994)...54
2.14: Geometry of an Ejection Event (Ortlepp&Stacey, 1994) ... 55
2.15: Geometry of an Arch Collapse Event (Ortlepp&Stacey, 1994)...57
2.16: Implosive Damage M echanism ... 58
2.17: Inertial Displacement M echanism ... 59
2.18: Shape after Strain Bursts Halted and Ressupport with Shotcrete (Kaiser & T annant, 1999)... . 60
2.19: D epth of Failure... 61
2.20: Depth of Failure under Static and Dynamic Stress (Martinet al. 1996)...63
2.21: Unit Weigh - Relative Violence of Rupture - Relationship ... 73
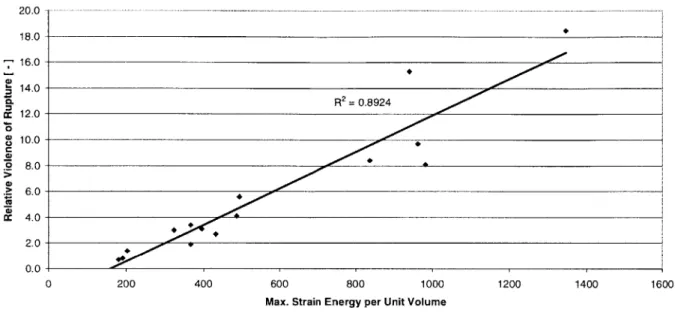
Figure 2.25: Max. Strain Energy per Unit Volume -Relative Violence of Rupture
-R elationship ... 75
Figure 2.26: Influence of Dykes on Rock Burst Activity ... 79
Figure 2.27: Influence of Faults on Rock Activity...80
Chapter 3 Figure 3.1: Routing of Tunnel... 90
Figure 3.2: Principal Stresses, Cross Section, Traditional Routing ... 91
Figure 3.3: Expected Principal Stress Direction, Cross Section, Modern Routing...91
Figure 3.4: Round Hole in an Infinite Plate ... 92
Figure 3.5: Southwest of Norway...95
Figure 3.6: Location of the H0yanger Lainefjord Tunnel ... 96
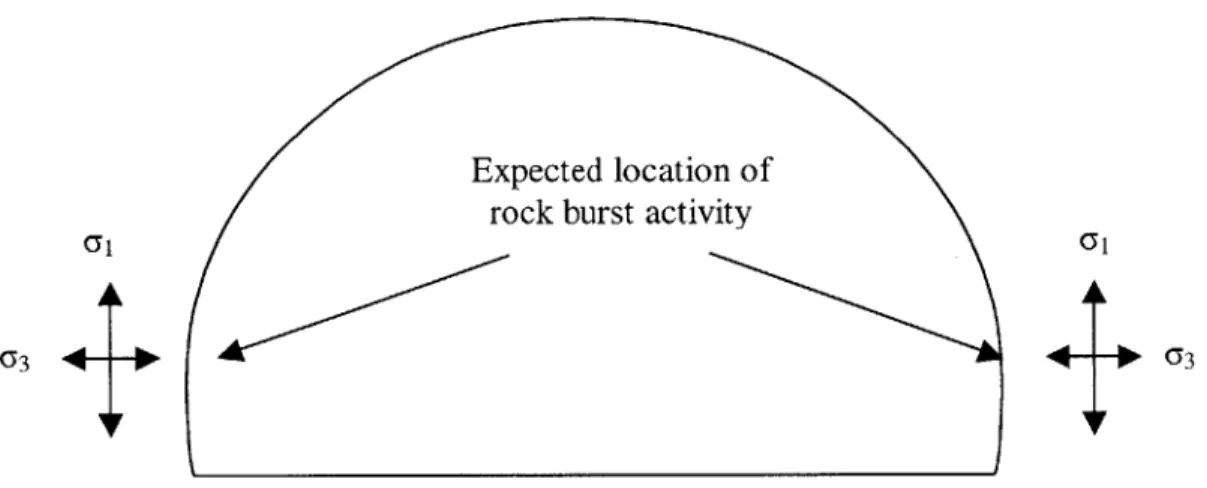
Figure 3.7: Expected location of rock burst activity and direction of principal stresses...97
Figure 3.8: Encountered location of rock burst activity and direction of principal stresses 200m from the face ... 98
Figure 3.9: Principal Stress Directions from Measurements, Cross Section, Hoyanger L ainefjord Tunnel... 99
Figure 3.10: Principal Stress Directions from Measurements, Plan View, Hoyanger L ainefjord Tunnel... 99
Figure 3.11: Tangential Stress Distribution around the Tunnel... 102
Figure 3.12: Bolting Scheme for Rock Burst in the Roof ... 104
Figure 3.13: Cost as a function of driving rate... 106
Figure 3.14: W est of N orw ay... 108
Figure 3.15: Tafjord and the Heggura Tunnel ... 109
Figure 3.16: Classification According to Russenes, 1974... 111
Figure 3.17: A lternative Cross Section... 115
Figure 3.18: Number of Rock Bolts Needed as a Function of Rock Burst Class ... 116
Figure 3.19: Japan, Island of H onshu... 119
Figure 3.20: K an Etsu Expressw ay ... 120
Figure 3.23: Figure 3.24: Figure Figure Figure Figure Figure Figure Figure Figure Figure Figure Figure Figure Figure Figure Figure 3.25: 3.26: 3.27: 3.28: 3.29: 3.30: 3.31: 3.32: 3.33: 3.34: 3.35: 3.36: 3.37: 3.38: 3.39:
D rillholes w ith Steps... 124
Experiences with Fiberglass Bolts and Steel Rebars with Fast Hardening R e sin ... 12 5 Sw ellex R ock B olt ... 126
Bolting of the Face with Swellex Rock Bolts ... 127
Stress Concentrations at the Edges of the Face ... 128
Ertan Dam Project, China ... 131
Planview of the Ertam Dam Project ... 133
Planview of the Ertan Powerhouse Complex... 134
Cross Section of Ertan Powerhouse Complex with Instrumentation... 134
3D view of the Ertan Powerhouse Complex, Diversion and Penstock Tunnel ... Rock Fall due to Rock Burst in Turbine Outlet... Rock Burst in Turbine Outlet ... Dram ix@ Steel Fibers ... Cross Section Powerhouse Cavern with Cable Anchors ... Stress Concentrations in the Corners of the Caverns... Prestressed Cable Anchors in Caverns ... Tunnels with Rock Busts in New York ... 135 138 139 142 143 144 145 149 Chapter 4 Figure 4.1: Damage to Rock Bolts from Strain Burst (Kaiser & Tannant, 1999)... 153
Figure 4.2: Small (left) and Moderate Scale (right) Spalling (Kaiser & Tannant, 1999).. 154
Figure 4.3: Moderate Strain Burst Damage (Kaiser & Tannant, 1999) ... 155
Figure 4.4: Severe Strain Burst Damage (Kaiser & Tannant, 1999)... 156
Figure 4.5: Closeup of Fractured Grouted Rebar (Ortlepp, 1992)... 156
Figure 4.6: Seismically Induced Fall and Wedge Failure (Kaiser & Tannant, 1999)... 157
Figure 4.7: (K aiser & Tannant, 1999) ... 157
Figure 4.8: Primary Functions of Support (McCreath & Kaiser, 1992)... 158
Figure 4.9: Recommended Survival Limits for Holding Elements (Kaiser, 1993)... 163
Figure 4.11: Load-Deformation Curves for Various Tendons (Stillborg, 1994)... 165
Figure 4.12: Mechanically Anchored Rock Bolt with Provision for Grouting (Hoek, 2000) ... 16 7 Figure 4.13: Cement Grouted Rebar (Hoek, 2000)... 168
Figure 4.14: Grouted Cable (Hoek, 2000)... 169
Figure 4.15: Resin Grouted Rebar (Hoek, 2000)... 170
Figure 4.16: Split Set Bolt (Ingersol-Rand)... 171
Figure 4.17: Sw ellex Bolts (H oek, 2000) ... 172
Figure 4.18: Cone Bolt Yielding Tendon (Jager, 1992)... 173
Figure 4.19: Yield Force-Displacement Curves... 174
Figure 4.20: Hydraulic Prop with Load Spreader ... 175
Figure 4.21: Forces Specified for Various Functional Requirements ... 176
Figure 4.22: Characteristics of Mesh (Ortlepp, 1983)... 177
Figure 4.23: Relative Movement of Rock and Shotcrete ... 180
Figure 4.24: Post peak stiffness... 183
Figure 4.25: Effect of Interface Shear on Post Peak Stiffness (Kaiser, 1993)... 183
Figure 4.26: Detail Mesh-Rock Bolt Connection (Kaiser, 1993) ... 185
F igure 4 .27 : L acing ... 187
Figure 4.28: Shepherd's Crook... 187
Figure 4.29: Categories of Failure from a Design Perspective (Ortlepp, 1992)... 197
Figure 4.30: Proposed Conceptual Design Chart (Kaiser, 1993)... 199
Figure 4.31: Empirical Relationship of Stress Field Change (Kaiser, 1993)... 199
Figure 4.32: Seismic Design Sequence (Kaiser, 1993) ... 200
Figure 4.33: Burst Potential & Failure Mode (Hoek, 1992 modified) ... 201
Figure 4.34: Energy Considerations for Yielding and Rigid Support (Ortlepp, 1992)...204
Figure 4.35: Energy Absorbed by Bolts (Ortlepp & Stacey, 1994)...204
Figure 4.36: Kinetic Energy as a Function of Ejection Velocity and Thickness ... 207 Figure 4.37: Guidelines for Support Levels in Burst Prone Ground (McCreath & Kaiser,
Chapter 5
LIST OF TABLES
Table Page
Chapter 2
Table 2.1: Type I and Type II Rock Burst, modified after Johnston 1988...31
Table 2.2: Summery of Velocities Estimated from video records ... 44
Table 2.3: Classification of Seismic Event Sources (Ortlepp, 1992)...47
Table 2.4: Criteria to Predict Spalling Initiation... 61
Table 2.5: Criteria to Predict Depth of Failure ... 62
Table 2.6: Summary of Case histories by Martin et al., 1999... 69
Table 2.7: Properties of Some Witwatersrand Rock (Hill and Denkhaus, 1961) ... 72
Table 2.8: Relation of High Rock Properties...76
Table 2.9: Relation of Low Rock Properties...77
Chapter 3 T able 3.1: Project D ata ... 94
Table 3.2: (e in the roof and the wall of the tunnel... 101
Table 3.3: Typical Rocks in the Heggura Tunnel ... 112
Chapter 4 Table 4.1: Stretch Limits of Tendons (Hedley, 1992 & Stillborg, 1984)... 163
Chapter 1 Introduction
1.1 Background and Problem Statement
Rock bursts are explosive failures of rock mass around an underground opening, which occur when very high stress concentrations are induced around underground openings (Hoek, 2000). Rock burst problems are particularly acute in deep level mining in hard brittle rock. However rock bursts have been observed in a number of tunnels, shafts and other permanent underground structures in hard brittle rock. The latter will be the main focus of this thesis. Rock bursts in tunnels represent a significant threat to the safety of tunnel workers and equipment, as well as a significant factor with respect to performance of tunneling contracts. As depths and locations have become increasingly challenging more cases of rock bursting in tunnels have been reported. Chapter 2 of this thesis provides more details on mechanisms, causes and impact.
Rock bursts have occurred in many countries. However, most research was carried out in a fairly isolated manner. Most studies of rock burst events were done in individual localities without relating them to other regions. Similarly, significant related research in rock mechanics carried out over the last 25 years in countries like Russia, Japan and China was almost unnoticed and difficult to access for the English-speaking world. For this reason the cases and sources in this thesis are somewhat focused geographically on the U.S., Canada, Europe and South Africa unless a project with international participation is involved.
Some of the mines where rock bursts have occurred in, are the deep level gold mines in the Witwatersrand area in South Africa, the Kolar gold mines in India, the El Teniente copper mine in Chile, the Canadian nickel mines in Sudbury, the Idaho Coeur d'Alene area mines in the US and the gold mines in the Kalgoorlie area in Australia. Some engineering structures where rock bursts have occurred are underground openings for hydro-electrical power plants in China and Norway, Japanese Tunnels and Norwegian tunnels.
Because rock bursts, are much more common in mines than in tunnels, shafts and caverns most available research is in mining engineering rather than civil engineering. Even though publications show that there are differences in the conceptual understanding of rock bursts that seem to root from the background of the authors (Myrvang & Grimstad, 1983 vs. Ortlepp, 1979), rock bursts always involve the violent ejection of rock from the surface of the tunnel whether encountered in mining or civil engineering. The practical implementation however can be significantly different depending on the purpose of the structure. For both mines and civil engineering underground openings the main problem rock bursts create is safety during underground work. Efforts have been made to find methods to predict rock bursts, to develop support systems that can resist rock bursts or appropriate countermeasures that will prevent rock bursts.
1.2 Research Objectives
The main focus of this thesis is on permanent engineering structures like tunnels, shafts and caverns. The thesis provides an overview of research carried out on rock bursts in these structures as well as relevant rock burst research in the mining area. It demonstrates in case studies that rock bursts have significant impact on the overall project cost and time and are not only a structural problem. The summary shows that conclusions from the available research and the practical countermeasures against rock burst are diverse. It can be seen that there might not be one best approach how to deal with rock burst problems. Therefore this thesis presents available options and illustrates on the basis of case studies how these were applied.
Rock burst events are relatively concentrated in a few regions in the world. From the cases presented one gets an impression in which regions and conditions rock bursts are most likely to occur. Methods on how to predict rock bursts are presented. Exact temporal and spatial prediction of rock bursts will not be possible, but the cases and methods presented will help to evaluate potential rock burst risk.
1.3 Organization
Chapter 2 describes general characteristics of rock bursts. The difference in source and damage mechanisms is explained. Causes and factors influencing rock bursts are
discussed.
Chapter 3 presents case studies on rock bursts in civil engineering projects in Norway, China, Japan and the United States.
Chapter 4 presents observations from damage to tunnel support from rock bursts. Functions, components and desired characteristics of support systems for rock burst conditions are described. Support systems currently used in mines for rock burst conditions are presented. Design rationales, considerations and examples are introduced.
Chapter 5 presents methods for prediction and prevention of rock bursts.
Chapter 6 presents a summary of the thesis, conclusions from the research and recommendations for future research on this topic.
Literature
Hoek, E. (2000); Practical Rock Engineering 2000 edition, work in progress
Myrvang, A.; Grimstad, E. (1983); ,,Rockburst Problems in Norwegian Highway Tunnels-Recent Case Histories"; In Rockburst Prediction and Control; p.133-139; Institute
of Mining and Metallurgy
Ortlepp, W.D. (1978); The Mechanism of a Rockburst"; In Proc. 19th U.S. Symposium on
Chapter 2 Characteristics of Rock Bursts
2.1 General Characteristics of Rock Bursts
2.1.1 Description
The term "rock burst" is commonly used to describe a wide range of rock failures, which occur in tunnels, shafts, caverns and mines. It is used to describe the expulsion of small rock fragments from the surface of mine pillars or the tunnel perimeter, which sometimes is referred to as "spitting rock", as well as for the sudden collapse of a pillared mining area greater than hundred thousands of in2. Some examples of underground openings damaged
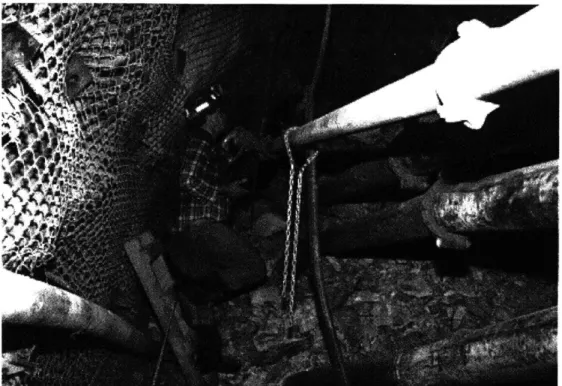
by rock bursts can be seen in Figure 2.1 to Figure 2.4. Blake (1972) describes rock burst as
"a sudden form of rock failure characterized by the breaking up and expulsion of rock from its surroundings accompanied by a violent release of energy". Hoek (2000) states that "rock bursts are explosive failures of rock mass around an underground opening, which occur when very high stress concentrations are induced around underground openings". By adding the phase of mining or the cause to it, the term "rock burst" is sometimes used more restrictively. Terms such as "pillar bursts", "pressure bursts", "strain bursts", "crush bursts", "inherent bursts" and "induced bursts" and many more can be fund in the literature.
Figure 2.1: Rock Burst Damage in a Gallery (U.S. Bureau of Mines, Spokane)
Figure 2.3: Heavy Rock Burst Damage (U.S. Bureau of Mines, Spokane)
Rock bursts shall be defined here as: "Any sudden and violent expulsion of rock from its surroundings, the phenomenon resulting from the static stress exceeding the static strength of the rock as a result of a seismic event, or directly associated with a seismic event, and the result being of sufficient magnitude to create an engineering problem. There are no constraints on the magnitude or type of seismic event. It only needs to produce enough energy to cause damage in the tunnel." (Obert, 1967; Ortlepp & Stacey 1994)
As pointed out in Chapter 1 rock bursts have occurred in many parts of the world. It is noteworthy that most rock burst events are concentrated in certain areas. Bennett, Marshall and Cook (1999) researched 62 areas worldwide where there have been historical reports of rock bursts. From 1995 to 1999 they recorded that 900 seismic events occurred within
50 km of 34 of these mining areas (Figure 2.5). The closed circles indicate a site with at
least one event. Open circles show sites with none. One can conclude, that it is not an arbitrary phenomenon and that for tunnels too, rock bursts events should be concentrated in certain locations in the world. Unfortunately not enough data is available to confirm that, but the fact that relatively small countries like Norway and Japan stand out having repeated rock burst problems in tunnels shows that conditions in some locations favor rock bursts.
PmoeI ieckbgret Events
prototyp. ItremaoWl Data Centre VI a uriV r aW n W ~W aJ
{a
Fu 2o
2.1.2 Type I and Type Il Rock Bursts
Two types of rock bursts can be defined and characterized. The distinction is made according to the location of the source mechanism and damage mechanism. Chapter 2.1.7 deals with mechanisms in more detail. Type I can be directly associated with the excavating process and occurs in close vicinity of the freshly excavated underground opening. It has direct effect on the tunnel and is often referred to as strain bursts, because high stress around the opening is the trigger. Type II occurs further away and involves movement on major geological discontinuities. Type II rock bursts damage the underground opening due to the rock mass displacements resulting from transmitted shock waves. The involved magnitude and damage of type II bursts can often be considerably greater than for type I bursts, if larger volumes of rock mass are involved and/or higher stresses occur away from the excavation (Vervoort & Moyson, 1997).
Table 2.1 (modified after Johnston 1988) describes both types of rock bursts for mines. It shows that type I rock bursts are triggered directly by the mining process. The existence of type II rock bursts makes the distinction between natural and induced bursts difficult. Blasting often triggers rock bursts instantaneously. Many rock bursts, particularly large damaging events in deep underground mines, occur spontaneously and unexpectedly, despite the fact that can be caused by stress changes associated with the mining process (Rohay et al, 1999).
Type I Type II
Rate is a function of mining Not enough data to determine
Rate, Trigger activity. Trigger is the creation of
an ecavaionrelationship with mining rates. an excavation.
Generally within 100 m of mining On some preexisting fault
Location face or on some preexisting zone surface up to 3 km from the of weakness or geological mine
discontinuity near the mine.
Failure of intact Intact rock can be broken in the All occur on preexisting,
rock or disturbed rupture when mining induced possibly pre stressed tectonic
rock mass. stresses exceed the shear strength faults. Mining may simply
Orientation of of the material. Orientations of trigger these events on faults of
failure plane. rupture planes can vary. preferred orientations.
Stress change Often high stress drops observed Stress drops similar to natural earthquakes
Magnitude Low to medium Potential for high magnitudes
Table 2.1: Type I and Type II Rock Burst, modified after Johnston 1988
The fact that there is a lack of data for type II rock bursts and their association with mining activity (Johnston 1988) suggests that it can be ruled out that there will ever be enough data to link type II rock bursts directly to the excavation of normal sized tunnels, shafts or caverns. The smaller size of civil engineering underground openings is much less likely to have an impact at great distances. Moreover the seismic data acquisition for mining has been usually much more sophisticated than what is used in non-mining excavations. Rock bursts induced by excavating a civil engineering underground opening will therefore be considered to be type I rock bursts. However this does not imply that these openings cannot be affected by natural induced type II rock bursts.
2.1.3 Distinction from Other Seismic or Destructive Underground
Events
To avoid confusion several other destructive mechanisms, which differ from rock bursts, are defined here. They are sometimes related to and can occur either before or after rock bursts:
. Rock falls are collapses of loosened rock to the floor of an underground excavation. In hard rock mining rock falls and other local failures caused by bumps are the reason why bumps are often mistaken as rock bursts.
. Bumps are violent failures of rock of seismic significance that do not cause damage in the underground opening. Bumps are often mentioned in the same context as rock bursts. Bumps are seismic shocks resulting from a failure or a sudden displacement at some location in the rock mass that surrounds the underground opening. The failure can be displacements along an existing fault or the shearing of an overlaying stratum. Generally the center of the disturbance is only vaguely known. The seismic shock exhibits itself acoustically or as a shock associated with a ground motion strong enough to cause partially detached rock in the roof or on the walls of underground openings to fall. In cases where the center of the bump is close enough to the underground opening the distinction between type II rock bursts and bumps becomes difficult. In addition to the bumps caused by displacements along an existing fault or the shearing of an overlaying stratum, violent pillar failures are usually referred to as either bumps or coal bursts in coal mining. The term coal burst seems to be more appropriate, since physically it is a burst due to violent failure. Even though terminology wise the term
distinction between a bump and a burst should have preference over obvious distinctions in material. The term "burst" should therefore not be used only for bursts in non-rock environment.
. Outbursts are rapid releases of absorbed or entrapped gas as a result of rock pressure. Gas outbursts are experienced in coal-mines or salt, potash and other evaporite mineral deposits. They are usually accompanied by a violent rock failure, thus can be mistaken for bumps and rock bursts.
2.1.4 Location
For the sake of clarity principal terms will be defined. The location of the source mechanism of rock bursts, as for earthquakes, is defined by their hypocenter and epicenter. The hypocenter is the actual location of the event and is defined by the coordinates of longitude, latitude and depth. The epicenter is the surface projection of the hypocenter and does not define the dept below the surface.
2.1.5 Magnitude or Seismic Energy from Rock Bursts
The amount of energy released varies with the magnitude of the bursts. To measure the energy of local bursts ("spitting rock") one needs micro-seismic equipment, which can measure ML = -0.2 to 0 on the Richter scale. In contrast, rock bursts in mines involving large rock volume (ML = 2.5 to 5), have been measured by seismological stations 1000 km
away.
Theoretical solutions of how much energy is released during a rock burst are possible, if the stress and the involved rock mass volume is known. Weiss (1945) was the first to suggest that the source of the seismic energy might be the stored energy in the solid rock around the opening. Black and Starfield (1964) gave a theoretical solution for the strain energy stored in a pressed plate without a circular hole. Press and Archambeau (1962) gave the theoretical solution for the amount of seismic energy released by creation of a spherical cavity in rock subjected to a three dimensional stress field. Both Black & Starfield and
Press & Archambeau assumed as initial condition that there is no opening and determined how energy changes form this state to later condition with an opening.
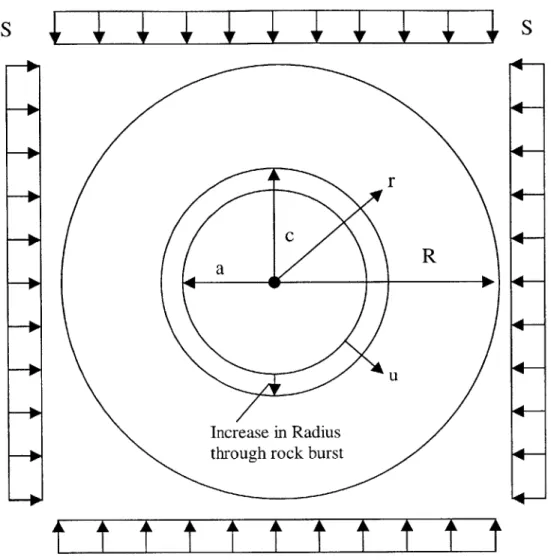
The realistic condition is, however, an opening that already exists and then is suddenly enlarged. If rock bursts occurs a layer of solid rock around the opening is removed. The result is an increase in size of the opening. Duvall and Stephenson (1965) solved this for a cylindrical and spherical opening. To really understand the energy aspect of rock bursts, the derivation of Duvall's and Stephenson's solution is essential and will be shown here for the spherical cavity. This solution is for an elastic isotropic medium and cannot make provisions for structural discontinuities.
The stresses around a spherical cavity of radius a in an elastic infinite rock mass subjected to uniform radial stress -S at a large distance from for spherical coordinates r, 0 and <p from the origin is given by
ar =-S 1- ; = =S 1 r = = T,. Equations 2.1
where a = normal stress and T = shear stress in spherical coordinates and S, a and r are defined in Figure 2.6.
Figure 2.6 shows a cross section through Duvall's and Stephenson's spherical model. The stress field illustrated is equivalent to a radial stress field with the stress S.
S
S
Figure 2.6: Cross Section Through Spherical Cavity Model by Duvall and Stephenson
Considering a sphere, all displacements are radial. Hooke's law and the strain displacement relationship for spherical coordinates give
= o,. - v
(G,
+ A , with u as radial displacement.ar E Equation 2.2
t t t t t t t t it t t
SSubstituting Equations 2.1 into Equation 2.2 gives after integration:
u = S (1- 2v)r +
(I
+V) a2E 2r
The strain energy per unit volume is 1
= (2 2 + 72 L( C, + aYa + aa
W2E x ZE xYY ZZ x G+ xy + 2 + T 2
)
Equation 2.4With Equations 2.1 and Equation 2.4 one can determine the strain energy per unit volume in the rock surrounding of the cavity as
Wa= 3S2
(-
2v)+(1+v)
W2E I2r 6 Equation 2.5
For the larger cavity with radius c, the strain energy per unit volume in the rock surrounding the cavity is
+v) C6
2rs Equation 2.6
The increase in strain energy per unit volume therefore is
32 c66s AW =Wc -Wa = 3S(+ ca 4E fVr Nj Equation 2.7 Equation 2.3 W = 32(1-- 2v)+ (1 2E I
A spherical shell of thickness dr has a volume of 4rr2dr. Therefore the increase in its strain energy is 4wr(WC - Wa )dr .The total increase in strain energy AWR in the rock from
radius c to a large radius R is:
R
AWR - r2(W -Wa)dr
C
Substituting into Equation 2.7and integrating Equation 2.8 gives
AWR = S2 +VxC6_a6) 13r(1 E (C3 With R >> c > a simplifies to A 3 S2
(I+
v) a 3 AWcR 3 ac Equation 2.8 Equation 2.9 Equation 2.10with Vac = 4I(C3 - a3) being the
3 volume of material removed, when the radius of the
cavity is increased from a to c. As a result of removing this volume of material, the strain energy in the rock mass surrounding the cavity with the new radius c has increased by
AWeR .
The energy added to the medium surrounding the cavity by the applied stress field can be determined for any spherical surface with the radius R, the area 47rR2 and the total radial
AWac = f4ZR2*.,du
The value du is the radial displacement that takes place when the radius of the cavity is increased from a to c. It can be obtained by differentiating Equation 2.3 with respect to a.
du - 3S(+V)a da Equation 2.12
2ER2
Substituting Equations 2.1 and Equation 2.12 into Equation 2.11 gives
6S27(+v)j' 2 a
A~a = E a R3a Equation 2.13
which solves to
AWac 6S27(1+v) c3 -a 3 C
6 6
E 3 6R' Equation 2.14
which simplifies for R >> c and R >> a to
AWac = 3S2 (+v)Vac ,withVac = 4,(C3 - a3) being the material
2E 3
removed as the radius increases from a to c.
Equation 2.15 determines the work done by the applied stress field at a radius of R when the cavity size is increased from r = a to r = c. Equation 2.10 determines the increase in total strain energy in the rock from r = c to r = R. The difference between the two is the
seismic energy Ws released.
Equation 2.15
W, = AWac - AWR = Vac 1
4 E
simplifies for c >> a or if a =0 and E = 2G(1+v)to
3S2(VVa 3S2V
3 v )V E(+ 3 S 2
s4 E 8 G
Equation 2.17
Duvall and Stephenson also calculated the seismic energy release for a circular tunnel. The derivation is similar to the one for the sphere shown here. The final equation for the circular tunnel is
1 S2 W =- Va c
2 G
Equation 2.18
The small difference between the factors 1 and suggests that the shape of the cavity does not have a significant effect on the seismic energy released during rock bursts.
Equation 2.16 a 3
1.E+14 1.E+13 1.E+12 1.E+1 1 1.E+ 10 1.E+09 1 .E+08 1.E+07 1 .E+06 1 .E+05 1 E+04 1.E+03 1.E+02 1.E+01 1.E+00
1.E 1.E+05 1.E+06 1.E+07 1.E+08
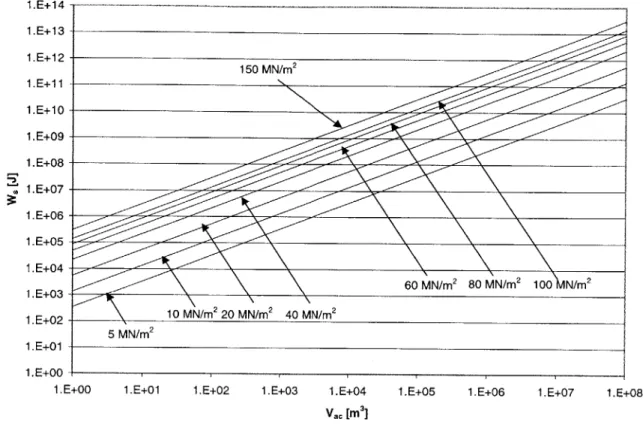
Figure 2.7: Seismic Energy W, as a Function of Stress and Involved Rock Volume Vac for Stresses from S=5 MN/m2 to S=150 MN/m2
To get an idea how much seismic energy a tunnel support has to withstand, if a rock burst occurs close to the tunnel Equation 2.18 can be normalized to the surface area of the initial tunnel. 1 is the tunnel length, a the radius of the initial tunnel and d the thickness of the ejected rock mass.
1 S2 y S 2 _c2 2_ _ 1 S2 l{a+d2 -a2
2G A 2G A 2G A
1 S2 l(2ad+d2 2 s2 (2ad+d2
2G A 4Ga
Equation 2.19
1.E+01 1.E+02 1.E+03 1.E+04
Vac [M3] 150 MN/m2 60 MN/m2 80 MN/m2 100 N/m2 10 MN/rn 20 MN/rn 40 MN/rn 5 MN/m2 +00
2.1.6 Peak Particle Velocity and Repetitive Damage
In search for some basic parameters to characterize the damage potential of a seismic event, attention has been focused on peak particle velocity (ppv). Peak particle velocity alone is insufficient to determine the damage potential. The same ppv can cause damage of various scopes depending on the damage mechanism. Chapter 2.2 explains source and damage mechanisms in detail. It has also been found, that a single exposure to high peak particle velocities does not necessarily cause high damage. The number of impacts plays an important role as well. As can be seen from Figure 2.8 a remotely triggered rock burst is exposed to more than one shock wave. Figure 2.8 shows the back-calculated magnitude (M*) over time of the source mechanism for a rock burst event at Creighton mine in November 1990. Particularly remarkable is the seismic activity about an hour before the main event. 3.19 ~1 hour 4A
2F
9
Z.s C 9 1~0 0 0 ON 06ooc C 0 6-C;-Time [min.; not to scale]
2.1.7 Ejection Velocity
In order to establish an energy based design approach for certain damage mechanisms in
burst prone ground (Chapter 4), one needs parameters to determine the released energy. Since velocity squared is proportional to energy, the ejection velocity is an important parameter. Yi & Kaiser (1993) supply theoretical estimations of ejection velocities considering block size and peak particle velocities. Tannant, McDowell, Brummer, and Kaiser (1993) measured ejection velocities in a rock burst simulation experiment. They installed blast holes in the wall of a tunnel and triggered rock bursts with explosives. Ejection of blocks was recorded with video cameras and the ejection velocity ve was determined from the images for single blocks and for the entire mass from ballistic trajectories (Equation 2.20).
ve =D g Equation 2.20
2H cos2 6+Dsin26
D is the horizontal distance and H is the vertical distance the block travels and 0 is the
initial ejection angle measured upwards from the horizontal.
The sequence of events during the blasts was as follows: Small rock fragments were ejected from wall 4 Ejection of rock starts cutting through wires of velocity probes 4 Ejection of smaller rock blocks 4 Large volumes of rock start to eject - Bulk of the
ejected rock in motion 4 Largest blocks in motion 4 Most ejected rock on floor 4 Gravity driven blocks fall to the floor.
Mass Ve (mis) Number of blocks
<5 kg 4,4,5,6,6,6,7,9,10,22 10
5kg to 10kg 4,5,5,6,6,7, 6
10kgto25kg 8 1
25 kg to 50 kg 4,6 2
Table 2.2: Summery of Velocities Estimated from video records
A summery of velocities estimated from video records is given in Table 2.2. This confirms
the observation that the largest blocks, which were found closest to the tunnel wall had the lowest ejection velocities. These results confirm, what Ortlepp (1992) observed: ejection velocities of up to 10 m/s are a reasonable assumption for design but higher ejection velocities are possible.
2.2 Mechanisms
It is essential to understand that the rock burst and the seismicity is not necessarily the same event. Not only can they occur in different locations, but also at different times. A distinction between two groups of mechanisms when dealing with rock bursts is therefore necessary:
. Source mechanisms . Damage mechanisms
The source mechanism is the mechanism that causes the seismic event, which leads to the rock burst at the location of the damage mechanism. The source mechanisms hypocenter can be far away from the location of the damage. The damage mechanism is the mechanism actually observed which causes the damage directly and its location is identical with the damage. In recent years seismological studies have provided considerable insight into the source mechanism, but studies of the mechanism of damage are less advanced (Ortlepp 1992).
2.2.1 Source Mechanisms
It has been found that the source mechanism is often controlled by the mine layout and regional structures such as faults and dykes (Durrheim et. al., 1998). It is useful to divide
them into two groups. These two groups are the same as for the classification into type I and type II rock bursts mentioned earlier. To illustrate how impulsive loading on a tunnel can vary in nature and intensity, the main five source mechanisms will be discussed here briefly. Since it is the source mechanism which determines the intensity of the seismic event the listing of source mechanisms will be in ascending order of energy magnitude:
. Group A, self triggered rock bursts; source mechanism and damage mechanism probably coincide:
o Strain bursting o Buckling o Face crushing
Strain bursting occurs at the surface and is strongly influenced by the stress concentrations of the tunnel surface. Failures due to buckling and face crushing are also by the openings in the immediate vicinity.
. Group B; remotely triggered rock bursts; source mechanism and damage mechanism most likely do not coincide:
o Virgin shear in rock mass
These mechanisms are failures on a plane and their extent could be hundreds of meters. They can be far away from the cavity and are likely to occur only in association with wide-ranging mining activities.
Ortlepp (1992) has listed all five mechanisms and lists fundamental nature and seismic magnitude (Table 2.3). They are listed in ascending order of energy magnitude and the group according to the above scheme has been added to the table. All five mechanisms have been observed to occur in mining areas. In a civil engineering environment the first mechanism is most likely to be the most common. The second and third mechanisms are less likely to occur. As mentioned earlier the fourth and fifth can be ruled out, as they only occur in association with wide-ranging mining activities.
Richter
Seismic Postulated Source First Motion from .
Group Magnitude
Event Mechanism Seismic Records
ML Strain- Superficial spalling with Usually undetected; -0.2 to 0 bursting violent ejection of fragments Could be implosive
Outwards expulsion of
pre-Buckling A existing larger slabs parallel Implosive 0 to 1.5
to opening
Face Violent expulsion of rock
A Implosive 1.0 to 2.5
Crush Afrom tunnel face
Shear ~Violent propagation of shear Dobecul
Shear Double-couple
B fracture through intact rock 2.0 to 3.5
rupture shear
Faul-slp B Violent renewed movement Double couple
Fau t-slp B2.5 to 5.0
on existing fault shear
2.2.2 Damage mechanisms
Local rock conditions and support systems strongly influence the location of the damage mechanism and severity of the damage (Durrheim et. al., 1998). There is no comprehensive study published on the mechanics on rock burst damage. From the definitions available, Ortlepp's (1992) categorization into observed types of damage will be used as a guideline. According to Ortlepp (1992) damage mechanisms can be classified as:
. Strain bursting or small scale buckling (2.2.2.1) . Buckling (2.2.2.2)
. Ejection (2.2.2.3) . Arch collapse (2.2.2.4)
. Other: implosive type damage (2.2.2.5)
Only the strain bursting and buckling mechanism are likely to occur in a civil engineering cavity. The others are restricted to mining tunnels.
2.2.2.1 Strain Bursts
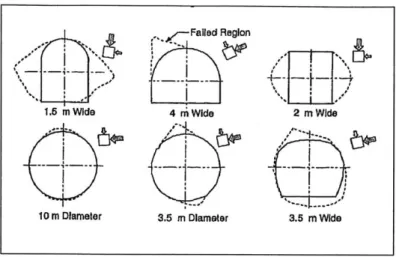
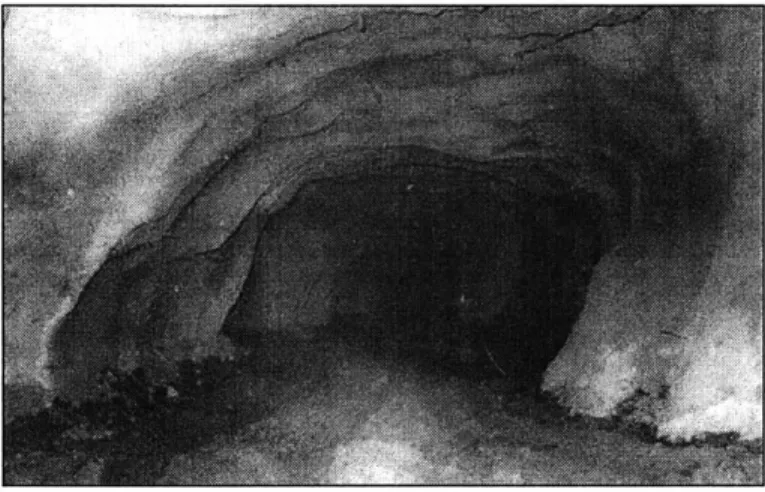
Strain bursts are the most common damage mechanism in civil engineering excavations. Fragments of rock are violently ejected locally from the rock surface. Figure 2.9 shows the typical geometric characteristics of a strain burst from a tunnel surface. Strain bursting is most likely to occur 1 to 6 tunnel radii away from the face. In some cases it was observed (Stillborg & Hamrim, 1990) to occur in the face itself. The locations in the cavity from which the fragments may be ejected vary, depending on the orientation of the in-situ stress field and the geometry of the cavity profile. In the case of the Norwegian highway tunnels it was observed (Broch & Sorheim, 1984) that the topography and its effect on the in-situ stress field determine the extent of rock bursting around the circumference of a tunnel in a single cross section (Figure 2.10).
Faled Region
1.5 m Wide 4 rn Wide 2 m Wide
10 m Diameter 3.5 m Diameter 3.5 m Wide
Figure 2.10: Effect of Stress Field and Cavity Profile and Damage Location (Martin et al., 1999)
The ejected fragments usually are thin plates with very sharp edges. The surfaces of the ejected fragments usually indicate extensional fracturing. It is believed that the mechanism is buckling of the thin diaphragm, slab or column rock (Ortlepp&Stacey, 1994). A typical fragment can be seen in Figure 2.11. The fragments are usually not very large, but large enough to be hazardous due to their mass. The main safety concerns arise due to their sharp edges.
All Rock burst problems described in Chapter 3, which occurred in Norway (Broch &
Sorheim, 1984; Grimstad 1986; Myrvang & Grimstad, 1983), in Japan (Stillborg & Hamrim, 1990), in China (Kuitenbrouwer, L.; 1997) and in New York (Binder 1978) are classifiable as strain bursts mechanisms.
Figure 2.11: Strain Burst Fragment
The following six conclusions can be drawn from reported strain bursting events:
1. Strain bursting is more likely to occur in more massive rock types than in heavy
jointed and fractured rock. Broch & Sorheim (1984) showed that rock bursting
activity increased with increasing rock strength.
2. Strain bursting is more likely to occur in a machine-excavated tunnel than in a tunnel where the drill and blast excavating method is used. Stacey & Thompson
(1991) reported a case of two tunnels. One was driven using a roadheader and the
other one by drill and blast. In the tunnel using the roadheader violent slabbing occurred, but no slabbing was recorded for the neighboring tunnel using drill and blast. Drilling and blasting causes the rock around to fracture and consequently distresses it. The fractured distressed rock is much less burst prone.
3. Strain bursting does not only occur in brittle rock, but is more likely to be more
severe in brittle rock. Stacey & Thompson (1991) reported strain bursting in
non-brittle kimberlite. Bursts in sandstones, siltstones and shales were reported by Sperry & Heuer (1972).
4. High stresses are not necessary for strain bursting. Stacey (1989) estimated that
fracturing in tunnels i.e. strain bursting could start at 15% of the rocks uniaxial compressive strength.
5. Fracturing of rock in a machine-excavated tunnel can cause significant cutting
problems. High cutter wear, blocking of mucking chutes, compacting of the cutter
head, high torque demand, cutter head vibration and drill string failure have been reported by Stacey (1989) and Stacey & Harte (1989) in deep-level raise boring, a boring method used in mining. Satisfactory gripper contact may be impossible to achieve in cases of severe strain bursting from the tunnel sidewalls.
6. Encountering strain bursting conditions might significantly decrease tunneling
progress rates. Sperry & Heuer (1972) reported a decrease of up to 25%, Myrvang
& Grimstad (1983) of up to 50%. Binder (1978) states that strain bursts in the face
2.2.2.2 Buckling
Figure 2.12 illustrates a rock burst buckling damage mechanism. It is most likely to occur in a laminated or transversely anisotropic rock environment. Buckling can occur anywhere around the tunnel where the orientation of the geological structure facilitates buckling instability.
Previo us failure due
to high horizontal
Figure 2.12: Geometry of a Buckling Event (Ortlepp&Stacey, 1994)
The slabs have buckling potential because of the strain energy, which is stored in them. A seismic shear or compression wave initiated by a distant source can trigger the failure by adding additional energy. In case of resulting instability (buckling) the locally stored strain energy will be released. Buckling has a dual nature of the energy sources causing the failure. The location of the cause of the local source mechanism (strain energy) and the damage mechanism is the same, even though the initiating source mechanism of the seismic wave can be far away.
Semadeni (1991) reports rock bursts with buckling as a damage mechanism to have taken place in the Strathcona Mine in Canada (Figure 2.13). The Richter magnitude was 1.8 to
2.3 and about 300 tons of rock were expelled from the face, roof and side walls.
Figure 2.13: Buckling at the Strathcona Mine, Canada (Ortlepp&Stacey, 1994)
JIT SET
CRAIG HAULAGE DRIFT
FAUL s ... BU BURST AREA
TIME DEPENDENTr\
2.2.2.3 Ejection
The damage mechanism is the ejection of a part of the tunnel wall, roof or floor (Figure 2.14). It is most common in mines and manifests itself with extreme violence. Present existing joints and induced fractures determine the freedom of movement and the shape of the ejected block. The direction of ejection is closely related to the direction of the short term energy wave triggering the ejection. A seismic event is the source of energy and its magnitude and proximity to the tunnel determine the extent and violence of the damage. Its epicenter can be at some distance from the damage zone; hence the source and damage locations are not the same.
-Vi
incident seismic wave
Figure 2.14: Geometry of an Ejection Event (Ortlepp&Stacey, 1994)
Damage observations in numerous mines and simulated rock burst with blasting suggest that typical ejection velocities are up to 10 m/s. Considering the substantial size of the ejected blocks they possess high energy and high damage potential. Fortunately, this type of damage mechanism is unlikely to occur in civil engineering projects, since seismicity at a distance (virgin shear in rock mass or reactivated shear on existing faults and/or shear
rupture on existing discontinuities) is the source mechanism, which is much more common in mining than civil engineering.
2.2.2.4 Arch Collapse
This type of rock burst damage mechanism is frequently observed. It can be viewed as a subcategory of the ejection damage mechanism. Figure 2.15 illustrates the geometry of an arch collapse. A well-defined geological structure or/and induced fracturing makes the kinematic movement of large blocks and wedges due to gravity easier. The trigger, again, is the seismic wave energy from a source mechanism. Its epicenter can be quite distant to the damage location. The superimposed forces from gravity and acceleration due to seismic waves lead to shearing on well-defined surfaces. It has been observed quite frequently that wedge movements shear off rock bolts, when this damage mechanism occurs.
Figure 2.15: Geometry of an Arch Collapse Event (Ortlepp&Stacey, 1994)
2.2.2.5 Other Damage Mechanisms
Ortlepp (1992) describes two further damage mechanisms. They are depicted in Figure
2.16 and Figure 2.17. Implosive damage mechanisms (Figure 2.16) have been observed in
mining tunnels. They result from roughly symmetrical, massive radial displacements of the fractured ring around the tunnel.
Figure 2.16: Implosive Damage Mechanism
The inertial displacement mechanism in (Figure 2.17) so far is only hypothesized. It assumes failure in the sidewall farthest away from the seismic source. The failure has low ejection velocity. One can imagine the tunnel moving from the shaking and the ejected wall remaining in place. Both, the implosive damage mechanisms and inertial
displacement mechanism, are unlikely to occur in a civil engineering underground opening and are therefore not discussed further.
a) Concept
Symmetrical, uniformly inward radial displacement
b) Kinematics
imo - sb Possible
Sidewall
ore comi:
7/---;b4Z Inertia of sidewall slabs causes detachment and collapse
LcJ Moss displacement
-.. V
p
Figure 2.17: Inertial Displacement Mechanism --. V
2.3 Depth of failure for Strain Bursts
From experience with strain bursts in tunnels it was observed that bursting will stop when a certain depth of failure is reached. Martin et al. (1998) and Kaiser et al. (1996) developed equations to determine the failure depth. The progressive failure stops when the stress drops below the rock's strength and/or a more stable excavation shape (Figure 2.18) has been created.
Figure 2.18: Shape after Strain Bursts Halted and Ressupport with Shotcrete (Kaiser & Tannant, 1999)
For circular tunnels, the depth of failure (df) is defined as the depth from the originally excavated tunnel boundary to the point where spalling stops (Figure 2.19). At this point the rock mass is self supporting under static conditions after the rock burst.
Figure 2.19: Depth of Failure
Several criteria to predict the initiation of spalling (Table 2.4) and depth of failure (Table
2.5) have been developed. The main factor is the ratio between the major principal stress in the far field (c51) and the unconfined compressive strength (a). The higher this ratio is the more intense the spalling.
Spalling initiated when a1/ac > 0.2 Ortlepp et al. (1972)
SFR (3c51-CY3)/IQ > 0.8 Wiseman (1979) Stable (c1/c~ < 0. 1)
Minor Spalling (0.3 >ci/c5> 0.2) Hoek & Brown (1980) Severe Spalling (a1/ac>0.3)
Extension Strain E > Ecr Stacey (1981)
m =0 approach Kaiser (1994)
FLAC modeling with strain-dependent
cohesion and friction strength components
df/ a =1.34 (3ai1C3)/Gc -0.57 (±-0.1) Kaiser et al. (1996)
df a= 1.25 (3G1-c3)/G, -0.51 (±0.1) Martin et al. (1996)
m= 0; s= 0.112 Martinet al. (1996)
Table 2.5: Criteria to Predict Depth of Failure
Martin et al. (1996) use special Hook & Brown parameters (m = 0, s = 0.112) not as a
failure criterion, but to estimate the depth of failure with linear elastic stress analysis.
There are three important aspects from the above listed studies. First that cai/c is the main indicator. Second that the depth of failure is finite and determinable. And third, that the static stress level largely controls the depth of failure. Therefore the impact of dynamic stresses is not great for strain bursts. The third aspect will be illustrated by an example of the research done by Kaiser et al. (1996).
Kaiser et al. (1996) plotted the ratio depth of failure to original radius (df / a) over the ratio maximum elastic stress at the circular opening to unconfined compressive strength (Gmax/ac