HAL Id: tel-01511066
https://tel.archives-ouvertes.fr/tel-01511066
Submitted on 20 Apr 2017HAL is a multi-disciplinary open access
archive for the deposit and dissemination of sci-entific research documents, whether they are pub-lished or not. The documents may come from teaching and research institutions in France or abroad, or from public or private research centers.
L’archive ouverte pluridisciplinaire HAL, est destinée au dépôt et à la diffusion de documents scientifiques de niveau recherche, publiés ou non, émanant des établissements d’enseignement et de recherche français ou étrangers, des laboratoires publics ou privés.
radiofrequency ablation
Solenn Toupin
To cite this version:
Solenn Toupin. Cardiac MR thermometry for the monitoring of radiofrequency ablation. Human health and pathology. Université de Bordeaux, 2016. English. �NNT : 2016BORD0346�. �tel-01511066�
Titre : Thermom´etrie IRM pour le suivi des ablations radiofr´equences sur le cœur
R´esum´e : Le traitement des arythmies cardiaques par ablation radiofr´equence est une proc´edure th´erapeutique permettant de restaurer un rythme normal par destruction thermique des tissus arythmog`enes. A l’heure actuelle, l’intervention est r´ealis´ee sans imagerie temps r´eel perme-ttant de visualiser la l´esion pendant l’ablation. La thermom´etrie IRM permet de mesurer la temp´erature du tissu en chaque pixel et d’estimer directement l’´etendue de la l´esion via le cal-cul de la dose thermique cumul´ee. Si cette technique est d´ej`a ´etablie pour guider l’ablation de tumeurs dans diff´erents organes, elle reste difficile `a mettre en œuvre sur le cœur, notamment `
a cause des mouvements de respiration et de contraction myocardique. Dans le cadre de cette th`ese, une m´ethode de thermom´etrie cardiaque a ´et´e impl´ement´ee pour r´ealiser une cartographie temps r´eel de la temp´erature du myocarde en condition de respiration libre. Plusieurs s´equences IRM rapides ont ´et´e d´evelopp´ees pour permettre l’acquisition d’environ 5 coupes par battement cardiaque avec une taille de voxel de 1.6×1.6×3 mm3. Plusieurs solutions de r´eduction des mou-vements hors plan de coupe ont ´et´e ´evalu´ees : positionnement des coupes dans le sens principal du d´eplacement, suivi dynamique de la position des coupes en fonction de l’´etat respiratoire (navigateur, mesure de la position du cath´eter). Le mouvement r´esiduel et les art´efacts de sus-ceptibilit´e associ´es sont corrig´es par des algorithmes temps r´eels pour permettre une pr´ecision de la thermom´etrie IRM `a ±2◦C sur les ventricules. Ce protocole a ´et´e utilis´e avec succ`es pour le suivi d’ablations radiofr´equences chez la brebis (N=3), permettant une corr´elation (R=0.87) entre la dose thermique et la taille r´eelle des l´esions induites. Les r´esultats sont tr`es prometteurs quant `a la pertinence de cette mesure pour une estimation en ligne de l’´etendue de la l´esion pendant l’ablation. Ces m´ethodes permettent d’envisager une ´evaluation clinique `a court terme.
Mots cl´es : Thermom´etrie IRM, Arythmie, Ablation radiofr´equence, Cath´eter, Correction de mouvement
Unit´e de recherche
IHU LIRYC, Institut de rythmologie et mod´elisation cardiaque
Universit´e de Bordeaux, Centre de Recherche Cardio-Thoracique de Bordeaux, U1045 Avenue du Haut L´evˆeque - 33600 Pessac
Entreprise CIFRE
Title: Cardiac MR thermometry for the monitoring of radiofrequency ablation
Abstract: Radiofrequency ablation is a therapeutic procedure for the treatment of cardiac arrhythmia by inducing a local necrosis of the arrhythmogenic tissue. This intervention is cur-rently performed without online imaging of the lesion formation during radiofrequency delivery. MR thermometry provides a monitoring of temperature in the targeted tissue in each pixel and an immediate estimation of lesion via the calculation of the thermal dose. If this technique is well established for the guidance of tumor ablation in various organs, it remains challenging in the heart due to motion (breathing and myocardial contraction). In this work, a cardiac MR thermometry method was developed to perform a real-time temperature mapping of the heart under free-breathing conditions. Several MR pulse sequences were designed to ensure the acquisition of up to 5 slices per heartbeat with a voxel size of 1.6×1.6×3 mm3. Different solutions of minimization of out-of-plane motion were evaluated: alignment of the slices in the main direction of displacement, dynamic update of slice position depending on the respiratory state (echo-navigator, measure of the catheter position). Residual in-plane motion and associ-ated susceptibility artifacts were corrected by real-time algorithms to allow a precision of MR thermometry of ±2◦C in ventricles. This protocol was successfully used for the monitoring of radiofrequency ablation in sheep (N=3), allowing a correlation (R=87) between thermal dose maps and sizes of created lesions. These results are promising regarding the relevance of this measure for an inline estimation of the lesion extent during ablation.
Keywords: MR thermometry, Arrhyhtmia, Radiofrquency ablation, Catheter, Motion com-pensation
Remerciements
Au terme de ce doctorat, ma gratitude va tout d’abord `a Bruno Quesson qui m’a accueil-lie au sein de l’institut de rythmologie et mod´elisation cardiaque (LIRYC) pour effectuer mon stage de fin d’´etudes dans un environnement scientifique stimulant et de tr`es haute qualit´e. Je lui exprime toute ma reconnaissance pour m’avoir encourag´ee `a poursuive un doctorat sous sa direction, me t´emoignant sa confiance pour les trois ann´ees qui allaient suivre. Je le remercie d’avoir toujours su se rendre disponible pour r´epondre `a mes questions, partager son savoir et me prˆeter main forte pour des exp´erimentations souvent tardives. Sa jovialit´e, son humour et sa franchise ont amen´e une touche de bonne humeur tr`es appr´eciable.
Mes trois ann´ees de th`ese se sont d´eroul´ees dans un environnement chaleureux, convivial et stimulant. Je le dois `a tous les membres de l’IHU Liryc et particuli`erement `a l’´equipe “Imagerie”, dans le d´esordre : Val´ery, Pierre, Fabrice, Julie, Mathilde, Thibaud, J´erˆome, Alexis, Romain, Olivia, Jasmin, Florent et la toute nouvelle th´esarde Maryl`ene. Un grand merci `a mes deux co-bureaux pr´ef´er´es, Val´ery et Pierre, d’avoir partag´e avec moi ces trois ann´ees m´emorables, des d´ebuts balbutiants aux premiers articles, en passant par les congr`es `a Milan et `a Singapour. Val´ery Ozenne, “monsieur Gadgetron”, avec qui j’ai partag´e les joies de d´ecrypter et de r´ e-impl´ementer les techniques de l’´etat de l’art de la thermom´etrie IRM au d´ebut de ma th`ese. C’´etait le prix `a payer pour les premiers arrivants d’un institut nouvellement cr´e´e. Je te remer-cie pour ta bonne humeur `a toute ´epreuve, mˆeme face `a mes coups de sang certes rares mais sonores. . . “Comme dit” Pierre Bour, dont la passion incompr´ehensible pour la programmation de s´equences IDEA m’a toujours impressionn´ee ! Merci pour les potins distrayants que tu as ramen´es dans le bureau, ta maniaquerie qui nous a encourag´es `a ranger un peu de temps en temps. De ces trois ann´ees en votre compagnie, je retiens une vraie coh´esion d’´equipe avec des discussions franches et anim´ees, une aide mutuelle sans laquelle aucun r´esultat n’aurait ´et´e possible. Je remercie ´egalement Baudouin Denis de Senneville, qui nous a apport´e son expertise en correction de mouvement et en thermom´etrie, avec beaucoup de p´edagogie, de patience et de gentillesse. Ses encouragements constants nous ont bien aid´es `a pers´ev´erer face aux difficult´es. Je ne sais pas comment aurait fini ce doctorat sans sa contribution inestimable, car comme dirait Baudouin: “le diable est dans les d´etails”.
Je remercie l’entreprise Siemens Healthcare, d´esormais Healthineers, ainsi que l’Agence Na-tionale de la Recherche et de la Technologie (ANRT) pour leur soutien financier via le programme CIFRE. Un grand merci `a Matthieu Lepetit-Coiff´e, ing´enieur application Siemens `a Bordeaux, qui m’a aid´ee `a trouver ma place au sein de cette entreprise et qui m’a toujours soutenue tout au long de cette th`ese, et mˆeme apr`es. Sa connaissance des m´ethodes d’acquisition IRM et sa force tranquille ont grandement contribu´e `a la r´eussite de cette th`ese. Je le remercie de m’avoir form´ee `a l’IRM cardiaque avec autant de patience et d’avoir toujours r´epondu pr´esent pour les exp´erimentations animales, me lib´erant d’une bonne dose de stress. Je remercie Agn`es Malgouyres et Christian Bert pour m’avoir encadr´ee au sein de Siemens, ainsi qu’Andrea Plank pour son efficacit´e dans la gestion administrative, qui facilite la vie de beaucoup d’´etudiants
CIFRE. Je vous remercie de m’avoir permis de voyager pour pr´esenter mon travail: `a Milan, `
a Edimbourg, `a Singapour et enfin `a Baltimore. Je remercie ´egalement Arne Hengerer pour m’avoir accueillie au sein de son ´equipe “Advanced Therapy” `a Erlangen. Je remercie Rainer Schneider, Dirk Franger et Eva Rothgang avec qui j’ai partag´e ces quelques jours de travail et de “Bier Garten”.
Un grand merci `a Virginie Loyer et Delphine Vieillot, qui ont la tr`es lourde charge de s’occuper des gros animaux lors des exp´erimentations de l’institut. C¸ a a ´et´e un vrai plaisir de travailler avec elles, toujours dans la bonne humeur. Je remercie ´egalement Pierre Ja¨ıs et Arnaud Chaumeil, cardiologues sp´ecialis´es en rythmologie cardiaque au CHU de Bordeaux, qui ont trouv´e le temps de venir nous assister dans le positionnement des cath´eters lors des exp´erimentations animales. Ce fut l’occasion d’´echanges tr`es enrichissants qui nous rapprochent un peu plus du monde clinique.
Je remercie ´egalement Jacques Felblinger, Michel de Mathelin et Christopher Piorkowski pour avoir accept´e avec enthousiasme de faire partie de mon jury de th`ese.
Je remercie ma maman, Malou, mon papa, Christian, et ma sœur Morgane, qui m’ont tou-jours pouss´ee `a me d´epasser et `a croire en moi. Je remercie ma “Mamie Vet”, 99 ans, dont l’intelligence vive aurait m´erit´e bien des diplˆomes comme celui-ci. Je pense ´egalement `a tous mes autres grands-parents et `a ma marraine Liliane qui auraient ´et´e fiers de moi.
Merci de tout mon cœur `a Thomas pour son soutien et pour tout le bonheur qu’il m’apporte chaque jour.
Contents
Abbreviations 13 List of Figures 15 1 Introduction 19 1.1 Cardiac arrhythmia . . . 19 1.1.1 Atrial fibrillation . . . 20 1.1.2 Ventricular tachycardia . . . 21 1.2 Radiofrequency ablation . . . 211.3 Monitoring of radiofrequency ablation . . . 22
1.3.1 Electrode temperature monitoring . . . 23
1.3.2 Circuit impedance monitoring . . . 23
1.3.3 Electrogram amplitude monitoring . . . 24
1.3.4 Contact force monitoring . . . 24
1.4 Objectives of this thesis . . . 25
1.5 References . . . 26
2 Challenges of cardiac Magnetic Resonance thermometry 31 2.1 Principles of Magnetic Resonance thermometry . . . 32
2.1.1 Proton Resonance Frequency shift method . . . 32
2.1.2 Precision of temperature measurement . . . 33
2.1.3 MR dosimetry . . . 34
2.2 Fast pulse sequence imaging . . . 35
2.2.1 Single-shot Echo Planar Imaging . . . 35
2.2.2 Parallel imaging . . . 36
2.3 Heart motion . . . 39
2.3.1 Effects of heart motion . . . 39
2.3.2 MR acquisition methods for compensation of heart-induced motion . . . . 39
2.3.3 MR acquisition methods for compensation of respiratory-induced motion 40 2.3.4 Post-processing methods for in-plane motion compensation . . . 44
2.4 Correction of motion-induced B0 changes . . . 47
2.4.1 Multi-baseline approach . . . 47
2.4.2 Principal Component Analysis (PCA)-based phase modeling approach . . 48
2.4.4 Discussion . . . 51
2.5 State-of-the-art of cardiac MR thermometry . . . 52
2.6 References . . . 54
3 Improved Cardiac Magnetic Resonance Thermometry and Dosimetry for Mon-itoring Lesion Formation During Catheter Ablation 59 3.1 Preamble . . . 60 3.2 Abstract . . . 60 3.3 Introduction . . . 61 3.4 Methods . . . 62 3.4.1 Volunteer study . . . 62 3.4.2 Animal study . . . 63
3.4.3 RF ablation device and MR–Compatible EP . . . 63
3.4.4 Magnetic resonance data acquisition . . . 64
3.4.5 Thermometry pipeline . . . 65
3.4.6 Image registration . . . 65
3.4.7 Correction of respiratory-induced susceptibility changes . . . 65
3.4.8 Spatio-temporal phase-drift correction . . . 66
3.4.9 Temporal temperature filtering . . . 67
3.4.10 Thermal dose calculation . . . 67
3.4.11 Statistical analysis . . . 67
3.5 Results . . . 68
3.5.1 Volunteer temperature imaging . . . 68
3.5.2 In vivo RF ablation of the LV in a Sheep . . . 70
3.6 Discussion . . . 74
3.6.1 Study limitations . . . 76
3.7 Conclusions . . . 76
3.8 References . . . 77
3.9 Technical and practical implementation . . . 80
3.9.1 Gadgetron . . . 80
3.9.2 Hardware . . . 80
3.9.3 Temporal phase unwrapping . . . 82
3.9.4 PCA-based implementation for calculation of synthetic background phase 83 4 Combination of Principal Component Analysis and optical-flow motion com-pensation for improved cardiac MR thermometry 85 4.1 Preamble . . . 86
4.2 Abstract . . . 86
4.3 Introduction . . . 87
4.4 Methods . . . 88
4.4.1 MR Thermometry imaging protocol . . . 88
4.4.2 Image registration . . . 89
4.4.4 Volunteer study . . . 91
4.4.5 Phantom study . . . 91
4.4.6 In vivo ablation in the left ventricle of a sheep . . . 92
4.5 Results . . . 93
4.5.1 Volunteer study . . . 93
4.5.2 Phantom study . . . 94
4.5.3 In vivo ablation in the left ventricle of a sheep . . . 99
4.6 Discussion . . . 99
4.7 Conclusion . . . 102
4.8 References . . . 102
5 Feasibility of real-time MR thermal dose mapping for predicting radiofre-quency ablation outcome in the myocardium in vivo 105 5.1 Preamble . . . 106 5.2 Abstract . . . 107 5.3 Introduction . . . 107 5.4 Methods . . . 108 5.4.1 Volunteer study . . . 108 5.4.2 Animal study . . . 108
5.4.3 Radiofrequency ablation device . . . 109
5.4.4 Imaging protocol . . . 109
5.4.5 MR thermometry pipeline . . . 110
5.4.6 Post-ablation visualization . . . 113
5.4.7 Macroscopic examination and lesion size measurements . . . 113
5.5 Results . . . 113
5.5.1 Volunteer study . . . 113
5.5.2 In vivo radiofrequency ablations monitoring . . . 116
5.5.3 Post-ablation lesion size measurements . . . 117
5.6 Discussion . . . 119
5.6.1 Limitations . . . 121
5.7 Conclusion . . . 122
5.8 References . . . 122
5.9 Tips and tricks of MR-guided RF ablation in vivo . . . 126
5.9.1 Arrhythmia and pacing . . . 126
5.9.2 ECG-triggering . . . 126
5.9.3 Precise localisation of the catheter tip . . . 126
5.9.4 Radiofrequency ablation . . . 126
5.9.5 EP recording . . . 127
6 Active catheter tracking for improved cardiac MR thermometry 129 6.1 Preamble . . . 129
6.2 Abstract . . . 130
6.4 Methods . . . 132
6.4.1 Imaging protocol . . . 132
6.4.2 MR thermometry processing . . . 132
6.4.3 Phantom experiments with catheter ablation . . . 133
6.5 Results . . . 134
6.6 Discussion . . . 137
6.7 Conclusion . . . 138
6.8 References . . . 138
7 Concluding discussion and project perspectives 141 7.1 Progress related to this PhD thesis . . . 141
7.1.1 Real-time implementation of a fast cardiac MR thermometry and dosime-try pipeline . . . 142
7.1.2 Implementation of fast MR thermometry pulse sequences . . . 142
7.1.3 Improvement of motion estimation and compensation applied to catheter RF ablation . . . 142
7.2 Perspectives . . . 143
7.2.1 Atrial MR thermometry . . . 143
7.2.2 Automatic temperature control . . . 146
7.2.3 Cardiac MR thermometry on arrhythmic patients . . . 147
7.2.4 Simultaneous Multi-Slice (SMS) MR Thermometry . . . 147
7.3 References . . . 148
Summary 151
R´esum´e 155
Abbreviations
2D Two dimensional 3D Three dimensional Cardiac arrhythmia AF Atrial fibrillation AV Atrioventricular bpm Beats per minuteECG Surface electrocardiogram EGM Intracardiac electrogram EP Electrophysiology
ICD Implantable cardioverter-defibrillator LV Left ventricle
RF Radiofrequency RV Right ventricle SCD Sudden cardiac death MR imaging
ACS Autocalibration signal
b − SSF P Balanced Steady State Free Preces-sion
EP I Echo planar imaging F A Flip angle
F OV Field of view
Gd Gadolinium
GRE Gradient recalled echo IR Inversion recovery
M RI Magnetic resonance imaging SM S Simultaneous multi-slice
T 1 − w T1 weighted
T1 Longitudinal relaxation time
T2 Transversal relaxation time
T E Echo time T I Inversion time T R Repetition time Motion estimation H&S Horn and Schunck I Image intensity
u Horizontal component of motion v Vertical component of motion Statistical analysis
µT Temporal mean of temperature
σT Temporal standard deviation of
temper-ature
CN R Contrast-to-noise ratio
R Pearson’s correlation coefficient ROI Region of interest
SD Standard deviation SN R Signal-to-noise ratio Thermometry
αP RF PRF coefficient
γ Gyromagnetic ratio ϕ Current phase image ϕREF Phase image of reference
Bj jthPCA eigen vector
Dj jthMotion descriptor
HIF U High intensity focused ultrasound LU T Look-up table
P CA Principal component analysis P RF Proton resonance frequency SV D Singular value decomposition T D Thermal dose
List of Figures
1.1 Electrical conduction system of the normal heart. . . 20
1.2 Radiofrequency ablation for the treatment of cardiac arrhythmia. . . 21
1.3 Set-up commonly used for RF ablation . . . 23
2.1 Basic principle of PRF thermometry method on a static phantom . . . 32
2.2 Experimental noise on the phase of the transverse magnetisation vector . . . 33
2.3 Evaluation of MR thermometry performance. . . 34
2.4 Timing diagram for the blipped EPI sequence and the resulting trajectory in the k-space. . . 36
2.5 SENSE parallel imaging . . . 37
2.6 Spatial aliasing and SENSE reconstruction . . . 38
2.7 GRAPPA reconstruction method . . . 38
2.8 ECG-gated imaging. . . 39
2.9 ECG-gating acquisition in case of cardiac arrhythmia. . . 40
2.10 Crossed-pair echo-navigator positioning. . . 41
2.11 Respiratory-gated MR acquisition . . . 41
2.12 Rejection of data acquisition outside a user-defined window during respiratory-gated MR acquisition . . . 42
2.13 Echo-navigator based slice following technique . . . 42
2.14 Examples of basic transformations . . . 44
2.15 Optical-flow motion estimation . . . 45
2.16 Multi-resolution scheme of optical-flow motion estimation . . . 45
2.17 Illustration of the fidelity term of Horn and Schunck (H&S) and Black and Anan-dan (B&A) optical-flow algorithms . . . 46
2.18 Respiratory-induced susceptibility artifacts . . . 47
2.19 Diagram of multi-baseline approach for correction of motion-induced suscepti-bility artifacts with moving phantom data. . . 48
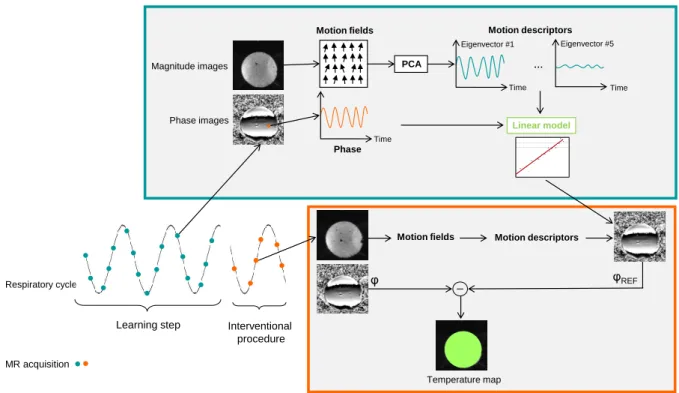
2.20 Diagram of the PCA-based phase modeling approach for correction of motion-induced susceptibility artifacts. . . 50
2.21 MR thermometry results of RF ablation on a sheep’s LV . . . 53
3.1 Real-time cardiac magnetic resonance thermometry pipeline. . . 64
3.2 Thermometry evaluation on a human volunteer measured at 1.6×1.6×3 mm3 resolution using the PCA-based method . . . 69
3.3 Statistics on 10 healthy volunteers during free-breathing acquisition. . . 70
3.4 MR thermometry monitoring during RF ablation at 26 W on the left ventricle. . 71
3.5 Contact electrograms acquired during radiofrequency ablation in sheep. . . 73
3.6 Cumulative thermal dose images and gross pathology results for two RF ablations 73 3.7 Integration of Gadgetron framework with a Siemens scanner . . . 80
3.8 Biosense Webster catheter . . . 81
3.9 Example of artifacts that can occur during RF ablation . . . 81
3.10 Hardware design for simultaneous RF ablation and MR thermometry. . . 81
3.11 Temporal phase unwrapping . . . 82
3.12 Matrix for PCA . . . 83
4.1 Calibration of Horn and Schunck (H&S) and PCA-based H&S optical-flow algo-rithms. . . 93
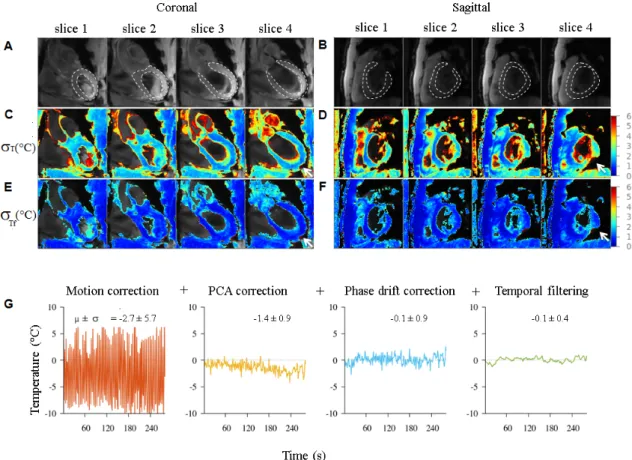
4.2 Temperature standard deviation (σT) for both optical-flow methods applied to MR temperature images from free-breathing volunteers. . . 94
4.3 Simulation of a local signal decrease on the magnitude image of an agar gel phantom (A) centered on the catheter position. . . 95
4.4 Experimental data obtained on a static agar gel phantom. . . 96
4.5 Experimental data obtained on an agar gel phantom. . . 97
4.6 Simulation of a local signal decrease on the magnitude image in sagittal orien-tation of a sheep LV (A) with a MR-compatible catheter inside (yellow arrow) . 98 4.7 Experimental results of RF ablation under MR temperature imaging in a sheep. 100 5.1 Imaging protocol for catheter navigation (A-D) and fast MR thermometry (E-G) for ablation monitoring. . . 111
5.2 MR thermometry evaluation on 5 healthy volunteers in short axis view. . . 114
5.3 Real-time MR thermometry during RF ablation in vivo on a sheep LV. . . 115
5.4 Endocardial bipolar signal recorded at the tip of the MR-compatible ablation catheter in the LV of a sheep. . . 116
5.5 Comparison of lesion dimensions of one representative RF ablation between post-ablation T1-w 3D images (A, C and E), real-time TD map (B) and macroscopic observations with TTC staining (D and F). . . 118
5.6 RF lesion dimensions (N = 12 lesions) correlation between measurements on real-time thermal dose maps, post-ablation T1-w images and gross pathology. . 119
6.1 Active catheter tracking interleaved with the MR thermometry imaging pulse sequence. . . 133
6.2 Correction of susceptibility artifacts based on the catheter tip position. . . 135
6.3 Evaluation of temporal accuracy of MR thermometry on a moving phantom using active catheter tracking. . . 136
6.4 Simultaneous monitoring of a RF heating (4 W for 20 s) and catheter tracking on a moving phantom. . . 137
7.2 Illustration of endovascular imaging using the coils of the catheter. . . 144 7.3 Temperature stability obtained using catheter’s tip micro-coil as imaging coil in
a static phantom made of agar gel. . . 145 7.4 Automatic temperature control during RF ablation . . . 146
Chapter 1
Introduction
Contents 1.1 Cardiac arrhythmia . . . 19 1.1.1 Atrial fibrillation . . . 20 1.1.2 Ventricular tachycardia . . . 21 1.2 Radiofrequency ablation . . . 211.3 Monitoring of radiofrequency ablation . . . 22
1.3.1 Electrode temperature monitoring . . . 23
1.3.2 Circuit impedance monitoring . . . 23
1.3.3 Electrogram amplitude monitoring . . . 24
1.3.4 Contact force monitoring . . . 24
1.4 Objectives of this thesis . . . 25
1.5 References . . . 26
1.1
Cardiac arrhythmia
Cardiac arrhythmias occur when the propagation of the electrical impulses that coordinate the mechanical contraction become abnormal. The normal activation sequence of the myocardium is described in Figure 1.1. The electrocardiogram (ECG) records the electrical signals as they travel through the heart. Each wave of the ECG corresponds to a certain event in the cardiac cycle. The conduction system starts in the sinus node, a small area of tissue in the right atrium, which spreads a depolarization wave over the atrium to the atrioventricular (AV) node. This event is called the P-wave. The electrical signal then propagates from the AV over the His-Purkinje system to trigger ventricular contraction (QRS complex). Finally electrical re-polarisation of the ventricular cells is associated to the T wave that corresponds to the ventricular relaxation.
A
ECG over time
T Q R S P P Q R S
B
Figure 1.1: Electrical conduction system of the normal heart. (A) Healthy heart anatomy showing the components of the conduction system in yellow. (B) Evolution of the normal conduction system over the cardiac cycle. Each wave of the ECG corresponds to a certain event of the cardiac electrical cycle. (Modified from www.accessmedicine.com, The McGraw-Hill Companies)
1.1.1 Atrial fibrillation
Atrial fibrillation (AF) being the most common form of cardiac arrhythmia, affects 750,000 people in France and is expected to increase 2.5 fold by 2050 [1]. AF confers a 2.5 fold risk of stroke and 20% of all strokes are attributable to AF [2]. In addition, AF is associated with a 3 fold higher risk of heart failure [2], 2 to 3 times higher likelihood of hospitalization and twice the mortality risk. AF was discovered to be mainly triggered by ectopic foci from the pulmonary veins [3].
1.1.2 Ventricular tachycardia
30,000-50,000 sudden cardiac deaths (SCD) are observed in France every year and 300,000-400,000 in the United States [4]. The most common cause of SCD appears to be induced by ventricular tachycardia (VT). In VT, an abnormal acceleration of ventricular rate from 120 to 300 beats per minute (bpm) is observed with no coordination with the atria. If the heart rate increases to more than 300 bpm, VT deteriorates into a ventricular fibrillation that may result in SCD. VT occurs most commonly in patients with a history of myocardial infarction. Scar tissue and fibrosis can interfere with the normal electrical impulse and lead to promoting reentry circuits that can generate ventricular arrhythmia.
1.2
Radiofrequency ablation
The common first-line therapeutic approach to treat arrhythmia is the administration of anti-arrhythmic drugs [3] associated with the implantation of a cardioverter-defibrillator (ICD) in patients presenting with prior myocardial infarction. The ICD device administrates an electrical discharge to the heart wall and restores the sinus rhythm. It is followed by drug therapy to prevent recurrence of arrhythmia. Although cardioversion therapy has been shown to reduce the risk of SCD, the occurrence of shocks in implanted patients is associated with an altered quality of life, a progression in heart failure symptoms and an increased mortality [5, 6]. Despite a high success rate of effective electrical cardioversion (70% to 90%) [7, 8], less than half of the patients remained in sinus rhythm after one year.
Figure 1.2: Radiofrequency ablation for the treatment of cardiac arrhythmia. (A) For pulmonary veins isolation, a “lasso” catheter is used to proceed to electro-anatomic mapping of the electrical signal in the left atrium. An ablation catheter (B) is used to induce a thermal lesion and isolate abnormal conduction circuit. (C) Example of an irrigated catheter with continuous saline flow ejected from a series of holes at the distal tip of the catheter. (D) Fluoroscopic images showing diagnostic and ablation catheters commonly used for RF ablation procedure. (E) Electro-anatomic map of the left atria using a dedicated clinical software (NavX, St Jude Medical, St Paul, MI, U.S.A.)
Therefore, radiofrequency (RF) ablation has been proposed as a new therapeutic approach. RF energy is applied at the tip of a catheter to induce a necrosis of the targeted cardiac tissue. Critical sites are thus electrically isolated or cauterized to restore a normal conduction. Catheter ablation procedures take place in an electrophysiology (EP) clinical unit, where both diagnosis and ablation are achieved. Catheters are usually inserted through femoral vein and positioned within the heart for intracardiac electrogram (EGM) recording at critical sites. Electro-anatomic mapping is achieved using mapping catheters (Figure 1.2-A,D) and rendered on a dedicated soft-ware (Figure 1.2-E) such as NavX (St Jude Medical, St Paul, MI, U.S.A.) or CARTO (Biosense Webster, Diamond Bar, CA, U.S.A.). The therapeutic efficacy of the ablation highly depends on the identification of the site of origin of the arrhythmia. The identification of the trigger sites of AF by Haissaguerre et al. [3] lead for instance to the first successful RF ablation by isolating the arrhythmogenic tissue around the pulmonary veins in the left atrium. Once the site is identified, an ablation catheter is positioned at that location in contact with the myocardium to proceed to the ablation by sending a RF energy for 30-60 s (Figure 1.2-B). The typical RF frequency used for clinical RF ablation is around 500 kHz.
Although RF ablation has become a reference treatment, a significant recurrence rate of arrhythmia is observed: up to 30% of the patients for AF [9] and 37% for VT [10], often requir-ing redo procedures. Arrhythmia recurrence is mainly caused by incomplete electrical isolation of pathological tissue or by recovery of conduction of previously isolated circuit. The ability to create transmural and permanent lesions is thus of high importance to ensure a durable treatment of the arrhythmia [11]. An optimal RF energy must be delivered to ensure a com-plete cell destruction of the arrhythmogenic substrate without producing collateral injury, such as atrioesophagial fistulas and tamponade. Typical RF power applied in clinical practice are ∼30 W without irrigation, and >50 W with irrigated catheter to compensate for the flow cooling.
Ablation procedures are routinely performed under X-ray fluoroscopy guidance, which allows a rapid update of the image (from 10 to 30 frames per second) while navigating the catheter (Figure 1.2-D). X-ray imaging provides essential anatomical information for guidance of catheter positioning but cannot be used for monitoring due to a limited access to tissue information. In addition, limitations in radiation dose are problematic for time-consuming interventions and for paediatric use. Surrogates have been proposed for assessing the completeness of the ablation such as the circuit impedance, the catheter-tip tempeture, EGM amplitude and electrode/tissue contact-force.
1.3
Monitoring of radiofrequency ablation
One major challenge of RF ablation is the prediction of the size of tissue injury to ensure the efficacy and the safety of the procedure. Catheter orientation, cavities blood flow and catheter/tissue contact are the main factors that significantly influence the created lesion size. Because of the variability of these factors in vivo, energy and duration of the RF delivery remain poor predictors of the final lesion extent.
Figure 1.3: Set-up commonly used for RF ablation. The RF current is sent between the ablation catheter tip and a return electrode placed on patient’s skin. The circuit impedance is measured and displayed in real-time, as well as the RF delivery duration, power and voltage. If a temperature probe is embedded into the catheter, the temperature of the catheter tip can be displayed. (Source: Stockert)
Figure 1.3 schematizes the clinical set-up commonly used to perform a RF ablation. The RF generator sends an alternative RF current between the catheter tip and a return electrode positioned on patient’s skin. The circuit impedance and the parameters of the ablation (power, voltage and duration) are displayed in real-time. The temperature of the catheter tip can also be displayed if the catheter is equipped with a temperature sensor.
1.3.1 Electrode temperature monitoring
Tempeture sensors were integrated in catheter to monitor the effect of the RF delivery and to prevent coagulum formation. The catheter electrode is not directly heated by the RF energy but by the heated tissue in contact. However, tissue temperature was shown to be significantly higher than the catheter tip temperature due to blood cooling at the tissue surface [12, 13]. Tip-electrode cooling with saline flow (Figure 1.2-C, irrigated catheter) increases even more the risk of tissue overheating. Once the tissue temperature exceeds 100◦C, sudden boiling may result in steam formation with subsequent disruption of the myocardial tissue, so-called “pop”. These steam pops can cause a perforation especially in thin-walled structures such as the atria. Even if the electrode temperature does not reflect the tissue temperature, electrode temperature feedback may reduce the risk of excessive tissue heating, boiling and wall rupture [11]. However, catheter tip temperature remains poorly correlated to lesion size in vivo.
1.3.2 Circuit impedance monitoring
Since electrode temperature monitoring does not directly reflect tissue temperature, surrogate measures have been proposed such as circuit impedance [14]. Impedance is measured through the patient between the catheter tip electrode and the return electrode (Figure 1.3). A decrease
in impedance in the range from 10 to 15 Ω can be observed during significant RF heating, because of an increase in the mobility of the ions in the tissue with temperature [15]. Absence of impedance drop may indicate inadequate energy delivery due for example to poor catheter-tissue contact. Impedance monitoring can also be used to increase the safety of the procedure [16, 17] by reducing the likelihood of steam pop and associated perforation risk, that have been reported to be followed by a sudden rise in impedance. If impedance control improves the safety of the procedure, it remains a gross measurement that cannot be used to predict the final volume of myocardial necrosis.
1.3.3 Electrogram amplitude monitoring
Ablation procedure can also be monitored using EGM amplitude as a marker of the effectiveness of the ablation. As tissue heating causes a decrease of the electrical activity, the amplitude of local EGM recorded at the tip of the catheter decreases during the ablation. A reduction of 50 % in the EGM amplitude can be used in clinical practice as the cut-off point to stop the ablation. No significant reduction of the EGM amplitude or loss of tissue excitability during pacing can be useful indicators of failure of the ablation. However, the EGM amplitude can be affected by a poor catheter/tissue contact and do not directly correlate with the tissue temperature.
1.3.4 Contact force monitoring
Since the temperature probe monitoring has become less pertinent with the use of irrigated catheter, additional monitoring of the contact force information was of high interest to create more predictable and reproducible RF lesions. A poor electrode-tissue contact may lead to a low fraction of RF energy effectively delivered to the myocardium.
Recent development of contact force sensing technology provides now real-time feedback of the contact force between the catheter tip and the myocardium. Two different technologies are clinically available: the TactiCath (Endosense/St Jude Medical, St Paul, MI, U.S.A.) catheter that uses three optical fibers to measure deformation of a deformable body in the distal tip of the catheter [18], and the Thermocool Smartouch (Biosense Webster, Diamond Bar, CA, U.S.A.) catheter that uses a small spring connecting the tip electrode to a magnetic transmitter and sensors to measure microdeflection of the spring [19]. Lesion size was shown to be dependent on contact force: greater contact force (30-40 g) produces larger lesions, but increases as well the frequency of steam pop and thrombus formation [18]. The use of contact force sensing technol-ogy was evaluated in a multicenter study (TOuCh for CATheter Ablation – TOCCATA) during pulmonary veins isolation for treatment of AF [20]. The efficacy of the procedure (no recurrence of AF at 12 months) was found to be well correlated with contact force greater than 20 g.
Contact force sensing technology provides a fundamental information for the acquisition of reliable electro-mapping and achievement of ablation lesions, by assuring stable and optimal tissue contact. Further long-term studies are necessary to investigate the improvement in the outcomes of RF ablation. The important hurdle to be overcome remains the visualization of lesion creation during the procedure.
1.4
Objectives of this thesis
Significant progress have been done worldwide for the monitoring of catheter RF ablation by increasing number and complexity of sensors embedded in the catheters. However, none of the existing measurements highly correlate with tissue temperature at distance from the contact point of the catheter electrode and thus hardly reflect the final lesion size. Up to now there is a clear lack of lesion formation imaging during the procedure, although RF ablation has become an accepted curative therapy for the treatment of cardiac arrhythmia. X-Ray fluoroscopy re-mains the reference imaging modality for navigating catheters in cardiac chambers for electrical mapping and delivery of therapeutic RF ablation. However, the intrinsic poor soft tissue con-trast of this modality does not allow visualization of myocardial injury.
Magnetic Resonance Imaging (MRI) is nowadays extending from diagnosis to the field of real-time monitoring of therapeutic procedures. In the field of catheter-based RF ablation, most research have focused on pre-ablation arrhythmogenic substrate assessment (scar tissue, fibrosis) [21] and post-ablation lesion characterization [22, 23]. Recent technical advances in MR-compatible catheters permit the emergence of MR-guided catheterization procedures using either passive [24–30] or active [31, 32] catheter tracking for device visualization and location, based on catheter material or on MR receivers embedded into the catheter, respectively. How-ever, no monitoring of lesion formation was performed during RF ablation.
MR thermometry is a non-invasive method to measure the local temperature distribution in tissue during RF energy delivery. This technique is increasingly studies to monitor thermal abla-tions in various organs: treatment of uterine fibroids [33], prostate cancer [34], liver cancer [35], brain tumours [36]. From quantitative temperature maps, the cumulative thermal dose (TD) can be computed from temperature rise and duration of heating. This metric has been shown to be relevant to predict the final lesion extent, for instance during RF ablation of liver tumours [35].
Cardiac MR thermometry remains very challenging because of the complex motion of the heart (due to contraction and breathing). Preliminary studies demonstrated the technical feasi-bility of MR thermometry on the heart [37–39] and opened perspectives for real-time guidance of RF ablations. However, the spatial and temporal resolutions of the MR pulse sequence, im-age processing and catheter technologies need to be improved in order to provide physicians with reliable and quantitative information. To precisely monitor the formation of typical RF lesions (in the range from 3 to 10 millimetres large), cardiac MR temperature images require an improvement in spatial resolution, in order to reach an ideal voxel size of 1x1x1 mm3, while maintaining a high temporal resolution. An adequate update time is necessary to character-ize significant change in temperature during RF heating. To precisely map a RF delivery of 30-60 seconds-long, a temporal resolution of ∼1s or less is required. Such an acceleration and a reduction of the voxel size comes at the cost of signal-to-noise ratio (SNR), which directly impacts the temperature uncertainty [40]. With a typical tissue temperature rise higher than 20◦C, temperature precision must be in the range of 1 to 2◦C to allow a precise calculation of the delivered TD and prediction of the therapy outcome. These requirements represent important
technical challenges that must be overcome to ensure a robust, reliable and precise real-time cardiac MR thermometry.
This thesis focuses on new developments for real-time monitoring of RF ablation using cardiac MR thermometry. The manuscript is structured as follows:
- In Chapter 2, the first part presents the challenges and state-of-the-art of performing MR thermometry on a mobile organ, such as the heart.
- In Chapter 3, a complete cardiac MR thermometry pipeline is described, including fast MR acquisition sequence, real-time motion compensation and artifacts correction.
- Chapter 4 proposes to evaluate a robust motion estimation approach to address the issue of intensity variation on magnitude images associated with RF heating, that can significantly bias the calculated motion.
- In Chapter 5, MR thermometry method implemented in Chapter 3 was improved by performing a dynamic update of the slice position depending on the respiratory motion. In vivo validation was conducted in both ventricles of healthy volunteers without heating and in sheep during RF ablation in left ventricle (LV). The feasibility of using thermal dose mapping to estimate the lesion extent is demonstrated.
- In the last part, Chapter 6 proposes to combine active catheter tracking and MR ther-mometry to update the slice position on the catheter which is directly affected by motion. Preliminary results are presented on a moving phantom.
1.5
References
1. Charlemagne, A. et al. Epidemiology of atrial fibrillation in France: Extrapolation of in-ternational epidemiological data to France and analysis of French hospitalization data. en. Archives of Cardiovascular Diseases 104, 115–124. issn: 18752136 (Feb. 2011).
2. Krahn, A. D., Manfreda, J., Tate, R. B., Mathewson, F. A. & Cuddy, T. E. The natural history of atrial fibrillation: Incidence, risk factors, and prognosis in the manitoba follow-up study. en. The American Journal of Medicine 98, 476–484. issn: 00029343 (May 1995). 3. Ha¨ıssaguerre, M. et al. Spontaneous Initiation of Atrial Fibrillation by Ectopic Beats
Orig-inating in the Pulmonary Veins. en. New England Journal of Medicine 339, 659–666. issn: 0028-4793, 1533-4406 (Sept. 1998).
4. Rubart, M. Mechanisms of sudden cardiac death. en. Journal of Clinical Investigation 115, 2305–2315. issn: 0021-9738 (Aug. 2005).
5. Bilge, A. K. et al. Depression and Anxiety Status of Patients with Implantable Cardioverter Defibrillator and Precipitating Factors. en. Pacing and Clinical Electrophysiology 29, 619– 626. issn: 0147-8389, 1540-8159 (June 2006).
6. Larsen, G. K., Evans, J., Lambert, W. E., Chen, Y. & Raitt, M. H. Shocks burden and increased mortality in implantable cardioverter-defibrillator patients. en. Heart Rhythm 8, 1881–1886. issn: 15475271 (Dec. 2011).
7. Van Gelder, I. C., Crijns, H. J., Van Gilst, W. H., Verwer, R. & Lie, K. I. Prediction of uneventful cardioversion and maintenance of sinus rhythm from direct-current electri-cal cardioversion of chronic atrial fibrillation and flutter. en. The American Journal of Cardiology 68, 41–46. issn: 00029149 (July 1991).
8. S¨odermark, T. et al. Effect of quinidine on maintaining sinus rhythm after conversion of atrial fibrillation or flutter. A multicentre study from Stockholm. British heart journal 37, 486–492 (1975).
9. Ganesan, A. N. et al. Long-term outcomes of catheter ablation of atrial fibrillation: a sys-tematic review and meta-analysis. Journal of the American Heart Association 2, e004549 (2013).
10. Tanner, H. et al. Catheter Ablation of Recurrent Scar-Related Ventricular Tachycardia Us-ing Electroanatomical MappUs-ing and Irrigated Ablation Technology: Results of the Prospec-tive Multicenter Euro-VT-Study. en. Journal of Cardiovascular Electrophysiology 21, 47– 53. issn: 10453873, 15408167 (Jan. 2010).
11. Wittkampf, F. H. & NAKAGAWA, H. RF catheter ablation: lessons on lesions. Pacing and Clinical Electrophysiology 29, 1285–1297 (2006).
12. Kongsgaard, E., Steen, T., JENSEN, Ø., Aass, H. & Amlie, J. P. Temperature guided radiofrequency catheter ablation of myocardium: comparison of catheter tip and tissue temperatures in vitro. Pacing and clinical electrophysiology 20, 1252–1260 (1997).
13. Bruce, G. K. Discrepancies Between Catheter Tip and Tissue Temperature in Cooled-Tip Ablation: Relevance to Guiding Left Atrial Ablation. en. Circulation 112, 954–960. issn: 0009-7322, 1524-4539 (Aug. 2005).
14. Harvey, M. et al. Impedance monitoring during radiofrequency catheter ablation in humans. Pacing and Clinical Electrophysiology 15, 22–27 (1992).
15. Reithmann, C. et al. Different patterns of the fall of impedance as the result of heating during ostial pulmonary vein ablation: implications for power titration. Pacing and clinical electrophysiology 28, 1282–1291 (2005).
16. Seiler, J. et al. Steam pops during irrigated radiofrequency ablation: Feasibility of impedance monitoring for prevention. en. Heart Rhythm 5, 1411–1416. issn: 15475271 (Oct. 2008). 17. Thiagalingam, A. et al. Impedance and Temperature Monitoring Improve the Safety of
Closed-Loop Irrigated-Tip Radiofrequency Ablation. en. Journal of Cardiovascular Elec-trophysiology 18, 318–325. issn: 1045-3873, 1540-8167 (Mar. 2007).
18. Yokoyama, K. et al. Novel Contact Force Sensor Incorporated in Irrigated Radiofrequency Ablation Catheter Predicts Lesion Size and Incidence of Steam Pop and Thrombus. en. Cir-culation: Arrhythmia and Electrophysiology 1, 354–362. issn: 1941-3149, 1941-3084 (Dec. 2008).
19. Perna, F. et al. Assessment of Catheter Tip Contact Force Resulting in Cardiac Perfo-ration in Swine Atria Using Force Sensing Technology. en. Circulation: Arrhythmia and Electrophysiology 4, 218–224. issn: 1941-3149, 1941-3084 (Apr. 2011).
20. Reddy, V. Y. et al. The relationship between contact force and clinical outcome during radiofrequency catheter ablation of atrial fibrillation in the TOCCATA study. en. Heart Rhythm 9, 1789–1795. issn: 15475271 (Nov. 2012).
21. Oakes, R. S. et al. Detection and Quantification of Left Atrial Structural Remodeling With Delayed-Enhancement Magnetic Resonance Imaging in Patients With Atrial Fibrillation. en. Circulation 119, 1758–1767. issn: 0009-7322, 1524-4539 (Apr. 2009).
22. Dickfeld, T. et al. Characterization of Radiofrequency Ablation Lesions With Gadolinium-Enhanced Cardiovascular Magnetic Resonance Imaging. en. Journal of the American Col-lege of Cardiology 47, 370–378. issn: 07351097 (Jan. 2006).
23. Celik, H. et al. Intrinsic contrast for characterization of acute radiofrequency ablation lesions. Circulation: Arrhythmia and Electrophysiology 7, 718–727 (2014).
24. Omary, R. A. et al. Real-time MR imaging-guided passive catheter tracking with use of gadolinium-filled catheters. Journal of Vascular and Interventional Radiology 11, 1079– 1085 (2000).
25. Nordbeck, P. et al. Feasibility of Real-Time MRI With a Novel Carbon Catheter for Inter-ventional Electrophysiology. en. Circulation: Arrhythmia and Electrophysiology 2, 258–267. issn: 1941-3149, 1941-3084 (June 2009).
26. Hoffmann, B. A. et al. Interactive real-time mapping and catheter ablation of the cavotri-cuspid isthmus guided by magnetic resonance imaging in a porcine model. en. European Heart Journal 31, 450–456. issn: 0195-668X, 1522-9645 (Feb. 2010).
27. Eitel, C., Piorkowski, C., Hindricks, G. & Gutberlet, M. Electrophysiology study guided by real-time magnetic resonance imaging. en. European Heart Journal 33, 1975–1975. issn: 0195-668X, 1522-9645 (Aug. 2012).
28. Piorkowski, C. et al. Cavotricuspid isthmus ablation guided by real-time magnetic reso-nance imaging. Circulation: Arrhythmia and Electrophysiology 6, e7–e10 (2013).
29. Sommer, P. et al. Feasibility of real-time magnetic resonance imaging-guided electrophysi-ology studies in humans. en. Europace 15, 101–108. issn: 1099-5129, 1532-2092 (Jan. 2013). 30. Settecase, F., Martin, A. J., Lillaney, P., Losey, A. & Hetts, S. W. Magnetic Resonance–Guided
Passive Catheter Tracking for Endovascular Therapy. en. Magnetic Resonance Imaging Clinics of North America 23, 591–605. issn: 10649689 (Nov. 2015).
31. Nazarian, S. et al. Feasibility of Real-Time Magnetic Resonance Imaging for Catheter Guidance in Electrophysiology Studies. en. Circulation 118, 223–229. issn: 0009-7322, 1524-4539 (June 2008).
32. Hilbert, S. et al. Real-time magnetic resonance-guided ablation of typical right atrial flutter using a combination of active catheter tracking and passive catheter visualization in man: initial results from a consecutive patient series. en. Europace 18, 572–577. issn: 1099-5129, 1532-2092 (Apr. 2016).
33. McDannold, N. et al. Uterine leiomyomas: MR imaging–based thermometry and thermal dosimetry during focused ultrasound thermal ablation 1. Radiology 240, 263–272 (2006). 34. Ramsay, E. et al. MR thermometry in the human prostate gland at 3.0T for transurethral
ultrasound therapy: Prostate MR Thermometry at 3T. en. Journal of Magnetic Resonance Imaging 38, 1564–1571. issn: 10531807 (Dec. 2013).
35. Lepetit-Coiff´e, M. et al. Real-time monitoring of radiofrequency ablation of liver tumors using thermal-dose calculation by MR temperature imaging: initial results in nine patients, including follow-up. en. European Radiology 20, 193–201. issn: 0938-7994, 1432-1084 (Jan. 2010).
36. Coluccia, D. et al. First noninvasive thermal ablation of a brain tumor with MR-guided focused ultrasound. en. Journal of Therapeutic Ultrasound 2, 17. issn: 2050-5736 (2014). 37. Kolandaivelu, A. et al. Noninvasive Assessment of Tissue Heating During Cardiac
Radiofre-quency Ablation Using MRI Thermography. en. Circulation: Arrhythmia and Electrophys-iology 3, 521–529. issn: 1941-3149, 1941-3084 (Oct. 2010).
38. Hey, S. et al. Towards optimized MR thermometry of the human heart at 3T: CARDIAC MR THERMOMETRY AT 3T. en. NMR in Biomedicine 25, 35–43. issn: 09523480 (Jan. 2012).
39. De Senneville, B. D. et al. Feasibility of fast MR-thermometry during cardiac radiofre-quency ablation: FEASIBILITY OF FAST MR-THERMOMETRY DURING CARDIAC RF ABLATION. en. NMR in Biomedicine 25, 556–562. issn: 09523480 (Apr. 2012). 40. Quesson, B., Vimeux, F., Salomir, R., de Zwart, J. A. & Moonen, C. T. Automatic control
of hyperthermic therapy based on real-time Fourier analysis of MR temperature maps. en. Magnetic Resonance in Medicine 47, 1065–1072. issn: 0740-3194, 1522-2594 (June 2002).
Chapter 2
Challenges of cardiac Magnetic
Resonance thermometry
Contents
2.1 Principles of Magnetic Resonance thermometry . . . 32 2.1.1 Proton Resonance Frequency shift method . . . 32 2.1.2 Precision of temperature measurement . . . 33 2.1.3 MR dosimetry . . . 34 2.1.3.1 Lethal isotherm . . . 34 2.1.3.2 Thermal dose concept . . . 35 2.2 Fast pulse sequence imaging . . . 35 2.2.1 Single-shot Echo Planar Imaging . . . 35 2.2.2 Parallel imaging . . . 36 2.2.2.1 SENSE . . . 37 2.2.2.2 GRAPPA . . . 38 2.3 Heart motion . . . 39 2.3.1 Effects of heart motion . . . 39 2.3.2 MR acquisition methods for compensation of heart-induced motion . . . 39 2.3.3 MR acquisition methods for compensation of respiratory-induced motion 40 2.3.3.1 Respiratory-gated MR acquisition . . . 40 2.3.3.2 Echo-navigator based slice tracking technique . . . 42 2.3.3.3 Catheter-based slice tracking technique . . . 42 2.3.4 Post-processing methods for in-plane motion compensation . . . 44 2.3.4.1 Affine transformation . . . 44 2.3.4.2 Optical-flow algorithm . . . 44 2.4 Correction of motion-induced B0 changes . . . 47
2.4.1 Multi-baseline approach . . . 47 2.4.2 Principal Component Analysis (PCA)-based phase modeling approach . 48 2.4.3 Referenceless approach . . . 50
2.4.4 Discussion . . . 51 2.5 State-of-the-art of cardiac MR thermometry . . . 52 2.6 References . . . 54
2.1
Principles of Magnetic Resonance thermometry
Several MR parameters, such as the longitudinal relaxation time T1, the transversal relaxation time T2* and the water proton resonance frequency (PRF) shift, are sensitive to temperature changes [1, 2]. Because the PRF method relies on a linear relationship to temperature from 0◦C to 100◦C and does not depend on tissue type (except adipose tissue), it has become the technique of reference for the monitoring of thermal ablation. In this thesis, all MR thermometry experiments were performed using the PRF shift method.
2.1.1 Proton Resonance Frequency shift method
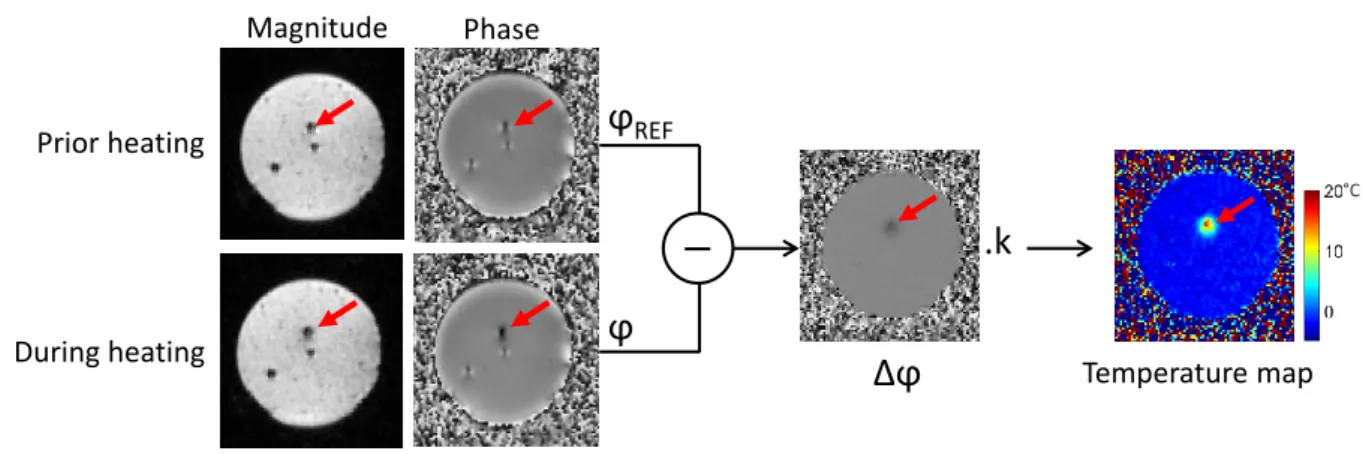
Temperature mapping can be achieved from phase images acquired with a gradient-recalled echo (GRE) pulse sequence. The phase variation ∆ϕ is directly proportional to the temperature change ∆T as follows: ∆T = ∆ϕ γ · αP RF · B0· T E = ϕ − ϕREF γ · αP RF · B0· T E (2.1) Where ϕ is the current acquired phase image, ϕREF is the phase of reference (baseline) image
acquired prior to heating, γ is the gyromagnetic ratio (∼ 42.58M Hz/T ), αP RF is the PRF
temperature coefficient (-0.0094 ppm/◦C [3]), B0 is the magnetic field strength and TE is the
echo time of the MR sequence. Figure 2.1 illustrates the MR thermometry method during a RF heating on a static agar gel.
ϕ
ϕ
REF Magnitude Phase Prior heating During heatingΔϕ
.k
Temperature map °CFigure 2.1: Basic principle of PRF thermometry method on a static agar gel phantom. Magnitude and phase images are acquired using a fast EPI pulse sequence. During the heating, the current phase image is subtracted to a phase of reference acquired prior to heating. The temperature map is calculated from the subtracted phase using the PRF formula 2.1. The red arrow depicts the position of the catheter tip positionned perpendicular to the imaging plane.
clinical ablations of brain tumor [4] or uterine fibroids [5]. However, MR thermometry in mobile organs such as the liver, the kidney or the heart, requires fast imaging technique to ensure a sufficient temporal resolution to resolve respiratory motion. For that purpose, echo-planar imaging (EPI) pulse sequence has been increasingly used, for example for the monitoring of tumor ablation in the liver [6, 7]. Further fast imaging techniques will be described in the Section 2.2.
2.1.2 Precision of temperature measurement
The real and imaginary parts of the complex MR signal are affected by white gaussian noise with a standard deviation σ (Figure 2.2). It results in Rician noise on the final magnitude and phase images. As the temperature change is proportional to the phase variation (see equation 2.2), the variance of the temperature noise can be calculated using the formula 2.3.
∆T = ∆ϕ.k with k = 1 γ · αP RF · B0· T E (2.2) V (∆T ) = V (∆ϕ.k) = V (∆ϕ).k2 = (V (ϕREF) + V (ϕ)).k2 (2.3)
M
ϕ
x
y
Δx G(0,σ)
~
Δy G(0,σ)
~
Figure 2.2: Experimental noise on the phase of the transverse magnetisation vector
Thus, the noise of the temperature can be expressed as:
σ(∆T ) =pσ2(ϕ
REF) + σ2(ϕ).k = σ(ϕ).
√
2.k (2.4)
Where σ(∆T ) is the standard deviation of the noise of the phase image. In addition, Conturo et al [8] demonstrated that:
σ(ϕ) = 1
SN R (2.5)
Where SNR is the signal-to-noise ratio of the magnitude image. The uncertainty of the temper-ature measurement σ(∆T ) can finally be expressed as:
σ(ϕ) = √
2.k
SN R (2.6)
The accuracy of the temperature measurement is mainly dependent on the used pulse se-quence and on potential artifacts (due to motion or RF delivery). σ(ϕ) is considered as the optimal temperature accuracy that can be obtained by minimizing the artifacts. In this PhD thesis, the accuracy and the stability of the temperature measurements are evaluated by com-puting, in a pixel-by-pixel basis, the temporal standard deviation σT and average µT of the
temperature, respectively (see Figure 2.3).
t
y
x
Temperature maps
Temperature evolution in one pixel
Time (°C) °C
A
B
σ
Tµ
T °C °CC
D
Figure 2.3: Evaluation of MR thermometry performance. (A) Temperature maps are computed over time without heating. Temperature evolution in one pixel centered on the agar gel phantom is plotted in (B). The standard deviation σT (C) reflects the noise affecting the temperature over time in each pixel. The
temporal average µT reflects the off-set of the temperature that is supposed to be zero. As shown on (B),
the temperature can be impacted by phase drift that must be corrected.
2.1.3 MR dosimetry
The goal of MR thermometry is to predict the final outcome of the thermal therapy. During RF ablation, it has to be ensured that the optimal energy has been delivered to completely destroy the targeted myocardium while avoiding collateral damage on surrounding healthy tissue. MR dosimetry aims to give a relation between tissue temperature and resulting cell necrosis. Two different approaches have been proposed in the past: a temperature threshold above which the tissue necrosis is complete, and the thermal dose accounts for both exposure temperature and time.
2.1.3.1 Lethal isotherm
A tissue temperature of 50◦C has been indirectly estimated as the lethal isotherm to create irreversible myocardial damage using spaced thermocouples on excised pig ventricular muscles [9]. This lethal isotherm was used by Kolandaivelu et al. [10] to correlate MR thermometry based temperature measurement and the final lesion transmurality at gross pathology. Lesion
transmurality by MR thermometry was within 20% of that measured by pathology. However, a recent study demonstrated that 50◦C overestimates lesion size [11]. A lethal isotherm of 61◦C was proposed by directly measuring the temperature elevation by infrared thermal imaging during RF ablation on the LV of isolated perfused pig hearts. However, the lethal isotherm technique assumes no time-temperature relationship for thermal injury, contrary to the thermal dose concept.
2.1.3.2 Thermal dose concept
TD model is widely used in thermal therapy to relate temperature to actual tissue damage. First introduced by Sapareto et al [12], cumulative TD was formulated in each pixel using the following formula: T D = Rt 02 T (t)−43 if T (t) > 43◦C Rt 04 T (t)−43 if T (t) ≤ 43◦C (2.7)
Where T(t) = TREF + ∆T is the absolute temperature at the time t, TREF is the temperature
offset measured by an external sensor and ∆T is the relative temperature change measured by MR thermometry. The lethal threshold for tissue necrosis is equivalent to a constant heating for 240 min at 43◦C [13].
Noise impacting MR temperature measurements σT must be taken in account for the
calcu-lation of the TD. A correction was performed in [6, 14], as follow:
T Dcorr(x, y) = T D(x, y).e−0.5(ln(2).σT(x,y))
2
(2.8) Where (x,y) depict the TD map coordinates and T Dcorr is the corrected TD.
In this PhD thesis, we assume a time-temperature relation with tissue necrosis and the thermal dose model will be evaluated for inline prediction of the ablation outcome.
2.2
Fast pulse sequence imaging
Occurrence of motion during the MR acquisition lead to blurring and ghosting artifacts. These effects can be minimized by accelerating the scan time using methods discussed in this section. The employed technique of acquisition and reconstruction must allow a sufficient update rate to avoid latency in temperature map computing.
2.2.1 Single-shot Echo Planar Imaging
Single-shot EPI allows the acquisition of images with a scan time in the range of 40-100 ms. This temporal resolution minimizes the issue of intra-scan motion artifacts.
In conventional GRE pulse sequence, one line in k-space is collected within each repetition time (TR). The pulse sequence is repeated to fill the k-space and the scan time is equal to the product of the TR and the number of phase-encoding steps. The single-shot EPI allows the acquisition of all the lines of imaging data after a single RF excitation. The frequency-encoding gradient (Gread in Figure 2.4) forms an echo-train by oscillating rapidly. One line of the k-space
is acquired at each oscillation of the frequency-encoding gradient. A short phase-encoding gradi-ent, called “blip”, is used at the zero-crossing point of the frequency-encoding gradient to move to the next line in the k-space.
Figure 2.4: Timing diagram for the blipped EPI sequence and the resulting trajectory in the k-space.
Because of the fast oscillation of the frequency-encoding gradient, EPI pulse sequence re-quires a high gradient strength of 20 mT/m, a minimum rise time of 0.1 ms and a slew rate of 200 T/m per second. These technical requirements have first restricted the development of this technique in routine clinical practice.
EPI is a fast acquisition technique with a reduced scan time and is useful to decrease motion artifact and to image physiologic processes with a high temporal resolution. However, EPI suffers from various artifacts, such as N/2 ghosting and geometric distortion, and is sensitive to susceptibility effects and main magnetic field inhomogeneity.
2.2.2 Parallel imaging
Parallel imaging allows an acceleration of the scan time by skipping a part of the lines in the phase-encoding direction of the k-space. However, the reduction of the number of lines results in a reduction of the field of view (FOV), and thus to aliasing on the reconstructed image (see Figure 2.5). In parallel imaging, the MR signal is acquired by multiple receiver coils and weighted by the coil sensitivity. Several methods of reconstruction have been proposed to combine signals from the coils and compute a final unaliased image. In this section are presented the Sensitivity Encoding (SENSE) [15] and the Generalized Autocalibrating Partially Parallel Acquisitions (GRAPPA) [16] methods that are the most widely used techniques.
2.2.2.1 SENSE
SENSE involves using the spatial sensitivities of each coil to unwrap aliased images (Figure 2.5). Aliased images are acquired separately from each coil. As illustrated in Figure 2.6 with two receiver coils, one point (P) in the aliased image represents two voxels (V1 and V2) in the body. Using two coils (C1 and C2) with their own sensitivity (SC1 and SC2), the system of equations
2.9 can be formulated: IC1(P ) = SC1(V 1) ∗ I(V 1) + SC1(V 2) ∗ I(V 2) IC2(P ) = SC2(V 1) ∗ I(V 1) + SC2(V 2) ∗ I(V 2) (2.9)
Where IC1(P ) and IC2(P ) are the signal intensity in the point P recorded with the coil 1 and
2, respectively. From this system of two equations, the two unknowns I(V 1) and I(V 2) can be calculated. This works the same for any number of coils and acceleration factor R, as long as R is lower than the number of coils.
Figure 2.5: SENSE parallel imaging. To accelerate the acquisition time, the k-space is under-sampled (two-fold here, the dashed lines represent unacquired lines). The reconstructed images from each coil present aliasing artifacts caused by the under-sampling. Coil sensitivity maps are used to reconstruct a final unaliased image.
Figure 2.6: Spatial aliasing and SENSE reconstruction. MR signal is acquired by a phased-array of 2 coils. The dashed lines depict the FOV after a two-fold sub-sampling. In the resulting aliased image, the point P is a superposition of two points in the body (voxels V1 and V2).
2.2.2.2 GRAPPA
The goal of GRAPPA is the same as of SENSE: to speed up the acquisition by under-sampling the phase-encoding lines and then to solve the aliasing issue using measurements from each individual coil. While SENSE solves the problem in the spatial domain of the image, GRAPPA calculates missing k-space lines before Fourier transform of the raw data.
Figure 2.7: GRAPPA reconstruction method with 4 coils and an acceleration factor R=2. (A) Data acquired in each coil are fit to the ACS line of coil #2. The resulting weights are used to reconstruct the non-acquired lines of the same coil (B).
.
Autocalibration signal (ACS) is collected in the center of the k-space (orange lines in Figure 2.7). To determine the weights used for reconstruction, a fit is performed between several lines and one ACS line in a single coil (Figure 2.7-A). These weights are then used to generate the missing lines from that coil (Figure 2.7-B). Once all of the lines are reconstructed for each coil, a Fourier transform can be used to generate one unaliased image per coil. The unaliased images are finally combined by sum of square or other methods to generate the final image.
2.3
Heart motion
The heart is subject to complex motion-induced by heart contraction and respiratory motion. The breathing induces a mainly 2D periodic linear displacement with a rate in the range from 12 to 18 breaths per minute in humans. The cardiac activity causes elastic deformation of the heart. Each heartbeat is divided in two parts: during diastole the atria and ventricles relax and fill with blood; during systole the heart’s ventricles contract and pump the blood out of the heart. A normal resting heart rate ranges from 60 to 100 bpm in adults.
2.3.1 Effects of heart motion
- Intra-scan motion is induced by motion occurring during the MR acquisition, resulting in image artifacts such as blurring and ghosting when the motion is not compensated.
- Inter-scan motion is caused by movement of an object between two consecutive MR acquisitions. As described earlier, PRF-based temperature mapping is performed by sub-tracting a baseline phase image acquired prior to ablation to the current heating phase image. A misalignment between the acquisitions of the images may lead to strong artifacts in the computed temperature maps.
2.3.2 MR acquisition methods for compensation of heart-induced motion
The issue of heart motion can be solved by ECG-gated imaging (Figure 2.8-A). ECG gating synchronizes data acquisition at a specific part of the cardiac cycle, typically during the diastolic phase. The R wave of the ECG signal is detected as the start of the cardiac cycle and the data acquisition is initiated after a user-defined delay. ECG leads are placed on patient chest as described in Figure 2.8-B.
Figure 2.8: ECG gated imaging. (A) The R wave is detected and the data acquisition is run after a trigger delay defined by the user. The trigger delay and the scan duration must not overcome the acquisition window available in the cardiac cycle (R-R interval). The data is typically acquired during the ventricular diastole, when the heart movement is limited. (B) ECG leads placement on human chest with three leads configuration. The leads are connected to a wireless sensor that transmits the ECG signal to the MR scanner.
Gradients and RF pulses can cause interference in ECG. The signal shape of these artifacts can lead to false detection of the R wave and thus to false triggering of the data acquisition. The data may be corrupted with motion and not be synchronized with the other acquisition of the time series. Arrhythmia may cause inappropriate triggering as well. Some imaging softwares incorporate arrhythmia rejection algorithm to discard and re-acquire the corresponding data (Figure 2.9).
Figure 2.9: ECG gating acquisition in case of cardiac arrhythmia. The acquisition window and the trigger delay are defined by the user based on the heart cycle duration observed before the acquisition (A). If arrhythmia occurs, the R-R interval can be shortened (B) and the data acquisition will be discarded. If the cycle duration is increased (C), the data can be acquired but not at the identical cardiac phase.
2.3.3 MR acquisition methods for compensation of respiratory-induced
mo-tion
Through-plane heart motion is mainly caused by respiration and can be approximated as a 2D linear displacement in head-foot direction. A motion with a direction perpendicular to the imaging slices may lead to the observation of different part of the heart tissue over time. Because RF ablation procedure duration is in the order of several minutes, MR thermometry imaging cannot be performed in a single breath-hold. Although the acquisition of 3D volumes would be highly valuable, it is hardly feasible with a sufficient temporal resolution and may be prone to intra-scan artifacts described earlier.
2.3.3.1 Respiratory-gated MR acquisition
The MR acquisition is synchronised with the respiratory cycle so that the data is always acquired at the same part of the respiratory cycle. This method requires a monitoring of the patient’s respiration. A first approach consisted in the use of a respiratory bellow device fixed to the patient abdomen [17]. It provides a continuous recording of the respiratory signal, independent of field strength. However, bellow signal is not always well correlated with the heart motion due to non-linearities or suboptimal location of the bellow device [18].
A more accurate method is the use of an echo-navigator for the monitoring of temporal changes of the diaphragm position. A column of tissue is excited through the diaphragm using either (1) a pencil-beam echo-navigator based on the excitation of a cylinder shaped volume by a 2D RF pulse with a low flip angle (FA) [19] or (2) a crossed-pair echo-navigator based on the excitation of the intersection volume of two crossed slices [17]. The second method leads to strong saturation artifacts due to high excitation angles (90◦ and 180◦). For this reason,
positioning must be done carefully to avoid the two slices to cross the heart. Usually the echo-navigator beam is placed through the peak of the dome of the right hemidiaphragm, as described Figure 2.10.
Figure 2.10: Crossed-pair echo-navigator positioning. (A) Coronal view showing the excited volume (orange rectangles) located at the interface between the liver and the lung. The dashed violet line represents the position of the transverse slice (B) used to position the two crossed slices through the peak of the dome of the right hemidiaphragm. Since the two slices create strong saturation artifacts, they are placed in a proper way to not cross the heart
The echo-navigator profile is acquired prior to the acquisition window in the cardiac cycle (Figure 2.11-A) using a prospective technique. The position of the diaphragm is clearly delin-eated by the contrast between the liver and the lung and can be extracted from echo-navigator profile using real-time edge-detection algorithm [20], correlation or least-squares methods [21]. A gating window is determined by the user at a stable position, typically at end expiration (Figure 2.11-B). If the diaphragm position is included inside the gating window, the data is accepted (Figure 2.12). A large gating window will lead to a high acceptance rate but to a reduced image quality.
Figure 2.11: Respiratory-gated MR acquisition. (A) The MR acquisition is synchronized with the ECG and an echo-navigator pulse sequence is run prior to the imaging acquisition. (B) Positioned at the liver/lung interface, the echo-navigator allows the detection of the diaphragm. A gating window is defined according to the navigator trace to allow the acquisition only during a stable part of the respiratory cycle. The aim is to minimize the respiratory motion between two successive acquisitions.