Communication Error Detection using Facial Expressions
by
Sy Bor Wang
Submitted to the Department of Electrical Engineering and Computer
Science
in partial fulfillment of the requirements for the degree of
Doctor of Philosophy
at the
MASSACHUSETTS INSTITUTE OF TECHNOLOGY
September 2008
@ Massachusetts Institute of Technology 2008. All rights reserved.
A uthor ...
-··
.
O'
Department of Electric
Certified by
...
Certified by ...
Accepted by.
MASSACHUSET'S INSTITUTE OF TECHNOLO",OCT 2
22008
LIBRARIES
.. .. ... . .. . .. .... . . .. . ... ...:al Engineering and Computer Science
Au
/st 29, 2008
Trevor J. Darrell
Associate Professor
Thesis Supervisor
David Demirdjian
Research Scientist
Thesis Supervisor
Terry P. Orlando
Chairman, Department Committee on Graduate Students
ARCHIVES
Communication Error Detection using Facial Expressions
by
Sy Bor Wang
Submitted to the Department of Electrical Engineering and Computer Science on August 29, 2008, in partial fulfillment of the
requirements for the degree of Doctor of Philosophy
Abstract
Automatic detection of communication errors in conversational systems typically rely only on acoustic cues. However, perceptual studies have indicated that speakers do exhibit visual communication error cues passively during the system's conversational turn. In this thesis, we introduce novel algorithms for face and body gesture recognition and present the first automatic system for detecting communication errors using facial expressions during the system's turn. This is useful as it detects communication problems before the user speaks a reply. To detect communication problems accurately and efficiently we develop novel extensions to hidden-state discriminative methods. We also present results that show when human subjects become aware that the conversational system is capable of receiving visual input, they become more communicative visually yet naturally.
Thesis Supervisor: Trevor J. Darrell Title: Associate Professor
Thesis Supervisor: David Demirdjian Title: Research Scientist
Acknowledgments
There are many people I would like to thank over here, this thesis would not be possible without the guidance, moral support and help of all these people.
First, I would like to thank my thesis advisors, Trevor Darrell and David Demirdjian. David has been a wonderful advisor and has offered me many good advice in research and in life. I am very grateful to his nurturing, kind and patient attitude towards me throughout my last five years in the Vision Interface group as he took the time to advise me, even though it was not part of his duty. He has been a great mentor. I would like to thank Trevor for being a great co-advisor as well. He offered very good ideas, had great positive energy and was always very encouraging. Throughout the years he has taught me a lot about writing and doing research. I would like to thank him for all his generosity with funding me all these years and the extra effort to fund me this summer.
Stefanie Shattuck-Hufnagel and Jim Glass have been wonderful thesis committee mem-bers. I am grateful to Stefanie for all her advice over the years about conducting my exper-iments. Despite only being a thesis committee member, she has spent a lot of time advising me in this thesis about conducting experiments and the use of audio features throughout the last few years. Jim was a wonderful and kind advisor when I was completing my mas-ters in his research group. They also read my thesis in detail and provided very insightful feedback.
This thesis of mine has been highly collaborative and many members of the Vision Interface Group had a hand in making it complete. Ariadna Quattoni, Mario Christodias, Tom Yeh, Louis Phillppe Morency, Kevin Wilson and Kate Saenko were wonderful paper readers who often provided invaluable feedback, assisted me in data collection, and pro-vided good research advice. Other members of CSAIL who propro-vided a lot of help and ideas were Mike Siracusa, Kin Tieu, Biswajit Bose, Gerald Dalley, Javier Carreras, Thomas Yeo and Wanmei Ou. Other friends who were there when times were hard were Alex Park, Han Pang Chiu, Huankiat Seh, Tony Quek and Ulas Ziyan. Several other friends I would to thank for assisting me in data collection include: Xiaogang Wang, Jenny Yuen, Kevin Chen, Emily Whiting, Yeuhi Abe, Paul Green, Clare Poynton, Emily Fox, Zi Tec Chong,
Jonathan Quek, Biliana Kaneva, Trevor Ng, Trina Kok, Shuyin Sim, Wuisiew Tan, Racquel Urtasun, Valerie Gordeski, Tony Eng, Yidong Chong and Jiamin Chen. Special thanks to Maysoon as she was always available to read my papers, thesis and correct my grammar.
There are several other members of the MIT community I would like to thank as well. Jae Lim provided me with funding when I was in the midst of switching research groups, and I became his teaching assistant for 6.003 for two semesters. He had a lot of wisdom in dealing with difficult life situations and I was grateful I was there at the right time when I needed such advice. Marilyn Pierce in the graduate department of EECS was also very helpful and she was constantly looking out for my well-being here in MIT.
I would also like to thank my research advisors back in Carnegie Mellon where I was an undergraduate. I never thought I would be here in MIT doing a phd without the kind and nurturing guidance of my undergraduate research advisor, Tsuhan Chen and Ed Schlesinger. Tsuhan was very inspirational and sparked my interest in image processing and computer vision interfaces.
Last but not least, I would like to thank my family for all their patience and help throughout all these years of my education. The words here will not do justice to the amount of help and guidance they have provided me. Dad was very motivational and encouraged me to be the best that I can be, while Mum was very caring and constantly watched over my health and well being. My two sisters were behind me all these times too when I was studying, from providing me with four wheels to giving invaluable advice when I am facing difficult situations. I wouldn't be here without the support of all of them.
Contents
1 Introduction 21 1.1 Contributions ... ... . 24 1.2 Thesis Roadmap ... ... 24 2 Related Work 27 2.1 Audio cues ... ... ... 27 2.2 Visual cues ... ... 29 2.3 Audiovisual cues ... ... 333 Gesture Recognition with discriminative models 37 3.1 Discriminative Vector Quantization ... ... 39
3.2 Hidden Conditional Random Fields (HCRFs) . ... 41
3.3 HCRFs: A Review ... ... 42
3.4 HCRFs for Gesture Recognition ... .... 45
3.5 Gesture recognition using discriminative vector quantization: datasets, ex-periments and results ... ... 47
3.5.1 Arm Gesture Dataset ... ... 47
3.5.2 Experiments and Results ... .... 48
3.6 Gesture recognition using Hidden Conditional Random Fields: datasets, experiments and results ... ... 50
3.6.1 Arm Gesture Dataset ... ... 50
4 Automatic Recognition of visual communication errors: initial results
4.1 Approach . ... ...
4.2 Visual and Audio Feature Extraction .... . . . .
4.2.1 Head Motion and Pose Estimation ... 4.2.2 Facial Motion Features ...
4.2.3 Audio Feature Extraction . ...
4.3 Communication error detection using Hidden Conditional F 4.4 Hidden camera dataset: experiments and results ...
4.4.1 Multimodal Fusion Strategies ... . .
4.4.2 Audio and Visual Features ... 4.4.3 Hidden Camera Dataset ...
4.4.4 Visual Features Classification . . . . 4.4.5 Audio Features Classification . . . . 4.4.6 Audio-Visual Classification . . . . 4.4.7 ROC curves in this dataset ...
4.5 Motivation dataset : dataset, experiments and results . . . 4.5.1 Experiments and Results ...
4.6 Posed Expressions : dataset, experiments and results . . . 4.6.1 Experiments and Results ...
4.7 Preliminary findings ... . . .. . .. . . 57 . . .. . .. . . 61 . . .. . .. .. 61 ... 62 . . . . . . 64 ,andom Fields . 66 . . . . . 66 . . . . . 66 . . .. .. . .. 67 . . .. . .. . . 67 . . . . . 71 . . . . . 71 . . . . . 71 . . .. . .. . . 71 . . . . . 74 .. . .. .. . . 75 . . . . . 77 .. . .. .. . . 77 .. . .. . .. . 79
5 Efficient Learning of Visual Communication Errors: Voting Latent Dynamic Conditional Random Fields
5.1 Latent Dynamic Conditional Random Fields (LDCRFs) ... 5.2 LDCRFs for unsegmented gesture recognition ...
5.3 Voting Latent Dynamic Conditional Random Fields for communication
er-ror detection ...
5.4 Voting LDCRF datasets and experiments . ... . .
5.4.1 Tilburg Dataset ...
5.4.3 Tilburg Dataset: experiments and results . ... . . 91
5.4.4 Active-Avatar Dataset: experiments and results . ... 93
6 Conclusion 103 6.1 Lim itations . ... ... ... 104
6.2 Future Work ... ... 105
A Plotting ROC curves 107 A.1 ROC curves: a brief introduction ... .... 107
B Briefing Notes 117 B.1 Hidden Camera Dataset ... ... 117
B.2 Motivation Dataset ... 119
B.3 Synthetic Expressions ... ... 123
List of Figures
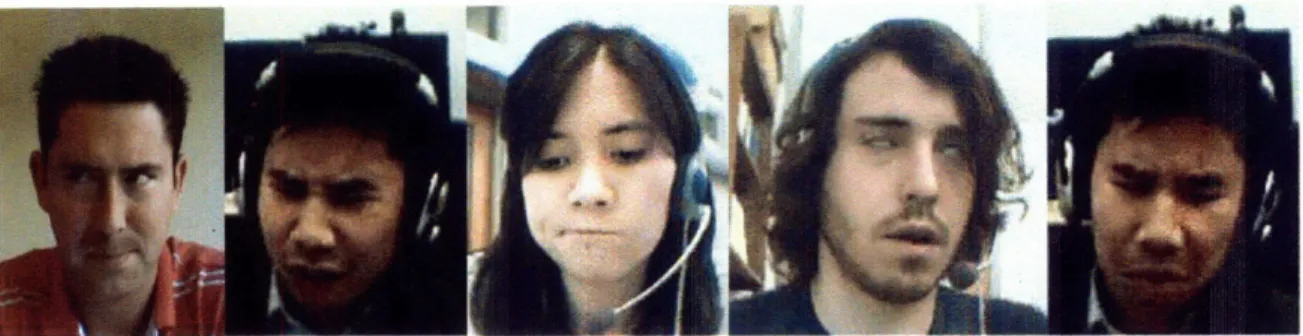
1-1 Diagram illustrating a speaker encountering a communication error. Notice that during the system's conversational turn (from time tl to time t2), where it is giving an erroneous reply, the speaker twitched his eyes naturally to signal an error. This suggests that visual analysis during the system turn m ay be useful ... 22 1-2 Images of different subjects during a communication error. Notice that
different emotions are conveyed e.g. frustration, confusion, disgust etc, but they all occur during a communication error. Our work will not detect these emotions, but instead focus on detecting communication errors using these indicative visual cues ... 23 3-1 Diagram illustrating the similarity between error detection (system diagram
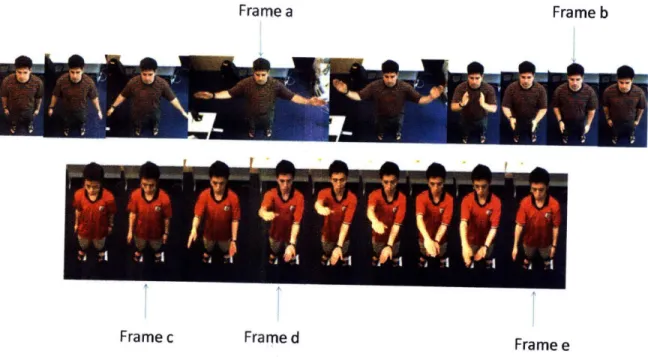
on the left) and gesture recognition (system diagram on the right). ... 38 3-2 Two gesture sequences displayed from frame to frame. The top sequence
is a gesture commanding the system to shrink the screen in size, while the bottom sequence is a gesture asking the system to switch to the next screen. The body poses in frames a and d are very different from one another, however, the body poses in frames b, c and e are very similar. This suggests that models that allow shared features could be useful. ... 38 3-3 HMM model. Suppose there are n gesture classes we need to classify.
n HMM models are trained, and during evaluation a test sequence of m
observations is passed into each HMM model. The highest scoring model is the interpreted gesture class. . ... ... . . . ... . . . 43
3-4 CRF Model. A single exponential model is trained on all gesture classes. Given an observation sequence x, which is a vector of m frames, a class label Y] is assigned per frame. During evaluation, the highest scoring se-quence of labels Y where Y is a vector of m labels is assigned. ... 43 3-5 HCRF Model. A single exponential model like the Conditional Random
Field model, trained on all gesture classes. However, an intermediate level of hidden states is included. During training, the distribution of hidden states is learned per class. During evaluation, a single class label Y is assigned .. . . . . 44 3-6 Illustrations of the six gesture classes for the experiments. Below each
im-age is the abbreviation for the gesture class. These gesture classes are: FB
- Flip Back, SV -Shrink Vertically, EV -Expand Vertically, DB -Double
Back, PB -Point and Back, EH -Expand Horizontally. The green arrows are the motion trajectory of the fingertip and the numbers next to the ar-rows symbolize the order of these arar-rows. A detailed description of these
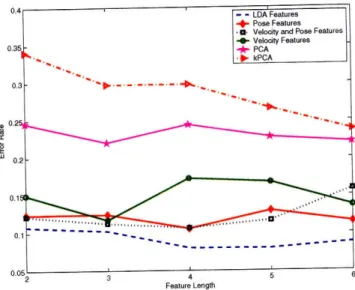
gestures appears in Section 3.6 ... 47 3-7 Images of a user articulating 4 different gestures. ... 48 3-8 Error rates of using different types of features vs their feature length. The
graph shows that the LDA-based approach produced lower error rates con-sistently over different feature lengths. ... . 49 3-9 Sample image sequence with the estimated body pose superimposed on the
user in each frame. The user is articulating the Expand Vertically (EV) gesture. ... 51 3-10 Graph showing the distribution of the hidden states for each gesture class.
The numbers in each pie represent the hidden state label, and the area en-closed by the number represents the proportion. ... 53 3-11 Articulation of the six gesture classes. The first few consecutive frames of
each gesture class are displayed. Below each frame is the corresponding hidden state assigned by the multi-class HCRF model. ... 55
4-1 Diagram illustrating a speaker encountering a communication error. Notice that during the system's conversation turn (from time tl to time t2), where it is giving an erroneous reply, the speaker raised her eye brows and spouted to signal an error. We will use this video segment during the system's conversational turn to detect communication errors. . ... 58 4-2 Our visual feature motion estimation algorithm consists of estimating the
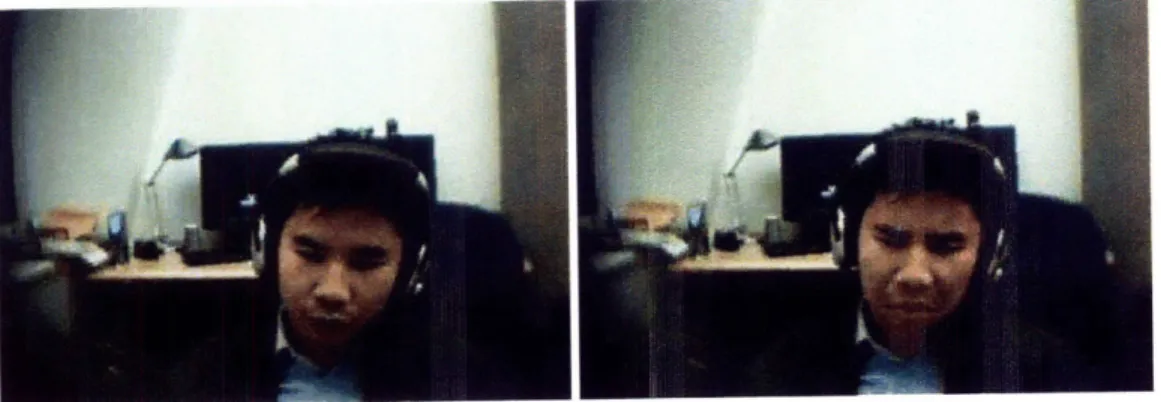
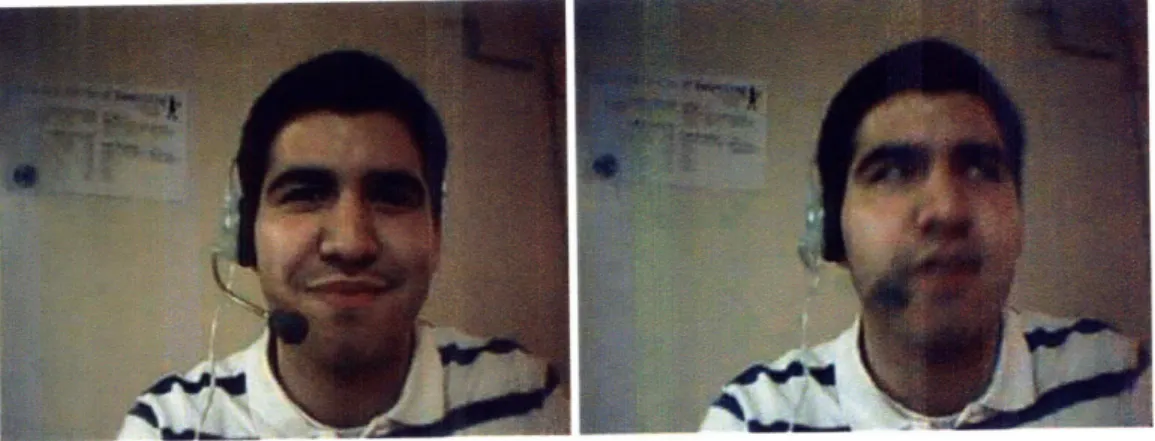
rigid motion component and compensated optical flow on the face surface. In the two images above, the blue box represents the estimated rigid head motion. The estimated optical flow points are represented as red points on the face. The blue or green streaks in certain regions of their faces represent significant flow motion. The regions where the blue or green streaks occurred are also indicative of a communication error. ... 63 4-3 Sample images of a subject in the hidden camera dataset. The first image
is an example of the subject in a non-error state, and the second image is an example of an error-state. Note that in this setup, the subject has no knowledge of the hidden camera capturing his footage. ... . . 69
4-4 Photo of a subject testing the system in the hidden camera dataset. The subject communicates with the system via the microphone array in front of the computer screen. Note that the camera and the second microphone recording the user are not visible in this picture. . ... 69 4-5 Photo of the restaurant query system. Subjects clicked on a button
when-ever they wanted to speak to the system. The reply by the system can be heard aurally or visually on the interface. . ... 70 4-6 (top) ROC curves showing the performance of the different classifiers of
vi-sual features. (bottom) ROC curves showing the performance of the differ-ent classifiers using audio features. From this figure, HMMS and HCRFs do not perform well on the audio features, while HCRFs perform much better than HMMs on visual features. ... . . . 72
4-7 (top) ROC curve showing the performance of different classifiers using PRODUCT rule for fusion. (bottom) ROC curve showing the performance of different classifiers using SUM rule for fusion. Both curves show that in most fusion cases, there is a lightly poorer performance in fusion. How-ever, late fusion by using the SUM rule to combine the HCRF classifiers in audio and visual stream improved the performance significantly. ... 73 4-8 Sample images of a subject in the motivation dataset. The first image is
an example of the subject in a non-error state, and the second image is an example of an error-state. Note that in this setup, the camera is visible to the subject ... ... 75 4-9 Average ROC curve and error bars for detecting communication errors in
a natural environment. The green circles represent the performance of four human observers. ... 76 4-10 Sample images of a subject in the posed expression dataset. The left image
is an example of the subject in a non-error state, and the right image is an example of an error-state ... 77 4-11 Average ROC curve and error bars for detecting communication errors on
a staged dataset. The red line, which is used as a reference here, represents detection accuracy at 50%. ... 78 4-12 Average areas under the ROC curve and the error bars that are using
dif-ferent visual features. From this figure, using the combination of the facial and head motion features performed better. ... . . . .. 79
5-1 Sample images of a subject in the Tilburg dataset. The left image is an example of the subject in an error state, and the right image is an example of a non-error state. Note that in this setup, the camera is visible to the
subject. ... 87 5-2 Avatars used for visual feedback. In the dataset accompanied with visual
5-3 ROC curves for detecting communication errors using various algorithms
for the second experiment. ... 92
5-4 ROC curves for detecting communication errors using partition 1. ... 93
5-5 ROC curves for detecting communication errors using partition 2. ... 94
5-6 ROC curves for detecting communication errors using partition 3. ... 95
5-7 ROC curves for detecting communication errors using partition 4. ... 96
5-8 Averaged ROC curves for detecting communication errors using all partitions. 97 5-9 Diagram showing a breakdown of a portion of an error test sequence into frames. The top row displays the original frames, the 2nd row displays the corresponding face tracker superimposed on the original frame. The table below the frames show the cumulative vote count for errors versus non-errors. The bottom row shows the words spoken by the system at the same time. These words were part of the reply ""So you want to travel from Boston to San Francisco on Monday at 9 am?" ... . . . . .. 98
5-10 ROC curves for detecting communication errors using the passive partition. 99 5-11 ROC curves for detecting communication errors using the active partition. . 100 5-12 ROC curves for detecting communication errors using the no display parti-tion. . . . 101
5-13 ROC curves for detecting communication errors using the avatar display partition .. . . . 102
A-i Confusion matrix and the performance metrics calculated for this thesis. . . 108 A-2 (top graphs) ROC curves showing the performance of the different
classi-fiers of visual features. The left curve shows the ROC curve plotted using Algorithm 1 and the right shows the same curve plotted using Algorithm 2. (bottom graphs) ROC curves showing the performance of the different classifiers using prosody features. The left curve shows the ROC curve plotted using Algorithm 1 and the right shows the same curve plotted us-ing Algorithm 2. Notice that the graphs in the left column contain many L segments or segments that are made up of sums of multiple step functions. 111
A-3 The HCRF ROC curve from visual features classification and its convex hull. 112 A-4 ROC curves for detecting communication errors using various algorithms
for the second experiment of the Tilburg dataset. The raw unsmoothed curve is displayed the left figure while the convex-smoothed version of the same curve is displayed on the right. . ... .. 112
A-5 ROC curves for detecting communication errors using partition 1 of the Active-Avatar dataset. The raw unsmoothed curve is displayed the left fig-ure while the convex-smoothed version of the same curve is displayed on the right .. . . . 113 A-6 ROC curves for detecting communication errors using partition 2 of the
Active-Avatar dataset. The raw unsmoothed curve is displayed the left fig-ure while the convex-smoothed version of the same curve is displayed on the right.. . . .. .. . . .. 113 A-7 ROC curves for detecting communication errors using partition 3 of the
Active-Avatar dataset. The raw unsmoothed curve is displayed the left fig-ure while the convex-smoothed version of the same curve is displayed on the right .. . . . 114 A-8 ROC curves for detecting communication errors using partition 4 of the
Active-Avatar dataset. The raw unsmoothed curve is displayed the left fig-ure while the convex-smoothed version of the same curve is displayed on the right... 114 A-9 ROC curves for detecting communication errors using the passive
parti-tion of the Active-Avatar dataset. The raw unsmoothed curve is displayed the left figure while the convex-smoothed version of the same curve is dis-played on the right. ... 115 A-10 ROC curves for detecting communication errors using the active partition
of the Active-Avatar dataset. The raw unsmoothed curve is displayed the left figure while the convex-smoothed version of the same curve is dis-played on the right. ... 115
A-11 ROC curves for detecting communication errors using the no display
parti-tion of the Active-Avatar dataset. The raw unsmoothed curve is displayed the left figure while the convex-smoothed version of the same curve is dis-played on the right. ... 116 A-12 ROC curves for detecting communication errors using the avatar partition
of the Active-Avatar dataset. The raw unsmoothed curve is displayed the left figure while the convex-smoothed version of the same curve is dis-played on the right. ... 116
List of Tables
2.1 Breakdown of related work using visual cues. . ... 35 2.2 Breakdown of related work specific to conversational systems. Note that
this thesis is not limited to visual cues only. . ... 36 3.1 Statistics of Error Rates of various techniques or feature types using a
con-stant feature length of 4. The standard deviation and the average error rate of the LDA features is smaller than the other feature types. This shows that LDA features will lower the error rate consistently ... 50 3.2 Comparisons of recognition performance (percentage accuracy) for body
poses estimated from image sequences. . ... 52 3.3 Experiment on 3 arm gesture classes using the multi-class HCRF with
dif-ferent window sizes. The 3 difdif-ferent gesture classes are: EV-Expand Ver-tically, SV-Shrink Vertically and FB-Flip Back. The gesture recognition
accuracy increases as more long range dependencies are incorporated. . . . 54
5.1 Breakdown of the Active-Avatar dataset, we have two variables: type of input and type of display. This produces four partitions. The number in each entry represents the partition number, which we use as a reference later on. ... 88 5.2 Breakdown of datasets collected for communication error detection ... 91
Chapter 1
Introduction
Many spoken dialogue systems have difficulty detecting the occurrence of communication errors. By our definition, a communication error occurs when the conversational system misinterprets the user and makes an erroneous reply. Considerable research has been in-vested in monitoring audio cues to detect such communication errors. Various researchers have shown that human users change their speaking style when they encounter a problem with a conversational system [59]. For example, users tend to speak slower or louder when speech recognition errors occur. These problems motivated the monitoring of prosodic as-pects of a speaker's utterances. Different studies using prosodic features to detect commu-nication errors automatically have achieved varying results. For example, Oviatt et al. [59]
showed that hyper-articulation in speakers is highly indicative of system errors. However, Ang et al. [1] conducted a separate study and contradicted Oviatt's findings. Another group of researchers demonstrated the use of speech recognition confidence scores [3, 22] to de-tect errors robustly. Hirschberg et al. [41], showed otherwise and that a combination of prosody features and the confidence scores attained better accuracy.
A recent perceptual study [5] indicated that conversational error detection can be im-proved significantly if visual modalities are taken into account when the speaker is listen-ing. This study showed that human observers performed better at recognizing communi-cation errors when they were given the visual footage when the speaker is listening to the system's response as compared to when only audio recordings were provided. This insight motivates us to detect communication errors automatically by using the non-verbal facial
r~'zz
Oompiat~vFigure 1-1: Diagram illustrating a speaker encountering a communication error. Notice that during the system's conversational turn (from time tl to time t2), where it is giving an erroneous reply, the speaker twitched his eyes naturally to signal an error. This suggests that visual analysis during the system turn may be useful.
expressions of the speakers when the system is making its reply. Figure 1-1 illustrates the reaction of a user experiencing a speech recognition error from a conversational system. Notice that when the system is giving its reply, the co-occurring facial expressions can be indicative of the communication state. In most existing work, when a system makes an erroneous reply, errors are detected only during the speaker's next turn in the conversa-tion, but the above insight shows that we can possibly detect errors within the same turn. Systems could potentially benefit from this early feedback to improve the quality of the conversation.
Figure 1-2 shows several other facial expressions that co-occurred with communication errors in various datasets we have collected (which we will describe in detail in Chap-ters 4.3 and 5). From this figure, different negative-valence emotions typically occur with a communication error e.g. frustration, disgust, confusion etc. It is difficult to precisely determine the emotions that are involved in communication error, so we have taken the approach of detecting error conditions directly from perceptual signals, rather than via an intermediate emotion representation. Note that we are not claiming that we can detect communication errors in all scenarios; rather, the detection attains high accuracy during specific types of replies by the system. An instance where our mechanism may break down could be where no speech recognition error occurred, but the speaker did not like the path the course of the conversation was taking and he/she may roll his/her eyes. Clearly the distinction between error and frustration is a subtle one; as described in more detail in later chapters we presume ground truth is available for training, marking with boolean labels which dialog turns resulted in a communication error.
Figure 1-2: Images of different subjects during a communication error. Notice that different emotions are conveyed e.g. frustration, confusion, disgust etc, but they all occur during a communication error. Our work will not detect these emotions, but instead focus on detecting communication errors using these indicative visual cues.
Detecting communication errors robustly, faces many challenges. First, there is a large variety of expressions that are indicative of an error, e.g. from subtle expressions like a stare or a frown, to highly distinctive ones like a pout or a sulk. The model needs to learn this high variability of expressions and recognize them as the same error state. Second, while a single image frame of the expression may not be distinct, the sequential dynamics of these frames and the motion patterns of some expressions become highly indicative of an error, e.g. a head shake, where the speaker typically begins with his head in a frontal pose, shifts his gaze to the left/right and reverses the direction after. This implies that the model should incorporate a structure that learns these sequence dynamics accurately. Lastly, in the sequential dynamics of these expressions, communication errors and non-errors may share a common structure. For example, a neutral, frontal face usually precedes or follows a pouting expression, which conveys a communication error. This neutral, frontal face also occurs frequently when the system reply is correct. Hence, learning a common structure between different error states could potentially be useful. Given these challenges and con-straints, we will argue that a hidden state model is the most appropriate solution. Hidden state models can capture the within class structure and the between structure by the use of hidden states.
We begin by presenting a model which shares features between gesture classes in Hid-den Markov Models (HMMs), and then proceed to explore the use of discriminative hidHid-den state models, including Hidden Conditional Random Fields and Latent Dynamic
Condi-tional Random Fields. At the end of the thesis, we develop a novel voting Latent Dynamic Conditional Random Fields method for the segmented gesture classification task which is significantly easier to train than HCRFs due to the use of an a priori partitioned latent space; this method was also empirically more accurate in most cases we tested, perhaps due to better convergence at the expense of latent space optimality.
1.1
Contributions
In this thesis, we develop a communication error detector by analyzing the speaker's facial expressions.
The key contributions of this thesis are:
* The first automatic system for detecting communication errors using facial expres-sions during the system's turn.
* Demonstrating that Gaussian Mixture Models-Linear Discriminant Analysis (GMM-LDA) and Hidden Conditional Random Fields(HCRF) are useful models for visual gesture recognition.
* Developing a voting Latent Dynamic Conditional Random Fields algorithm for effi-cient segmented gesture recognition.
1.2 Thesis Roadmap
The rest of this thesis will describe the various contributions in detail. In the next chap-ter, I will review related work. Before addressing visual conversational error detection, I will present several preliminary methods I have shown to be useful for visual gesture recognition and which motivated my later results: in Chapter ??, I will describe my ex-periments applying Gaussian Mixture Models (GMMs) and Linear Discriminant Analysis (LDA) for arm gesture recognition and in Chapter 3.2 I will present experiments demon-strating Hidden Conditional Random Fields to be a useful model for arm and head gesture
recognition. After describing gesture recognition experiments, Chapter 4 describes our ap-proach in detecting communication errors and the techniques I have used for face and head tracking. In the following chapter, I will describe using Hidden Conditional Random Fields for communication error detection. Chapter 5 will introduce voting Latent Dynamic Ran-dom Fields and how we use it for detecting communication errors. I conclude in Chapter 6 by discussing future work and limitations of our results so far.
Chapter 2
Related Work
In this chapter, I frame the problem setting for my research and overview related work. Many factors need to be considered: namely, the audio cues, the visual cues, the simultane-ous audiovisual cues and the turn of the conversation (system or speaker) etc. I will divide related work generally into three categories, namely, audiovisual emotion recognition (au-diovisual), system error detection (audio) and facial expression analysis (visual).
2.1 Audio cues
There has been considerable research activity in the domain of detecting communication problems using audio cues. All of these are focused on the audio cues produced during the speaker's turn. Oviatt [59] showed that there is a pattern of hyper-articulation in speakers when they are trying to correct system errors. The speaker's hyperarticulation subsequently leads to even worse recognition performance, due to deviations from trained acoustic and language models [72]. This work demonstrated that prosody features and statistics like pause durations, average pitch, pitch range etc were useful, but no machine learning method was used to learn and detect these errors automatically. Apart from prosodic features, an-other possible approach was to use recognition confidence scores to reject any unreliable recognizer hypotheses, either caused by hyperarticulation, or due to other reasons such as out-of-vocabulary words, noise interference, etc. Several works [3, 22] have focused on using these scores, and proposed schemes that work mainly at the frame, phoneme,
or word level. For instance, word-level confidence annotation assigns a reliability tag to each word token in the decoder hypothesis. Typically a two-class annotation scheme is used, which marks the word instance correct or incorrect. However, this type of model is not always sufficient for dialog systems. Hirschberg et al. [41] subsequently developed an automated system that used a combination of prosody features and speech recognizer confi-dence scores to detect errors. In this system, a rule based classification model was used for error learning and detection. Mixed results, however, were attained during evaluation using different datasets. In the first dataset, the speech recordings were manually segmented, and using only prosody to predict system errors, outperformed using automatic speech recog-nition (ASR) confidence scores, whereas in the second dataset, the combination of ASR confidences scores and prosody scores produced better results.
This suggests that additional higher level features could be incorporated to improve er-ror detection. Hirschberg et al. [42] used a combination of prosody features and other lexi-cal features available to the speech recognizer such as dialog history etc. to detect speaker corrections. This combination of different audio features detected corrections more accu-rately than traditional methods for ASR rejection. However, in this work, experiments were evaluated on a speaker-dependent model. A more recent work by Skantze et. al [73] also affirmed that a combination of word confidence scores, contextual and lexical features im-prove error detection. Although the detection is automatic, it suffers from high dependence on confidence scores of specific content words, which is not sufficient for dialog systems.
A related issue regards detecting the emotional state of a user, because humans some-times extend their inter-personal behavior into their interaction with computers. For exam-ple, users might express their satisfaction verbally or prosodically when a system works well for them; on the other hand, they tend to get frustrated and angry when a system keeps making errors. Thus, it is useful for a dialogue system to detect user emotion and react properly. Ang et al. [1] collected a naturally occurring dataset consisting of speak-ers engaged in an air travel reservation task that itself gives rise to emotions. This work used a combination of prosodic, langauge model and ASR features. Results show that a prosodic model can predict whether an utterance is neutral versus annoyed or frustrated with an accuracy on par with that of human interlabeler agreement. Accuracy increases
when discriminating frustration from other utterances, and when using only those utter-ances on which labelers originally agreed. However, human interlabeler agreement in this dataset was only 71% and the speakers utterances were very short e.g. yes or no, which may not be sufficient in representing the variability of words a speaker will utter under varying emotional states. The "frustrated" vs else experiment also involved very little data. At the same time, this work suggested that hyper-articulation may not be a good predictor of annoyance or frustration, which is a conflict with other previous work [59]. In gen-eral, research on emotion detection in speech has not found a unified set of features that is indicative of errors consistently in different experimental settings, and obtaining objec-tive ground truth remains challenging. Finding good acoustic cues for various emotional modes remains an interesting research problem. It is also desirable to use data from real interactions between a user and a computer, rather than data in simulated or acted mood, to carry out the experiments. In real interactions, the speaker's visual facial expressions can provide important cues to indicate communication errors.
2.2
Visual cues
Most of the vision community working on tracking face or head features do not focus their attention on detecting communication errors in conversational systems. Instead, their at-tention is turned towards facial expression analysis. There are two main streams in the current research, namely facial affect (emotion) detection and facial action unit detection. Facial affect detection aims to draw high level classifications e.g. emotional states, person-ality etc., from a given display of facial expressions. This can be achieved by passing the extracted facial features e.g. from an active appearance model (AAM), directly into a ma-chine learning algorithm like Support Vector Mama-chines (SVMs) for direct evaluation [2]. Research involving Facial Action units (AUs), on the other hand, attempt to provide a quantitative description of the face, by means of assigning intermediate labels, while the inference or classification using these labels is left to another high order decision maker. For example, a brow furrow can be judged as anger in an affect detection approach and as a facial movement that lowers and pulls the eyebrows closer together in an facial action unit
approach. The most commonly used method for manual labeling facial actions is Facial Action Coding System (FACS) proposed by Ekman et al. [27]. FACS is a comprehen-sive and anatomically based system that is used to measure all visually discernible facial movements in terms of facial Action Units.
There is some controversy over the need to use FACS for facial expression analysis. Many surveys claimed [63, 97, 21] that action units are independent of interpretation, hence they can be used for any high-level decision making process including recognition of ba-sic emotions according to Emotional FACS (EMFACS) rules 1. The labeling for the facial action units has been a manual process, which requires a trained human observer, although recently, there has been a considerable amount of work on automated estimation of FAC primitives. In addition, in existing systems that do not use FACS [2], facial features ex-tracted from images are also independent of interpretation, and the higher order inference is left to machine learning algorithms. Lastly, the approach of using FACs is not tested by the developmental psychology community. Does a baby infant decompose his parent's fa-cial expressions into action units before making the inference about his parent's emotional state? Or does the baby simply use the overall appearance (texture and shape) of the face to make the inference? To the best of our knowledge, there has been no such study. On the other hand, for psychology studies, a clear, unambiguous approach is required for human coders to discover or establish the relationship between facial behavior with cognitive state, and FACS by far has been the most objective method available.
As for interpretation or classification categories, most of the existing efforts classify expressions into the six basic emotions (fear, sadness, happiness, anger, disgust, surprise). These classification categories are proposed by Ekman [26] and discrete emotion theorists, who suggest that these six emotions are universally displayed and have a marked reference representation in our affective lives. There are a few efforts to detect non-basic affective states from deliberately displayed facial expressions. For example, Gu and Ji and Ji et al. [35, 38] used facial action units as features to a Dynamic Bayesian Network(DBN) to detect fatigue. Yeasin et. al [91] implemented a two-stage classification approach that first recognizes six universal facial expressions, and later computes the levels of interest by
mapping the facial expressions into a 3-D affect space.
The following works mentioned in this paragraph are closest to our thesis as they all use visual analysis of a user's frustration or disagreement in an interactive setting. El Kaliouby et al. [29], proposed an automated DBN system that uses head motion and facial action units to classify the following mental states: agreement, disagreement, interest, concen-tration, uncertainty, thought, but the dataset consisted of emotions performed on demand and were not necessarily reflective of realistic conversation. Teeters et. al [78] extended El Kaliouby's work and presented a wearable camera system for real time classification of the same mental states in a human-to-human social interaction setting as a self-reflection tool. Communication errors could possibly have been inferred from the detection of several mental states, but to our knowledge, there was no attempt to learn such an association and no analysis on how the conversation state could be correlated to the mental state. Kapoor et al. [46] used a Gaussian process classification technique to detect user frustration and included several other modalities like skin conductance, mouse pressure as feature inputs. In a separate work, Kapoor and Picard [45] used a mixture of Gaussian processes for multi-sensory fusion to detect interest in children. Both works were not directly evaluated in a conversational dialog setting.
In all these works, with the exception of [45, 46], the facial expressions are deliberate or exaggerated displays. Studies have shown that people do different things with their faces when posing versus during a spontaneous experience. Ekman et al. [28] found that directed facial action tasks differ in timing from spontaneously occurring behavior. Cohn et al. [19] showed that spontaneous smiles were of smaller amplitude and had a larger and more con-sistent relation between amplitude and duration than deliberate smiles. Valstar et al. [81] developed a multimodal approach to distinguish between posed and spontaneous smiles and attained a 94% accuracy. Tian et. al. [77] found that many people are able to raise their outer brows spontaneously while leaving their inner brows at rest but few can perform this action voluntarily. Valstar et al. [80] showed that the temporal dynamics of brow actions like velocity, duration, and order of occurrence of brow actions are highly relevant param-eters for distinguishing posed from spontaneous brow actions. Littlewort et al. [50] found that the lower eye brow action unit was the key feature in distinguishing between faked
pain from spontaneous pain expressions. Given these recent spate of findings, there has been a growing effort on automatic analysis of spontaneous facial expressions. Some of them study automatic recognition of Action Units rather than emotions from spontaneous facial displays. For example, Valstar et al. [81] and Cohn et al. [19] analyzed the muscle activity of orbicularis oculi (action unit 6), zygomaticus major (action unit 12), depressor anguli oris (action unit 15), and mentalis (action unit 17) for distinguishing posed smiles from spontaneous ones.
In general, the extracted visual features can be divided into two types: 2D spatio-temporal features or 3D face models. For 2D spatio-spatio-temporal facial features, the extracted features are typically either geometric features such as the shapes of the facial components (eyes, mouth, etc.) and the location of facial salient points (corners of the eyes, mouth, etc.) or appearance features representing the facial texture including wrinkles, bulges, and furrows. For geometric-feature based methods, Chang et al. [15] used a shape model that consisted of 58 facial landmarks. The shape model is based on manifold embedding and probabilistic modeling in the embedded space. In his system, however, all of the learn-ing/recognition is offline and far from real time. There is no rescue strategy when the system fails, which is necessary in a practical system. Pantic and her colleagues [64, 81] extracted a set of facial characteristic points around the mouth, eyes, eyebrows, nose, and chin. They use a point-based model composed of two 2D facial views, the frontal and the side view. Multiple feature detectors are applied to each prominent facial feature, and the best of the detected features are selected. This system cannot deal with minor inaccuracies of the extracted facial data and it deals merely with images of faces without facial hair or glasses. For appearance-feature based methods, Bartlett et al. [8] and Guo and Dyer [36] used Gabor wavelets as inputs to their classifier for Action Unit recognition. Although recognition rates are high, Gabor wavelets are inefficient in memory usage and slow due to the high redundancy of the Gabor representation. A more efficient representation is proposed by Whitehill and Omlin [89] who used boosted Haar features.
A few approaches to automatic facial expression analysis are based on 3D face models. Huang and his colleagues [18, 71, 88, 95] used features extracted by a 3D face tracker called Piecewise Bezier Volume Deformation Tracker [76]. This model calculates
corre-spondences based on the geometry using a 3D deformable/morphable model. While the recovered low dimensional model can be used effectively in classification, the low degree of freedom in this model is not a sufficient representation of spontaneous facial expres-sions, since many distinct characteristics lie in the subtle details such as the wrinkles and the furrows that are generated by highly local skin deformations. Cohn et al. [20] fo-cused on analysis of brow action units and head movement based on a cylindrical head model [90]. Chang et al. [15] and Yin et al. [83, 92] used 3D expression data for facial expression recognition. In general, the advantage of 3D face models is that they may yield view-independent facial expression recognition, which is important for spontaneous facial expression recognition because the subject can be recorded in less controlled, real-world settings. However, the trade off would be the the lower degree of freedom in the model.
For a more detailed survey of machine analysis of facial expressions and the state of the art methods, readers are referred to two comprehensive reviews by Fasel et al. [30] and Pantic et al. [63].
2.3 Audiovisual cues
A comprehensive survey of using audiovisual cues for emotion recognition can be found
in [23, 97]. The most recent and relevant work was presented by Zeng et al. [94], who used a voting method to combine the facial expression and prosody-based emotion classifiers to improve affect recognition. However, due to the higher frame rates coming from the audio classifier, the voting mechanism is biased more to audio cues than visual cues. In addition, their facial expression tracker requires initialization from a neutral expression. Chen [16] fused the scores of facial feature and prosody classifiers occurring sequentially in time. In this work, however, a pure facial expression is assumed to precede and follow a spoken sentence, which is not a realistic assumption and automatic segmentation of this facial expression is poorly defined. Yoshitomi et al. [93], used a weighted sum of neural network classifiers to combine audio and visual features. Song et al. [74] proposed a tripled hidden Markov Model (HMM) to perform audio visual emotion recognition. The key advantage of this model was allowing asynchrony of the audio and visual observation sequences while
preserving their natural correlation over time. All these audiovisual methods however, were evaluated on facial expressions or emotions that are deliberately produced upon request.
There are several recent efforts on detecting spontaneous affect audiovisually under various data collection scenarios. Caridakis et al. [13] used data collected in Wizard of OZ scenarios. In this system, as visual input, facial animation parameters (FAPs) were extracted from key facial feature points e.g. eyes, nostrils, mouth etc, per frame, while segmented-based prosodic features were extracted as audio input. Both features are passed into a Recurrent Neural Network(RNN) for evaluation into four categories. Zeng et al. [96], used the data collected in a psychological research interview (Adult Attachment Interview). This work proposed an Adaboost multi-stream hidden Markov model (AMHMM) to inte-grate audio and visual affective information. The sample size of the datasets collected for evaluation by Caridakis et al. [13] and Zeng et al. [96] is very small, containing four [13] or two subjects [96] respectively.
Note that all the above techniques for visual analysis of emotion that occur during the speakers turn, could be applied to communication error detection during the system's turn. The key difference lies in the features used. Typically, affect recognition in audiovisual analysis like Zeng et al. [94, 96] and Chen et al. [16] during the speaker's turn, will suffer from poorer discrimination of facial expression among different affect. This is because movements of facial features are related to both affective states and the co-occurring content of speech. Hence, during the speaker's turn, features that represent the facial movements around the mouth may not be very useful. On the other hand, for the task of communication error detection, during the system's turn, the subject is listening in silence most of the time, and all facial motion features can be used. These facial motion features are typically very subtle, occur at very small regions of the face, and happen almost instantaneously. However, the 3D-models used in [94, 96, 20, 71] have a low degree of freedom and may not be sufficient in representing the high degree of freedom of motions in the face. Likewise, the features used in [45, 29, 78], only track the lips, the eyes and the eyebrows; other regions around the face e.g. cheeks (see Figure 4-2), which we will show in Chapter 4.2, are also very useful indicators of communication errors.
Table 2.1: Breakdown of related work using visual cues.
Work Types of Features Classification
Chang et al. [15] Active shape model(ASM) GMM in embedded space Kapoor et al. [45] Various Mixture of Gaussian processes Wang et al. [87](and this thesis) Optical Flow Hidden state models
Zeng et al. [94] PBVD Naive Bayes
Caridakis [13] FAP Recurrent Neural Networks
Chen et al. [16] PBVD SNoW
Bartlett et al. [7] Gabor filters Adaboost
Whitehill and Omlin [89] Haar features Adaboost
Lucey et al. [53] Active Appearance Model(AAM) SVM PBVD: Piecewise Bezier Volume Deformation
GMM: Gaussian Mixture Model FAP: Facial Animation Points SNoW: Sparse Network of Winnows
the conversational system's reply. Our work is motivated by a perceptual study conducted by Barkhuysen et al. [5], which showed that human observers performed better at detecting errors when they only view the visual footage of the speaker listening to the response of the system than when they only use audio cues. Previous works only use the speaker's audio and/or visual features in the next conversational turn to detect errors, but this psychological insight shows that we could detect the errors earlier within the current turn. In addition, we are only concerned with a binary detection of communication errors, without the need for labeling the specific emotions. As such, our labeling process is very simple and unam-biguous. A speaker makes a query, and the system gives a reply. If the reply is incorrect, a communication error has occurred. A table summarizing related work in conversational systems is shown in Table 2.2 and a table summarizing related work using visual cues is shown in Table 2.1.
Table 2.2: Breakdown of related work specific thesis is not limited to visual cues only.
to conversational systems. Note that this
Emotion / Turn
Work Communication Input of
detection? conversation
Oviatt et al. [59] Shriberg et al. [72]
Hirschberg et al. [42] Communication Audio only Speaker Ang et al. [1]
Bansal et al. [3]
Wang et al. [87] Communication Mostly System
(and this thesis) Visual
Kapoor et al. [45] Emotion Visual+others Not conversational, learning setting Teeters et. al [78] Emotion Visual only Not conversational,
social setting El Kaliouby et al. [29] Emotion Visual only Not conversational,
pre-recorded enactment Zeng et al. [94, 96]
Caridakis [13] Emotion Audiovisual Speaker
Chapter 3
Gesture Recognition with discriminative
models
In this chapter, we will describe two techniques we have explored to improve gesture recog-nition that predated our work on communication error detection. Communication error detection is a type of gesture recognition problem and the algorithms from our gesture recognition analysis led to the development of the algorithm for error detection that we will show later. In our introduction, we defined our problem as detecting a communication error given a pre-segmented sequence of observations. This problem can also be framed as making two possible interpretations, error or no error, from a given sequence. Such a formulation is analogous to a "two class" segmented gesture recognition problem (as illus-trated in Figure 3-1). Readers who are only interested in communication error detection can skip this chapter and proceed directly to Chapter 4.
The key intuition driving the design of the algorithms is that many human gestures classes, while distinct at specific key frames, still share some common features or states. For example, Figure 3-2 shows two subjects articulating two different arm gesture se-quences. The top image sequence is a gesture telling the computer screen to shrink lat-erally, while the bottom sequence is a gesture telling the system to display the next screen. If we just compare frame a and frame d, we can see two distinctive body poses, which tells the two gestures apart. However, if we only look at frames b,c and e, the body poses look very similar. This suggests that a model which allows different gesture classes to share
Gesture= Flip Forward ? or Expand ?
Figure 3-1: Diagram illustrating the similarity between error detection (system diagram on the left) and gesture recognition (system diagram on the right).
Frame a
Frame c
Frame b
Frame e Frame d
Figure 3-2: Two gesture sequences displayed from frame to frame. The top sequence is a gesture commanding the system to shrink the screen in size, while the bottom sequence is a gesture asking the system to switch to the next screen. The body poses in frames a and d are very different from one another, however, the body poses in frames b, c and e are very similar. This suggests that models that allow shared features could be useful.
--7
-Error? No error?
common body poses will be useful. At the same time, we can tell the two gestures in Fig-ure 3-2 apart from the sequential dynamics between image frames. This suggests that a model should incorporate a structure that learns the pose transitions. A hidden state model becomes the most appropriate because the hidden states have the dual purpose of allowing the sharing of features between classes, and of learning the sequential structure of the ges-tures. To share features, common poses in difference gesture classes can be assigned the same hidden state label. In practice, fully observable models are not as successful because the observations do not provide a complete description of gesture sequences and to allow for sharing of features between classes, fully observable state labels will be required. We begin with discriminative vector quantizing features in HMMs, which provide evidence that sharing features is useful.
3.1 Discriminative Vector Quantization
One of the most common approaches for gesture recognition is based on the Hidden Markov Model (HMMs) [69]. Typically, a separate HMM model is trained per gesture class, and during evaluation, a test sequence is passed into each HMM model, and the model with the highest scoring likelihood is the interpreted class of the test sequence. The drawback with this approach is that the HMM models are trained independently of one another, without allowing the features to share a common subspace before training or evaluation. To over-come this, we have shown [84] how Linear Discriminant Analysis (LDA), a technique used in feature separation of phonemes in speech recognition [43], can improve the performance of an arm gesture recognition system.'
We propose modeling body gestures using elementary units, called "gestemes" [44]. Gestemes are estimated in the following way:
An input feature vector, fn is a vector of K consecutive poses.
fn = (HIm, rn+l, ... , ,i n+K-1)
T
1The material in this section was previously published in [84] S. Wang and D. Demirdjian "Inferring body pose using speech content". In Proc. ICMI, October 2005, Trento, Italy.
Such a feature vector incorporates information about the pose and motion dynamics. We assume that there are B gestemes that model all the features in our L classes of gestures. A Gaussian Mixture Model containing B centers was estimated using a set of training feature vectors. All the Gaussians are assumed to have full covariances. Parameters for the B Gaussians are determined from the set of training feature vectors fn, 1 < n < N, using the EM algorithm to maximize a global likelihood function given below:
N B
L J og 6ip(fnli)
n=1 i=1
where p(f, i) is a single component of the mixture of Gaussians, and 6i is the ith compo-nent's mixing proportion.
Once this likelihood is maximized, each Gaussian cluster is assigned a unique label. The probabilities of each training feature belonging to each cluster, p(i fn) are evaluated to determine the most likely cluster they belong to.
Lf, = arg maxp(i f,)
where Lf," is the best scoring Gaussian's label assigned to training feature fn. After this
classification of the feature vectors into gesteme clusters, a projection matrix, that separates these feature vectors in an optimal way, is estimated by running LDA on these labelled training features.
Suppose there are B labels, then the within class expected covariance is: B
Sl= pi, Ai
i=1
where pi is the prior probability and Ai is the covariance of Gaussian i respectively. The mean of the whole mixture of Gaussians is computed as
B
Uoverall Pi Ui
i=1
where ui is the mean of each Gaussian component. The between class variance is then computed as
Sb = Uj - Uoverall) X (U - Uoverall)T
Assuming a class-independent transform, the optimizing criterion, J(w) is computed as
J(w) = (Sw) - 1 x Sb
The projection matrix, r, is found as the eigenvector matrix of J(w) and the projected feature vector, f.' becomes
fn = r
Tfn
These projected feature vectors, which are more distinct between classes, and less dis-persed within each class, are then used for training the HMM to classify the features by the gesture classes.
Appendix 3.5 will describe the dataset we have used and the experiments conducted for evaluating this method. Our results confirm that discriminative vector quantization is a useful technique. By combining GMM and LDA together, we show that the error rates for the gesture recognition decreased significantly. However, the Hidden Markov Model has the unrealistic assumption that observations are conditionally independent. At the same time, the gestures are trained in separate models; a single discriminative model that is jointly trained on all gesture classes can potentially learn a better partition between the gesture classes. With this insight, we proceed to the next chapter and apply Hidden Conditional Random Fields to allow sharing of the features using hidden states.
3.2 Hidden Conditional Random Fields (HCRFs)
In Section 3.1, shared features were passed into Hidden Markov Models(HMMs) for eval-uation. However, these models assume that observations are conditionally independent.
This restriction makes it difficult or impossible to accommodate long-range dependencies among observations or multiple overlapping features of the observations. To overcome this constraint, we turn our attention to hidden conditional random fields (HCRFs).
Conditional random fields use an exponential distribution to model the entire sequence given the observation sequence [12, 24, 49]. This avoids the independence assumption be-tween observations, and allows non-local dependencies bebe-tween state and observations. A Markov assumption may still be enforced in the state sequence, allowing inference to be performed efficiently using dynamic programming. CRFs assign a label for each observa-tion (e.g., each time point in a sequence), and they neither capture hidden states nor directly provide a way to estimate the conditional probability of a class label for an entire sequence. We propose a model for gesture recognition which incorporates hidden state variables in a discriminative multi-class random field model, extending previous models for spatial CRFs [67] into the temporal domain2. By allowing a classification model with hidden states, no a-priori segmentation into substructures is needed, and labels at individual obser-vations are optimally combined to form a class conditional estimate.
This hidden state conditional random field model can be used either as a gesture class detector, where a single class is discriminatively trained against all other gestures, or as a multi-way gesture classifier, where discriminative models for multiple gestures are simulta-neously trained. The latter approach has the potential to share useful hidden state structures
across the different classification tasks, allowing higher recognition rates.
3.3 HCRFs: A Review
We will review HCRFs as described in [67]. We wish to learn a mapping of observations x to class labels y E Y, where x is a vector of m local observations, x = {Xl, 2, ... Xm}, and each local observation xj is represented by a feature vector q(xj) E CRd.
An HCRF models the conditional probability of a class label given a set of observations
2The material in this section was previously published in [85] S. Wang, A. Quattoni, L. Morency,
D. Demirdjian and T. Darrell, "Hidden Conditional Random Fields for Gesture Recognition". In CVPR 2006, New York City, USA.
Figure 3-3: HMM model. Suppose there are n gesture classes we need to classify. n HMM models are trained, and during evaluation a test sequence of m observations is passed into
each HMM model. The highest scoring model is the interpreted gesture class.
~0*
00
-Figure 3-4: CRF Model. A single exponential model is trained on all gesture classes. Given an observation sequence x, which is a vector of m frames, a class label Yj is assigned per frame. During evaluation, the highest scoring sequence of labels Y where Y is a vector of
-
-Figure 3-5: HCRF Model. A single exponential model like the Conditional Random Field model, trained on all gesture classes. However, an intermediate level of hidden states is included. During training, the distribution of hidden states is learned per class. During evaluation, a single class label Y is assigned.
by:
P(y I x, 0) = P(y S I X,
0) E
s
T(Y(3.1)
s
Zy'CY,sES
m e'(y',s,x;0)where s = {sl, s2, ... , Sm}, each si E S captures the unique underlying structure of each class and S is the set of hidden states in the model. If we assume that s is observed and that there is a single class label y then the conditional probability of s given x becomes a regular CRE The potential function 'IF(y, s, x; 0) E R, parameterized by 0, measures the compatibility between a label, a set of observations and a configuration of the hidden states. Following previous work on CRFs [49, 12], we use the following objective function in training the parameters:
L(O) = log P(y I xi,) - 11012 (3.2)
i=1
where n is the total number of training sequences. The first term in Eq. 3.2 is the log-likelihood of the data; the second term is the log of a Gaussian prior with variance o2,
i.e., P(0) exp