WORKING
PAPERS
SES
N. 462
XI.2015
An Experimental Evaluation
of an Anti-Corruption
Intervention among Ukrainian
University Students
Elena Denisova-Schmidt,
Martin Huber, and
An Experimental Evaluation of an Anti-Corruption Intervention
among Ukrainian University Students
Elena Denisova-Schmidt∗, Martin Huber∗∗, and Yaroslav Prytula∗∗∗
∗ University of St. Gallen ∗∗ University of Fribourg
∗∗∗ Ivan Franko National University of Lviv
Abstract: In this paper, we investigate experimentally the effect of an anti-corruption intervention − an info folder
based on materials developed by Transparency International − on Ukrainian university students’ willingness to participate in an anti-corruption campaign and their general attitude toward corruption. In a survey of 600 students in the Ukrainian city of Lviv, individuals were randomly exposed to either the anti-corruption folder (treatment group) or a folder with information about Lviv (control group). The results suggest that students who have previous experience with bribing are more open to the campaign, while the effect on the total sample is not statistically significant. Furthermore, the intervention increases the overall perception that corruption is a (long-term) part of society rather than a temporary phenomenon. Finally, students with experience in corrupt practices tend to adopt a more negative view of corruption. For those without such experiences, however, we find some indication that the treatment could bolster the acceptance of corruption by instructing the students about its dissemination. The effects of this intervention are therefore ambivalent and appear to depend on the students’ previous exposure to corruption.
Keywords: Anti-Corruption Campaigns, Corruption, Academic Integrity, University, Students,
Ukraine, Experiment, Randomized Trial.
JEL classification: D73, C93
This study was conducted with financial support provided by the Center for Governance and Culture in Europe at the University of St. Gallen and the Department of Economics at the University of Fribourg. The sponsors influenced neither the research design nor the interpretation of the results. The preliminary findings were discussed at a colloquium of the Department of Politics and the Economics Research Center for East European Studies at the University of Bremen, led by Heiko Pleines, on 14 November 2014. We would also like to thank Alena V. Ledeneva, Elvira Leontyeva, and Anna Solovyeva for their valuable feedback.
Addresses for correspondence: Elena Denisova-Schmidt ([email protected]), University of St. Gallen (HSG), Gatterstr. 3, 9010 St. Gallen, Switzerland, Martin Huber ([email protected]), University of Fribourg, Bd. de Pérolles 90, 1700 Fribourg, Switzerland, Yaroslav Prytula ([email protected]), Ivan Franko National University of Lviv, vul. Universytetska 1, 79000 Lviv, Ukraine.
∗Elena Denisova-Schmidt is also affiliated with the Aleksanteri Institute (Helsinki University), and School of Slavonic and East European Studies of University College London (UCL-SSEES).
1. Introduction
Corruption is a longstanding problem in many post-Soviet countries. Since its independence in 1991, Ukraine has gone through two revolutions − the Orange Revolution in 2004 and the Revolution of Dignity in 2014 – and in both cases, one of the catalysts was the fight against corruption. Yet reforms aiming to combat corruption have arguably not resulted in important changes (see for instance Grødeland (2010) for an evaluation of the post-2004 period and The Economist (2015) for a more recent assessment). As an illustration, Geoffrey Pyatt, US Ambassador to Ukraine, is cited in Åslund (2015) as claiming that actors working for Ukrainian national agencies who are responsible for the implementation of anti-corruption changes are in fact ‘making things [even] worse by openly and aggressively undermining reform[s]’. Anti-corruption reforms should entail not only the elements of a ‘publicity stunt’, as was the case with the reform of the traffic police (Åslund, 2015). Such reforms should also go to the roots of endemic corruption in the country by tackling the improper dependencies and reducing the unprecedented role of oligarchs (Economist, 2015, Åslund, 2014) as well as by raising the quality of (higher) education through quantification (Denisova-Schmidt and Leontyeva 2014).
This paper aims to assess the effects of an anti-corruption intervention on Ukrainian university students’ willingness to participate in an anti-corruption campaign and their moral judgment about corruption in general. Specifically, the intervention is defined as being exposed to an informational folder based on materials designed by the NGO Transparency International (https://www.transparency.org/) that point to the damage to the higher education system caused by corruption. To evaluate the intervention’s effectiveness, a field experiment was conducted in several universities in Lviv, a major city in western Ukraine, in the spring of 2015. In the course of a survey of students, 600 individuals were randomly chosen to be exposed to the anti-corruption folder (treatment group) or to a folder with information about the demographic situation in Lviv (control group).
The results suggest that students who previously experienced corruptive behavior at the university level are more willing to participate in an anti-corruption campaign, while the average effect on all the students – including those without previous exposure to corruption – is statistically insignificant. Furthermore, we find that the intervention has an influence on students’ opinion of corruption in general: In the total sample and across various subgroups, the intervention by and large increases (at least in the short run) the perception that corruption is a part of society rather than a temporary phenomenon. In addition, those students with experience in dishonest or corrupt practices are induced to adopt a more negative view of corruption (calling it “bad” or “a crime”), possibly due to an effect of shaming. For those students without such experiences, we find some
indication that the intervention could, by teaching them about the dissemination of corrupt behavior, augment the acceptance of corruption through an increase in the view that “corruption is a means to solve problems”. Our heterogeneous effects therefore point to the possibility that, depending on previous exposure to corruption and cheating, the same intervention may have different impacts on different groups, which seems worth considering when designing anti-corruption campaigns.
Corruption in higher education − defined as ‘the abuse of entrusted power for private gain’ (Transparency International) and “the lack of academic integrity” (Heyneman, 2004, 2013) − might take place in different settings: from the university admissions process to the rules of academic integrity set for students, faculty and staff to the governance of educational institutions (Chapman, 2002, Chapman and Lindner, 2014, Hallak and Poisson 2007, Sweeney, Despota, and Lindner, 2013). All of these forms of corruption might influence the students’ values, beliefs, and lives, either directly or indirectly (Rumyantseva, 2005). In spite of the fact that corruption in higher education has a long history − the first reported cases of mishandled test scores date as far back as the time of the Ch’ing dynasty in China in 1644 − the wave of global attention it is currently experiencing only began in the 1990s (Heyneman, 2013). Some of the factors that have influenced this tendency include the movement towards mass higher education and the heightened competition between educational institutions for resources (Heyneman, 2013, Shaw, 2013, Chapman and Lindner, 2014).
For decades, students in different countries have been actively involved in demanding reforms in higher education and beyond (Altbach 1966, 1979, 1981, 1989a, 1989b, 1989c, 1991, 1992, 2006, Klemencic 2014), which includes protests against corruption as recently witnessed for instance in Bulgaria (2013) and Ukraine (2004, 2013-14) (Altbach and Klemencic 2014, Klemencic 2014). Inspired by the students’ role in society, the aim of our study is to assess experimentally the effectiveness of an anti-corruption intervention on one aspect of students’ activism, namely the willingness to participate in anti-corruption campaigns, as well as the general moral judgement of corruption among students at Ukrainian universities.
Experiments have a long tradition in social sciences and are considered to be the ‘gold standard’ for causal inference by many researchers, see for instance Imbens (2010). If properly implemented, experiments allow most credibly assessing the causal effect of an intervention by relying on less severe restrictions or assumptions than other statistical methods. Several lab, field, and natural experiments have been exploited to study corruption in various settings (Banuri and Eckel, 2012, Kubbe, and McBride, 2015), for instance its relation to cultural background. Barr and Serra (2010), for example, analyze the corrupt behavior of students with different countries of
origin studying in the UK based on lab experiments. They find that cultural background can predict corrupt behavior: students coming from highly corrupt countries might ‘import’ corrupt behavior to the UK. Analyzing the parking behavior of United Nations officials in New York in a natural experiment, Fisman and Miguel (2007) show that the number of diplomatic parking violations is strongly correlated with the level of corruption in the diplomats’ home countries. Besides cultural background, (perceived) fairness also appears to be an important aspect of corruptive behavior. Based on a lab experiment with US students, John, Loewenstein, and Rick (2014) for instance find that participants are more ready to cheat not because of monetary incentives, but because they know that others are cheating as well. This suggests that it is a comparison with others (rather than the monetary pay off) that might lead to an increase in cheating. The study outcomes potentially explain endemic corruption in some countries: if corruption is permissible for the government, it might also be so for citizens in general.
Another strand of the experimental literature on corruption assesses the effectiveness of anti-corruption activities (however, not specifically in the higher education sector as our study). For instance, Olken (2007) tests the effects of top-down and bottom-up anti-corruption strategies in a field experiment in Indonesia. His results suggest that the top-down approach (external audits) is particularly effective in reducing manipulations with public funds, while the bottom-up approach (grass-roots monitoring) is essential in areas where individuals are involved directly, such as education and health (cf. Bertrand et al 2006). Gingerich, Oliveros, Corbacho, and Ruiz-Vega (2015) adopt an approach very much related to our one to evaluate the effect of an information campaign on the willingness to bribe in Costa Rica. They integrated an information experiment into a household survey (from late 2013 to early 2014), in which (among others) a flyer was randomized among respondents that graphically displayed an increase in the percentage of Costa Ricans who had personally witnessed an act of corruption from 2006 (16 percent) to 2011 (24 percent).1
Exposure to the flyer significantly increases the willingness to bribe, pointing to a promoting effect of corruption (i.e. ‘corruption corrupts’). This is in line with the fairness considerations mentioned before and with the findings in our study that point to the possibility that learning about the dissemination of corruption may augment its acceptance.
Comparably few experiments have been conducted on corruption in the educational sector. Armantier and Boly (2011), for example, conclude that larger bribes influence graders to
1
Information campaigns have also been conducted in other fields of research. For instance, Altmann, Falk, Jäger, and Zimmermann (2015) test the effects of brochures with information on job search strategies and the detrimental consequences of unemployment (among others) on the labor market outcomes of unemployed individuals in Germany.
‘overlook’ some mistakes and be more tolerant to bribe-givers in Quaqadougou (Burkina Faso). After continuing their research in Montreal (Canada), Armantier and Boly (2013) compare the results from three different settings, namely the field and the lab experiments in Quaqadougou and the lab experiment in Montreal. The results suggest that paying large bribes can be ambivalent: it might reduce the willingness to accept a bribe, but at the same time, it might promote reciprocation towards bribe-givers among those who accept bribes. Reinikka and Svensson (2004) investigate how the handling of a large-scale school-grant program in Uganda by local officials is affected by a large government-funded newspaper campaign, which is one of the rare other studies evaluating information campaigns on corruption in education. Their instrumental variable and difference-in-difference estimates suggest that the campaign successfully increased schools’ and parents’ ability to monitor local officials and substantially reduced capture and corruption of public funds between 1995 and 2001. When compared to the results in Gingerich, Oliveros, Corbacho, and Ruiz-Vega (2015), this suggests that campaigns can have very different effects depending on the kind, presentation, scale, and addressee of information.
To the best of our knowledge, the effectiveness of anti-corruption campaigns in universities has not yet been considered in the experimental literature. This particularly applies to countries like Ukraine, where corruption is endemic in all areas, including the education sector (see, for example, Kipen, 2002, Round and Rodgers, 2009, Osipian 2008a, 2008b, 2010, Kovalchuk and Koroliuk 2012, Klein, 2014a, 2014b, Denisova-Schmidt, Leontyeva, Prytula, 2014). Our paper aims to fill this gap, which appears interesting from a policy perspective, as policymakers and researchers may want to know whether such anti-corruption activities actually influence students’ behavior in a socially desirable way (in order to reduce corruption as witnessed in Reinikka and Svensson, 2004) or can even be counterproductive (see Gingerich, Oliveros, Corbacho, and Ruiz-Vega, 2015).
The remainder of this paper is organized as follows: Section 2 outlines the experimental research design and presents selected descriptive statistics on the collected data to verify the success of randomization. Section 3 presents the econometric methods (mean differences, OLS, and inverse probability tilting) by which the data are analyzed as well as the empirical results. Section 4 concludes.
2. Research design and data
To evaluate the effectiveness of anti-corruption information campaigns, a randomized trial was conducted among university students in the city of Lviv, a major city in western Ukraine with a population of more than 700,000 and home to 26 universities and higher educational institutions.
The research design was set up in the following way: Students were asked to participate in a survey about their reasons or ambitions for studying, their study fields and habits, their experiences with corruption and informal practices in school and in university and their family backgrounds and other socio-economic characteristics. The students were approached by the interviewers on their campuses and first asked about their university and year of study, as only individuals studying on-site with at least 3 to 5 prior semesters were interviewed (to make sure the acquired a certain level of experience in the higher education system). Then, face-to-face interviews were conducted in which the interviewer filled out the questionnaire to maximize the number of answered questions.
At a particular point in the interview, namely prior to any questions about university corruption, students were randomly provided with either a folder with information about the detrimental effects of corruption in the higher educational system (treatment group), or an information folder with (corruption-irrelevant) information on the social and demographical situation in Lviv (control group). The anti-corruption folder contained textual and visual information based on the materials of Transparency International, a leading NGO headquartered in Berlin with several national chapters (including one in Ukraine), which provides data and analysis on corruption worldwide. The folder provided a broad definition of corruption and specifically explained the types of corruption relevant to higher education that may or may not involve students. Furthermore, it also indicated the possible negative consequences of corruption that involves students and ended with a call not to participate in corruption and to encourage others to prevent corruption, see Appendix A for further details. In contrast, the folder of the control group contained general information about the demographics of Lviv, demographic projections, a social portrait of a citizen of Lviv and information about higher education possibilities in Lviv, see Appendix B.2
Randomization was based on a simple timing rule. If the last digit of the interviewer’s electronic watch indicated an even minute as the student reached the part of the survey where the intervention took place, the anti-corruption folder was provided; if it indicated an odd minute, the general city information folder was given to the student. The latter was then asked to look carefully through the material, and the interview only continued after the respondent finished studying the folder. Among the survey questions prevailing after the intervention are moral judgments about corruption in general, informal practices among students, and whether the student would be willing to participate in an anti-corruption campaign at the university (by distributing
2 While we only used printed materials in our experiment, digital media play an important role these days and may have different impacts from the ones presented in this paper. Future research extending the present study might therefore also consider computer-based materials, short videos, presentations, and postings in social media accounts.
flyers), all of which serve as outcome variables (see Section 3).
The representative study was conducted in March and April 2015 by the Fama sociological agency on behalf of a joint team of researchers from the Universities of St. Gallen and Fribourg (Switzerland) and the Ivan Franko National University of Lviv (Ukraine). The student sample was drawn from four selected public universities in Lviv and included 600 respondents studying in four main areas: social sciences (n=208, 34.7%), natural sciences (n=62, 10.3%), technical sciences (n=253, 42.2%) and the humanities (n=76, 12.7%), representing a majority of all students. Students in other disciplines, such as medicine, arts, or theology, were excluded due to their small share and the specificity of their courses. The participating students were of similar age (19-20 years) and males were slightly overrepresented (347 vs. 253 females). 315 (52.5%) of the 600 interviewees were randomized into treatment and 285 (47.5%) into control. The difference from a 50% assignment into treatment and control, respectively, is not statistically significant on any conventional level when using the t-test. The study was conducted in Ukrainian, the native language of all individuals involved. Therefore, no language-based misunderstandings are to be expected. Due to the sensitive nature of the topic, anonymity was guaranteed to all respondents. Several respondents nevertheless had some doubts and questioned this anonymity. Therefore, a few of them refused to provide the interviewers with their dates of birth (15 cases or 2.5% of the sample). In general, however, item nonresponse was very low. For instance, only 8 students (1.3%) did not provide their parents’ education, while 7 (1.2%) did not report their parents’ labor market state. The number of non-responses regarding most other socio-economic variables was even smaller.
Table 1: Mean covariate values by treatment status
Variable T = 0 T = 1 Diff p-value
gender: male (binary) 0.554
(0.030) 0.578 (0.029) 0.024 (0.042) 0.577 birth year 1995.079 (0.051) 1995.097 (0.052) 0.018 (0.073) 0.802
family consists of both parents (binary) 0.880
(0.020) 0.855 (0.021) -0.025 (0.029) 0.376
at least one parent working (binary) 0.959
(0.012) 0.962 (0.011) 0.003 (0.017) 0.850 both parents have at most intermediate education (binary) 0.371
(0.030) 0.298 (0.027) -0.073 (0.040) 0.068 number of siblings 1.004 (0.056) 1.083 (0.051) 0.079 (0.076) 0.295
self-assessed family wealth: satisfactory (binary) 0.341
(0.029) 0.332 (0.028) -0.009 (0.040) 0.830
self-assessed family wealth: good (binary) 0.517
(0.031) 0.522 (0.029) 0.006 (0.042) 0.894
self-assessed family wealth: very good (binary) 0.064
(0.015) 0.069 (0.015) 0.006 (0.021) 0.794
main reason for studying: good education (binary) 0.371
(0.030) 0.315 (0.027) -0.056 (0.040) 0.166
main reason for studying: to find good job (binary) 0.461
(0.031) 0.522 (0.029) 0.062 (0.042) 0.146
main reason for studying: to obtain a diploma (binary) 0.105
(0.019) 0.097 (0.017) -0.008 (0.026) 0.756
university id: 1 (binary) 0.367
(0.030) 0.329 (0.028) -0.038 (0.040) 0.344
university id: 2 (binary) 0.075
(0.016) 0.097 (0.017) 0.022 (0.024) 0.355
university id: 3 (binary) 0.056
(0.014) 0.087 (0.017) 0.030 (0.022) 0.164
study field: humanities (binary) 0.135
(0.021) 0.125 (0.019) -0.010 (0.029) 0.720
study field: social sciences (binary) 0.367
(0.030) 0.349 (0.028) -0.018 (0.041) 0.667
study field: engineering (binary) 0.412
(0.030) 0.419 (0.029) 0.007 (0.042) 0.873 Urbanity of residential area before entering university (1: city,…,7: village) 4.528
(0.119) 4.426 (0.117) -0.102 (0.167) 0.539
study program without tuition fees (binary) 0.757
(0.026) 0.668 (0.028) -0.089 (0.038) 0.021
study year (1or 2) 1.547
(0.031) 1.509 (0.029) -0.038 (0.042) 0.369
Note: The reference category for “self-assessed family wealth” is “basic”; the reference category for “university id” is “4”; the reference category for “study field” is “natural sciences”.
Table 1 reports the means of selected personal characteristics of the students across treatment status for the 556 individuals (93% of the sample) without missing information in any of the covariates reported. These include personal characteristics (gender, year of birth), family background (parents’ education and labor market state, indicators for family wealth, number of siblings), mean differences and p-values (of two sample t-tests). The statistical insignificance of most of these differences suggests that the randomization of the treatment was successful and that the minor item nonresponse issue did not compromise the randomization. Alone the mean difference in being inscribed in a “study program without tuition fees” is significant at the 5% level, while none of the remaining variables are significantly different across treatment states at the 10% level. As shown in Table 2, assignment is not statistically associated with a range of variables measuring previous experiences of informal practices, cheating, and corruption in school or university either (note that all of these variables were assessed prior to treatment randomization,
and that only the 575 observations without missing information in any of these variables are included).
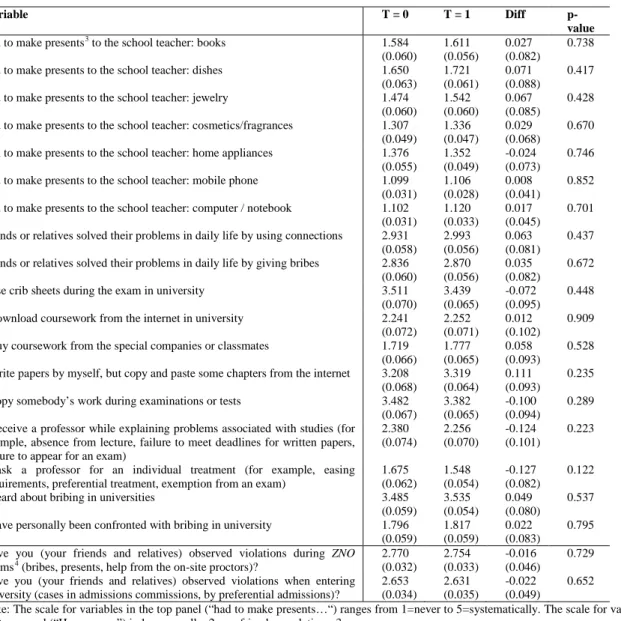
Table 2: Mean values of prior informal practices and corruption by treatment status
Variable T = 0 T = 1 Diff
p-value
had to make presents3 to the school teacher: books 1.584
(0.060) 1.611 (0.056) 0.027 (0.082) 0.738
had to make presents to the school teacher: dishes 1.650
(0.063) 1.721 (0.061) 0.071 (0.088) 0.417
had to make presents to the school teacher: jewelry 1.474
(0.060) 1.542 (0.060) 0.067 (0.085) 0.428 had to make presents to the school teacher: cosmetics/fragrances 1.307
(0.049) 1.336 (0.047) 0.029 (0.068) 0.670 had to make presents to the school teacher: home appliances 1.376
(0.055) 1.352 (0.049) -0.024 (0.073) 0.746 had to make presents to the school teacher: mobile phone 1.099
(0.031) 1.106 (0.028) 0.008 (0.041) 0.852 had to make presents to the school teacher: computer / notebook 1.102
(0.031) 1.120 (0.033) 0.017 (0.045) 0.701 friends or relatives solved their problems in daily life by using connections 2.931
(0.058) 2.993 (0.056) 0.063 (0.081) 0.437 friends or relatives solved their problems in daily life by giving bribes 2.836
(0.060) 2.870 (0.056) 0.035 (0.082) 0.672
I use crib sheets during the exam in university 3.511
(0.070) 3.439 (0.065) -0.072 (0.095) 0.448
I download coursework from the internet in university 2.241
(0.072) 2.252 (0.071) 0.012 (0.102) 0.909 I buy coursework from the special companies or classmates 1.719
(0.066) 1.777 (0.065) 0.058 (0.093) 0.528 I write papers by myself, but copy and paste some chapters from the internet 3.208
(0.068) 3.319 (0.064) 0.111 (0.093) 0.235
I copy somebody’s work during examinations or tests 3.482
(0.067) 3.382 (0.065) -0.100 (0.094) 0.289 I deceive a professor while explaining problems associated with studies (for
example, absence from lecture, failure to meet deadlines for written papers, failure to appear for an exam)
2.380 (0.074) 2.256 (0.070) -0.124 (0.101) 0.223
I ask a professor for an individual treatment (for example, easing requirements, preferential treatment, exemption from an exam)
1.675 (0.062) 1.548 (0.054) -0.127 (0.082) 0.122
I heard about bribing in universities 3.485
(0.059) 3.535 (0.054) 0.049 (0.080) 0.537 I have personally been confronted with bribing in university 1.796
(0.059) 1.817 (0.059) 0.022 (0.083) 0.795 Have you (your friends and relatives) observed violations during ZNO
exams4 (bribes, presents, help from the on-site proctors)?
2.770 (0.032) 2.754 (0.033) -0.016 (0.046) 0.729 Have you (your friends and relatives) observed violations when entering
university (cases in admissions commissions, by preferential admissions)?
2.653 (0.034) 2.631 (0.035) -0.022 (0.049) 0.652
Note: The scale for variables in the top panel (“had to make presents…“) ranges from 1=never to 5=systematically. The scale for variables in the bottom panel (“Have you…”) is 1=personally, 2=my friends or relatives, 3=no.
The values of the variables in Table 2 suggest that informal, dishonest, and corrupt behavior is quite common. Even for such variables as “I buy coursework from special companies or classmates” and “I have personally been confronted with bribing in the university”, which have comparably low means, it needs to be pointed out that in either treatment group, roughly 40% and
3 Presents are an important part of Ukrainian academic culture, but the tradition of present-giving might be misused. Polese (2010) explained the difference between a present and a bribe: ‘if [a professor/school teacher] receive[s] it, it is a gift, if [a professor/school teacher] demand[s] it, it is a bribe’.
4 The Ukrainian Zovnishnie Nezalezhne Otsinjuvannia (ZNO) (Engl.: External Independent Assessment) are tests that serve as both school finals and university entrance examinations.
almost half of the students, respectively, picked an answer that is different from “never”. In an open question following the item “I have personally been confronted with bribing in the university”, students were asked to describe how they experienced this/these situation(s). Some stated that they had bribed due to a lack of preparation for the exam or missing too many classes, while others said that they were pursuing a university degree as a mere credential, without any regard for how to obtain it (‘do not want to study, but need a degree’). Furthermore, good marks are important for receiving a state scholarship and this might be also a reason for bribing a lecturer (‘needed a few points to get a scholarship’). Finally, some students stated that they were forced to bribe by their lecturers (‘a lecturer demanded a bribe’) or told that if they do not, they might suffer (‘if you do not bribe, you will be expelled’).
Concerning the outcomes of interest, we evaluate the effect of the anti-corruption folders against the Lviv-based folders on the students’ willingness to participate in an anti-corruption campaign on campus by distributing flyers to other students (binary indicator). 5 If they agreed to the proposition (willingness=1), they were asked to leave either their phone number or e-mail address to make the intention credible, so that they might be contacted again. In addition, we also look at the folders’ impact on the students’ moral assessment of corruption in general. To this end, they were asked the question: “What, according to your understanding, does corruption mean?” and had to choose the most appropriate answer out of the following list: “Corruption is…” (a) “bad”, (b) “a crime”, (c) “a necessity”, (d) “a means to solve problems”, (e) “a means of income”, (f) “compensation for low salaries”, (g) “a part of life”, (h) “a temporary phenomenon “, (i) “a tradition”, or (j) “a national particularity”. Each option may be represented by a dummy variable, with all of the dummies adding up to one if any of (a) to (j) was picked (because only the answer that was most important to the student should be chosen). It therefore needs to be pointed out that by the way the question is asked, the treatment’s (short run) impact on the relative importance of the various options may be assessed, rather than the absolute (i.e. cardinal) change in importance. Nine observations (1.5%) did not pick any option, resulting in their dummies remaining at zero. See the next section for the means of the outcome variables among controls as well as their mean differences across the treated and control groups.6
5 Surveyors reported that when asking the question ‘Would you be interested in participating in anti-corruption campaigns as a volunteer?’, many respondents asked about a honorarium.
6 It is worth mentioning that our survey also contains information on the personal assessment of how frequently various cheating techniques are applied by university students in their courses and exams. Although this information was asked after the treatment assignment, none of these variables are significantly different across the treatment state. This is to be expected, as the treatment, which is received on the individual level just shortly before this question is asked, should arguably not affect the (perceived) cheating frequency of students in general. Significant effects would
3. Methods and results
We use three econometric methods to assess the effectiveness of the anti-corruption intervention. First, we simply take (and test for) mean differences in the various outcomes of the treatment and control groups. Under successful randomization, which implies that the treated and control groups are comparable in any observed or unobserved characteristics (that potentially affect the outcomes), this yields an unbiased estimate of the causal effect of our intervention. Even though the observed characteristics appear to be satisfactorily balanced in our sample (see Section 2), some minor differences remain nevertheless across the groups (in particular the dummy variable on tuition fees). We therefore also consider two methods that control for differences in the observed characteristics displayed in Table 1. The first approach consists of an OLS regression of the respective outcome on the treatment status and the covariates, which linearly controls for differences in the latter variables. However, a potential drawback of OLS are its parametric (i.e. linear) restrictions, which may be violated in reality, and the omission of interactions between the treatment and the covariates.
As an alternative, we thus also consider a semiparametric method that is based on the treatment propensity score, i.e. the conditional probability to receive (or not receive) the treatment given the observed covariates, see for instance Imbens and Wooldridge (2009) for a survey of such estimators that do not rely on a particular functional form of the outcome model. To be concise, we apply the so-called inverse probability tilting (IPT) method as proposed by Graham et al. (2012),7
which reweights observations by the inverse of the treatment propensity score before taking mean differences. In contrast to standard (inverse probability) weighting, in which the propensity score is typically estimated by logit or probit models, IPT uses a particular method of moments estimator for the propensity score. An attractive particularity of IPT over standard weighting is that it exactly balances the means (or even further moments) of the covariates of interest in such a way that the covariate means are identical in the treated and control groups. Furthermore, this estimator may be more efficient than other propensity score-based weighting approaches, see Graham et al. (2012).
therefore point to a change in the students’ response behavior concerning these delicate questions, but this change is absent in our analysis (results are available upon request).
Table 3: Effects in the total sample
total sample mean difference OLS
IPT
outcome Control
mean effect se p-value effect se p-value effect se p-value
would participate in campaign 0.09 0.00 0.02 0.93 0.01 0.02 0.63 0.01 0.02 0.61
corruption is …bad 0.10 -0.01 0.02 0.69 0.01 0.03 0.84 0.00 0.03 0.95
… a crime 0.42 0.04 0.04 0.38 0.03 0.04 0.48 0.04 0.04 0.39
… a necessity 0.02 0.00 0.01 0.87 0.00 0.01 0.81 0.00 0.01 0.71
… a means to solve problems 0.18 -0.01 0.03 0.65 -0.02 0.03 0.51 -0.02 0.03 0.51
… a means of income 0.10 -0.02 0.02 0.51 -0.03 0.02 0.31 -0.03 0.02 0.29
… a compensation for low salaries 0.05 -0.01 0.02 0.65 -0.01 0.02 0.58 -0.01 0.02 0.51
… a part of life 0.01 0.02 0.01 0.07 0.02 0.01 0.02 0.02 0.01 0.02
… a temporary phenomenon 0.04 -0.02 0.01 0.08 -0.03 0.01 0.01 -0.03 0.01 0.01
… a tradition 0.01 0.04 0.01 0.01 0.04 0.01 0.00 0.04 0.01 0.00
… a national particularity 0.05 -0.01 0.02 0.64 -0.01 0.02 0.55 -0.01 0.02 0.61
observations 285 600 556 556
Note: Standard errors (se) and p-values (p-value) are based on asymptotic approximations.
Table 3 provides the results for the total sample. The second column provides the various mean outcomes among controls, while the third column gives the mean differences between treated and controls – i.e. the experimental estimates of the effects. The fourth and fifth columns contain the (heteroscedasticity robust) standard errors and p-values. The OLS (IPT) estimates are provided in columns 6-8 (9-11). None of the methods suggests that the willingness to participate in anti-corruption activities (“would participate in a campaign”) is importantly affected by the intervention in the total sample. While 9% of the control observations declare a willingness to take part, the treatment hardly increases this figure and is far from being significant, no matter whether mean differences, OLS, or IPT are considered. However, some interesting patterns prevail concerning the moral assessment of corruption (reflected by the remaining outcome variables). First of all, we notice that the intervention does not statistically significantly affect the relative importance of the negative statements that corruption is something “bad” or “a crime”. While the latter is by far the most frequently selected answer among controls (42%), the treatment effects of 3-4 percentage points cannot be distinguished from zero. Likewise, for the statements that corruption “is a necessity”, “a means to solve problems”, “a means of income”, or “a compensation for low salaries”, no significant effects are found.
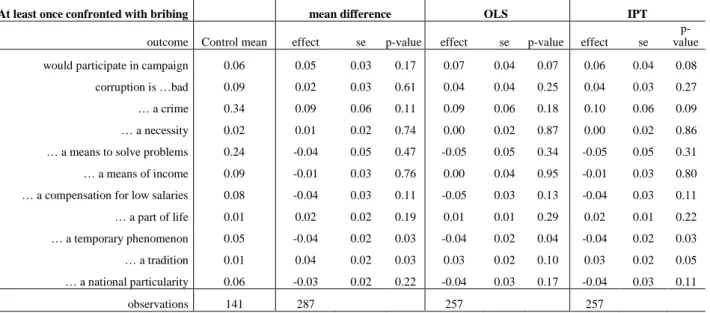
Table 4: Effects among students who were confronted with bribing in university
At least once confronted with bribing mean difference OLS IPT
outcome Control mean effect se p-value effect se p-value effect se
p-value
would participate in campaign 0.06 0.05 0.03 0.17 0.07 0.04 0.07 0.06 0.04 0.08
corruption is …bad 0.09 0.02 0.03 0.61 0.04 0.04 0.25 0.04 0.03 0.27
… a crime 0.34 0.09 0.06 0.11 0.09 0.06 0.18 0.10 0.06 0.09
… a necessity 0.02 0.01 0.02 0.74 0.00 0.02 0.87 0.00 0.02 0.86
… a means to solve problems 0.24 -0.04 0.05 0.47 -0.05 0.05 0.34 -0.05 0.05 0.31
… a means of income 0.09 -0.01 0.03 0.76 0.00 0.04 0.95 -0.01 0.03 0.80
… a compensation for low salaries 0.08 -0.04 0.03 0.11 -0.05 0.03 0.13 -0.04 0.03 0.11
… a part of life 0.01 0.02 0.02 0.19 0.01 0.01 0.29 0.02 0.01 0.22
… a temporary phenomenon 0.05 -0.04 0.02 0.03 -0.04 0.02 0.04 -0.04 0.02 0.03
… a tradition 0.01 0.04 0.02 0.03 0.03 0.02 0.10 0.03 0.02 0.05
… a national particularity 0.06 -0.03 0.02 0.22 -0.04 0.03 0.17 -0.04 0.03 0.11
observations 141 287 257 257
Note: Standard errors (se) and p-values (p-value) are based on asymptotic approximations.
In contrast, the folder appears to have affected the perception of the prevalence of corruption in society: The likelihood of choosing the statement “corruption is a part of life” is increased by 2 percentage points (independent of the method considered), which triples the average in the control group (1%). Furthermore, the answer “corruption is a tradition” rises by 4 percentage points (or quintuples from 1% in the control group), while “corruption is a temporary phenomenon” decreases by 2-3 percentage points. Not significantly affected is “corruption is a national particularity”. One could come to a quite disillusioning conclusion when looking at the total sample: While no significant effects were found on the willingness to be proactive against corruption or on the moral judgment that corruption is something negative, it only increased (at least in the short run) the view that it is an integral part of life. From a policymaker’s perspective, this may even be an undesirable effect, as it may induce individuals to engage in corrupt behavior themselves, given that they think others do it as well (see also the discussion of the results of Table 7 further below).
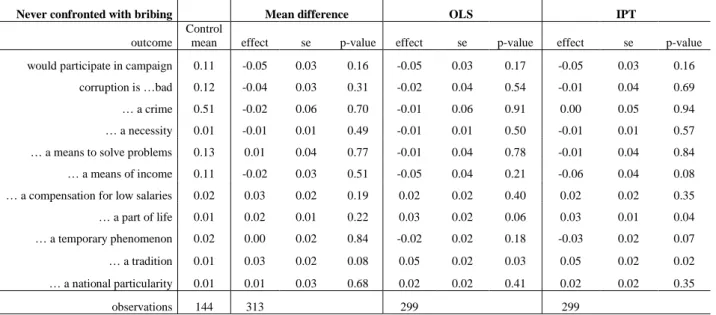
Table 5: Effects among students who were never confronted with bribing in university
Never confronted with bribing Mean difference OLS IPT
outcome
Control
mean effect se p-value effect se p-value effect se p-value
would participate in campaign 0.11 -0.05 0.03 0.16 -0.05 0.03 0.17 -0.05 0.03 0.16
corruption is …bad 0.12 -0.04 0.03 0.31 -0.02 0.04 0.54 -0.01 0.04 0.69
… a crime 0.51 -0.02 0.06 0.70 -0.01 0.06 0.91 0.00 0.05 0.94
… a necessity 0.01 -0.01 0.01 0.49 -0.01 0.01 0.50 -0.01 0.01 0.57
… a means to solve problems 0.13 0.01 0.04 0.77 -0.01 0.04 0.78 -0.01 0.04 0.84
… a means of income 0.11 -0.02 0.03 0.51 -0.05 0.04 0.21 -0.06 0.04 0.08
… a compensation for low salaries 0.02 0.03 0.02 0.19 0.02 0.02 0.40 0.02 0.02 0.35
… a part of life 0.01 0.02 0.01 0.22 0.03 0.02 0.06 0.03 0.01 0.04
… a temporary phenomenon 0.02 0.00 0.02 0.84 -0.02 0.02 0.18 -0.03 0.02 0.07
… a tradition 0.01 0.03 0.02 0.08 0.05 0.02 0.03 0.05 0.02 0.02
… a national particularity 0.01 0.01 0.03 0.68 0.02 0.02 0.41 0.02 0.02 0.35
observations 144 313 299 299
Note: Standard errors (se) and p-values (p-value) are based on asymptotic approximations.
However, the picture changes when investigating effect heterogeneity of our intervention across particular subgroups. In a first step, we only look at individuals who claim to have been confronted with bribing at least once in their university studies (one of the variables in Table 2); see the results in Table 4. For this sample, we find a lower willingness to participate in the campaign among controls (6%) than in the total sample, but a larger treatment effect that lies between 5 and 7 percentage points. Under OLS and IPT, the impact is even significant at the 10%. Furthermore, the control mean of “corruption is a crime” (34%) is also lower than in the total sample, but again effect estimates are larger (9-10 percentage points) and, in the case of IPT, significant at the 10% level. This may point to an effect of learning or shaming (at least in the very short run) evoked by the intervention, inducing this group (i) to catch up with the total population in terms of the likelihood of assessing corruption primarily as a crime and (ii) to actively do something about the problem. Similar to the total population, significantly negative and positive effects are found for the statements that “corruption is a temporary phenomenon” and “corruption is a tradition”, respectively. For the group of students not confronted with bribing (Table 5), on the other hand, the effects on the willingness to participate in the campaign are negative, but not significant at any conventional level. The effects on “corruption is a part of life”, “corruption is a tradition” and “corruption is a temporary phenomenon” are by and large in line with those in the total sample.
Table 6: Effects among students buying a course paper or other written work
Bought at least once a course
paper or other written work mean difference OLS IPT
outcome Contr
ol
mean effect se p-value effect se p-value effect se p-value
would participate in campaign 0.05 0.02 0.03 0.61 0.05 0.03 0.15 0.05 0.03 0.15
corruption is …bad 0.06 0.06 0.04 0.10 0.09 0.04 0.04 0.09 0.04 0.02
… a crime 0.34 0.11 0.06 0.07 0.10 0.07 0.13 0.11 0.06 0.06
… a necessity 0.03 0.00 0.02 0.86 0.00 0.02 0.96 -0.01 0.02 0.76
… a means to solve problems 0.28 -0.13 0.05 0.01 -0.16 0.06 0.01 -0.16 0.05 0.00
… a means of income 0.08 -0.01 0.03 0.75 0.00 0.04 0.92 0.00 0.03 0.96
… a compensation for low salaries 0.07 -0.03 0.03 0.41 -0.01 0.03 0.74 -0.02 0.03 0.56
… a part of life 0.01 0.03 0.02 0.12 0.04 0.02 0.05 0.04 0.02 0.03
… a temporary phenomenon 0.06 -0.05 0.03 0.07 -0.07 0.02 0.01 -0.06 0.02 0.00
… a tradition 0.01 0.02 0.02 0.22 0.02 0.02 0.25 0.02 0.02 0.21
… a national particularity 0.06 -0.02 0.03 0.58 -0.03 0.03 0.26 -0.02 0.03 0.37
observations 112 242 218 218
Note: Standard errors (se) and p-values (p-value) are based on asymptotic approximations.
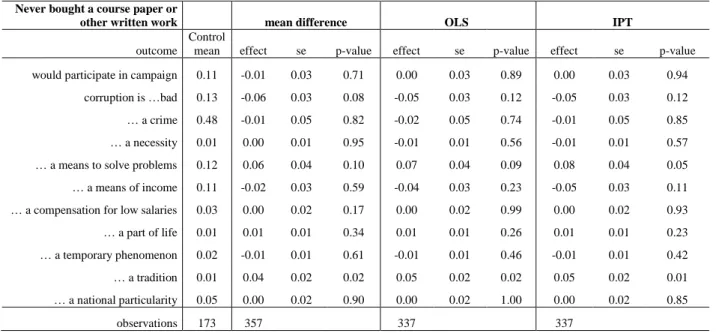
Table 6 contains the estimates for the subgroup of students who stated that they have at least once (i.e. more often than never) bought coursework from special agencies or classmates (one of the variables in Table 2), which is a form of noncompliance to academic standards. While the positive effects on the campaign dummy are not statistically significant, we find similarly strong effects on “corruption is a crime” as in Table 4, with IPT and mean differences being significant at the 10% level. Furthermore, the likelihood of stating that “corruption is bad” is increased, while that of “corruption is a means for solving problems” is considerably reduced (by 13 to 16 percentage points). This appears to be in line with the aforementioned effects of learning and shaming, entailing a reassessment of the moral judgment on corrupt behavior. The effects on “corruption is a part of life” and “corruption is a temporary phenomenon” are again in line with those in the total sample. Concerning those stating that they have never bought coursework from special agencies or classmates (Table 7), a striking finding is that the probability of stating that “corruption is bad” is reduced (borderline significant), while “corruption is a means for solving problems” is increased. It seems that those not engaging in unethical practices become more aware about the dissemination of corrupt behavior and consider it to be a supposed social norm, which may have socially undesirable effects on their own behavior. This is in line with the effects of the survey-based information experiment of Gingerich, Oliveros, Corbacho, and Ruiz-Vega (2015) on the willingness to bribe in Costa Rica.
Table 7: Effects among students who never bought a course paper or other written work
Never bought a course paper or
other written work mean difference OLS IPT
outcome Control
mean effect se p-value effect se p-value effect se p-value
would participate in campaign 0.11 -0.01 0.03 0.71 0.00 0.03 0.89 0.00 0.03 0.94
corruption is …bad 0.13 -0.06 0.03 0.08 -0.05 0.03 0.12 -0.05 0.03 0.12
… a crime 0.48 -0.01 0.05 0.82 -0.02 0.05 0.74 -0.01 0.05 0.85
… a necessity 0.01 0.00 0.01 0.95 -0.01 0.01 0.56 -0.01 0.01 0.57
… a means to solve problems 0.12 0.06 0.04 0.10 0.07 0.04 0.09 0.08 0.04 0.05
… a means of income 0.11 -0.02 0.03 0.59 -0.04 0.03 0.23 -0.05 0.03 0.11
… a compensation for low salaries 0.03 0.00 0.02 0.17 0.00 0.02 0.99 0.00 0.02 0.93
… a part of life 0.01 0.01 0.01 0.34 0.01 0.01 0.26 0.01 0.01 0.23
… a temporary phenomenon 0.02 -0.01 0.01 0.61 -0.01 0.01 0.46 -0.01 0.01 0.42
… a tradition 0.01 0.04 0.02 0.02 0.05 0.02 0.02 0.05 0.02 0.01
… a national particularity 0.05 0.00 0.02 0.90 0.00 0.02 1.00 0.00 0.02 0.85
observations 173 357 337 337
Note: Standard errors (se) and p-values (p-value) are based on asymptotic approximations.
The final heterogeneity analysis we performed was to consider females and males separately (Tables 8 and 9), motivated by empirical findings that gender matters with regard to many aspects of corruption (see for instance Swamy, Knack, Lee, Azfar, 2001, and Jetter and Walker, 2015). Although some control means differ across gender (“corruption is bad”, “corruption is a means for solving problems”) no striking differences were found in terms of the intervention effects. In neither sample is the impact on the campaign dummy significant. Furthermore, the results for “corruption is a part of life”, “corruption is a temporary phenomenon”, and “corruption is a tradition” are qualitatively in line with those in the total sample, but generally less significant.
Table 8: Effects among female students
females mean difference OLS IPT
outcome Control
mean effect se p-value effect se p-value effect se p-value
would participate in campaign 0.12 -0.02 0.04 0.69 0.02 0.04 0.58 0.02 0.04 0.54
corruption is …bad 0.13 -0.03 0.04 0.43 -0.03 0.04 0.53 -0.03 0.04 0.46
… a crime 0.46 0.01 0.06 0.92 -0.02 0.07 0.81 0.00 0.06 0.94
… a necessity 0.02 0.00 0.02 0.93 -0.01 0.02 0.74 -0.01 0.02 0.54
… a means to solve problems 0.12 0.02 0.04 0.61 0.03 0.05 0.57 0.02 0.05 0.63
… a means of income 0.10 0.02 0.04 0.68 0.00 0.04 0.94 0.00 0.04 0.96
… a compensation for low salaries 0.04 -0.03 0.02 0.22 -0.01 0.02 0.51 -0.02 0.02 0.38
… a part of life 0.01 0.01 0.01 0.60 0.01 0.02 0.40 0.02 0.01 0.29
… a temporary phenomenon 0.02 -0.01 0.01 0.53 -0.02 0.02 0.30 -0.02 0.01 0.30
… a tradition 0.02 0.06 0.03 0.02 0.08 0.03 0.01 0.07 0.03 0.01
… a national particularity 0.07 -0.03 0.03 0.33 -0.04 0.03 0.20 -0.03 0.03 0.19
observations 122 253 241 241
In conclusion, our estimates suggest that the intervention increases (at least in the short run) the perception of corruption as being part of society. However, in the total sample, this does not materialize in statistically significant changes in the willingness to participate in an anti-corruption campaign or to adopt a more negative moral judgment of corruption. In contrast, the intervention seems to induce the (non-negligible) subgroup of students with experience in dishonest or corrupt practices to potentially join the campaign or to worsen their view about corruption. For those without such experience, we find some indication that the intervention could, by learning about the dissemination of corrupt behavior, increase the acceptance of corruption. The heterogeneous effects therefore point to the possibility that, depending on their previous exposure to corruption and cheating, the same intervention may have a socially desirable impact on one group, while being at best ineffective for the other. This seems an interesting point of consideration for institutions and policymakers designing and running anti-corruption campaigns. As a word of caution, however, it needs to be borne in mind that our intervention is rather small in scale (which may affect the generalizability of our results to more comprehensive campaigns) and that only short-term effects are captured by the survey. Finally, reporting bias may be an issue in questions on such a sensitive topic like corruption (note, however, that reporting bias should be balanced for any questions asked prior to the random treatment assignment).
Table 9: Effects among male students
males mean difference OLS IPT
Outcome
control
mean effect se p-value effect se p-value effect se p-value
would participate in campaign 0.07 0.01 0.03 0.73 0.02 0.03 0.42 0.02 0.03 0.44
corruption is …bad 0.09 0.01 0.03 0.81 0.02 0.03 0.57 0.02 0.03 0.57
… a crime 0.46 0.06 0.05 0.28 0.06 0.05 0.27 0.07 0.05 0.21
… a necessity 0.01 0.00 0.01 0.90 0.00 0.01 0.96 0.00 0.01 0.95
… a means to solve problems 0.18 -0.04 0.04 0.33 -0.05 0.04 0.26 -0.05 0.04 0.22
… a means of income 0.06 -0.04 0.03 0.19 -0.03 0.03 0.34 -0.03 0.03 0.29
… a compensation for low salaries 0.06 0.00 0.03 0.86 0.00 0.03 0.90 0.00 0.03 0.94
… a part of life 0.03 0.03 0.01 0.07 0.03 0.01 0.03 0.03 0.01 0.02
… a temporary phenomenon 0.02 -0.03 0.02 0.09 -0.05 0.02 0.02 -0.05 0.02 0.02
… a tradition 0.03 0.02 0.01 0.12 0.02 0.01 0.19 0.02 0.01 0.20
… a national particularity 0.05 0.01 0.02 0.79 0.00 0.02 0.99 0.00 0.02 0.96
observations 184 347 315 315
Conclusion
In this paper, we experimentally assessed the impact of an anti-corruption intervention − an informational folder based on materials developed by Transparency International − on university students in the Ukrainian city of Lviv. Students who had previously been confronted with bribing were more willing to participate in an anti-corruption campaign, while no significant effect was found in the total sample. Furthermore, the intervention increased the overall perception that corruption was a (long-term) part of society rather than a temporary phenomenon, both in the total sample and in various subgroups. In addition, students with experience in corrupt practices adopted a more negative view of corruption, possibly due to shaming. For those without such experiences, however, the treatment might have augmented their acceptance of corruption by teaching them about its dissemination, which is in line with the findings of Gingerich, Oliveros, Corbacho and Ruiz-Vega (2015) concerning an information experiment in Costa Rica.
The ambivalence of the results suggests that anti-corruption materials may have a different impact (also in terms of social desirability) on students involved in university-level corruption compared to students without such experiences. In particular, the latter group might learn about the means and possibilities of corruption through anti-corruption materials, which could induce them to make use of them to a larger extent. In this context, it is important to point out that corruption might not only be initiated by the faculty, but also come from the students themselves, who frequently resort to bribes in the following situations: a) too many missed classes; b) the necessity to get a formal degree rather than an education; c) the opportunity to receive a state scholarship.
The heterogeneous impact of the intervention across various subgroups appears to be an important aspect of consideration for the design of anti-corruption activities. At the same time, it needs to be emphasized that the treatment investigated is rather small in scale and that only short-term effects are captured by the survey. This may affect the generalizability of our results to more comprehensive campaigns. Future research might therefore consider a larger set of interventions (print, audio-visual, and social media) to shed more light on (the optimal mix of) a broader range of anti-corruption activities.
In general, research on corruption in higher education is vital and should be intensified. One important reason is that students who cheat at university could be induced to do so later in their working life, for example, by presenting the ideas of their co-workers as their own (analogous to writing a university paper by copying and pasting text from the internet), by filling out and turning in false expense reports (using cheat sheets during exams at school), or by giving employers a false reason for missing work (giving a professor a false reason for missing a class or exam) (see the discussion in Grimes, 2004). Such a system likely produces a mismatch between qualifications
and (cognitive or social) competencies on the one hand, and decision power in the economy and politics on the other. The massification of higher education might also contribute to this phenomenon: about 80% of young Ukrainians enter universities and finish them on time (Bastedo, Batkhuyag, Prates and Prytula, 2009). Young people without a degree have almost no chances on the job market and no real alternatives: the system of vocational training is insufficient. This would imply that disproportionately many individuals who lack the skills or integrity to finish their university studies without cheating attain positions of high responsibility with potentially detrimental effects on the economy and society (including social cohesion and political stability).
For Ukraine as a whole, our fears appear even more pertinent, since our study was conducted in the western part of Ukraine, which was found to have a relatively low level of corruption in comparison to other regions in the country for instance in Denisova-Schmidt and Huber (2014) and Foster (2015).
References
Altbach, Philip G. 1966. “Students and Politics.” Comparative Education Review 10: 175–87. Altbach, Philip G. 1979. “Introduction: Student Activism in the Seventies.” Higher Education 8: 603–607.
Altbach, Philip G. 1981. Student Politics: Perspectives for the Eighties. Metuchen, NJ: Scarecrow Press.
Altbach, Philip G. 1989a. “Perspectives on Student Political Activism.” Comparative
Education 25: 97–110.
Altbach, Philip G. 1989b. “Perspectives on Student Political Activism.” In Student Political
Activism: An International Reference Handbook, edited by P. G. Altbach, 1–17. Westport, CT:
Greenwood.
Altbach, Philip G. 1989c. Student Political Activism: An International Reference Handbook. Westport, CT: Greenwood.
Altbach, Philip G. 1991. “Student Political Activism.” In International Higher Education: An
Encyclopedia, edited by P. G. Altbach, 247–60. New York: Garland.
Altbach, Philip G. 1992. “Student Movements and Associations.” In The Encyclopaedia of
Higher Education, edited by B. Clark and G. Neave, 1740–49. Oxford: Pergamon.
Altbach, Philip G. 2006. “Student Politics: Activism and Culture.” In International Handbook
of Higher Education, edited by J.J.F. Forest and P.G. Altbach, 329–45. Dordrecht: Springer.
Altbach, Philip G. and Manja Klemencic. 2014. “Student Activism Remains a Potent Force Worldwide.” International Higher Education 76: 2-3.
Altmann, Steffen, Armin Falk, Simon Jäger, and Florian Zimmermann. 2015. “Learning about Job Search: A Field Experiment with Job Seekers in Germany.” Centre for Economic Policy Research Discussion Paper No. 10621, London.
Armantier, Oliver and Amadou Boly. 2011. “A controlled field experiment on corruption.”
European Economic Review 55: 1072–82.
Armantier, Oliver and Amadou Boly. 2013. “Comparing Corruption in the Laboratory and in the Field in Burkina Faso and in Canada.” The Economic Journal 123: 1168–1187.
Åslund, Anders. 2014. “Why Ukraine is so poor, and what could be done to make it richer.”
Åslund, Anders. 2015. “How to Fight Corruption in Ukraine.” October 5, 2015 http://www.atlanticcouncil.org/blogs/new-atlanticist/how-to-fight-corruption-in-ukraine
Banuri, Sheheryar and Catherine C. Eckel. 2012. “Experiments in Culture and Corruption: A Review.” World Bank Policy Research Working Paper No. 6064.
Barr, Abigail and Danila Serra. 2010. “Corruption and culture: An experimental analysis.”
Journal of Public Economics 94: 862-869.
Bastedo, Michael, Batkhuyag, Batjargal, Eufrasion Prates, and Yaroslav Prytula Y. 2009. “Educational Policies for Integrating College Competencies and Workforce Needs: Cases from Brazil, Mongolia, Ukraine, and the United States.” Issue Brief, Institute for Higher Education Policy, Washington DC.
Bertrand, Marianne, Simeon, Djankov, Rema Hanna, and Sendhil Mullainathan. 2006. “Obtaining a driving license in India: an experimental approach to studying corruption.” Quarterly
Journal of Economics 122: 1639–1676.
Chapman, David W. 2002. Corruption and the Educational Sector. Washington, DC: Management Systems International.
Chapman, David W. and Samira Lindner. 2014. “Degrees of integrity: the threat of corruption in higher education.” Studies in Higher Education, DOI: 10.1080/03075079.2014.927854
Denisova-Schmidt, Elena, Elvira Leontyeva, and Yaroslav Prytula. 2014. Vozmozhnosti
sravnitel’nogo podkhoda v issledovaniiakh rossiiskoi i ukrainskoi sistem vysshego obrazovaniia: genezis, struktura, korrupciia. Khavarovsk: Vestnik TOGO, 3, 263-266.
Denisova-Schmidt, Elena and Martin Huber. 2014. Regional Differences in Perceived Corruption among Ukrainian Firms. Eurasian Geography and Economics, 55(1), 10-36.
Denisova-Schmidt, Elena and Elvira Leontyeva. 2014. The unified state exam in Russia: problems and perspectives. International Higher Education, 76, 22−23.
Economist, 2015, 26 September. Look west, Maidan. The revolution in Ukraine is being smothered by corruption and special interests. http://www.economist.com/news/leaders/21666610-revolution-ukraine-being-smothered-corruption-and-special-interests-look-west
Fisman, Raymond and Edward Miguel. 2007. “Corruption, norms, and legal enforcement: Evidence from diplomatic parking tickets.” Journal of Political Economy 115:1020-1048.
Foster, Hal. 2015. Lviv becomes a model for development in Ukraine, USA TODAY, October 7, 2015, http://www.usatoday.com/story/money/business/2015/10/06/lviv-becomes-model-development-ukraine/73335334/
Gingerich, Daniel W., Virginia Oliveros, Ana Corbacho, and Mauricio Ruiz-Vega. 2015. “Corruption as a Self-Fulfilling Prophecy: Evidence from a Survey Experiment in Costa Rica.” IDB Working Paper No. 546.
Graham, Bryan S., Cristine Campos de Xavier Pinto, and Danile Egel. 2012. “Inverse probability tilting for moment condition models with missing data,” Review of Economic Studies 79: 1053–1079.
Grimes, Paul W. 2004. “Dishonesty in Academics and Business: A Cross-Cultural Evaluation of Student Attitudes.” Journal of Business Ethics 49: 273–290.
Grødeland, Åse B. 2010. “Elite Perceptions of Anti-Corruption Efforts in Ukraine.” Global
Crime 11: 237–260.10.1080/17440571003669241
Hallack, Jacques and Muriel Poisson. 2007. “Corrupt Schools, Corrupt Universities: What Can Be Done?” Paris: International Institute for Educational Planning, UNESCO.
Heyneman, Stephen P. 2004. Education and Corruption. International Journal of Educational
Development, 24, 637-648.
Heyneman, Stephen P. 2013. “Higher Education Institutions: Why They Matter and Why Corruption Puts Them at Risk.” In Global Corruption Report: Education, Transparency
International, edited by Gareth Sweeney, Krina Despota, and Samira Lindner, 101–108. Abingdon:
Earthscan by Routledge.
Imbens, Guido W. 2010. “Better LATE Than Nothing: Some Comments on Deaton (2009) and Heckman and Urzua (2009)”. Journal of Economic Literature 48: 399–423.
Imbens, Guido W. and Jeffrey M. Wooldridge. 2009. “Recent Developments in the Econometrics of Program Evaluation,” Journal of Economic Literature 47: 5–86.
Jetter, Michael and Jay K. Walker, J. 2015. “Good Girl, Bad Boy: Corrupt Behavior in Professional Tennis.” IZA Discussion Paper No. 8824.
John, Leslie, K., George Loewenstein, and Scott Rick. 2014. “Cheating More for Less: Upward Social Comparisons Motivate the Poorly Compensated to Cheat.” Organizational Behavior
Kipen, Volodymyr. 2002. “Illegitimate Relationships in Ukraine's Institutions of Higher Education.” Polish Sociological Review, 138: 231-24.
Klein, Eduard. 2014a. Explaining the Success of Ukraine’s University Admission Reform in Combatting Corruption, in: Breskaya, Olga; Mikhailov, Anatoli (eds.): Social Sciences, Humanities
and higher Education in Eastern Europe after 1991, Newcastle: Cambridge Scholars Publishing, S.
149-165.
Klein, Eduard. 2014b. “Ukraine’s Testing Innovation.” International Higher Education 75: 24-25.
Klemencic, Manja. 2014. “Student power in a global perspective and contemporary trends in student organizing.” Studies in Higher Education 39: 396-411.
Kovalchuk, Serhiy and Svitlana Koroliuk. 2012. “The Introduction of Standardized External Testing in Ukraine: Challenges and Successes.” European Education, 44: 46-7.
Kubbe, Ina and Michael T. McBride. 2015. “An Experimental Study on Corrupt Actions.” CSD Working Paper.
Olken, Benjamin A. 2007. “Monitoring corruption: evidence from a field experiment in Indonesia.” Journal of Political Economy 115: 200–249.
Olken, Benjamin A. 2009. “Corruption perceptions vs. corruption reality.” Journal of Public
Economics 93: 950-964.
Osipian, Ararat L. 2008a. “Corruption and Coercion: University Autonomy versus State Control.” European Education 40: 27-48.
Osipian, Ararat L. 2008b. “Political Graft and Education Corruption in Ukraine: Compliance, Collusion, and Control.” Demokratizatsiya, 16: 323-344.
Osipian, Ararat L. 2010. “Corruption in the politicized university: lessons for Ukraine's 2010 presidential elections.” Innovation: The European Journal of Social Sciences: 101-114.
Polese, Abel. 2010. “If I receive it, it is a gift; if I demand it, then it is a bribe. On the local meaning of economic transactions in post-soviet Ukraine.” Anthropology in Action 15: 47-60.
Reinikka, Ritva and Jakob Svensson. 2004. “The power of information: evidence from a newspaper campaign to reduce capture.” Policy Research Working Paper 3239, World Bank.
Round, John and Peter Rodgers. 2009. “The Problems of Corruption in Post-Soviet Ukraine's Higher Education Sector.” International Journal of Sociology 39: 80-95.
Rumyantseva, Nataliya L. 2005. “Taxonomy of Corruption in Higher Education.” Peabody
Journal of Education 80: 81–92.
Shaw, Marta M. 2013. “Impacts of Globalization on the Academic Profession: Emerging Corruption Risks in Higher Education.” In Global Corruption Report: Education, Transparency
International, edited by Gareth Sweeney, Krina Despota, and Samira Lindner, 194–202. Abingdon:
Earthscan by Routledge.
Swamy, Anand, Stephen Knack, Young Lee, and Omar Azfar. 2001. “Gender and corruption.” Journal of Development Economics 64: 25-55.
Sweeney, Gareth, Krina Despota, and Samira Lindner. 2013. Global Corruption Report:
Appendix A: Folder 1 (treatment group)
Folder 1 was a color-printed booklet. It was made using materials developed by Transparency International8 and included the following information:
- the position of Ukraine in Corruption Perception Index: In its 2014 index of 175 countries, Transparency International ranked Ukrainian corruption in 142nd place;9
- the definition of corruption: the abuse of entrusted power for collective and private gain in monetary and non-monetary forms;10
- some forms of corruption: bribery, collusion, conflict of interest, fraud, and nepotism, see picture 1, plus some areas of corruption: politics, courts, business, the healthcare system, police, and education (Corruption in the UK: Overview and Policy Recommendations, 2011; Corruption: A Beginner’s Guide, 2012);
- examples of corruption in higher education without student involvement (manipulation of finances, university properties, accreditation) as well as examples of corruption in higher education with student involvement (copying off, plagiarism, cheating the faculty, bribes for grades and other preferential treatment) and their negative consequences (Global Corruption Report: Education, 2013).
The folder ends with the call for participation in anti-corruption campaigns organized in Lviv.
Picture 1: Some forms of corruption: bribery, collusion, conflict of interest, fraud, and nepotism. Source: Graphic by the authors based on Transparency International: “Corruption: A Beginner’s Guide,” December 201211
8
See the campaign ‘Unmask the corrupt’: http://www.transparency.org/unmask_the_corrupt/en/
(accessed on August 15th 2015)
9
http://www.transparency.org/cpi2014/results (accessed on August 15th 2015)
10
http://www.transparency.org.ru/dokumenty/missiia (accessed on August 15th 2015)
11
http://www.transparency.org.uk/our-work/publications/10-publications/454-corruption-a-beginners-guide-what-is-corruption. (accessed on August 15th 2015)
Appendix B: Folder 2 (control group)
Folder 2 was also a color-printed booklet. It was made using materials developed by the City Institute in Lviv and included the following information, which was not relevant to the discussion on corruption:
− the current demographic situation in Lviv and its forecast in the Ukrainian context and in comparison with other European countries;12
− the population of Lviv: social characteristics, hobbies and leisure activities;13
− higher education in Lviv, including the number of schools, students, degree and discipline distribution, see picture 2.
Picture 2: Higher education in Lviv. Source: City Institute, Lviv14
12
http://city-institute.org/ Socio/Demographic.jpg and http://city-institute.org/ Socio/Demographic_forecast.jpg (accessed on August 15th 2015)
13
http://city-institute.org/ Socio/Social_portrait.jpg and http://city-institute.org/ Socio/Free_time.jpg
(accessed on August 15th 2015)
14
Authors
Elena DENISOVA-SCHMIDT
University of St. Gallen (HSG), Gatterstr. 3, 9010 St. Gallen, Switzerland. Phone: +41 71 224 2581; Email: [email protected]; Website: elena-denisova-schmidt.de
Martin HUBER
University of Fribourg, Faculty of Economics and Social Sciences, Chair of Applied Econometrics - Evaluation of Public Policies, Bd. de Pérolles 90, 1700 Fribourg, Switzerland. Phone: +41 26 300 8274;
Email: [email protected]; Website: http://www.unifr.ch/appecon/en/team/martin-huber Yaroslav PRYTULA
Ivan Franko National University of Lviv, vul. Universytetska 1, 79000 Lviv, Ukraine. Phone: +38 0322 964187; Email: [email protected]; Website: http://lnu.academia.edu/YaroslavPrytula
Bd de Pérolles 90, CH-1700 Fribourg Université de Fribourg, Suisse, Faculté des sciences économiques et sociales
Working Papers SES collection Abstract
In this paper, we investigate experimentally the effect of an anti-corruption intervention -an info folder based on materials developed by Transparency International- on Ukrainian university students’ willingness to participate in an anti-corruption campaign and their general attitude toward corruption. In a survey of 600 students in the Ukrainian city of Lviv, individuals were randomly exposed to either the anti-corruption folder (treatment group) or a folder with information about Lviv (control group). The results suggest that students who have previous experience with bribing are more open to the campaign, while the effect on the total sample is not statistically significant. Furthermore, the intervention increases the overall perception that corruption is a (long-term) part of society rather than a temporary phenomenon. Finally, students with experience in corrupt practices tend to adopt a more negative view of corruption. For those without such experiences, however, we find some indication that the treatment could bolster the acceptance of corruption by instructing the students about its dissemination. The effects of this intervention are therefore ambivalent and appear to depend on the students’ previous exposure to corruption.
Citation proposal
Denisova-Schmidt Elena, Huber Martin, Prytula Yaroslav. 2015. «An Experimental Evaluation of an Anti-Corruption Intervention among Ukrainian University Students». Working Papers SES 462, Faculty of Economics and Social Sciences, University of Fribourg (Switzerland)
Jel Classification
D73, C93
Keywords
Anti-Corruption Campaigns, Corruption, Academic Integrity, University, Students, Ukraine, Experiment, Randomized Trial
Last published
455 Felfe C., Huber M.: Does preschool boost the development of minority children? The case of Roma children; 2015 456 Huber M., Lechner M., Strittmatter A.: Direct and indirect effects of training vouchers for the unemployed; 2015 457 Pesenti A.: The origin of inflation in a domestic bank-based payment system; 2015
458 Dumas C.: Shocks and child labor: the role of markets; 2015
459 Fricke H., Frölich M., Huber M., Lechner M.: Endogeneity and non-response bias in treatment evaluation - nonparametric identification of causal effects by instruments; 2015
460 Grossmann V., Osikominu A., Osterfeld M.: Are Sociocultural Factors Important for Studying a Science University Major?; 2015
461 Bücker J.J.L.E., Furrer O., Lin Yanyan.: Measuring Cultural Intelligence: A New Test of the CQ Scale; 2015
Catalogue and download links
http://www.unifr.ch/ses/wp
http://doc.rero.ch/collection/WORKING_PAPERS_SES
Publisher