F
F
i
i
l
l
i
i
è
è
r
r
e
e
T
T
e
e
c
c
h
h
n
n
o
o
l
l
o
o
g
g
i
i
e
e
s
s
d
d
u
u
v
v
i
i
v
v
a
a
n
n
t
t
O
O
r
r
i
i
e
e
n
n
t
t
a
a
t
t
i
i
o
o
n
n
C
C
h
h
i
i
m
m
i
i
e
e
a
a
n
n
a
a
l
l
y
y
t
t
i
i
q
q
u
u
e
e
D
D
i
i
p
p
l
l
ô
ô
m
m
e
e
2
2
0
0
1
1
4
4
S
S
i
i
b
b
y
y
l
l
l
l
e
e
P
P
f
f
a
a
m
m
m
m
a
a
t
t
t
t
e
e
r
r
D
D
é
é
v
v
e
e
l
l
o
o
p
p
p
p
e
e
m
m
e
e
n
n
t
t
d
d
e
e
l
l
a
a
m
m
o
o
b
b
i
i
l
l
i
i
t
t
é
é
i
i
o
o
n
n
i
i
q
q
u
u
e
e
p
p
o
o
u
u
r
r
l
l
a
a
d
d
é
é
te
t
e
c
c
ti
t
i
o
o
n
n
de
d
es
s
si
s
i
t
t
es
e
s
d
de
e
su
s
um
mo
o
y
y
la
l
at
t
i
i
on
o
n
d
de
e
s
s
pr
p
ro
o
t
t
éi
é
i
n
n
e
e
s
s
Professeur F r a n k a K a l m a n Expert P i e r r e T h i b a u l t , P h . D .Date de la remise du rapport
Objectif du projet
La SUMOylation est une modification post-traductionnelle des protéines. La détection par chromatographie liquide couplée à de la spectrométrie de masse est rendue difficile par leur faible abondance et par la faible présence de substrat.
Méthodes | Expérie nces | Résultats
L’utilisation de High-Field Assymetric Waveform Ion Mobility (FAIMS) résulte en une diminution significative du bruit de fond en LC-MS. Grâce au fractionnement effectué, il est possible d’identifier des peptides de faible abondance par LC-MS/MS. La performance de FAIMS a été testée en comparant des analyses de digestats trypsiques de lysat de cellules HEK293 avec et sans FAIMS par LC-MS/MS. 8260 peptides ont été identifiés (1165 protéines) avec FAIMS et seulement 4820 peptides (734 protéines) sans FAIMS. Quand un nombre représentatif de peptides synthétiques SUMO ont été ajoutés dans un digestat de HEK293, les analyses nano-LC MS ont montré une limite de détection 18 fois plus faible lorsque FAIMS y est couplé. Finalement, la sumoylation est une des premières réponses cellulaires au stress thermique. Donc pour augmenter la concentration de protéines sumoylées, nous avons effectué un choc thermique (43°C) sur des cellules HEK293 exprimant SUMO3 mutante. Un enrichissement de SUMOIylation dans la fraction nucléaire a été observé après 60 min par immunobuvardage. Une analyse LC-FAIMS-MS/MS a donné une augmentation de 2 fois du nombre de peptides SUMOylés identifiés après choc thermique.
Identification de sumoylation des protéines
Dip lômant/e
Sibylle Pfammatter
Trava il de d ip lôme
| é d i t i o n 2 0 1 4 |
Filière Technologie du vivant Domaine d’application Chimie analytique Professeur responsable Prof. Kàlmàn Franka Franka.Kalman@hevs.ch PartenaireProf. Thibault Pierre
pierre.thibault@umontreal.ca Institute for Research in Immunology and Cancer (IRIC)
Montreal Figure 2: La différence de mobilité
ionique des ions entre un faible et un haut champ électrique permet leur séparation avec FAIMS.
Figure 3: Réponse au choc
thermique à 43°C par
immunobuvardage contre les
anticorps SUMO 2/3.
Figure 1: Vue d`ensemble de la
proteomique. Après digestion, les peptides sont analyses par LC-MS/MS ou ils sont fragmentes pour en déduire leur séquence.
Identification of SUMOylation Sites using High-Field
Asymmetric Waveform Ion Mobility (FAIMS) coupled to a
Linear Ion Trap/Orbitrap Mass Spectrometer
provided by
Sibylle Pfammatter
from Eischoll (CH)
Institute for Research in Immunology and Cancer (IRIC)
scientific mentoring by
Pierre Thibault, Ph.D.
Principal Investigator, Proteomics and Bioanalytical Mass Spectrometry research unit, IRIC
Eric Bonneil, Ph.D.
Our greatest weakness lies in giving up. The most certain
way to succeed is always to try just one more time.
I conducted my Bachelor Thesis at the Institute of Research in Immunology and Cancer (IRIC) of the University Montreal. This institute has 29 different research teams with complementary disciplines dedicated to research in immunology and cancer. My principal Investigator was Prof. Dr. Thibault Pierre, who leads the Proteomics and Bioanalytical Mass Spectrometry platform. His unit focuses on the development and application of methods with approaches in bioanalytical chemistry, protein chemistry, biochemistry and cell biology.
ACKNOWLEDGMENTS
First, I thank my supervisor of the internship, Prof. Thibault Pierre for providing the research support during my stay at IRIC. I always received generous assistance and warm encouragement.
A special thanks goes to Dr. Bonneil Eric, my mentor for the project. Without his guidance my bachelor thesis would not have been possible. I am particularly grateful for all his patience in the last 6 months and I have greatly benefited from his comments and suggestions. I have learned a lot and improved my analytical skills, particularly with FAIMS, through his extensive knowledge and experience in mass spectrometry.
My sincere thanks also go to Frédéric Lamoliatte and Dr. Francis McManus for their help in the SUMO project, and I would also like to extend my thanks to our bioinformatician Olivier
Caron-Lizotte. I am most grateful for the assistance given by all of the other collaborators at
IRIC.
A special thanks also to Dr. Kàlmàn Franka and Dr. Piantini Umberto from the University of Applied Sciences Sion and of course to my family who gave me the opportunity to do this internship abroad.
And last but not the least I would like to offer my special thanks to my dearest colleagues
Christina, Christine and Irene for their nice welcome, their advice and all the great time and
S
UMMARYSUMOylation is a post-translational modification of proteins that is involved in different cellular processes including mitosis, DNA replication and transcription. However its detection by liquid chromatography coupled to mass spectrometry (LC-MS) can be challenging due to its low abundance and dynamic regulation. High Field Asymmetric Waveform Ion Mobility Spectrometry (FAIMS) helps in eliminating background ions which allows to improve the limit of detection. FAIMS separation is based on the differential mobility of ions between low to high electric field. In a preliminary experiment performed on a tryptic digest of HEK293 proteins, we identified 8260 peptides (1165 proteins) with FAIMS compared to 4820 peptides (734 proteins) without FAIMS. The limit of detection was 12 fmol with FAIMS for synthetic SUMO peptides spiked in a complex tryptic digest and 183 fmol without FAIMS. A LC-MS analysis with FAIMS of a mutant SUMO3 HEK293 cell line resulted in a 3-fold increase in the identification of SUMO peptides.
A
BBREVIATIONSBSA Bovine serum albumin CID Collision-induced dissociation CV Compensation Voltage DC Direct current
DTT Dithiothreitol
ECL Enhanced chemiluminescence EDT Electron-transfer dissociation ESI Electrospray ionization
FAIMS High-Field asymmetric waveform Ion mobility spectrometry FDR False discovery rate
HCD Higher-energy C-trap dissociation HEK293 Human embryonic kidney 293 HRP Horseradish peroxidase IE Inner electrode
LC Liquid chromatography LTQ Linear trap quadrupole
MALDI Matrix-assisted laser desorption/ionization MGF Mascot generic format
MS Mass spectrometry
MS/MS Tandem mass spectrometry Ni NTA Nickel nitrilotriacetic acid OE Outer electrode
PBS Phosphate buffered saline PTM Post-translational modification RF Radio frequency
rpm Revolutions per minute
SDS PAGE Sodium dodecyl sulfate polyacrylamide gel electrophoresis SENP Sentrin/small ubiquitin-like modifier-specific protease SIM SUMO-interacting motif
SPE Solid phase extraction SUMO Small ubiquitin-like modifier TBS Tris buffered saline
TCEP Tris(2-carboxyethyl)phosphine TIC Total ion chromatogram
1.
Introduction ... 1
1.1.
The objective of the work ... 2
1.2.
SUMOylation ... 3
1.2.1. Enzymatic cascade ... 3
1.2.2. SUMO Motif ... 4
1.2.1. SUMOylation in response to stress ... 5
1.3.
Mass Spectrometry ... 6
1.3.1. Identification of SUMO Targets by Mass Spectrometry ... 6
1.3.2. Proteomics ... 6
1.3.2.1. Nano LC-MS ... 7
1.3.2.1. SUMO Mutant... 9
1.3.2.2. Remove SUMO tags by MS/MS Edition ... 10
1.3.1. FAIMS ... 11
1.3.1.1. Separation ... 12
1.3.1.2. Faims for target identification of SUMOylated sites ... 13
2.
Materials and Methods ... 15
2.1.
Material ... 16
2.1.1. Equipment ... 16
2.1.2. Chemicals ... 16
2.1.3. Proteins and Peptides ... 16
2.1.4. Cell Culture and Western blot ... 17
2.2.
Methods ... 18
2.2.1. Cell Culture ... 18
2.2.1.1. Cell culture ... 18
2.2.1.2. Heat shock ... 18
2.2.1.3. Cell Collection ... 18
2.2.2. Protein extraction and purification ... 19
2.2.2.1. Fractionation of Nuclear/Cytoplasmic fractions ... 20
2.2.2.2. Nucleus Lysis ... 20
2.2.2.1. Protein Assay ... 20
2.2.2.2. Ni-NTA Purification ... 21
2.2.3.1. SDS PAGE ... 22
2.2.3.2. Protein Transfer ... 23
2.2.3.3. Incubation with Antibody ... 23
2.2.3.4. Detection with enhanced chemiluminescence ... 24
2.2.4. In Solution Digestion ... 25
2.2.5. Desalting ... 25
2.3.
Mass Spectrometry Analysis ... 25
2.3.1. Sample Preparation ... 25 2.3.2. LC Separation System ... 25 2.3.2.1. 1D LC ... 25 2.3.2.2. 2D LC ... 26 2.3.2.3. Column ... 26 2.3.3. Mass Analyzer ... 27 2.3.3.1. FAIMS ... 27
2.3.3.2. System Test solution: Promix ... 28
2.4.
Software ... 29
2.5.
Data Processing ... 30
2.5.1. Clustering with ProteoProfile ... 30
2.6.
Comparison FAIMS vs NoFAIMS ... 31
2.7.
Linear Dynamic Range of Detection and Quantitation for SUMO 1 and SUMO 3
Peptides ... 32
3.
Results and Discussion ... 33
3.1.
Optimization of FAIMS Interface ... 34
3.1.1. Gas Flow ... 34
3.1.2. Temperature ... 35
3.1.3. Dispersions Voltage ... 37
3.1.4. Acetonitrile ... 37
3.2.
Comparison of LC-MS with and without FAIMS ... 38
3.3.
Enhancement of sensitivity with FAIMS ... 45
3.4.
Heat Shock HEK293-SUMO 3 ... 47
3.4.1. Western blot Analysis ... 47
4.
Conclusion ... 49
5.
Literature ... 51
6.
Annex ... 55
6.1.
UniProt Data’s SUMO proteins ... 56
6.2.
Limit of detection ... 56
6.3.
Heat Shock ... 59
6.4.
SUMO 1 and SUMO 3 Synthetics... 60
6.5.
CAPILLARY COLUMN PACKING ... 64
6.6.
PROMIX 08/07/2014 ... 66
1.1. T
HE OBJECTIVE OF THE WORKThe aim of this project is to identify small ubiquitin-like modifier (SUMO)-modifed substrates and their modification sites using ion mobility and mass spectrometry. SUMOylation is a dynamic process, found in all common species, and is essential for eukaryotic life. Till this day, the exact outcomes and dynamics of this modification are not completely understood. For a better understanding of this post-translational modification (PTM), we aimed to identify SUMO target sites using mass spectrometry. However, there are several aspects that make this investigation difficult. First, this modification is highly dynamic and reversible. Secondly, cell extracts are highly complex and SUMOylated proteins are found at low concentrations with variable stoichiometry of modification site (1). Third, the sequences of SUMOylated peptides are branched, which makes the MS/MS spectra complex and hard to interpret. To improve sensitivity, nano LC-ESI-FAIMS-MS can be used. High-Field Asymmetric Waveform Ion Mobility Spectrometry (FAIMS) reduces background noise and allows for selective measurement of peptide groups in function of their charge state (2). This work comprises the following three aims:
1. Determine the distribution of charge state as of function of the compensation voltage (CV, parameter FAIMS) for synthetic SUMO peptides and tryptic peptides from Human embryonic kidney 293 (HEK293) total cell lysate.
2. Determine the limit of detection of synthetic SUMO peptides with and without FAIMS.
3. Determine the dynamic change in SUMOylation during heat shock treatment for protein extracts isolated from a mutant HEK293 SUMO3 cell line.
1.2. SUMO
YLATIONSUMOylation regulated the activity, stability and the interaction of hundreds of proteins in different pathways. There are several cellular functions where the SUMO proteins are important. Some of these functions include: gene transcription, cell cycle and DNA repair (3). We can find SUMOylated proteins most frequently in the nucleus, where the SUMO enzymes are enriched (1). Additionally, free and conjugated SUMO is also present in the cytoplasm. All eukaryotes express at least one SUMO precursor protein. In humans we have 4 different SUMO isoforms, but only SUMO 1, SUMO 2 and SUMO 3 are ubiquitously expressed. SUMO 2 and SUMO 3 share 97% sequence identity and only differ by three amino acid residues. Antibodies cannot distinguish between these two isoforms. This work primarily focused on SUMO 3. An important feature of SUMO 1, 2 and 3 is that they all have the same glycine-glycine motif at the C-terminus.
Figure 1: The different sequences of the human protein SUMO 1, SUMO 2 and SUMO 3. SUMO 1 contains 101 amino acids; terminal cleavage with trypsin gives a peptide with 23 amino acids (ELGMEEEDVIEVYQEQTGGHSTV). SUMO 2 and SUMO 3 are distinguishable by their 3 different amino acids at the beginning of the peptide sequence; here marked in yellow. SUMO 2 and SUMO 3 consist of 95 and 103 amino acids, respectively. The last trypsin cleavage gives the peptides FDGQPINETDTPAQLEMEDEDTIDVFQQQTGGVY for SUMO 2 (34 amino acids long) and FDGQPINETDTPAQLEMEDEDTIDVFQQQTGGVPESSLAGHSF for SUMO 3 (43 amino acids). The di-glycine motif can be seen close to the end of the sequence in all three SUMO proteins.
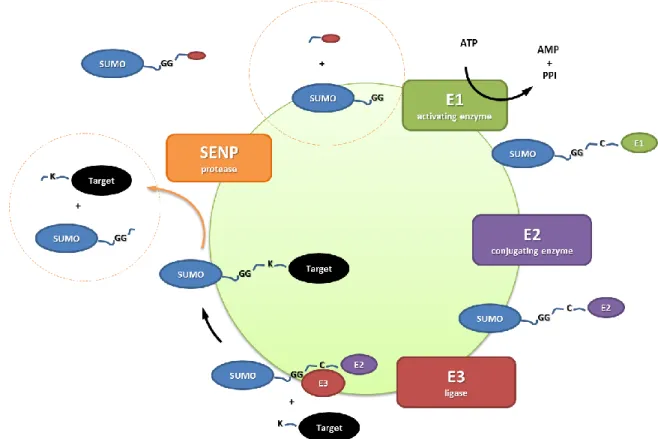
1.2.1. ENZYMATIC CASCADE
SUMOylation of proteins is a reversible process. First, SENP proteases (sentrin/small ubiquitin-like modifier-specific protease) deconjugate SUMO modifications from target proteins and cleave terminal C-teminus residues of free SUMO to expose its di-glycine motif. This cleavage is required for the activation of SUMO and for the conjugation of SUMO to lysine residues of the target protein. Free SUMO are first transferred to the E1 activating enzyme (SAE1/SAE2) via a thioester bond. It is then transferred to the enzyme E2 (UBC9) to form an isopeptide bond. Finally, E3 ligases can bind specific substrate to catalyze a nucleophile attack of the target lysine once interacting to UBC9. As previously mentioned, SENP proteases can activate the SUMO protein as well as catalyze the deSUMOylation of proteins (1). If they activate the SUMO precursor protein, they are called endopeptidase because they break the peptide
bond. If they remove the SUMO modification from the target, the SENP is referred to as an isopeptidase.
Figure 2 There are several enzymes involved in SUMOylation. First the SENP activates the SUMO precursor protein, then it is bound by the activating enzyme E1 and E2 and then conjugated to the target protein by a isopeptide link with the help of E3. The SUMO conjugation is a reversible process and the modification can be removed by a SENP protease.
1.2.2. SUMO
M
OTIFSUMO attaches covalently to target proteins via an isopeptide bond. This process takes place between the C-terminal glycine of the mature SUMO sequence and the ε-amino group of the lysine residue from target proteins. Although there are different kinds of target motifs, the most common consensus motif is ψKXE/D. Where ψ is a large hydrophobic amino acid, K is the lysine which forms the isopeptide link with the SUMO, X is any amino acid, and the last residue is either an aspartate or glutamate residue. This is a reversible process where isopeptidase SENP can cleave the isopeptide bond. Moreover, SUMO can also bind non-covalently via a SUMO-interacting motif (SIM) (4).
Figure 3: Isopeptide bond between the target and the SUMO peptide
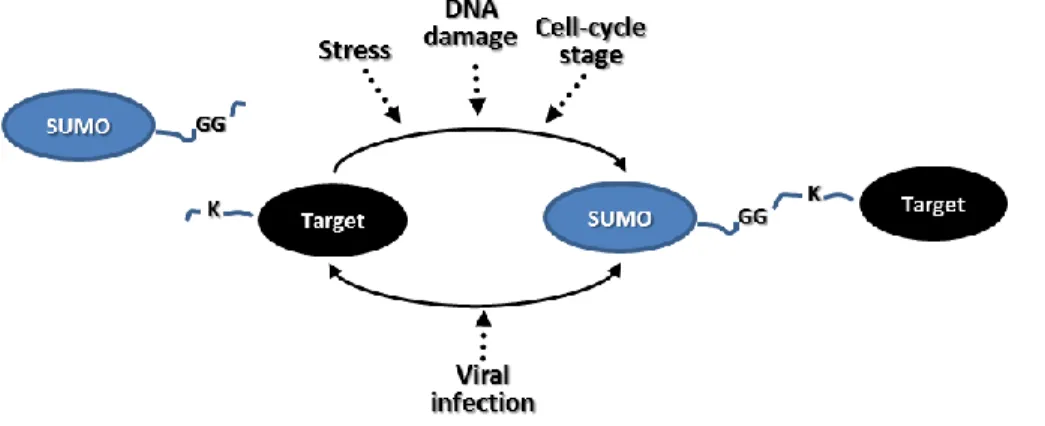
1.2.1. SUMOYLATION IN RESPONSE TO STRESS
Protein SUMOylation is regulated by different environmental changes including viral infection, proteasome inhibition, and heat shock (5) (6). An accumulation of SUMO 2/3 conjugates are detected under heat shock as well as treatments with ethanol, salt or oxidation. Similar results are observed when cells are treated with the protease inhibitor MG132.
1.3. M
ASSS
PECTROMETRY1.3.1. I
DENTIFICATION OFSUMO
T
ARGETS BYM
ASSS
PECTROMETRYSUMO target recognition is very difficult. The consensus motif ψKXE/D is very short and might be found frequently in mass spectrometry analysis. The occurrence of this motif does not necessarily imply that the corresponding lysine residue will be necessarily SUMOylated (7). To get a better understanding of the proteome, we can apply mass spectrometry based proteomics (8). With help of mass spectrometry we can identify modifications at a protein level.
1.3.2. PROTEOMICS
Proteomics allows us to have a better look at the different process that take place in cells. For instance, we can quantify proteins that are up or down regulated in diseases. In fact, proteomics is split in two phases: discovery and the targeted proteomics. In the discovery phase, we perform a global large-scale identification of peptides to determine which one are regulated. In targeted proteomics we are looking for specific peptides or modifications in proteins. To get the most comprehensive structural characterization of modified proteins, the Bottom-up method is used. The proteins are most often digested with the serine protease trypsin. Trypsin is mostly used because it cleaves specifically at the C terminus of lysine(K) and arginine(R), which both have basic residues found at the carboxyl terminus (9) (10). Another advantage is the relative high frequency of lysine and arginine in protein sequences. Also, the presence of lysine or arginine residues can be identified in tandem mass spectra by characteristic fragment ions at m/z 147.11 and 175.11.
Protein quantification using mass spectrometry provides a deeper insight into the dynamics of organisms. The following figure is a brief explanation of the workflow in proteomics: proteins are digested to peptides, then the corresponding samples are separated by liquid chromatography prior to their analysis on the mass spectrometer. Bioinformatics tools then allow us to sequence and identify peptides for the acquired tandem mass spectra.
Figure 5: Basic overview of proteomics. After tryptic digestion, we get peptides that are analyzed in a LC-MS system. With the help of the mass spectrometer we produce tandem mass spectra. These are fingerprints of each peptide. We can identify peptides with the help of bioinformatics tools. Then we try to reconstruct the peptides sequences and assign them to their respectful proteins.
1.3.2.1. NANO LC-MS
In proteomics nanoscale liquid chromatography coupled to tandem mass spectrometry is used and it has a very high sensitivity and specificity. After separation on the liquid based system, the sample is transferred into the mass spectrometer via an electrospray source. Electrospray ionisation (ESI) and matrix-assisted laser desorption/ionization (MALDI) are common methods used to ionized and volatize the peptides in complex samples (8). Usually peptide amounts present in digest at present at sub M concentrations, and, low flow rates and small column diameters are typically to increase sensitivity. This improves at the same time the ionization efficiency of electrospray by forming smaller droplets (11). The spray is generated in an electric field between the end of the chromatogram system and the entrance of the mass analyzer and gives rise to the formation of a Taylor cone. LC effluent emerging from the emitter is subjected to the applied electric field and is nebulized into small droplets that undergo subsequent fission events and solvent evaporation to form droplets of smaller sizes. Ions contained within these smaller droplets undergo increasing electrostatic repulsion and are eventually expelled and analyzed by the mass spectrometer.
For this work we employed the Orbitrap Elite from Thermo. The instrument is composed of a combination of a linear ion trap and orbitrap which provide great advantages: robustness and sensitivity by the ion trap and high resolution and accuracy by the orbitrap (8).
Figure 6: Ions enter the mass analyzer in the form of ion gas. In the first step they are trapped in the linear ion trap before they transferred to the orbitrap (12)
The gaseous peptides enter the mass analyzer and the ion beam is focused through a set of stainless steel apertures to which an RF voltage is applied called the S-Lens. This S-lens has improved transmission of ions by a factor of 5 to 10 compare to previous design which did not have the S-lens. In MS mode, ions are travelling through the dual pressure LTQ ion trap and are stored in the C-trap to prepare them for the injection in the Orbitrap. The orbitrap mass analyzer is composed of a spindle-like central electrode and a barrel-like outer electrode. A DC voltage is applied between the two axially symmetric electrodes, resulting in a quadro-logarithmic field. Ions are accelerated from the C-trap through an optical deflection system and are trapped radially around a central spindle electrode. The motion of the ions in the orbitrap involves axial oscillations along and rotation around the central electrode. The rotation frequency of the ions is dependent on the charge to mass ratio as described in Eq.1. This frequency is determined with the image current given by the ion movement around the central electrode. In MS/MS mode, two options are available. For both, precursor selection and isolation is performed in the LTQ ion trap. Then, the precursor can be either fragmented and analyzed in the LTQ ion trap (collision induced dissociation CID) or fragmented in the HCD collision cell. In this latter case, the ions are sent back to the C-trap and finally to the Orbitrap to be analyzed (higher-energy collisional dissociation HCD). CID is very fast but provides low mass accuracy on the fragments (± 0.5 ppm). HCD is slower than CID but provide a much better accuracy on the fragments (± 3 ppm).
Figure 7: Ions rotate around an axis with different frequency (12)
𝜔 = √𝑧 𝑚 ∙ 𝑘
Equation 1: Frequency of the ions in the orbitrap
1.3.2.1. SUMOMUTANT
To facilitate the identification of SUMO proteins by mass spectrometry, a HEK293 cell line with a SUMO 3 mutant was used (13). The mutant SUMO 3 resembles the wild-type except for a few modifications. There is a His6 tag on the N terminus which allows for selective enrichment
on a Ni-NTA column. There is also a strategic replacement of glutamine 87 with a lysine. Digestion by trypsin provides us with a 5 amino acid long peptide on the target lysine instead of 32 amino acids. A Q88N substitution was also introduced to distinguish SUMO 2 and SUMO 3 modifications by mass spectrometry.
Figure 8: Created SUMO 3 mutant in human cell HEK293 (13). On the N terminus there are six consecutive histidine residues and there is a lysine at position 87 instead of a glutamine.
Unfortunately bioinformatic applications are designed to analyze linear peptides and the interpretation of MS/MS spectra is compromised by the occurrence of branched peptides. Conventional search against a database with Mascot leads to low score identifications. The following are examples of MS/MS spectrums of a linear and a branched peptide.
.
Figure 9: MS/MS spectre for linear peptide AKPVDR (3)
Figure 10: Same peptide but this time SUMOylated (branched peptide). We get a complex MS/MS spectre and bioinformatic tools interpret them as false (3)
Previous experiments by Thibault’s lab members also showed that the score in HCD mode for SUMO is better than CID or ETD (3). This was achieved using a representative number of synthetic SUMOylated peptides (7-21 amino acids long) to test the three different fragmentation methods and tabulating the occurrence of specific SUMO fragments. They showed that there was a higher frequency with HCD than with the CID or ETD (3). Moreover, they created a novel bioinformatic tool called MS/MS edition to increase the identification score by Mascot for SUMO modified peptides.
1.3.2.2. REMOVE SUMO TAGS BY MS/MSEDITION
Low m/z High m/z
The following explanation refers to the SUMO 3 mutant tryptic peptide that comprise the pentapeptide NQTGG linked to the modified lysine residue via an isopeptide bond. In a typical case we see the fragments of the reporter ions at a low m/z value and the neutral losses at high m/z value. These fragments are characteristic of the branched part of the peptide and disturb the software. With an in house software MS/MS edition we can edit the MS/MS spectra and convert it into a ”linearized” version more easily interpreted by conventional search engines.
Figure 12: Specific SUMO 3 fragments. At low m/z value we expect to see the fragments of the reporter ions like the loss of N, NQ, NQT … At high m/z we see the neutral losses.
Figure 13: The typical fragments were removed to simplify the MS/MS spectre
Figure 14: The removed mass will be added to the peak to get the right mass
After linearization of the MS/MS spectre as described above, using the common sequencing and data base softwares is less confusing and the identification scores is much higher. With help of the SUMO 3 mutant and the mgf editing using MS/MS edition we are able to use proteomic mass spectrometry to successfully identification SUMOion sites in the proteome.
1.3.1. FAIMS
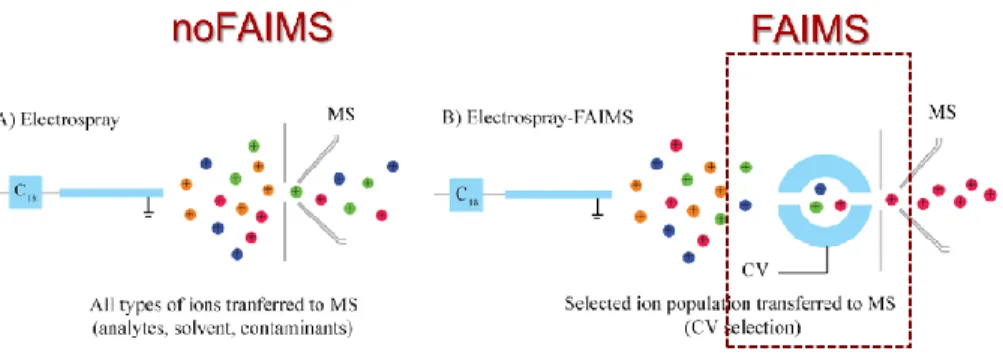
FAIMS adds an additional dimension of separation and can be applied as a novel approach for the identification of SUMOylated target sites. In proteomics the samples are complex and a one-dimension separation is usually not enough due to matrix complexity (14). We thus have to find a way to improve selectivity. In addition, high background noise and low abundance of some peptides makes it difficult to detect them. Characterization of the entire complement of proteins is never feasible with a normal separation system since instrument performances are limited. With FAIMS we can reduce background noise and select for transmitted ions based on their different mobility in high and low electric field (15). If we scan under various conditions, we can detect different kinds of ions and the fractionating step in the gas phase allows for the separation of singly charged peptides from multi charged peptides.
Figure 15: Overview of the basic differences between LC-MS and LC-FAIMS-MS. With LC-MS ions pass directly after ionization in the mass spectrometer. With FAIMS we transmit only ions with the desired mobility to the mass analyzer (16)
1.3.1.1. SEPARATION
The separation in FAIMS takes place between 2 electrodes, which produce an electric field, and an inert carrier gas that helps to mobilise the ions forward to the mass analyzer. The electric field is applied via an asymmetric waveform (V(t)) and during one cycle this waveform integral voltage-time product is equal to zero (Vhighthigh + Vlowtlow = 0). The maximal amplitude for
the applied cycle voltage is called the dispersion voltage.
The ions have different drift velocity and so not all of them need the same requirements to migrate to the electrodes. The traveled distance to the electrode can be calculated with equation 2. Where K is the ion mobility which is independent on the low electric field, this means the velocity in the low electric field is proportional to the field strength. This is not the case in high electric field. In high electric field the behavior of ions depends on the electric field thus we speak about Kh. If K and Kh are identical, the traveled distance is the same and the ion is
back to its initial position after one waveform cycle. If Kh > K the ions displace themselves in
direction to the mass spectrum.
𝑑 = 𝑣 ∙ 𝑡 = 𝐾 ∙ 𝐸 ∙ 𝑡
Equation 2: traveled distance of ions in an electric field
In addition to the dispersion voltage, a compensation voltage (CV) is applied on the lower electrode to prevent ions from drifting towards the electrode. In the case where ions touch the electrode they become neutral and do not pass through the electrodes to the mass analyzer.
The compensation voltage value is specific for each compound and allows us to regulate the separation mechanisms. In short, the separation is achieved because of the various types of ions travelling to different distances (17).
Figure 16: Scheme depicting ion separation in FAIMS. The behaviour of different ions in the electric field vary and allows for separation.
1.3.1.2. FAIMS FOR TARGET IDENTIFICATION OF SUMOYLATED SITES
Digestion by trypsin has different advantages. One of them is the positive charge of lysine/arginine after tryptic digestion. With the SUMO modification we have also a positive charge arising from the N-terminus amino group of the SUMO chain. The possibility of getting a multiply charged peptide is high and we can make use of this in ion mobility spectroscopy. FAIMS also provides the possibility to increase the signal to noise ratios by adding a new dimension without increasing the analysis time. Given that less than 1% of the peptides are SUMOylated eliminating background noise is a necessity. The following is an example of an MS spectrum without and with FAIMS to show the decrease in background noise.
Figure 17: The full MS spectrum for the SUMO 3 modified peptide NLLHDNELSDLKEDKPR (4+) m/z 624.31 at 400 fmol. Above is a spectrum with the normal nano-LC-MS system, below is with nano-LC-FAIMS-MS. The signal to noise ratio is increased 5-fold when using FAIMS.
noFAIMS
2.1. M
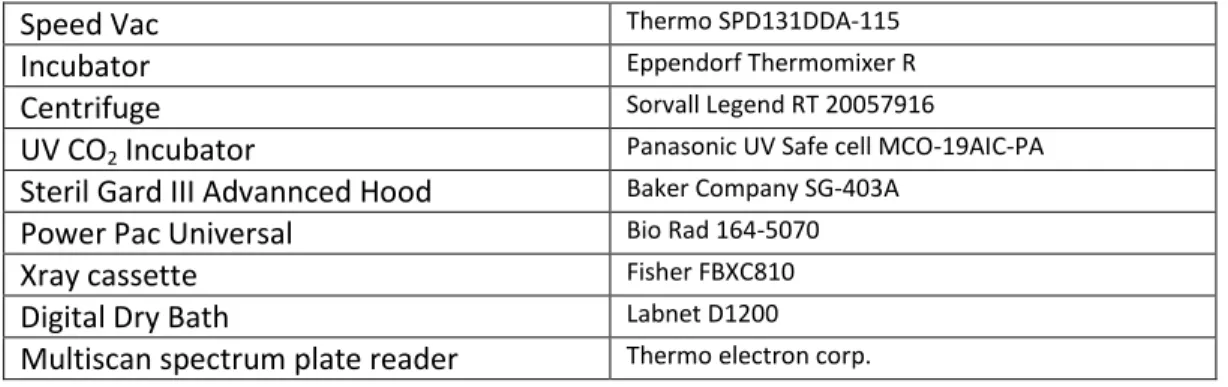
ATERIALIn the following tables all of the laboratory equipment and materials that were used.
2.1.1. EQUIPMENT
Table 1: Labor equipment which was used for the different manipulations in the laboratory
Speed Vac Thermo SPD131DDA-115
Incubator Eppendorf Thermomixer R
Centrifuge Sorvall Legend RT 20057916
UV CO2 Incubator Panasonic UV Safe cell MCO-19AIC-PA
Steril Gard III Advannced Hood Baker Company SG-403A
Power Pac Universal Bio Rad 164-5070
Xray cassette Fisher FBXC810
Digital Dry Bath Labnet D1200
Multiscan spectrum plate reader Thermo electron corp.
2.1.2. CHEMICALS
Table 2: Chemical list for the different manipulations in the laboratory
Formic acid (98%) EMD FX0440-7
Acetonitrile HPLC grade Fisher Scientific A998-4
Trypsin modified (sequencing grade) PROMEGA V511A
tris(2-carboxyethyl) phosphine (TCEP) Themro Scientific 77720
Ammonnium Bicarbonate (98-101%) Bio Basic VWR CA99501-001
2-Chloroacetamide SIGMA C0267
Methanol VWR CA-MX0475
Glycine VWR CA-EM4840
Tris base VWR CA-EM9230
Imidazole (99.0%) WVR CA99501-844
Sodiumphosphate monobasic monohydrate
Sigma S9638
Guanidine Hydrochloride Bio Shop GUA003.1
SDS Sigma L3771
2.1.3. PROTEINS AND PEPTIDES
Table 3: List of proteins and peptides used for different manipulations
Supplier Use
Alcohol Dehydrogenase from
Saccharomyces cerevisiae
Sigma A7011,
LOT# 041M7354V Promix solution
Bovine Serum Albumin BioShop ALB00150,
LOT# 3927998 Promix solution
Carbonic Anhydrase from bovine erythrocytes
Sigma C3934,
Cytochrome c from Saccharomyces
cerevisiae
Sigma C2436,
LOT# 037K7008V Promix solution
Enolase from Saccharomyces
cerevisiae
Sigma E6126,
LOT| 097K7690V Promix solution
Hemoglobin human Sigma H7379,
LOT# SLBC0633V Promix solution
Phosphorylase b from rabbit muscle Sigma P6635,
LOT# 110M7675V Promix solution
Transferrin human Sigma T3309,
LOT| 0L194488 Promix solution
Angiotensin human acetate salt hydrate
Sigma A9650 FAIMS spray position
SUMO synthetic (see annex 6.4) JPT Peptide Technologie GmbH
16034
PO#U629407_2004655
Linearity SUMO 1 ‘GGTQE’ N-terminus amine
51 peptides
C terminus lysine acid
45 peptides
C terminus arginine acid
SUMO 3 ‘GGTQN’ N-terminus amine
40 peptides
C terminus lysine acid
56 peptides
C terminus arginine acid
2.1.4. CELL CULTURE AND WESTERN BLOT
Table 4: Substance and equipment used for the cell culture of HEK293 cell line
Supplier Use
Dulbecco’s modified eagle medium
(DMEM)
Thermo Scientific
SH30081.02 cell culture
Fetal bovin serum (FBS) deactivated filtred
SERADIGM 1400-500 cell culture
Phosphate buffered saline (PBS) HyClone SH30258.01 cell culture Genectin Gibco 10131-027 cell culture
Antibody SUMO 2 Invitro LOT 394064A Western Blotting
Antibody α-Tubulin Cell Signaling # 2144S LOT
4 Western Blotting
Antibody Histone H3 Cell Signaling # 9715S LOT
20 Western Blotting
Anti Rabbit IgG (H+L) HRP Merck AP307P Western Blotting
Blotting paper VWR 28298-020 Western Blotting
Tween 20 Sigma P1379 P1379 Western Blotting
Nitrocellulose membrane Pall DR-058711112E Western Blotting
Full blue Xray films Cie univ de rayons X du
Canada, 1081728 Western Blotting
96 well plate VWR CA62406-343 Bradford
Criterion XT Precast Gel (4-12% Bis-Tris)
Bio Rad 345-0124 Gel electrophoresis
Protein Assay Dye Reagent Concentrate
Bio Rad 500-0006 Bradford
Amersham ECL Western Blotting Detection Reagents
GE Healthcare RPN2235
and RPN2106 Detection Blot Western
BLUeye Prestained Protein Ladder FroggBio PM007-0500
(10-245 kDa) Gel electrophoresis
2.2. METHODS
2.2.1. CELL CULTURE
2.2.1.1. CELL CULTURE
For culture of HEK293 WT and HEK293 SUMO3 cells, Dulbecco’s Modified Eagles Medium (high glucose) supplemented with 10% fetal bovine serum, 1% Penicillin/Streptomycin Solution and 1% L-Glutamine was used. The cells were grown at 37 °C in a 5% CO2 incubator. 750µg/ml
Geneticin was added to maintain the selection of HEK293 SUMO3 cells.
2.2.1.2. HEAT SHOCK
To study the effect of stress on protein SUMOylation, the cells were treated with a heat shock at 43°C. We added preheated medium (43°C) to the cells and incubated them at 43°C in a 5% CO2 incubator for different periods of time. For the large scale study, the cells were treated
with a 60 minute heat shock.
2.2.1.3. CELL COLLECTION
The medium is removed and the cells washed with PBS. The cells are subsequently collected in fresh PBS. The cells are then centrifuged for 10 minutes at 1000 rpm. The PBS (supernatant) is removed to isolate the cell pellet. The pellet is washed again with PBS and centrifuged for 10 minutes at 1000 rpm. The PBS is removed and the cell pellet is stored at -20°C for least for 12 h.
2.2.2. P
ROTEIN EXTRACTION AND PURIFICATIONFigure 18 shows the workflow for the treatment of the mutant HEK293 SUMO3 cell line. After inducing stress by heat shock, a nucleus – cytoplasm fractionation is done. Afterwards the purification on Ni NTA beads of the 6 x His-tagged proteins is done. For the mass spectrometry analysis the proteins are digested by trypsin.
Figure 18: Brief overview of the workflow for the heat shock treatment (3). In the first step, the nucleus and cytoplasm are separated. After NiNTA purifications we digest with trypsin and measure on the LC-MS.
LSB
10 mM Tris pH 7.6 stock solution 1.5 mM magnesium chloride 20 mM 2-Chloroacetamide add fresh 100 X Protease Inhibitor 100 X Phosphatase InhibitorB
UFFERA
8 M Urea
stock solution 100 mM Sodiumphosphate monobasic monohydrate
10 mM Imidazole 10 mM Tris-HCl pH 8 20 mM 2-Chloroacetamide add fresh 10 mM β-Mercaptoethanol
B
UFFERB
8 M Urea stock solution 100 mM Sodiumphosphate monobasic monohydrate20 mM Imidazole 10 mM Tris-HCl pH 6.3
10 mM β-Mercaptoethanol add fresh
2.2.2.1. FRACTIONATION OF NUCLEAR/CYTOPLASMIC FRACTIONS
The cell pellet is dissolved carefully in LSB buffer, and if necessary, it is vortexed slightly. Incubate with the phosphatase and protease (for SENP) inhibitor for at least 30 minutes with shaking (4°C). After, centrifuge for 15 minutes at 215g. The supernatant is the cytoplasmic
fraction. Wash the nucleus pellet with LSB buffer and centrifuge again at 215g for 15 minutes.
Remove the wash LSB solution and add buffer A to the nuclear pellet. Till this point, all manipulations were performed on ice.
2.2.2.2. NUCLEUS LYSIS
After adding 8M Urea (buffer A), the proteins are denatured. Vortex vigorously the pellet solution and sonicate 2 times for 10 seconds to shear the DNA. Centrifuge 15 minutes at 16000 g and transfer the supernatant to a fresh tube and label as nuclear fraction.
2.2.2.1. PROTEIN ASSAY
A Bradfords assay is used to quantitate the protein content of the various fractionated samples. The calibration curve includes standard solutions with concentrations of 0, 5, 25, 50, 125, 250, 500, 750, 1000 µg/mL of bovine serum albumin. For measurements, we take 96 well microplates and scan the absorbance at 595 nm. According to the Lambert Beer's law.
𝐴 = 𝜀 ∙ 𝑙 ∙ 𝑐 = 𝜀 ∙ 𝑙 ∙ 𝑛 𝑉 = 𝜀 ∙ 𝑙 ∙ 𝑛 𝑠 ∙ 𝑙 = 𝜀 ∙ 𝑛 𝑠
Equation 3: Lambert Beer law. Sample volume is negligible.
where
A = absorbance [ - ]
ε = molar extinction coefficient [ M−1 cm−1 ] l = pathlength; height well [ cm ]
c = molar concentration [ M−1 ] n = amount of substance [ mmol ] V = volume well [ cm3 ]
s = surface well [ cm2 ]
Consequently, the volume of the sample has no influence when the incident beam is perpendicular to the plane of the 96-well plate. By default, 190 µl Bradford reagent and 5-10 µl sample solution is taken for the direct preparation in each well of the micro plate.
2.2.2.2. NI-NTAPURIFICATION
For the Ni-NTA purification we add 1 mL of Ni-NTA beads to 50 mg of proteins. In practical terms, that means we have to take 2 mL of Ni-NTA Agarose beads since the Ni-NTA solution comes as 50% beads and 50% ethanol mixture. The final calculated volume of Ni-NTA beads is centrifuged for 1 min at 215 g. The supernatant is removed. Wash the beads 4 times with buffer A. The sample is added to the equilibrated beads and incubated overnight at room temperature. Centrifuge for 1 min at 215 g and remove the flowthrough (keep it for western blot analysis). Wash beads 1 time with buffer A, 4 times with buffer B and 2 times with 50 mM ammonium bicarbonate. To remove the proteins from the beads for Western Blot, use 200 mM of Imidazole buffer (with 20 mM Tris adjust at pH 7.0) and incubate for 10-20 min at room temperature.
2.2.3. WESTERN BLOTTING
Figure 19: Western blot Workflow. We first run a SDS PAGE, transfer the proteins on a nitrocellulose
Gel
TBS
0.1%
T
WEEN(TBST)
2.42 g Tris-HCl 8 g NaCl 1 ml Tween 20 1000 ml Water adjust pH to 8 with HClT
RANSFER BUFFER SOLUTION2.9 g Tris-HCl 14.5 g Glycine 200 ml Methanol 800 ml Water
LAEMMLI BUFFER 3X:
2.4 ml 1M Tris-HCl pH6.8 3 ml 20% SDS 3 ml Glycerol 100% 1.6 ml β-mercapthoethanol 6 mg Bromophenol blue Add to 10 ml with water2.2.3.1. SDSPAGE
Take 10 µg of protein for each sample and reconstitute in 1X Laemmli buffer. Heat the samples for 10 minutes at 95°C on a heat block. Before loading the gel, vortex the sample. Load the samples into each well and deposit 5 µl for the protein molecular weight marker. Run the gel in the appropriate apparatus for approximately 50 minutes at 150V or until the tracking dye reaches 1 cm from the bottom of the gel.
REMARK: As previously mentioned, if you load Ni NTA samples, use 200mM Imidazole
buffer (20mM Tris, adjust at pH 7.0) instead of Laemmli buffer. This is to elute the proteins from the beads.
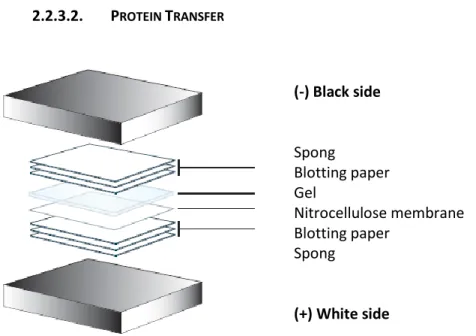
2.2.3.2. PROTEIN TRANSFER
Figure 20: Schema of the order to prepare the wet transfer of the proteins from the gel to the membrane (18)
Remove the gel from the electrophoresis unit. Cut the gel, membrane and blotting papers to the desired size and equilibrate all of them in the transfer buffer solution. Then, pack the transfer casette without any airbubbles in the order that is showed in figure 20 .Transfer proteins for 90 minutes at 600 mA. Incubate the membrane for 10-15 min in Ponceau S reagent to verify the integrity of the transfer. The Ponceau stain is removed from the membrane with several water washes.
2.2.3.3. INCUBATION WITH ANTIBODY
The membrane is blocked with a 5% milk in TBST prior to probing with the primary antibody. The membrane is then cut in different parts for the loading control. For the nucleus we cut bellow around 24 kDa and incubate it with the anti-Histone H3 antibody. We expect to detect a band of approximately 17 kDa. The recommended dilution of the antibody for western blotting is 1:2000 in 1% milk TBST (19). This antibody is an isotype of rabbit IgG. For the cytoplasm blot we cut above around 70 kDa is incubated with an antibody blotting against α-tubulin, which is also an isotype of rabbit IgG. The band should be visible at 50 kDa and the recommended dilution ratio is 1:1000 (20). For the incubation with antibody against SUMO 2 we take the whole membrane for blotting. Like the other two antibodies, it is an isotype of rabbit IgG. Blots are incubated overnight at 4°C or for 2 hours at room temperature.
(-) Black side Spong Blotting paper Gel Nitrocellulose membrane Blotting paper Spong (+) White side
In the next step, the primary antibody solutions are removed and the blots washed 2 times quickly and two times for 20 min with TBST. The membrane can now be incubated under gentle agitation for 1 hour at room temperature with the secondary antibody. The secondary antibody is an anti-rabbit IgG, HRP-linked antibody. After incubation, the blots are washed as previously explained. The wash steps are important to keep the back ground noise as low as possible.
2.2.3.4. DETECTION WITH ENHANCED CHEMILUMINESCENCE
Figure 21: The principle of detection in Western blotting (18). Primary antibody binds to the target protein. Followed with a secondary antibody containing HRP (enzyme horseradish peroxidase). The enzyme linked antibody with HRP reacts with the ECL reagent and resulting emission detected.
Moist the membrane with sufficient ECL developing solution. For the histone blot, use the normal sensitive reagent, and for α-tubulin and SUMO blots, use the highly sensitive solution or a mixture of both. Put the membrane in a vinyl protector which is taped into an X-ray cassette. Expose the film for different lengths of time to develop the film.
2.2.4. I
NS
OLUTIOND
IGESTIONDissolve the protein sample in 50 mM NH4HCO3 to a known concentration (the following
amounts correlate for 1 mg of proteins.) Add 10 µl of TCEP to the sample to reduce the disulfide bonds. Incubate for 30 minutes at 37°C. Then, add 100 µl of 5 mg/ml chloroacetamide to alkylate the free sulfhydryl groups from the cysteine residues. Incubate for 30 minutes at 37°C. The unracted chloroacetamide is quenched with 10 uL of DTT at 500 mM. The digestion of the reduced and alkylated protein is done by adding 20 µg of trypsin (1:50 ratio to protein). Incubate for 4 h or overnight at 37°C.
2.2.5. DESALTING
Formic acid is added to a 1%final concentration. Condition the HLB extraction cartridge 2 times with 50 v/v% methanol (0.1% FA) and 3 times with Millipore water. Load the sample, wash with Millipore water and elute with 50 v/v% methanol (0.1% FA). The sample is then lyophilized to dryness.
2.3. MASS SPECTROMETRY ANALYSIS
First, the samples were analyzed after trypsin digestion on the LTQ-Orbitrap Elite mass analyzer coupled to an Eksigent nanoLC sytem and a nano ESI source.
2.3.1. SAMPLE PREPARATION
In general, 1 µg of digested protein dissolved in 0.1% formic acid was injected per replicate/CV.
2.3.2. LC SEPARATION SYSTEM
Prior to separation on the analytical column, the sample is passed through a pre column with the same stationary phase as in the analytical column. The pre column serves to desalt the sample and to remove the coomassie staining. The prevalent length for the pre column is 50 mm and for the analytical column 15 cm.
2.3.2.1. 1DLC
The peptides are eluted from the pre and analytical columns with a gradient of 0-40% acetonitrile in 0.2% formic acid. The flow for the nano LC system rate is 600nL/min. The
Table 5: standard gradient for a 70 min run method
Time [min]
0.2% formic acid in water [%]
0.2% formic acid in acetonitrile [%] 0 95 5 56 60 40 57 40 60 58 40 60 59 95 5 70 95 5
Table 6: standard gradient for a 120 min run method
Time [min]
0.2% formic acid in water [%]
0.2% formic acid in acetonitrile [%] 0 95 5 106 60 40 107 40 60 108 40 60 109 95 5 120 95 5 2.3.2.2. 2DLC
The separation of digested proteins can be performed with two-dimensional chromatography. Digested proteins were loaded first on a SCX trap column and then eluted by a sequential ammonium acetate elution (0 – 250 – 500 – 750 – 1000 and 2000 mM) at pH 3.5. The cleaning step of salts in a C18 pre column and analytical column separation remain the same as for the 1D LC systems.
2.3.2.3. COLUMN
LC nano columns are packed in house under Nitrogen (see annex 6.5)
Capillary: ID 52 µm ex Polymicro Technologies (Part #106815017) ID 150 µm ex Polymicro Technologies (Part #1068150024)
REVERSED PHASE
Stationary Phase: Jupiter 3µ C18 300 Å ex phenomenex 04A-4263 Membrane : SPE Disk EMPORE 2215-C18 (Octadecyl) 47mm ex 3M
CATION EXCHANGE Cartridge
2.3.3. M
ASSA
NALYZERThermo ScientificTM Orbitrap Elite mass spectrometer. HCD activation mode with normalized collision energy 30% for SUMO peptides and 35% for common peptides in positive mode. 106 ions were accumulated in the Orbitrap before they were passed over to the linear ion
trap. The resolutions for the MS is 60000 at 400 m/z and 15000 for the MS/MS. A minimal signal of 10000 is required.
2.3.3.1. FAIMS
Thermo Scientific™ high-field asymmetric waveform ion mobility spectrometry (FAIMS) has an interface with a 1.5 mm gap and a curved wall ion inlet between the electrodes. Spray position is diagonal and nitrogen is used as the gas. The temperature in the inner electrode is 70°Cand 90°C for the outer electrode. A Vhigh –of 5000V and Vlow of +1000V were used as
dispersion voltages.
Figure 22: Diagonal ESI source for FAIMS
Before injecting with the FAIMS ESI source, we had to find the optimal position of the spray. Usually, we fix the right position with help of the cameras. But unfortunately, this is not possible with this kind of source. To overcome this we infused a solution of angiotensin (0.2 µg/µL in 50% MeOH in 0.2% formic acid) to manoeuvre them into the optimum diagonal position. We scanned through a CV range to determine the optimal CV range for Angiotensin (peptide observed at an m/z of 450.24 in a 2+ state). We found the optimum had a
2.3.3.2. SYSTEM TEST SOLUTION:PROMIX
To test and control the LC-ESI-MS system, we use a solution, called Promix. The Promix is a complex tryptic digested solution, composed of 8 proteins from different species (see protocol 6.6). The corresponding LC-MS analysis is used as a quality check test to ensure that operational system performance is achieved. This includes a defined value of the signal intensity, the control of specific precursor ions and their retention time as well as a comparison to the LC chromatograph of previous promix runs.
Figure 23: Above example for a LC chromatogram of the Promix solution (July 2014) of 8 tryptic digested proteins. The sample was injected on the Thermo Scientific Orbitrap Elite mass spectrometer. Above are the chromatograms of each digested peptide.
In proteomics, the amount of sample to analyse is usually low. To prevent losing sample due to instrument problems and to have optimal conditions during analysis, the promix is useful.
2.4. S
OFTWARERAW data’s were acquired with XCalibur. For database searches, clusterings and validations of the results, different software’s were used. The following table shows all of them.
Table 7: List of different bioinformatic software’s
In st ru m en t co n tr ol
Xcalibur Thermo (version 2.2,
2011.08.11) instrument control and data analysis
D a ta proce ss in g
ProteoProfile InHouse software IRIC
(version 3.2014.05.23) Extract peptides from RAW file (peptide card ,
sds.file)Clustering, remove SUMO tag, recalibrate
RAW files
PEAKSTM7 Bioinformatics
Solution Inc.(7) database search – PTM De novo sequencing –
Identification
MASCOT Daemon matrixscience Search algorithm for Mass
Spectral proteomics peaklists
Scaffold Proteome Software
2.5. D
ATAP
ROCESSINGWe convert .Raw Data files from XCalibur Software to Mascot generic format (MGF) by Mascot Distiller. The database UniprotHuman (37275 sequences) is used with a mass tolerance of ± 15 ppm and MS/MS tolerance ± 0.02 Da. The reason for this relative high tolerance value is due to the fact that we have no set mass to control the calibration. With help of the inHouse software MS/MS editions (part of the ProteoProfile package) we can edit the mgf files and remove the SUMO tags from the MS/MS to aid in SUMO peptide identification. For the identification of the SUMOylated peptides we take the mgf.edited files gereated from MS/MS edition and run the Mascot search again against the UniprotHuman database. For variable modifications we look for GlyGly (K), deamidated (NQ) and SUMO 3 (K). The maximal number of missed cleavages by trypsin was set to 3. In some case a Peaks search with the .Raw files is launched in parallel to the Mascot search. The parameters are the same. To validate the results of the heat shock we set the FDR at 2.0% and we take only the spectra with at least 3 fragments (done manually). For SUMO synthetic peptides we are using a database with the 96 SUMO 1 as well the 96 SUMO 3 peptides.
Figure 24: The general procedure to process the data for SUMO site identification.
A search against a database compares the experimental spectra with theoretical spectra. It they are equivalent the peptide is assigned, if the experimental spectre is more or less the same, it is unassigned. If the sequence is the opposite, it is a DECOY peptide. The false discovery rate (FDR) is the ratio between the decoy peptides and the assigned peptides.
2.5.1. CLUSTERING WITH PROTEOPROFILE
To compare between different fractions, conditions or replicates, the software ProteoProfile allow us to create peptides cards (plot retention time to m/z plus charge state) and clustering. For the peptide cards, a threshold is set. Threshold is the value of the signal where we can detect peptides and not background. For FAIMS, measures on the Elite Orbitrap the Threshold is in general set at 1000, for noFAIMS it is set at 5000. The reason for the lower threshold with FAIMS is due to the significantly reduced background.
aquiste RAW file (XCalibure) generate mgf file (Mascot) mgf edited (ProteoProfile) database search (Mascot)
2.6. C
OMPARISONFAIMS
VSN
OFAIMS
Basically, complex samples are challenging for mass spectrometry. Background noise makes life complicated and the discovery of a whole proteome impossible. To demonstrate the performance of FAIMS, we injected a tryptic solution of the total cell lysate from HEK293.
Figure 25: Workflow to demonstrate the performance of FAIMS compared to noFAIMS. The parameter of the mass analyzer were the same. For the validation of the data we used Peaks and for the data base search we used UniproHuman. After this we create the peptides cards as well the clustering with ProteoProfile. To get the overlap of the two conditions we used the Scaffold software.
To identify HEK293 peptides, we injected our solution on the Orbitrap Elite and instead of replicates, we scanned a range of 12 different CV voltages (-28V to -78V in two steps CV) with FAIMS. The common nano LC-MS analysis (noFAIMS) was done with 12 replicates. With this method, we used a TOP5 approach (5 MS/MS) for each CV step (FAIMS) or a TOP12 approach for the replicate (noFAIMS). The amount of protein injected was 1 ug per injections. To compare the two methods, we analyzed at the detected, identified and quantified peptides. Clustering without a database search gave us the peptides that were detected (peptide cards). If we add the identification files in the cluster step, we get the list of identified peptides. For the frequency of quantified peptides we set the limit for the signal to noise ratio at 3. For the false discovery rate (FDR) we took only the unique peptide sequences that were lower than 1.0%.
2.7. L
INEARD
YNAMICR
ANGE OFD
ETECTION ANDQ
UANTITATION FORSUMO
1
ANDSUMO
3
P
EPTIDESTo determine the limit of detection (LOD) of SUMO peptides, a number of representative SUMO 1 and SUMO 3 synthetic peptides (96 for each isotype) were used. With the synthetic SUMO peptides, we prepared a serial dilution to prepare solutions with final injection concentrations of 20 – 100 – 200 – 400 – 1000 – 2000 fmol. The pure peptides were used for the first injections, and for the second injection set they were spiked in 1 µg of HEK293 cell lysate. The measurements were acquired with FAIMS and noFAIMS. Each condition were conducted in triplicates. For the FAIMS we stepped over the CV range -34V to -85V by acquiring 3 CV per MS (-40V-37V-34V | -49V-46V-43V | -58V-55V-52V | -67V-64V-61V | -76V-73V-70V | -85V-82V-85V).
After clustering for the linearity curves, we looked at each spectrum manually to determine the signal to noise ratio. The procedure was as follows: The average of the intensity (Full MS) for the triplicate was calculated for the lowest concentration point in which the SUMO peptide was detected. The signal of the noise was taken before the signal of the precursor ion of the peptide.
Figure 26: Overview for the 4 different conditions to determine the LOD for SUMO 1 and SUMO 3 peptides with FAIMS and noFAIMS
High
3.1. O
PTIMIZATION OFFAIMS
I
NTERFACEWith FAIMS we have different parameters to optimize. There are no general rules that we can follow to get the best conditions. To optimize the instrument parameters for SUMO peptides, we tested different parameters like the gas flow, temperature of the electrodes and the dispersions voltage.
Figure 28: Shema for gas flow at the inlet of the outer and inner electrode
The figure on the left shows a sheme of the FAIMS interface. A gas flow passes through the outer and inner electrode. The electrode are individually adjusted to heat the electrodes. The temperature has to be stable because of the influence by the gas intensity (21). The dispersion voltages is the peak maximum for one waveform cycle and it is applied on the two electrodes. The compensation voltages is applied on the inner electrode to prevent the ions from drifting onto the electrodes.
3.1.1. GAS FLOW
Angiotensin infusion was used to determine the optimal gas flow. Moreover, the stability of the signal can fluctuate as well. If we change only the flow parameter we observe a higher Intensity for Angiotensin at 1.5 L/min but the signal is not stable. If the flow is at 2.5 L/min the intensity is lower but the signal more stable over time. The best conditions we obtained was with a 2.0 L/min gas flow. 2.0 L/min has proven to work well since the signal is stable and the intensity is high.
Above all, we are interested in the best parameters for SUMO peptides. To this effect, we infused a solution with 5 synthetic SUMO 3 peptides (200 fmol/µl). The temperature of the inner electrode was 70°C and the outer electrode 90°. As usual, the dispersion voltage was set at -5000V and the ionisation of the spray was set at 3.60 kV. The signal intensity for each individual ion was taken on the optimal CV. All of the SUMO 3 peptides can appear in different charge states.
Table 8: Follow list shows the m/z value of the 5 peptides as 2+ and 3+ precursor ions.
392.543+ 588.302+ 450.573+ 675.352+ 477.933+ 716.402+ 557.603+ 835.892+ 647.393+ 970.502+
The gas flow rates of 1.5 – 2.0 – 2.5 – 3.0 and 3.5 L/min were tested. There seems to be an increase in intensity for the triple charge peptides at higher flow rate and the opposite for the doubly charged peptides. However this difference does not really have an impact. Out of curiosity and to confirm this observation we did the same with a digested solution of BSA and obtained the same trend.
Figure 29: Intensity for the 5 SUMO3 peptides for different gas flow rate. Left the ion has charge 3, right as double charge ion.
3.1.2. TEMPERATURE
As mentioned for the flow rate tests, we were using the standard parameter and changed only the temperature of the electrodes. For the parameter experiments we were scanning over a CV range from -95V to -15V. In addition to the intensity of the ions, resolution between peptides is another important aspect. If the CV values for the optimal intensity are the same, the peptides co-elute. When we tested different temperature combinations we observed this effect more for doubly charged peptides. A better resolution can be achieved if the temperature is increased between the electrodes.
To illustrate the effect of the temperature on the intensity we plotted the different temperature combinations against the ion intensity.
0.00E+00 2.00E+05 4.00E+05 6.00E+05 8.00E+05 1.00E+06 1.20E+06 1.40E+06 1.60E+06 1.80E+06 392.54 3+ 450.57 3+ 477.93 3+ 557.60 3+ 647.39 3+
1.5 L/min 2.0 L/min 2.5 L/min 3.0 L/min 3.5 L/min
0.00E+00 2.00E+05 4.00E+05 6.00E+05 8.00E+05 1.00E+06 1.20E+06 1.40E+06 1.60E+06 1.80E+06 588.30 2+ 675.35 2+ 716.40 2+ 835.89 2+ 970.50 2+
Figure 30: The 5 different intensity profiles for different electrode temperatures
We get similar profiles for each SUMO3 peptide and there is no significant difference. However, it seems that the intensity for the triply charged ions in FAIMS is better. It becomes apparent that the ratio of the 3+ to 2+ ion increase with higher m/z value.
The result tells us that the combination of IE 70°C – OE 90°C is a good choice. The Intensity is more or less the same for all peptides compared to other combinations and we also
0.0E+00 2.0E+05 4.0E+05 6.0E+05 8.0E+05 1.0E+06 1.2E+06 1.4E+06 1.6E+06 1.8E+06 392.54 3+ 588.30 2+ 0.0E+00 2.0E+05 4.0E+05 6.0E+05 8.0E+05 1.0E+06 1.2E+06 1.4E+06 1.6E+06 1.8E+06 450.57 3+ 675.35 2+ 0.0E+00 2.0E+05 4.0E+05 6.0E+05 8.0E+05 1.0E+06 1.2E+06 1.4E+06 1.6E+06 1.8E+06 477.93 3+ 716.40 2+ 0.0E+00 2.0E+05 4.0E+05 6.0E+05 8.0E+05 1.0E+06 1.2E+06 1.4E+06 1.6E+06 1.8E+06 557.60 3+ 835.89 2+ 0.0E+00 2.0E+05 4.0E+05 6.0E+05 8.0E+05 1.0E+06 1.2E+06 1.4E+06 1.6E+06 1.8E+06 647.39 3+ 970.50 2+
have good transmission for the 3+ and 2+ ions. Figure 30 shows a better transmission of the triply charged form of the peptide than for the corresponding doubly charged ions. To summarize, FAIMS has a better transmission and separation of ions for charges states > 2+ (delta CV is larger).
3.1.3. DISPERSIONS VOLTAGE
Figure 31: The influence of the DV voltage shows a huge loss of intensity at lower voltages. The results of the graph bellows were obtained at gas flow 2.0L/min and IE70 ̊C – OE 90 ̊C.
Different dispersion voltages show that the best DV is at -5000V. The transmission of ions is most effective when the amplitude of the waveform cycle is at its maximum.
3.1.4. ACETONITRILE
Usually, FAIMS is conducted with inert nitrogen gas. It has been reported that gas modifiers like acetonitrile or ethanol improve sensitivity by increasing signal intensity (22). This is due to the cluster effect between the peptides in the gas phase. Even if we couldn’t add modifiers to our gas source, we were using different concentrations of acetonitrile for the dilution (only infusion) but we noticed no significant difference. This proves that the sole addition of organic solvent is not enough for declustering peptides in the gas phase.
0.0E+00 2.0E+05 4.0E+05 6.0E+05 8.0E+05 1.0E+06 1.2E+06 1.4E+06 1.6E+06 1.8E+06 -5000 -4000 -3000 In te n si ty DV [V]
3.2. C
OMPARISON OFLC-MS
WITH AND WITHOUTFAIMS
Equal amount of digested tryptic HEK293 total lysate were injected with FAIMS (12 CV steps) and without FAIMS (12 replicate).
a) b) -28V/-30V -32V/-34V -36V/-38V -40V/-42V -44V/-46V -48V/-50V -52V/-54V -56V/-58V -60V/-62V -64V/-66V -68V/-70V -72V/-74V c) d)
Figure 32: TIC LC-MS Chromatogram without FAIMS (a) for the 12 replicates and with FAIMS (b) for the 12 CV steps. The peptide map of RT versus m/z for all identified peptide ions without FAIMS (c) and with FAIMS (d).