HAL Id: hal-03022551
https://hal.sorbonne-universite.fr/hal-03022551
Submitted on 24 Nov 2020
HAL is a multi-disciplinary open access
archive for the deposit and dissemination of
sci-entific research documents, whether they are
pub-lished or not. The documents may come from
teaching and research institutions in France or
abroad, or from public or private research centers.
L’archive ouverte pluridisciplinaire HAL, est
destinée au dépôt et à la diffusion de documents
scientifiques de niveau recherche, publiés ou non,
émanant des établissements d’enseignement et de
recherche français ou étrangers, des laboratoires
publics ou privés.
Max Popp, Nicholas Lutsko, Sandrine Bony
To cite this version:
Max Popp, Nicholas Lutsko, Sandrine Bony. Weaker Links Between Zonal Convective Clustering
and ITCZ Width in Climate Models Than in Observations. Geophysical Research Letters, American
Geophysical Union, 2020, 47 (22), �10.1029/2020GL090479�. �hal-03022551�
Weaker Links Between Zonal Convective Clustering and
ITCZ Width in Climate Models Than in Observations
Max Popp1 , Nicholas J. Lutsko2 , and Sandrine Bony11Laboratoire de Météorologie Dynamique (LMD/IPSL), Sorbonne Université, Centre National de la Recherche
Scientifique (CNRS), École Polytechnique, École Normale Supérieure, Paris, France,2Scripps Institution of
Oceanography, University of California, San Diego, La Jolla, CA, USA
Abstract
Strong links are seen in observations between convective clustering and several properties of the Intertropical Convergence Zone (ITCZ). These links suggest that biases in how climate models simulate the ITCZ may be related to model biases in convective clustering or that there may be biases in how models represent the relationship between clustering and the ITCZ. We investigate these issues by analyzing convective clustering, and the link between clustering and ITCZ properties in 18 climate models. We find that the links between variability in convective clustering and variability of ITCZ properties are generally weaker and less robust in models than in observations. By contrast, model biases in the climatological convective clustering explain a substantial fraction of the climatological double-ITCZ bias, though they do not explain biases in the climatological ITCZ width.Plain Language Summary
The tropical deep convection that forms deep and strongly precipitating clouds organizes in various patterns and shapes within a narrow rain band that spans the globe in the tropics. The form of organization of this tropical deep convection has been shown to covary with several other properties of the rain band, such as its meridional width, in observations. This raises the question whether climate models can represent these links between the organization of convection and the rain-band properties. It is found that models simulate such a link between the spatial concentration of the deep convection and the width of the rain band, but this link is generally too weak. The models are unable to simulate the observed link between the concentration of the deep convection and the double-peak structure of the rain band. By contrast, the biases in mean concentration of the deep convection cannot explain the biases in the meridional width of the rain band, but explain a substantial fraction of the biases in the double-peak structure of the rain band.1. Introduction
The Intertropical Convergence Zone (ITCZ) is a zonal band of intensive deep convection in Earth's tropics that spans the globe and moves with the seasons. The deep convection within the ITCZ is not distributed uniformly, however, but organizes into clusters of various sizes and shapes that change over time (Mapes & Houze, 1993; Tobin et al., 2012). Recent work suggests that this convective clustering (CC) is associated with systematic changes in atmospheric properties (Bony et al., 2020; Holloway et al., 2017; Semie & Bony, 2020; Stein et al., 2017; Tobin et al., 2012). For instance, stronger clustering is associated with a drier troposphere, fewer high clouds, and increased outgoing longwave radiation (Wing et al., 2020). Furthermore, the degree of zonal CC along the equator has been shown to be strongly linked to several properties of the ITCZ, in particular, its meridional extent, the magnitude of the equatorial precipitation, and the distinctiveness of the double-peak structure (double ITCZ) (Popp & Bony, 2019; Popp et al., 2020).
CC occurs on a variety of scales, including scales below 50 km (e.g., Laing & Fritsch, 1997) that are typi-cally unresolved in climate simulations. This raises the question: Can climate models adequately represent the degree of CC and the observed links between CC and ITCZ properties? Moreover, several aspects of the ITCZ are substantially biased in climate simulations of the Coupled Model Intercomparison Project Phase 5 (CMIP5) (Li & Xie, 2014; Popp & Lutsko, 2017), such as the meridional distance between the two maxima in zonal-mean precipitation, the difference in precipitation between the two peaks, or the overall hemispheric asymmetry of the tropical precipitation. This raises a second question of whether potential biases in CC could contribute to these biases in ITCZ properties. Therefore, the aims of this paper are, first, to evaluate
RESEARCH LETTER
10.1029/2020GL090479
Key Points:
• Climate models underestimate the link between zonal convective clustering and the ITCZ width • Model biases in convective
cluster-ing explain double-ITCZ biases, but not ITCZ width biases
• Several factors may play a role in linking convective clustering and the ITCZ width, but no dominant mechanism was found Supporting Information: • Supporting Information S1 Correspondence to: M. Popp, [email protected] Citation:
Popp, M., Lutsko, N. J., & Bony, S. (2020). Weaker links between zonal convective clustering and ITCZ width in climate models than in observations. Geophysical Research
Letters, 47, e2020GL090479. https:// doi.org/10.1029/2020GL090479
Received 24 AUG 2020 Accepted 8 NOV 2020
Accepted article online 10 NOV 2020
©2020. The Authors.
This is an open access article under the terms of the Creative Commons Attribution-NonCommercial License, which permits use, distribution and reproduction in any medium, provided the original work is properly cited and is not used for commercial purposes.
the performance of climate models in representing the zonal CC in the equatorial region; second, to inves-tigate if observed links between this type of CC and ITCZ properties are well represented in climate models; and, third, to assess whether biases in CC are predictive of biases in ITCZ properties. We will also discuss various factors which may favor a strong link between CC and the ITCZ width. For this purpose we will com-pare “AMIP” simulations (with imposed sea surface temperatures) with observational and meteorological reanalysis products. AMIP simulations are performed with forced, observed sea surface temperatures and allow us to focus on atmospheric processes. Analysis of the AMIP simulations also allows us to evaluate the validity of previously suggested mechanisms for links between CC and ITCZ properties found in aquaplanet simulations (Popp & Bony, 2019; Popp et al., 2020) in more realistic configurations and with a large number of climate models. This is particularly useful for mechanisms based on energetic and gross-moist-stability frameworks, which are difficult to evaluate observationally (Popp & Bony, 2019; Popp et al., 2020).
2. Methods
We analyze “AMIP” simulations of 18 climate models taking part in CMIP5 (Taylor et al., 2012) and compare them to observational and meteorological reanalysis products. We will henceforth refer to reanalysis data as observations for simplicity. We focus on AMIP simulations rather than on coupled simulations because they allow us to isolate the atmosphere's role in CC and in determining the ITCZ width, and because the ide-alized simulations in Popp and Bony (2019) were also performed with prescribed sea surface temperatures. Observed precipitation is taken from the Global Precipitation Climatology Project (GPCP) data set (Adler et al., 2003; Huffman et al., 2009), and winds are taken from the European Center for Medium-Range Weather Forecasts Interim Reanalysis (ERAi) (Dee et al., 2011). For all data sets, we analyze the period from October 1996 to December 2008. This time period was chosen as the daily GPCP data begins in October 1996, while the AMIP simulations end in December 2008. We only present monthly mean results here, although daily data are required to calculate the two metrics for CC. Note that using the entire time period from 1979 to 2008 for the AMIP simulations does not significantly affect the results (compare Figures 1 and S1 in the supporting information and Figures 2 and S2).
To characterize CC, we follow the notion that CC is related to the spatial variance of convection (Bretherton et al., 2005; Muller & Bony, 2015; Wing & Emanuel, 2014; Wing et al., 2017) and use precipitation and vertical pressure velocity in the midtroposphere as proxies for the localization and intensity of convection. As a metric for zonal CC we use the monthly mean of the meridionally averaged daily zonal standard deviation of precipitation from 6◦S to 6◦N, normalized by the daily mean precipitation over the same region (S𝜆(P)) (Popp & Bony, 2019). We refer to this metric as “precipitation-inferred CC.” We also use the subsidence fraction as a metric of the CC (Coppin & Bony, 2015), defined here as the monthly average of the daily zonal fraction of positive values of the meridional-mean vertical pressure velocity at 500 hPa between 6◦S and 6◦N (Popp et al., 2020). We refer to this quantity as “dynamically inferred CC.” Since we limit ourselves to analyzing the impact of zonal CC in the region from 6◦S and 6◦N, we only take months into account for which the tropical precipitation distribution is symmetric about the equator, which we define as months for which the tropical precipitation asymmetry index (Hwang & Frierson, 2013; Popp & Bony, 2019) is less than 0.4. Note that this is done individually for each model, so the months that are incorporated into our analysis are not necessarily the same in all models. On average 56 months are retained for each model (range: 34–82 months), and 45 months of observations.
As metrics for the ITCZ width we employ the area mean of precipitation from 15◦S to 15◦N divided by the area mean of precipitation from 6◦S to 6◦N (WP) (Popp & Bony, 2019). We will refer to this quantity as “precipitation-inferred ITCZ width.” We also describe the ITCZ width by the contiguous width in degrees latitude of zonal-mean ascent region at 500 hPa (W𝜔) around the absolute maximum of zonal-mean precip-itation (Byrne & Schneider, 2016; Popp & Bony, 2019). We will refer to this metric as “dynamically inferred ITCZ width.”
3. Results
3.1. Representation of CC and of ITCZ Properties in Climate Models
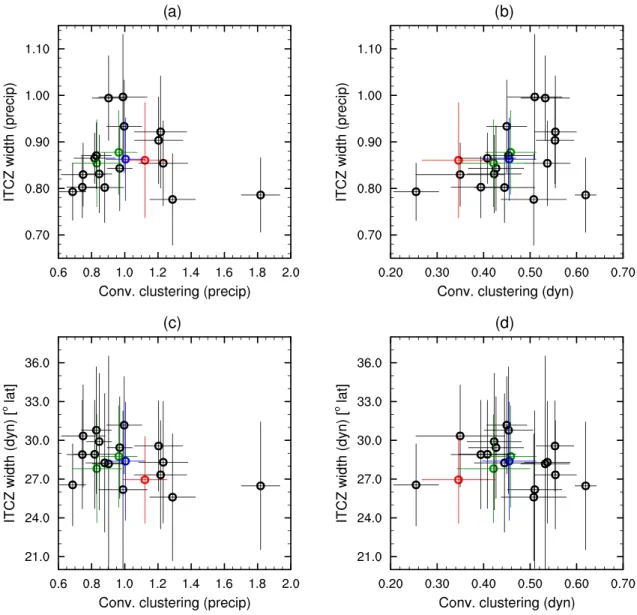
The multimodel mean (MMM) of the precipitation-inferred CC lies close but somewhat below the observed value, and the spread of the precipitation-inferred CC among models is large (Figure 1a and Table S1). The dynamically inferred CC on the other hand is systematically overestimated by the models, with only one
Geophysical Research Letters
10.1029/2020GL090479
Figure 1. Panel (a) shows the mean precipitation-inferred ITCZ width as a function of the mean precipitation-inferred CC and panel (b) the mean
precipitation-inferred ITCZ width, as a function of the mean of the dynamically inferred CC. Panel (c) shows the mean dynamically inferred ITCZ width as a function of the mean precipitation-inferred CC and panel (d) the mean dynamically inferred ITCZ width, as a function of the mean of the dynamically inferred CC. Each circle corresponds to the mean value of one of the models, the blue circle denotes the multimodel mean, the red circle the mean value of the observations, and the green circles the two high-resolution models (GFDL-HIRAM-C360 and MRI-AGCM3-2S). The bars denote the standard deviations in time of the different models and the observations. The same data are also listed in Table S1.
model having a mean value below observations (Figure 1b and Table S1). Even though the mean value biases tend to have opposite signs for the two CC metrics—the precipitation-inferred CC suggests a less clustered and the dynamically inferred CC a more clustered state than in observations—the temporal variabilities of the two metrics are highly and positively correlated in most climate models (Figure 2a and Table S2). Hence, the two metrics tend to covary in time, despite large mean-state biases in individual models. Note that the regression coefficient and the temporal variance explained between the two metrics for CC tend to be somewhat smaller in the models than in observations (Figure 2a and Table S3).
The MMMs of the precipitation-inferred and the dynamically inferred ITCZ widths are very close to observed values (Figure 1 and Table S1). The MMM of the temporal variances of these quantities are within 30% of observed values and are also considerably smaller than the mean values (Figure 1 and Table S1). However, unlike in observations, the link between the two metrics for the ITCZ width is weak in most models, with systematically lower temporal correlations between the two variables in models than in observations (Figure 2f and Table S2). This weak link must come from biases in boundary layer humidity or in the strength
Geophysical Research Letters
10.1029/2020GL090479
of the ascent, since precipitation can be well estimated from these two quantities (Held & Soden, 2006). Whatever the source of model error, the relationship between the variability of the meridional precipitation distribution and the variability of the dynamical width of the ascent region could be improved in climate models, despite the MMMs of the two metrics for ITCZ width being close to observed values.
3.2. Link Between CC and ITCZ Properties
In this section we evaluate the ability of climate models to reproduce the high observed correlations between the temporal variability in CC and the temporal variability of several ITCZ properties. For simplicity we henceforth refer to correlations in the temporal variability between two variables as “links” between these variables, such that high-correlation magnitudes correspond to strong links between variables. Depending on the metrics used, the variance in modeled ITCZ width explained by CC variability ranges from 34% to 62% (Figures 2b, 2c, 2d and 2e and Table S2). The variance explained is thus systematically lower than in observa-tions, suggesting a weaker link between these variables in models than in observations. Despite substantial intermodel differences, all models simulate strong links (at least 50% of variance explained between vari-ables) between at least one of the two metrics for CC and one of the metrics for the ITCZ width, and four mod-els explain at least 50% of the variance between all four combinations of the metrics for CC and the ITCZ. The (temporal) variability in the dynamically inferred CC better explains the simulated variability in the ITCZ width than the variability in precipitation-inferred CC. Furthermore, the temporal regression coefficient between the dynamically inferred CC and the ITCZ width in the models is closer to observations than the regression coefficient between the precipitation-inferred CC and the ITCZ width (Figures 2b, 2c, 2d and 2e and Table S3). These results support the notion by Popp et al. (2020) that changes in subsidence fraction (or conversely the convective fraction) explain changes in ITCZ width well.
All models represent a decrease in equatorial precipitation with the dynamically inferred CC with at least 48% of the temporal variance explained between the variables. But the variance explained between these variables is smaller in all models than in observations, implying a weaker link (Figure 2g and Table S2). Most models underestimate the temporal variance explained between an increase in CC and a more pronounced double-peak structure of the ITCZ by 10% or more (Figure 2h and Table S2).
3.3. Are Biases in CC Predictive of Biases in ITCZ Properties?
The high correlation between the temporal variability of CC and the variability of the ITCZ hints at the pos-sibility that intermodel differences in ITCZ width could be explained by intermodel differences in CC. In other words, could biases in CC (in the temporal mean or in the mean temporal variability) explain biases in ITCZ properties? To investigate this question, we calculate correlations across models between the mean values, standard deviations and root-mean-square errors (RMSEs) of the metrics for CC and for ITCZ proper-ties (Figure S3 and Table S4). This analysis suggests that biases in ITCZ width cannot generally be explained by biases in CC. However, the RMSE of the dynamically inferred CC is highly and positively correlated with the RMSE of the meridional distance between the two maxima of precipitation (fifth bar in Figure S3 and Table S4). Hence, biases in the dynamically inferred CC across models can explain a substantial fraction of the double-ITCZ bias across models, even though the temporal variability of the two quantities is not as well linked in individual models.
Figure 2. The figure shows the regression coefficient between the temporal variability of two variables as a function of the variance explained (from 0 to 1) between the same variables. Panel (a) shows this for the
precipitation-inferred and the dynamically inferred CC, panel (b) for the precipitation-inferred CC and ITCZ width, panel (c) for the precipitation-inferred CC and the dynamically inferred ITCZ width, panel (d) for the dynamically inferred CC and the precipitation-inferred ITCZ width, panel (e) for the dynamically inferred CC and ITCZ width, panel (f) for the precipitation-inferred and the dynamically inferred ITCZ width, panel (g) for the dynamically inferred CC and the equatorial precipitation, and panel (h) for the dynamically inferred CC and the distance between the maxima in zonal-mean precipitation (double-ITCZ indexφS, following Popp & Lutsko, 2017). Each circle corresponds to the values of one of the models, the blue circle to the multimodel mean, the red circle to the observed value, and the green circles the two high-resolution models (GFDL-HIRAM-C360 and MRI-AGCM3-2S). The values of the correlations and the regression displayed here are also listed in Tables S2 and S3.
4. Discussion
4.1. What Factors Favor a Strong Link Between CC and the ITCZ Width? 4.1.1. Model Resolution
The resolution of the employed model could have an impact on simulated links between CC and the ITCZ width. One important factor may be that the accuracy at which we can calculate the width of the ITCZ and the CC decreases with resolution. To test this possibility, we interpolate all model outputs to the resolution of the model with the lowest horizontal resolution (2.8125◦×2.8125◦) and repeat the analysis. We find that the temporal links between CC and ITCZ width are neither substantially nor systematically changed in individual models (Figure S4). Thus, the accuracy at which we calculate our indicators is not substantially affected by the model resolution.
Coarse-resolution necessitates the parameterization of and hence potential insufficient representation of certain physical processes and may thus affect the link between CC and the ITCZ width. While this fac-tor cannot be systemically investigated, we note that the two models with the highest spatial resolutions (GFDL-HIRAM-C360: 0.25◦×0.3125◦ and MRI-AGCM3-2S: 0.1875◦ ×0.1875◦) are among the models with the best overall representation of the link between CC and the ITCZ width. This suggests that higher resolution may favor an accurate representation of the link.
4.1.2. Magnitude of the Temporal Variance of CC
Another factor that could affect the link between CC and ITCZ properties in individual models is the tem-poral variance in CC. If the spread of CC is small, even a strong link between CC and ITCZ width could be masked by other processes affecting the ITCZ width. We find indeed that models with a larger tempo-ral variance in the dynamically inferred CC also tend to exhibit a higher correlation between the tempotempo-ral variability of the dynamically inferred CC and the dynamically inferred ITCZ width (31% of the variance explained), though a similar relation does not exist between the CC and the precipitation-inferred ITCZ. 4.1.3. Biases in Mean CC
It is conceivable that models could struggle to represent (temporal) links between CC and the ITCZ width if the mean CC is biased. We find that this is somewhat the case when the temporal mean of the dynamically inferred CC is biased. Models with low mean values of the dynamically inferred CC (that generally lie closer to observations) tend to have a stronger link between the precipitation-inferred CC and the dynamical ITCZ width, with 39% of the variance between the mean CC and the correlation between the CC and the ITCZ width explained across models. However, this is the only link of this kind across models.
4.2. Discussion of Possible Mechanisms That Link the Temporal Variability of CC to ITCZ Properties
4.2.1. Energetic Mechanisms
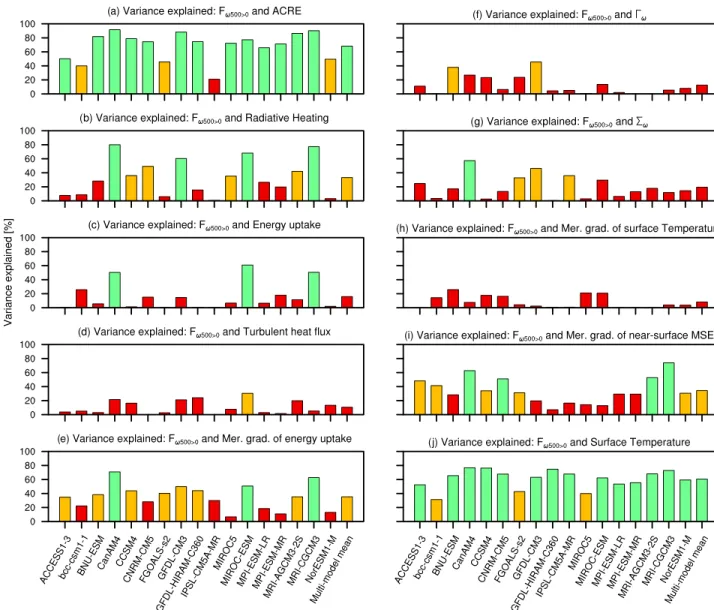
Popp and Bony (2019) and Popp et al. (2020) suggested that increased CC is associated with a reduced atmo-spheric cloud-radiative effect (ACRE) that leads to a reduction of the equatorial (6◦S to 6◦N) atmospheric energy uptake and to a weakening of the Hadley circulation in idealized climate simulations. Everything else unchanged, the weakening of the Hadley circulation would lead to a widening of the ITCZ following the arguments evoked by Popp and Silvers (2017) and Popp and Bony (2019). This hypothesis can currently not be verified in observations due to the magnitude of the uncertainties, but the AMIP simulations may help us evaluate this hypothesis. We find that the CC is associated with a reduced ACRE in individual mod-els (Figures 3a and S5a and Tables S5 and S6); however, this effect only carries through to the net equatorial atmospheric energy uptake in three models (Figures 3c and S5c). So while this mechanism might be at work in a few models, it does not explain by itself the link between CC and ITCZ width in most models. Note that the IPSL-CM5A-MR model is not among the models that show a link between CC and equatorial atmo-spheric energy uptake, even though Popp and Bony (2019) showed that in aqua planet simulations with the same model this is the case. However, they analyzed steady states of two years with stationary imposed forc-ing patterns to infer this result, and a similar mechanism might not manifest itself as clearly in the transient monthly data analyzed here. An indication that this is the case comes from removing the seasonal cycle from the CC and from the energy budget, in which case the variance of the CC explains more of the variance in the net atmospheric energy uptake (compare Figures 3a–3d and S6a–S6d)
A widening of the ITCZ could also occur if the atmospheric energy uptake increases on the flanks of the ITCZ (Albern et al., 2018; Byrne & Schneider, 2016), as the flanks would be more unstable to convection relative to the center of the ITCZ. Stronger CC is indeed associated with a reduced meridional gradient in
Geophysical Research Letters
10.1029/2020GL090479
Figure 3. The figure shows the variance (r2) explained between the temporal variability of the dynamically inferred CC Fω500> 0and other variables for each of the 17 models calculated from monthly mean values. Spatial averages of the different quantities were taken from 6◦S to 6◦N unless stated otherwise. Note that the CMCC-CM model is not shown, because not all variables were available. Panel (a) shows the variance of Fω500> 0explained by the atmospheric
cloud-radiative effect, panel (b) by the vertically integrated total radiative heating, panel (c) by the total vertically integrated atmospheric energy uptake, panel (d) by the total surface turbulent heat flux, panel (e) by the difference in the vertically integrated atmospheric energy uptake between the mean values in the zonal band between 6◦S and 6◦N and the average of the mean values in the zonal bands between 16◦S and 10◦S and between 10◦N and 16◦N, panel (f) by the top heaviness of the vertical pressure velocity profile (defined as the mass weighted vertical integral ofωabove 500 hPa, divided by the mass weighted vertical integral over the entire atmosphere) in the zonal band between the 6◦S and 6◦N (Γω,eq), panel (g) by the vertical mass flux divergence between 800 and 500 hPa
averaged in the zonal band between 6◦S and 6◦N (Σω, eq), panel (h) and (i) by the difference in 2 m temperature and in moist static energy at 850 hPa,
respectively, between the mean values in the zonal band between 6◦S and 6◦N and the average of the mean values in the zonal bands between 16◦S and 10◦S and between 10◦N and 16◦N, and panel (j) by the 2 m temperature. Red bars indicate that less than 30%, orange bars that between 30% and 50%, and green bars that more than 50% of the variance is explained between variables. The same data are shown in form of a table in Table S5.
atmospheric energy uptake in the individual models (Figures 3e and S5e). In the three model with strong anticorrelation between CC and the equatorial atmospheric energy uptake the reduction of meridional gra-dient in atmospheric energy uptake occurs because of the reduced equatorial atmospheric energy uptake (compare Figures 3c and 3e), whereas in the other models it occurs mostly because of an increase in atmo-spheric energy uptake on the flanks of the ITCZ (not shown). Both cases are consistent with a widening of the ITCZ, but the mechanism by which the CC affects the energy uptake is unclear. In particular, it is unclear whether the increased energy uptake in the flanks of the ITCZ are causing the increase of convection in that region or if the increased energy uptake is the result of the increased deep convection in the ITCZ flanks.
4.2.2. Gross Moist Stability Mechanisms
Since atmospheric energy uptake can only explain part of the link between CC and the ITCZ width, the other part of the response has to be associated with a change of the energy density transported by the circu-lation, the so called gross moist stability (Neelin & Held, 1987). Popp et al. (2020) suggest that in aquaplanet simulations changes in gross moist stability with CC occur, because the vertical profiles of vertical velocity become more top heavy with CC. As a consequence the difference of the energy transported between the lower and the upper branch of the Hadley circulation increases (Back & Bretherton, 2006; Inoue & Back, 2015). If the other aspects of the atmospheric energy budget do not change, the Hadley circulation weakens (Neelin & Held, 1987) leading to less upwelling in the upwelling regions, less subsidence in the subsidence regions, and thus to a widening of the ITCZ. Can this mechanism help explain the link between CC and the ITCZ width of individual models in the AMIP simulations? Unfortunately, it is only the case in two models (Figures 3f and S5f). The temporal variability in CC explains somewhat better that of the horizontal mass divergence between 500 hPa and 800 hPa (Figures 3g and S5g), which is an altitude range of low energy density that is particularly effective at affecting the Hadley circulation (Back & Bretherton, 2006; Fläschner et al., 2018). It is also the altitude range where shallow circulations diverge, thus implying that increased CC may be associated with stronger shallow circulations in a few models.
4.2.3. Surface Temperature and Low-Level Moist-Static-Energy Distribution
The temporal variability of CC is strongly anticorrelated with that of the average near-surface temperature in the equatorial region in observations (Popp & Bony, 2019). This is also the case in the simulations ana-lyzed here (Figures 3j and S5j) and raises the question whether the temperature in this region also controls the ITCZ width. One hypothesis is that the ITCZ width responds to changes in the meridional gradient of surface temperature (Lindzen & Nigam, 1987; Oueslati & Bellon, 2013), but it is neither the case in obser-vations (Popp & Bony, 2019) nor in the individual AMIP simulations (Figures 3h and S5h). However, since the specific humidity increases faster than linearly with temperature for fixed relative humidity owing to the Clausius-Clapeyron relation, similar temperature gradients lead to larger gradients in specific humidity and thus in moist static energy MSE at higher temperatures. Thus CC could be anticorrelated with merid-ional gradients of MSE in the boundary layer, even if there is no anticorrelation with meridmerid-ional surface temperature gradients. Since deep convection preferably occurs in the vicinity of maxima in boundary layer MSE (Emanuel et al., 1994; Lindzen & Hou, 1988; Privé & Plumb, 2007), a wider meridional distribution of boundary layer MSE would be consistent with a widening of the ITCZ (Popp & Silvers, 2017). We find indeed a modest anticorrelation between CC and the meridional gradient in boundary layer MSE in most models (Figures 3i and S5i). Thus, the reduction in meridional boundary layer MSE gradient with increas-ing CC and higher tropical boundary layer temperatures may partly explain why CC and the ITCZ width are correlated. Note, however, that a wider meridional boundary layer MSE distribution could also be caused by other effects, such as changes in evaporation, changes in the mixing with the free troposphere and changes in moisture convergence.
5. Summary
In this study we investigate how climate models represent the zonal CC in the equatorial region, ITCZ properties with a focus on the ITCZ width, and the temporal correlation between these quantities (links). We find that the models represent reasonably well the precipitation-inferred CC and the ITCZ width, but that the dynamically inferred CC is overestimated. The temporal variability of the two metrics for CC are well correlated, but the link between the dynamically and the precipitation-inferred ITCZ width is sub-stantially weaker in individual models than in observations. In general, the links between dynamically and precipitation-inferred metrics are less strong in models than in observations. All models exhibit a robust link between at least one of the metrics of CC and one of the metrics of ITCZ width, but links are gener-ally weaker than in observations. The models struggle, however, to represent the observed temporal link between CC and the distinctiveness of the double-peak structure of the ITCZ.
The biases and intermodel differences in CC cannot explain by themselves the intermodel differences or biases in the ITCZ width, but the biases in CC explain a substantial fraction of the double-ITCZ bias across models. There is a tendency for models with larger temporal spread in dynamically inferred CC and models with high spatial resolution to exhibit stronger links between CC and the dynamically inferred ITCZ width. A number of different factors may play a role in the link between the temporal variability of the CC and that of the ITCZ width in different models, such as the atmospheric energy budget, the meridional gradients
Geophysical Research Letters
10.1029/2020GL090479
in MSE and possibly the vertical structure of the vertical wind profile. However, our analysis did not reveal a dominant mechanism that could explain this link in all models. We noted that the CC is highly anticorrelated with the equatorial mean temperature. Although this does not explain by itself the link between CC and other ITCZ properties, it could lead the way to a mechanism that explains these links in a comprehensive way.
Data Availability Statement
The “AMIP” simulations of the Coupled Model Intercomparison Project phase 5 (CMIP5) are available at https://esgf-node.llnl.gov/search/cmip5/ website. Processed GPCP data are available on the website of the Observations for Model Intercomparisons Project (obs4MIPs, https://esgf-node.llnl.gov/projects/ obs4mips/). The ERA-interim data is available upon registration on the homepage of ECMWF (https:// www.ecmwf.int/en/forecasts/datasets/reanalysis-datasets/era-interim). Scripts used to create figures and perform analysis and essential processed data is publicly available on the Zendoo repository https://zenodo. org/record/4266737 (https://doi.org/10.5281/zenodo.4266737).
References
Adler, R. F., Huffman, G. J., Chang, A., Ferraro, R., Xie, P.-P., Janowiak, J., et al. (2003). The version-2 Global Precipitation Climatology Project (GPCP) monthly precipitation analysis (1979–present). Journal of Hydrometeorology, 4(6), 1147–1167.
Albern, N., Voigt, A., Buehler, S. A., & Grtzun, V. (2018). Robust and nonrobust impacts of atmospheric cloud-radiative interactions on the tropical circulation and its response to surface warming. Geophysical Research Letters, 45, 8577–8585. https://doi.org/10.1029/ 2018GL079599
Back, L. E., & Bretherton, C. S. (2006). Geographic variability in the export of moist static energy and vertical motion profiles in the tropical Pacific. Geophysical Research Letters, 33, L17810. https://doi.org/10.1029/2006GL026672
Bony, S., Semie, A., Soden, B., Kramer, R. J., Tompkins, A. M., & Emanuel, K. A. (2020). Observed modulation of the tropical radiation budget by deep convective organization and lower tropospheric stability. AGU Advances, 1, e2019AV000155.
Bretherton, C. S., Blossey, P. N., & Khairoutdinov, M. (2005). An energy-balance analysis of deep convective self-aggregation above uniform SST. Journal of the Atmospheric Sciences, 62(12), 4273–4292.
Byrne, M. P., & Schneider, T. (2016). Energetic constraints on the width of the intertropical convergence zone. Journal of Climate, 29(13), 4709–4721.
Coppin, D., & Bony, S. (2015). Physical mechanisms controlling the initiation of convective self-aggregation in a General Circulation Model. Journal of Advances in Modeling Earth Systems, 7, 2060–2078. https://doi.org/10.1002/2015MS000571
Dee, D. P., Uppala, S. M., Simmons, A. J., Berrisford, P., Poli, P., Kobayashi, S., et al. (2011). The ERA-Interim reanalysis: Configuration and performance of the data assimilation system. Quarterly Journal of the Royal Meteorological Society, 137, 553–597.
Emanuel, K. A., Neelin, D. J., & Bretherton, C. S. (1994). On large-scale circulations in convecting atmospheres. Quarterly Journal of the
Royal Meteorological Society, 120(519), 1111–1143.
Fläschner, D., Mauritsen, T., Stevens, B., & Bony, S. (2018). The signature of shallow circulations, not cloud radiative effects, in the spatial distribution of tropical precipitation. Journal of Climate, 31(23), 9489–9505.
Held, I. M., & Soden, B. J. (2006). Robust responses of the hydrological cycle to global warming. Journal of Climate, 19(21), 5686–5699. Holloway, C. E., Wing, A. A., Bony, S., Muller, C., Masunaga, H., L'Ecuyer, T. S., et al. (2017). Observing convective aggregation. Surveys
in Geophysics, 38(6), 1199–1236.
Huffman, G. J., Adler, R. F., Bolvin, D. T., & Gu, G. (2009). Improving the global precipitation record: GPCP version 2.1. Geophysical
Research Letters, 36, L17808. https://doi.org/10.1029/2009GL040000
Hwang, Y.-T., & Frierson, D. M. W. (2013). Link between the double-Intertropical Convergence Zone problem and cloud biases over the Southern Ocean. Proceedings of the National Academy of Sciences, 110(13), 4935–4940.
Inoue, K., & Back, L. E. (2015). Gross moist stability assessment during TOGA COARE: Various interpretations of gross moist stability.
Journal of the Atmospheric Sciences, 72(11), 4148–4166.
Laing, A. G., & Fritsch, J. M. (1997). The global population of mesoscale convective complexes. Quarterly Journal of the Royal
Meteorological Society, 123(538), 389–405.
Li, G., & Xie, S.-P. (2014). Tropical biases in CMIP5 multimodel ensemble: The excessive equatorial Pacific cold tongue and double ITCZ problems. Journal of Climate, 27(4), 1765–1780.
Lindzen, R. S., & Hou, A. V. (1988). Hadley circulations for zonally averaged heating centered off the equator. Journal of the Atmospheric
Sciences, 45(17), 2416–2427.
Lindzen, R. S., & Nigam, S. (1987). On the role of sea surface temperature gradients in forcing low-level winds and convergence in the tropics. Journal of the Atmospheric Sciences, 44(17), 2418–2436.
Mapes, B. E., & Houze, R. A. (1993). Cloud clusters and superclusters over the oceanic warm pool. Monthly Weather Review, 121(5), 1398–1416.
Muller, C., & Bony, S. (2015). What favors convective aggregation and why? Geophysical Research Letters, 42, 5626–5634. https://doi.org/ 10.1002/2015GL064260
Neelin, J. D., & Held, I. M. (1987). Modeling tropical convergence based on the moist static energy budget. Monthly Weather Review,
115(1), 3–12.
Oueslati, B., & Bellon, G. (2013). Tropical precipitation regimes and mechanisms of regime transitions: Contrasting two aquaplanet general circulation models. Climate Dynamics, 40(9–10), 2345–2358.
Popp, M., & Bony, S. (2019). The impact of convective clustering on the width of the tropical rain belt. Nature Communications, 10, 4261. Popp, M., & Lutsko, N. J. (2017). Quantifying the zonal-mean structure of tropical precipitation. Geophysical Research Letters, 44,
9470–9478. https://doi.org/10.1002/2017GL075235 Acknowledgments
We thank Andrea Jenney and an anonymous reviewer for constructive reviews and for many valuable suggestions. This project has received funding from the European Research Council (ERC) under the European Union's Horizon 2020 research and innovation program (grant agreement No. 694768). This work was granted access to the HPC resources of IDRIS under the allocation 0292 made by GENCI. M. P. acknowledges funding from the Centre National D' études Spatiales (CNES).
Popp, M., Lutsko, N. J., & Bony, S. (2020). The relationship between convective clustering and mean tropical climate in aquaplanet simulations. Journal of Advances in Modeling Earth Systems, 12, e2020MS00207. https://doi.org/10.1029/2020MS002070 Popp, M., & Silvers, L. G. (2017). Double and single ITCZs with and without clouds. Journal of Climate, 30(22), 9147–9166.
Privé, N. C., & Plumb, R. A. (2007). Monsoon dynamics with interactive forcing. Part I: Axisymmetric studies. Journal of the Atmospheric
Sciences, 64(5), 1417–1430.
Semie, A. G., & Bony, S. (2020). Relationship between precipitation extremes and convective organization inferred from satellite observations. Geophysical Research Letters, 47, e2019GL086927. https://doi.org/10.1029/2019GL086927
Stein, T. H. M., Holloway, C. E., Tobin, I., & Bony, S. (2017). Observed relationships between cloud vertical structure and convective aggregation over tropical ocean. Journal of Climate, 30(6), 2187–2207.
Taylor, K. E., Stouffer, R. J., & Meehl, G. A. (2012). An overview of CMIP5 and the experiment design. Bulletin of the American
Meteorological Society, 93(4), 485–498.
Tobin, I., Bony, S., & Roca, R. (2012). Observational evidence for relationships between the degree of aggregation of deep convection, water vapor, surface fluxes, and radiation. Journal of Climate, 25(20), 6885–6904.
Wing, A. A., & Emanuel, K. A. (2014). Physical mechanisms controlling self-aggregation of convection in idealized numerical modeling simulations. Surveys in Geophysics, 6, 59–74. https://doi.org/10.1007/s10712-017-9408-4
Wing, A. A., Emanuel, K., Holloway, C. E., & Muller, C. (2017). Convective self-aggregation in numerical simulations: A review. Surveys
in Geophysics, 38(6), 1173–1197.
Wing, A. A., Stauffer, C. L., Becker, T., Reed, K. A., Ahn, M.-S., Arnold, N. P., et al. (2020). Clouds and convective self-aggregation in a multimodel ensemble of radiative-convective equilibrium simulations. Journal of Advances in Modeling Earth Systems, 12, e2020MS002138. https://doi.org/10.1029/2020MS002138