Developing Quantitative Models for Contraction at Wound Edges
Using Finite Element Analysis
by
Chidinma C. Obi
Submitted to the Department of Mechanical Engineering
in Partial Fulfillment of the Requirements for the Degree Of
Bachelor of Science in Mechanical Engineering
at theMassachusetts Institute of Technology
May 2005
[J30e
-C
t
Jj
MASSACHUSETTS INSTITUTE -ASSHUSETTS INSTTITUE OF TECHNOLOGY JUN 0 8 2005 I IRARIF5.,The author hereby grants to MIT permission to reproduce and distribute publicly paper
and electronic copies of this thesis document in whole or in part.
Signature of Author:
--Department of Mechanical Engineering
May 6, 2005
Certified by:Accepted by:
- /11~~~~~~ Ioannis V. Yannas
Professor of Mechanical Engineering
Thesis Supervisor
, . .
Ernest G. Cravahlo
Chairman, Undergraduate Thesis Committee
ARCHIVES
.--Developing Quantitative Models for Contraction at Wound Edges
Using Finite Element Analysis
by
Chidinma C. Obi
Submitted to the Department of Mechanical Engineering
on May 6, 2005 in Partial Fulfillment of theRequirements for the Degree of Bachelor of Science in
Mechanical Engineering
ABSTRACT
Finite element analysis was applied to develop a quantitative tool for studying contraction at wound edges. Two models showing contraction at the edges of a cylindrical liver wound were employed. The first model assumed that contractile cells applied forces to the wound only at the top and bottom surfaces of the liver; the second model assumed that the contractile forces occurred along the entire wound surface. Assumptions based on prior studies on skin wound contraction where used to obtain the magnitude and direction of the contractile forces applied to the wound edges and the material properties of the models. The magnitudes of deformations in all three planar coordinates were obtained, and mathematical expressions describing the deformation gradients viewed at the edges were derived. The deformations on Model B where found to be three orders of magnitude larger than those on Model A. The deformations in Model A were found to change exponentially with respect to the y- and z-axis, while the deformations in Model B fit 2nd-degree polynomials with respect to both the y- and z-axis. Displacements with respect to the x-axis were zero in both models. The applications of these quantitative models to current
studies on contraction and scaffold fabrication were discussed.
Thesis Supervisor: oannis Yannas
Title: Professor of Polymer Science & Engineering, Department of Mechanical
Engineering.ACKNOWLEDGMENTS
I would like to thank my thesis advisor, Professor Yannas, for giving me the opportunity to work with him in a field that I have been excited about from the onset of my education at MIT. He is one of the most respected and most recognized names in the field of tissue and organ regeneration, yet he is still willing to mentor and be a valuable resource to students who are interested in this field of research. I have been most honored to be a student in two of his classes and to have him as the supervisor of this thesis. I would also like to thank Irfan Baig, graduate student in the Finite Element Analysis (FEA) laboratory headed by Professor Bathe, for interrupting his busy schedule to help me understand the intricacies of the FEA software I employed for this thesis and to teach me to use the software effectively. I would like to use this opportunity to thank the many instructors at MIT who have taken the time to explain even the smallest of concepts, to aid my understanding of the subject in
question. I especially thank Professor Hunter, my undergraduate advisor, for believing in
my ability to pull through the toughest of semesters, and I extend many regards to Professor Simona Socrate, who broke "Mechanics and Materials" down to its simplest, most basic frm, and made it possible for me and countless other students to understand and even enjoy mechanical engineering.I would like to thank my parents, siblings, extended family, and friends for years of encouragement, patience, and love, despite my many flaws.
1.0 INTRODUCTION
Unlike the fetus, wounds in adult species heal irreversibly by contraction and scar-formation [. In irreversible healing, the wound seeks the quickest way to close to prevent blood and fluid loss and infection of the organ. However, the site of injury is usually left without some of its initial form and function. Investigators have, thus, been interested in finding ways to induce the adult wound to heal by regeneration. Regeneration synthesizes the missing organ mass at the wound site, and thus, allows for both restoration of form and function. For regeneration to occur however, implantation of a scaffold that is seeded with the epithelial cells of the wounded organ is required [2]. One of the important functions of the scaffold is to delay contraction at the wound edges, and thus hinder irreversible healing. However, to design a scaffold that is effective in stopping contraction, the nature of the forces of contraction applied at the wound edges needs to be clearly understood.
The extensively-studied mechanism of contraction in skin wounds helps in predicting contraction in other organs. In the studies, a well-defined defect was first obtained. A well-defined defect is one in which the experimental volume has boundaries that clearly separates the defect volume from the rest of the organism [3]. All traces of dermis were removed fromrn the defect, and the defect was given rectangular boundaries-a clearly defined length, width and height. Fibroblasts that expressed the contractile phenotype (myofibroblasts) aligned themselves at the wound edges and after achieving a 100 ,xm-thick layer, began to contract the width of the wound (major preferred direction) until wound closure was achieved [4]. Applying much of the knowledge obtained from skin studies, nerve was studied as well. In nerve, the well-defined defect was created by complete transection of the nerve. Myofibroblasts were in the capsule that surrounded the nerve trunk and were also aligned parallel to the nerve axis inside the nerve trunk. The myofibroblasts applied a contractile force that resulted in closure of the stump with formation of neuroma when the contractile force overcame the force that causes outflow of endoneurial fluid [5]. Because of the many parallels between contraction in nerve and that in skin, it has been hypothesized that many other organs may undergo contraction and closure in ways similar to skin wounds. Thus, in the study of contraction in wounds of varied geometry and in organs of different geometry from skin, assumptions can be made about the wound healing mechanisms based on the mechanism of contraction in skin. Although there are current studies that qualitatively evaluate the forces at the wound edges and their effects, there is an absence of quantitative models of the contractile forces, stress distribution and the resulting deformations of the wound edges. For instance in Troxel, 1994, despite a very intensive study of the mechanisms of contraction, the extent of quantitative analysis are kinematics and graphs that show change of the area of the wound with time [6]. Thus, this thesis embarked on developing a quantitative tool for studying contraction that is applicable for defects of varied geometries, using assumptions from contraction in skin as a paradigm. Finite Element Analysis (FEA) was used to study two models of cell contraction of a cylindrical defect in the human liver and to estimate the magnitude of the deformations observed at the wound.
2.0 METHOD
2.1 Apparatus
ADINA was used for the finite element analysis (FEA) of the model. FEA was employed as the quantitative tool because of its ability to solve the partial differential equations that characterize many linear, non-linear, static and dynamics problems and provide pertinent information like the state of stress, strain and deformations of these systems. ADINA was selected as the finite element analysis program of choice because it allows the model geometry to be directly created on the ADINA-AUI interface or imported from various CAD systems. This gives the investigator flexibility in creating and modifying the geometry of the particular organ or defect of interest. The user can also assign physical properties, loads and boundary conditions directly to the model geometry and modify finite element meshes without affecting the model definition. Also a finite element analysis program that allows a geometric (pictorial) representation of the system makes it easy for investigators to observe and interpret results without needing to be familiar with the operation of the finite element analysis program.
2.2 Procedure
2.2.1 Assigning model geometry and applied forces
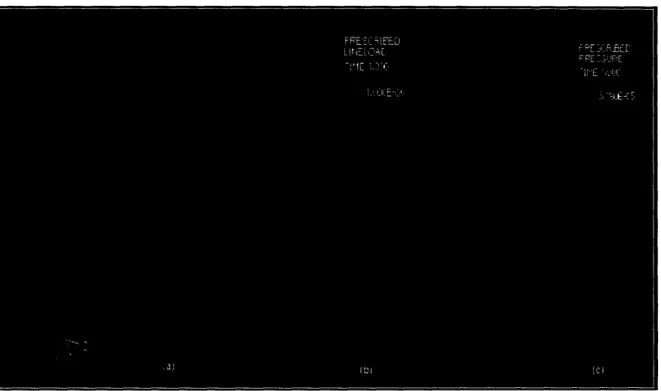
The liver was modeled as a rectangular block with dimensions of 200 mm x 90 mm x 250 mm, the approximate measurements of the human liver [7]. A 45 mm-diameter cylindrical defect was created in the center of the 200 mm x 90 mm face to perforate the block along the longest (the 250 mm) length. Because the system is symmetric about its center, only a quarter of the entire geometry was required for the analysis. The forces applied on the chosen quadrant by the restrictive presence of the other three quadrants were represented as boundary conditions and constraints (see Figure 1, (a)). The Young's Modulus of elasticity
(E) was approximated as 1,000 Pa
(N/m2)since E for most tissues is of this magnitude. E
was converted to the equivalent 10-3N/mm2 to ensure that all length was expressed in units of millimeters and all force expressed in units of Newton. This conversion was imperative because the values input into the FEA program are dimensionless, thus, there is a need for the units to be homogeneous if the specified geometric properties are to be in the correct proportion relative to each other. The Poisson's ratio was approximated as 0.5 [8].Two models for contraction of the wound were developed. In the first model, Model A, the model assumption was that the cells applied contractile forces to the wound only at the top and bottom surfaces of the liver. In the second model, Model B, the assumption was that the cells applied contractile forces along the entire wound surface. The forces applied on both models were derived. For Model A, the circumference of the quadrant is /4 x (pi x 45
mm) = 35.34 mm. The diameter of a single cell is about 10 #Im. Thus, the number of cells that would cover the model circumference is 3534 cells. Since a 100 itm-thick layer is required for contraction (=10 cells thick), we have a total of 10 x 3534 cells at contraction. With each cell applying a force of 1 nN [9], the total force applied at the 35.34 mm surface
at contraction. With each cell applying a force of nN [9], the total force applied at the
6
35.34 nunmm surface = 10-6N/mm.
For Model B, the area of the quadrant model is 1/4 x (pi x 45 mm) x 250 mm = 8835.7
mm2. The area of a single cell of diameter 10 [tm is pi x (10 prm)2. Thus, the number of
cells that would cover the model area is about 28 million cells. Since a 10 cells thick layer is required for contraction, we have a total of 10 x 28 million cells at contraction. With each cell applying a force of
I
nN each, the total force applied at the 8835 mm surface= 3.18 x 10⁻⁵ N/mm
2.Figure 1: The liver model showing a quarter of the entire geometry. Diagram (a)
represents the rest of the geometry as constraints on the chosen quadrant. The
green lettering B indicates constraints in the z-
(U3)direction, and C indicates
constraints in the y- (U
2) direction.
Diagram (b) is Model A, in which contractile
forces are only applied to the top and bottom surfaces of the circular wound, and (c)
is Model B, in which contractile forces are applied along the entire length of the
wound.
2.2.2 Solving for Deformations Using ADINA
The 3-D geometric model of the liver was created on the ADINA-AUI interface in what is referred to as the processing stage. By clicking the Solution/Data file icon, the pre-processed model (of extension .idb) from the ADINA-AUI was converted into a data file (extension is .dat) to be recognized by the solver. The data file was processed by the
ADINA solution program, and the solution was output as a porthole file (extension
.por[t]). This solution was then converted back into a 3-D geometric model thatdisplayed all the pertinent deformations and was analyzable using ADINA-PLOT in what is referred to as the post-processing stage. Mathematical equations describing the
deformations along the wound length were obtained using Microsoft Excel.
3.0 RESULTS
3.1 Deformations on Model A
In Model A, the cell contraction resulted in deformations along the y- and z-directions of the wound. There were no deformations in the x-direction of the wound. All deformations were symmetric about the center of the model (at length 125 mm).
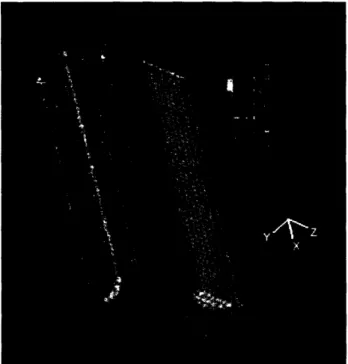
At this point, it is necessary to clarify the difference between the terms "along" the wound and 'across" the wound. "Along" the wound refers to the line that runs in the x-direction (the 250 mm length of the wound), and on the center of the curved wound surface. In figure 2 below, it is labeled as (i). "Across" the wound refers to the 35.34 mm circumference of the circular wound. In figure 2 below, it is labeled by (ii), and it runs in the direction away from the top surface. The labels (i) and (ii) will be especially useful when expressing the deformations mathematically in terms of the "along" and 'across" lengths, respectively. The diagram below is an example of a deformation gradient "across" the wound since the deformation changes can be traced on the (ii)
length.
Figure 2: Distances "along" and "across" a wound. (i) represents "along" while (ii)
represents "across" the wound. The diagram is an example of a deformation
gradient "across" the wound since the deformations (color changes) occur while
In Model A, deformations in the y-direction changed exponentially with 96.26%
accuracy and fit the relationship y-displacement = -0.0029e-°°7 °7',
i where (i) represents the distance along the wound. At about 98.8 mm along the wound length, the displacements switchedfrom
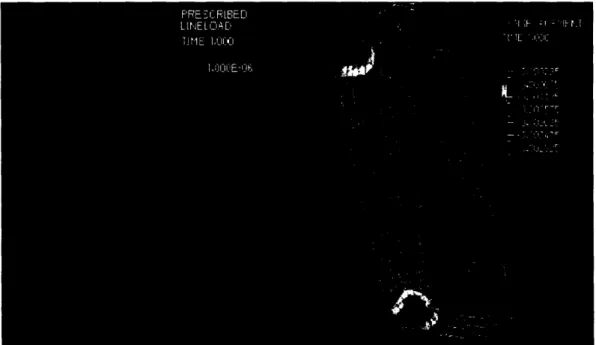
negative to positive, i.e. displacement due to the contractile forces became zero. The maximum y-displacement was 2.36 x 10⁻³mm.Figure 3: Deformation of Model A in the y-direction. The displacement gradient
showed symmetry in deformations about the center of the model. Also, the largest
displacements were observed at the surface of the model where the forces were
directly applied.
5.0E-04 -- -O.OE+OO E -5.0E-04 -1.OE-03 E -1.5E-03 0 i -2.0E-03 .' -2.5E-03 -3.0E-03 -3.5E-03 Q_ / -75-- 100 125 150 - y-displacement -- -Exponential f itDistance along wound, (i) [mm]
Figure 4:
xponential fit for deformations in the y-direction on Model A. The
equation obtained was y-displacement
= -0.0029e0 0°°7 °07(i)where (i) represents the
distance along the wound.Deformations in the z-direction were also exponential with 97.79% accuracy and fit the relationship -displacement = -0.0016e-' °665(i, where (i) represents the distance along the wound. The deformations never died out but obtained their lowest value of -1.76 x 10-s mm at the center of the model. The maximum z-displacement was -1.83 x 10⁻³mm.
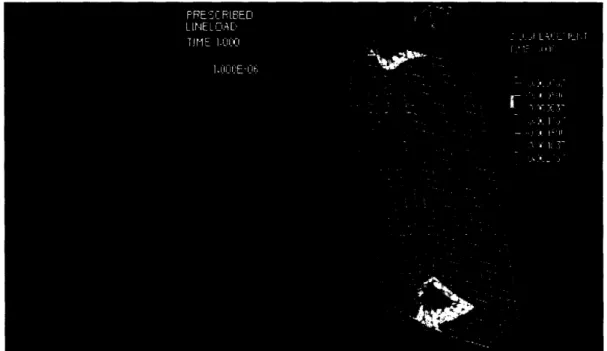
Figure 5: Deformation of Model A in the z-direction. The displacement gradient
showed symmetry in deformations about the center of the model. Also, largest
displacements were observed at the surface of the model where the forces were
directly applied.
E E E 0 . N, N u uu~-+ut U.UUL+UU -5.00E-04 -1.OOE-03 -1.50E-03 5 150 Exponential fit - z-displacement -2.00E-03Distance along wound, (i) [mm]
Figure 6: Exponential fit for deformations in the z-direction on Model A. The
relationship obtained was z-displacement
= -0.0016e °°665(i)where (i) represents the
distance along the wound.
There were no deformations in the x-direction (along the length of the wound).
Figure 7: Deformation of Model A in the x-direction. There were no observed
displacements in the x direction, and thus, no corresponding displacement gradient.
3.2 Deformations on Model B
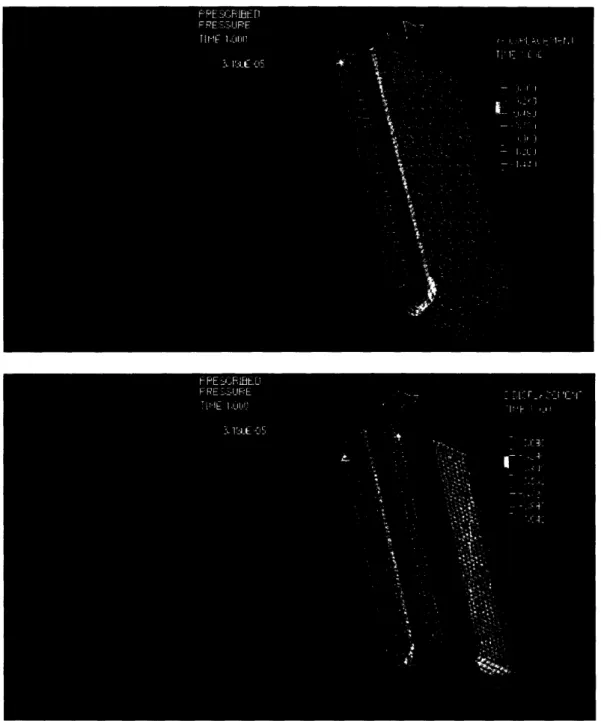
In Model B, the contractile forces resulted in deformations across the wound and in the y-and z-directions. There were no deformations in the x-direction of the wound. Unlike Model A, the displacement gradients occurred across the wound and not along the wound length. The y-displacements were constant with a value of -1.07 mm along the wound. The z-deformations were also constant with a value of -0.79 mm along the wound. Since the displacement changes occurred across the wound, the y- and z-displacements were
plotted against the (ii) distance defined in Figure 2.
Figure 8: Deformations of Model B in the y- (above) and z- (below) directions. All
deformations are constant along the wound length. The displacement gradients
occur across the wound.
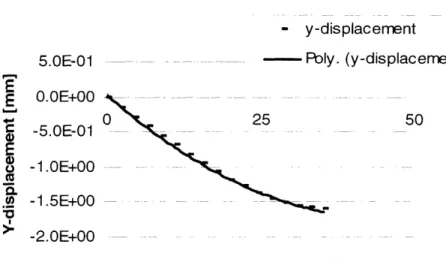
Deformations in y- and z-directions were
fit
to 2n d degree polynomials. The y-deformations were fit to y-displacement = O.0009(ii)2- 0.0775(ii) + 0.0343 with 99.84% accuracy, where (ii) represents the distance across the wound.- y-displacement
Poly. (y-displacement)
25
-2.0E+00
Distance across wound, (ii) [mm]
Figure 6: Polynomial fit for deformations in the y-direction on Model B. The
relationship obtained was y-displacement
=0.00099(ii)
2 -0.0775(i)
+
0.0343 where
(ii) represents the distance across the wound.
The z-deforrnations were fit to -displacement = 0.0007(ii) 2 + 0.0063(ii) - 1.1344 with
99.92% accuracy, where (ii) represents the distance across the wound.
2.0E-01 O.OE+00 E E C V E 'O N - z-displacement - - . .. FPoly. (z-displacement) -2.0E-01 4.0E01
-50
-6.0E-01 -8.0E-01 -1 .OE+00 - 1.2E+00Distance along wound, (i) [mm]
Figure 6: Polynomial fit for deformations in the z-direction on Model B. The
relationship obtained was y-displacement = 0.0007(ii)
2+ 0.0063(ii) - 1.1344 where (ii)
represents the distance across the wound.
5.0E-01 O.OE+00 -5.0E-01 0 E E 0 '0 ! -C._ V -1 .OE+00 -1.5E+00 50 I 1
There were no deformations in the x-direction (along the length of the wound).
Figure 9: Deformation of Model B in the x-direction. There were no observed
displacements in the x-direction, and thus, no corresponding displacement gradient.
4.0 DISCUSSION AND CONCLUSION
4.1 Result Analysis
In Model A, the exponential decay observed agrees with the intuitive expectation that displacements are largest at the site of largest contractile forces (the surface) and
decreases along the wound. However, intuition does not explain why the decay is
exponential. The exponential nature of the graph can be explained by a study whichrevealed that "self equilibrated axisymmetric (symmetric about the center of the wound)
shear and normal tractions acting on the end surface of a right circular isotropic elastic
cylinder give rise to stresses that decay exponentially along the length of the cylinder" [10]. The wound on the liver model satisfies all the specified qualities: it has acylindrical geometry, is bound by an elastic, isotropic material, and has tractions
(contractile forces) that are axisymmetric.In Model B, the constant deformation along the wound's length was observed because the
contractile forces are distributed evenly along the wound. However, it may be argued
that the free surface at the end of each defect should lead to different deformations at each end of the wound. Upon analysis, the deformations at the free surface of the wound were found to be the same as the deformations within the model. This was determined by analyzing the deformation gradients on two parallel lines, one at the free surface and onefree surface on deformations are negligible when compared to the deformations caused by the contractile forces.
In general, the deformations on Model B where found to be about three orders of magnitude larger than the deformations on Model A. Also, in both models, the deformations observed in the y- and the z-directions might have been expected to be similar because the system is symmetric about its center. However, the quadrant under analysis
itself is not symmetric; thus the resulting y- and z-directions on it are not similar.
4.2 Error Discussion
A number of approximations were made to simplify the model. For instance, the Young's Modulus (E) for liver was approximated to be 1,000 Pa, which is not correct for all tissues. To understand how the deformations would change with increasing or decreasing values of
E, a relationship that expresses deformation (5) as a function of the Young's modulus (E) is required:
o=EE [11] (1)
where a is the applied stress, and e is the strain.
By definition, = ( - lo)/lo = 5/lo, where lo is the unclosed wound width, and is the deformed wound width. Thus, substituting 5/lo for E in equation (1) yields,
6 = (c x lo)/E (2)
E is inversely proportional to (as E of the material increases, 6 decreases linearly). By dividing the real value of E by the approximated value, a value is obtained that can be multiplied to the mathematical expressions for deformation to correct the error that arises from approximations.
The Poisson's ratio, v, was also approximated. However, v is defined as the ratio of the lateral strain to the axial strain. In both models, the lateral displacement was in the x-direction and was zero, thus the corresponding lateral strain was zero. Thus, for these models, the approximations on v do not impact our corresponding deformations.
There might be errors associated with the magnitude of the forces that are applied on the chosen quadrant by the restrictive presence of the other three quadrants. Although the other quadrants were represented as constraints on the chosen quadrant (Figure 1, (a)), it is unclear whether ADINA assumed that the contractile forces applied on that quadrant was also applied on all the other three quadrants. Thus, the deformations obtained on the chosen quadrant may not be taking into account the deformations on the other quadrants. In future analyses, it may be helpful to solve for deformations using half or a whole model of the system and to compare them with the deformations obtained from this model. If the deformations of the other quadrants were taken into account by the solver in this case, then similar deformations to the ones obtained from this model will be observed in the future models.
One of the final approximations was that the defect in this model was in the shape of a cylinder. Actual wounds usually do not have such symmetric geometry. However, as actual geometries of wounds are unpredictable, it was difficult to come up with an expression that expresses the asymmetry of real wounds as a function of the deformation at the wound edges. However, the FEA tool would still be useful in the analysis of those
systems especially if the investigator can represent the asymmetry geometrically.
4.3 Experimental Applications of obtained data
Currently investigators use collagen-based scaffolds to halt contraction at the wound site. Since most of the studies done on contraction have been qualitative, the fabrications of these scaffolds have been based on qualitative models. With the introduction of quantitative models of what occurs at the wound site, investigators have tools that give them both the nature and the magnitude of the deformations at the wound site. These values should aid in more efficient scaffold fabrication, as the investigator is better able to decide whether to increase or decrease the effect of different characteristics (e.g. cross-link density) of the scaffold, to better accommodate for deformations at the wound edge.
The quantitative values can also help save cost in scaffold fabrication. In wounds where the length can be approximated as semi-infinite (i.e. much longer than their width and height), the deformations do die out at the center. With such wounds, the investigator could design scaffolds that stop contraction at the wound edges but only up to the distance where the deformations die out. This saves the cost and time required to design the larger scaffolds that are needed for wounds in which the deformations are present along the entire wound.
APPENDICES
MODEL A distance 0 4.03226 8.06452 12.09678 16.12904 20.1613 24.19356 28.22582 32.25808 36.29034 40.3226 44.35486 48.38712 52.41938 56.45164 60.4839 64.51616 68.54842 72.58068 76.61294 80.6452 84.67746 88.70972 92.74198 96.77424 100.8065 104.83876 108.87102 1 12.90328 116.93554 120.9678 125.00006 z-deformation -1.83E-03 -1.07E-03 -8.95E-04 -6.63E-04 -5.31 E-04 -4.17E-04 -3.34E-04 -2.68E-04 -2.17E-04 -1.77E-04 -1.45E-04 -1.20E-04 -1.OOE-04 -8.44E-05 -7.16E-05 -6.13E-05 -5.29E-05 -4.61 E-05 -4.05E-05 -3.60E-05 -3.22E-05 -2.91 E-05 -2.65E-05 -2.43E-05 -2.26E-05 -2.11 E-05 -2.00E-05 -1.91 E-05 -1.84E-05 -1.79E-05 -1.77E-05 -1.76E-05 excel model -0.0016 -0.00122 -0.00094 -0.00072 -0.00055 -0.00042 -0.00032 -0.00024 -0.00019 -0.00014 -0.00011 -8.4E-05 -6.4E-05 -4.9E-05 -3.7E-05 -2.9E-05 -2.2E-05 -1.7E-05 -1.3E-05 -9.8E-06 -7.5E-06 -5.7E-06 -4.4E-06 -3.4E-06 -2.6E-06 -2E-06 -1.5E-06 -1.1 E-06 -8.8E-07 -6.7E-07 -5.1 E-07 -3.9E-07 y-deformation -2.36E-03 -1.54E-03 -1.28E-03 -9.81 E-04 -7.86E-04 -6.20E-04 -4.92E-04 -3.90E-04 -3.09E-04 -2.44E-04 -1.93E-04 -1.52E-04 -1.19E-04 -9.31 E-05 -7.25E-05 -5.60E-05 -4.29E-05 -3.25E-05 -2.42E-05 -1.77E-05 -1.25E-05 -8.36E-06 -5.13E-06 -2.59E-06 -6.11 E-07 9.21 E-07 2.09E-06 2.97E-06 3.60E-06 4.03E-06 4.28E-06 4.36E-06 excel model -0.0029 -0.002181 -0.00164 -0.001233 -0.000927 -0.000697 -0.000524 -0.000394 -0.000296 -0.000223 -0.000168 -0.000126 -9.48E-05 -7.13E-05 -5.36E-05 -4.03E-05 -3.03E-05 -2.28E-05 -1.71 E-05 -1.29E-05 -9.69E-06 -7.28E-06 -5.48E-06 -4.12E-06 -3.1 E-06 -2.33E-06 -1.75E-06 -1.32E-06 -9.9E-07 -7.45E-07 -5.6E-07 -4.21 E-07 MODEL B "Along" 0.00 2.50 5.00 7.50 10.00 12.50 15.00 17.50 displacement -1.07362 -1.07362 -1.07362 -1.07362 -1.07362 -1.07362 -1.07362 -1.07362 Z-displacement -7.89E-01 -7.89E-01 -7.89E-01 -7.89E-01 -7.89E-01 -7.89E-01 -7.89E-01 -7.89E-01y
"Across" displacement 0 0 2.20805 -1.46E-01 4.41609 -2.86E-01 6.62414 -4.22E-01 8.832185 -5.56E-01 11.040231 -6.89E-01 13.248277 -8.22E-01 15.456323 -9.52E-01 Z-displacement -1.11867 -1.10912 -1.09428 -1.06846 -1.03517 -9.88E-01 -9.33E-01 -8.64E-0120.00 22.50 25.00 27.50 30.00 32.50 35.00 37.50 40.00 42.50 45.00 47.50 50.00 52.50 55.00 57.50 60.00 62.50 65.00 67.50 70.00 72.50 75.00 77.50 80.00 82.50 85.00 87.50 90.00 92.50 95.00 97.50 100.00 102.50 105.00 107.50 110.00 112.50 115.00 117.50 120.00 122.50 125.00 -1.07362 -1.07362 -1.07362 -1.07362 -1.07362 -1.07362 -1.07362 -1.07362 -1.07362 -1.07362 -1.07362 -1.07362 -1.07362 -1.07362 -1.07362 -1.07362 -1.07362 -1.07362 -1.07362 -1.07362 -1.07362 -1.07362 -1.07362 -1.07362 -1.07362 -1.07362 -1.07362 -1.07362 -1.07362 -1.07362 -1.07362 -1.07362 -1.07362 -1.07362 -1.07362 -1.07362 -1.07362 -1.07362 -1.07362 -1.07362 -1.07362 -1.07362 -1.07362 -7.89E-01 -7.89E-01 -7.89E-01 -7.89E-01 -7.89E-01 -7.89E-01 -7.89E-01 -7.89E-01 -7.89E-01 -7.89E-01 -7.89E-01 -7.89E-01 -7.89E-01 -7.89E-01 -7.89E-01 -7.89E-01 -7.89E-01 -7.89E-01 -7.89E-01 -7.89E-01 -7.89E-01 -7.89E-01 -7.89E-01 -7.89E-01 -7.89E-01 -7.89E-01 -7.89E-01 -7.89E-01 -7.89E-01 -7.89E-01 -7.89E-01 -7.89E-01 -7.89E-01 -7.89E-01 -7.89E-01 -7.89E-01 -7.89E-01 -7.89E-01 -7.89E-01 -7.89E-01 -7.89E-01 -7.89E-01 -7.89E-01 17.664369 19.872415 22.080461 24.288507 26.496553 28.704599 30.912645 33.120691 35.328737 -1.07E+00 -1.18E+00 -1.27E+00 -1.36E+00 -1.45E+00 -1.51 E+00 -1.55E+00 -1.58E+00 -1.60E+00 -7.89E-01 -7.08E-01 -6.17E-01 -5.35E-01 -4.37E-01 -3.28E-01 -2.23E-01 -1.15E-01 O.OOE+00
REFERENCES
[1] Yannas, I.V. Chapters 1 and 2, Tissue and Organ Regeneration in Adults, New York,
Springer, 20(0I1.
[2] Yannas, I.V. Chapter 10, Tissue and Organ Regeneration in Adults, New York,
Springer, 2001.[3] Yannas, I.V. Section 3.4, Page 229, Tissue and Organ Regeneration in Adults, New York, Springer, 2001.
[4] Yannas, I.V. Section 9.3.5, Page 229, Tissue and Organ Regeneration in Adults, New York, Springer, 2001.
[5] Yannas, I.V. Section 9.5.7, Page 229, Tissue and Organ Regeneration in Adults, New York, Springer, 2001.
[6] Troxel, K. Section 5.3 and Appendices, "Delay of Skin Wound Contraction by Porous
Collagen-GAG matrices." Ph.D. Thesis, 1994. Massachusetts Institute of Technology,
Cambridge, MA.[7] "Human Anatomical Models." January, 2005. Educational Scientific Supplies Company. Itp://www.esscoindia.com/site/anatomicalmodels.htlnl. May 6, 2005
[9] Lakes, R. "Foam Structures with Negative Poisson's ratio." Science, 235 1038-1040, 1987. University of Wisconsin. http://silver.neep.wisc.edu/-lakes/sci87.html. May 6, 2005
[9] Freyman, T.M. et al. "Fibroblast Contraction of a Collagen-GAG matrix. Biomaterials. Nov 200; 22(21):2883-91. Department of Materials Science and Engineering,
Massachusetts Institute of Technology, Cambridge 02139, USA.
[10] Lakes, R.S., Engineering Mechanics, University Mechanics, "Saint Venant end effects for materials with negative Poisson's ratios." Adapted from J. Applied Mechanics, 59, 744-746 (1992). -ittp://silveir.neep.wisc.edu/-lakes/PoissonEnd.pdf. May 6, 2005.
[11] Elastic Modulus. Materials by Design, 1996. Department of Material Science and Engineering, Cornell University.