HAL Id: inserm-02971513
https://www.hal.inserm.fr/inserm-02971513
Submitted on 19 Oct 2020
HAL is a multi-disciplinary open access
archive for the deposit and dissemination of
sci-entific research documents, whether they are
pub-lished or not. The documents may come from
teaching and research institutions in France or
abroad, or from public or private research centers.
L’archive ouverte pluridisciplinaire HAL, est
destinée au dépôt et à la diffusion de documents
scientifiques de niveau recherche, publiés ou non,
émanant des établissements d’enseignement et de
recherche français ou étrangers, des laboratoires
publics ou privés.
Discordant evolution of mitochondrial and nuclear yeast
genomes at population level
Matteo de Chiara, Anne Friedrich, Benjamin Barré, Michael Breitenbach,
Joseph Schacherer, Gianni Liti
To cite this version:
Matteo de Chiara, Anne Friedrich, Benjamin Barré, Michael Breitenbach, Joseph Schacherer, et al..
Discordant evolution of mitochondrial and nuclear yeast genomes at population level. BMC Biology,
BioMed Central, 2020, 18 (1), pp.49. �10.1186/s12915-020-00786-4�. �inserm-02971513�
R E S E A R C H A R T I C L E
Open Access
Discordant evolution of mitochondrial and
nuclear yeast genomes at population level
Matteo De Chiara
1, Anne Friedrich
2, Benjamin Barré
1, Michael Breitenbach
3, Joseph Schacherer
2,4*and Gianni Liti
1*Abstract
Background: Mitochondria are essential organelles partially regulated by their own genomes. The mitochondrial genome maintenance and inheritance differ from the nuclear genome, potentially uncoupling their evolutionary trajectories. Here, we analysed mitochondrial sequences obtained from the 1011 Saccharomyces cerevisiae strain collection and identified pronounced differences with their nuclear genome counterparts.
Results: In contrast with pre-whole genome duplication fungal species, S. cerevisiae mitochondrial genomes show higher genetic diversity compared to the nuclear genomes. Strikingly, mitochondrial genomes appear to be highly admixed, resulting in a complex interconnected phylogeny with a weak grouping of isolates, whereas interspecies introgressions are very rare. Complete genome assemblies revealed that structural rearrangements are nearly absent with rare inversions detected. We tracked intron variation in COX1 and COB to infer gain and loss events
throughout the species evolutionary history. Mitochondrial genome copy number is connected with the nuclear genome and linearly scale up with ploidy. We observed rare cases of naturally occurring mitochondrial DNA loss, petite, with a subset of them that do not suffer the expected growth defect in fermentable rich media.
Conclusions: Overall, our results illustrate how differences in the biology of two genomes coexisting in the same cells can lead to discordant evolutionary histories.
Keywords: Yeast, Mitochondrial genome, Genome evolution, Molecular phylogeny Background
Mitochondria are pivotal in eukaryotic cells, providing chemical energy in the form of ATP through oxidative phosphorylation [1], but also fulfilling a multitude of other critical functions including lipid and amino acids metabolism as well as heme and nucleotide synthesis [2]. These fundamental organelles share a common origin in eukaryotes deriving from ancestral α-proteobacterial symbiont [3] and are present in the vast majority of eu-karyotes [4, 5]. Since then, mitochondrial genomes have undergone a drastic size reduction by gene transfer to the nucleus [6, 7], although they evolved in a large
variety of sizes and gene content across species [8, 9]. Despite having their own genomes and translation ma-chinery, mitochondria nevertheless remain strongly in-terconnected with the host cell. Several proteins are encoded at nuclear level, but they are relocalized into the mitochondria once matured. For example, eukaryotic ATP synthase subunits are encoded by both nuclear and mitochondrial genomes. Consequently, the products of nuclear encoded subunits need to be imported into the organelles and assembled in a coordinate manner into functioning structures [10]. The tight interplay between genes coded by nuclear and mitochondrial genomes has thus driven the coevolution of these interacting proteins, and incompatibilities between mitochondrial and nuclear alleles may contribute to reproductive barriers between species [11] or populations [12].
© The Author(s). 2020 Open Access This article is licensed under a Creative Commons Attribution 4.0 International License, which permits use, sharing, adaptation, distribution and reproduction in any medium or format, as long as you give appropriate credit to the original author(s) and the source, provide a link to the Creative Commons licence, and indicate if changes were made. The images or other third party material in this article are included in the article's Creative Commons licence, unless indicated otherwise in a credit line to the material. If material is not included in the article's Creative Commons licence and your intended use is not permitted by statutory regulation or exceeds the permitted use, you will need to obtain permission directly from the copyright holder. To view a copy of this licence, visithttp://creativecommons.org/licenses/by/4.0/. The Creative Commons Public Domain Dedication waiver (http://creativecommons.org/publicdomain/zero/1.0/) applies to the data made available in this article, unless otherwise stated in a credit line to the data.
* Correspondence:schacherer@unistra.fr;gianni.liti@unice.fr
2Université de Strasbourg, CNRS, GMGM UMR 7156, F-67000 Strasbourg,
France
1Université Côte d’Azur, CNRS, INSERM, IRCAN, Nice, France
The mitochondrial DNA (mtDNA) has been widely used to infer phylogenetic relationships [13–16]. How-ever, mtDNA phylogenies can vary from those generated from nuclear genome [17]. Mitochondrial genome is usually found in high copy number with multiple copies in each organelle [18]. Mutation rate of mtDNA often differs from the one of the nuclear DNA, and it can be significantly lower (plants and fungi) or higher (animals) [19]. In addition, mtDNA does not follow a Mendelian inheritance, since its replication and partition are not directly linked to the cell cycle and transmission is typic-ally uniparental (maternal, in the vast majority of higher eukaryotes), eliminating the potential for sexual recom-bination. Cases of paternal or biparental inheritance have nevertheless been reported in some species [20,
21], although mtDNA heterogeneity does not persist. For instance, as in Mytilidae mussel species, where pa-ternal mitochondria are only transmitted to the gonads of male offspring [22] and in ascomycetes yeasts where mitochondrial heteroplasmy, while being generated at the mating, is rapidly lost within the first few mitotic cy-cles [23].
Deleterious mutations that impair mitochondrial func-tions often cause severe and untreatable diseases [24]. Given the difficulty to engineer mtDNA in human cell lines, model genetic systems have paved the way for functional characterization. In particular, the budding yeast Saccharomyces cerevisiae has been widely used to study the phenotypic effect of mtDNA mutations [25– 27]. S. cerevisiae mtDNA is unusually large, 85 kb; made of mostly non-coding A+T-rich sequence; and organized as either circular monomer or head-to-tail tandem-repeated linear structures [23]. The S. cerevisiae mtDNA contains eight genes encoding for three subunits of the ATP synthase complex (ATP6, ATP8, ATP9/OLI1), the apocytochrome b (COB), three subunits of the cyto-chrome c oxidase complex (COX1–3) and a ribosomal protein (VAR1/RPS3). COB and COX1 contain a variable presence/absence pattern of introns, also present in other Saccharomyces species [28]. COX1 introns are highly variable, reflecting mobility, while COB introns are mostly fixed, with edges of mobile introns that repre-sent mutational hotspots [29]. In addition to the eight canonical protein-coding genes, the S. cerevisiae mito-chondrial genome contains additional functional ele-ments that include two ribosomal RNAs (rnl and rns), 24 tRNA and several replication-like origin [30]. The rnl 21S mitochondrial ribosomal subunit carries an intron, named OMEGA, which encode for a homing endonucle-ase (F-SceIV). Additional non-canonical ORFs are RF1, RF2 and RF3. RF1 and RF3 encode for other two homing endonucleases (F-SceIII and F-SceI, respectively) and, to-gether with F-SceIV, influence the mitochondrial gen-ome stability by increasing the recombination rate [31,
32]. Additional invasive elements are the GC clusters within canonical and non-canonical genes. In particular, F-SceI, RF2, F-SceIII and VAR1 are known to contain GC clusters. These clusters, at least in VAR1, can act as byp-like elements causing jumps in protein translation, yet maintaining the protein production [33]. In contrast, GC clusters in the endonuclease genes often cause frame shifts that inactivate the protein. GC clusters have also been shown to promote recombination within the GC-rich palindromes [34]. Recombination can occur be-tween yeast mitochondria during the transient hetero-plasmic phase following the mating. However, the two parental organelles are kept physically separated and can only be in contact and recombine on a limited inter-action surface [35]. Nevertheless, recombination is con-sidered to be a critical mechanism for mitochondrial inheritance [36] with profound effect on patterns of mitochondrial genetic variation [21,37,38].
The S288C laboratory genetic background contains approximately 20 copies of mitochondrial genomes, and 5% of non-essential genes are required for mtDNA maintenance [39]. Cells with mutated or without mito-chondrial genomes are referred to as ‘petite’ given their slow growth phenotype in complete media and are un-able to grow on non-fermentun-able carbon sources. Al-though S. cerevisiae is a leading model for molecular and genomics studies [40–42], most studies have focused on a small number of laboratory derivative isolates, whose genetic and phenotypic features have been shaped by la-boratory manipulations [43]. Indeed, high mitochondrial genome instability, which promote petite formation, is a hallmark of S. cerevisiae laboratory strains [44].
The release of mitochondrial genomes of several iso-lates [45, 46] offered an opportunity for mitochondrial population surveys [28]. We recently released high coverage genome sequence for a panel of 1011 natural strains, isolated from both anthropic and wild niches [47]. The nuclear genome phylogeny revealed a strong population stratification with 26 separated lineages and three groups of outbred mosaic strains. These lineages were further partitioned in domesticated and wild line-ages based on the ecological origin of the isolates. Nu-clear genome diversity is different between these two classes of isolates, with wild lineages having a higher number of SNPs, while domesticated showing higher genome content variation. Here, we examined mito-chondrial genome variation across the 1011 S. cerevisiae collection to trace the events that shaped their evolution and compare them with evolutionary patterns observed in the nuclear genomes. We detected strong admixture of the mtDNA, which cannot be fully captured by phylo-genetic trees. The mitochondrial genomes have higher genetic variation compared to their nuclear genome counterparts with weak concordance between the two
phylogenetic topologies. We observed high variation in mtDNA copy number and identified several natural pe-tite isolates, with some that surprisingly do not show the expected growth rate defects in rich media.
Results and discussion
Mitochondrial genetic diversity across S. cerevisiae population
We explored 1011 S. cerevisiae sequenced isolates [47] to investigate the intraspecific mitochondrial genome di-versity and evolution. Since mitochondrial genomes in-clude variable long AT-rich intergenic regions that are difficult to compare, we first focused on the eight mito-chondrial coding DNA sequences (CDSs). From 698 de novo genome assemblies, we collected the eight complete CDSs. Out of these, 553 isolates also had a complete or nearly complete mitochondrial sequence. A subset of 353 genome sequences did not have any am-biguous base across the CDSs (Additional file 1: Figure S1, Additional file2: Table S1). We estimated the global genetic diversity by the average pairwise divergence π. Overall, we observed lower diversity in the coding nu-clear (π ~ 0.003) [47] compared to the mitochondrial se-quences (π ~ 0.0085, Additional file2: Table S2), which contrasts to what was previously observed for other yeast species (Additional file1: Figure S2). This opposing trend, more similar to the pattern observed in animal ra-ther than in fungi [19,48], is consistent with S. cerevisiae experienced rapid evolution of mitochondrial genes after the whole genome duplication [49].
We observed sharp genetic divergence differences of the nuclear and mitochondrial genomes among wild and domesticated isolates. In wild clades, despite higher nu-clear divergence (up to 1.1% at CDS level), the mito-chondrial CDS genetic distance reaches its maximum of ~ 0.6% at ~ 0.4% of nuclear divergence and plateau after-wards. In contrast, mitochondrial sequence divergence between domesticated clades have a larger increase, reaching its maximum at lower nuclear divergences (Additional file1: Figure S3). This difference in variation
is observed across all the mitochondrial CDSs whose values of π are systematically higher in domesticated compared to wild isolates.
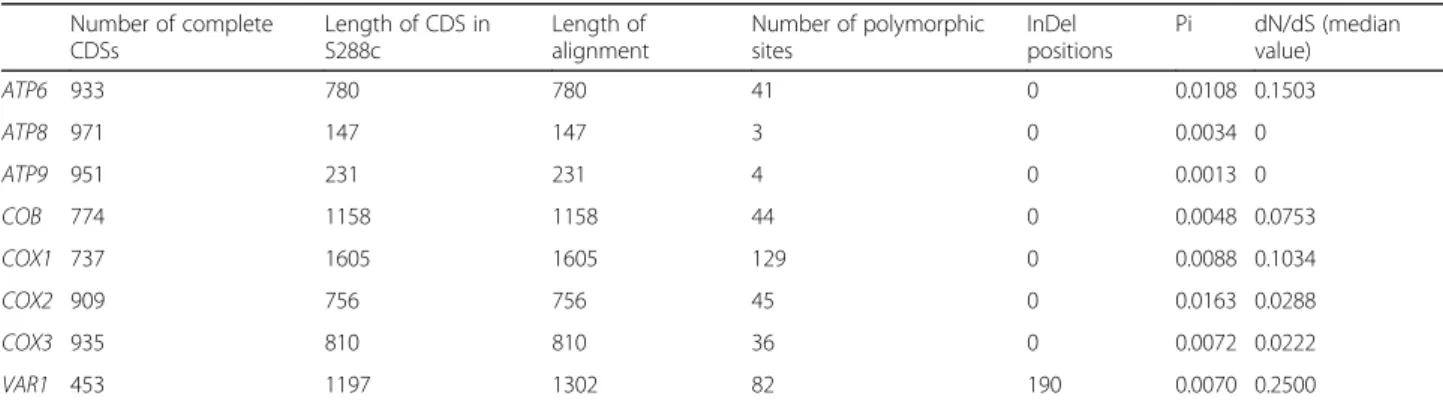
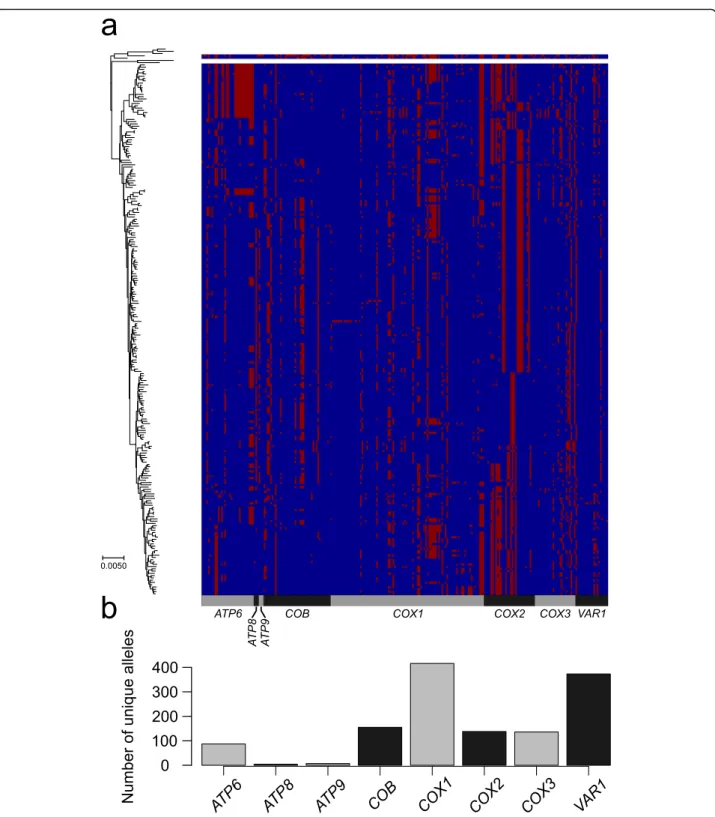
The shortest CDSs, ATP8 and ATP9, have the lowest proportion of polymorphic sites (~ 2%) and lowest values ofπ (0.003 or less) and lack non-synonymous mutations. In contrast, COX1 and COX2 are highly polymorphic. Although COX1 has the highest polymorphic sites (8%), COX2 has the highest π value (0.0163, Table 1). We used the discriminant analyses of principal component (DAPC) [50] to evaluate the contribution of specific genes to classify mitochondrial ‘haplotypes’ and popula-tion clustering. We quantified that ATP6 and COX2 re-spectively account for 38% and 28% of population clustering. This observation supports the widespread usage of COX2 in mitochondrial phylogeny (Fig.1a) [37,
38,51,52].
Next, we generated a non-redundant allele database. We observed a variable number of distinct CDSs alleles (Fig. 1b), resulting in high proportion of unique allelic profiles (234 out of 353 isolates, Additional file1: Figure S1). We used these non-redundant allelic profiles as a proxy to investigate the mitochondrial genome distribu-tion in the populadistribu-tion. Globally, we observed a poor overlap between the mitochondrial and nuclear genome phylogenetic lineages [47] with few exceptions that in-clude near-to-clonal nuclear genome lineages, having specific mitochondrial profiles. These exceptions include a Sake subclade, the two clinical Wine/European sub-clades (Y′ amplification and S. boulardii), the North American and the reproductively isolated Malaysian clades [53]. In contrast, the mixed origin clade [47], which has highly diverse ecological (e.g. bakeries, beer, plants, animal, water, clinical sample) and geographical origins (e.g. Europe, Asia, Middle East, America), shows low mitochondrial intra-clade difference despite substantial nuclear genome variation (Additional file 1: Figure S4). Indeed, across the mixed origin clade, only very similar profiles of mitochondrial genes segregate, with variants limited to COX1 and VAR1, resulting in
Table 1 Genetic diversity of mitochondrial CDSs
Number of complete CDSs Length of CDS in S288c Length of alignment Number of polymorphic sites InDel positions Pi dN/dS (median value) ATP6 933 780 780 41 0 0.0108 0.1503 ATP8 971 147 147 3 0 0.0034 0 ATP9 951 231 231 4 0 0.0013 0 COB 774 1158 1158 44 0 0.0048 0.0753 COX1 737 1605 1605 129 0 0.0088 0.1034 COX2 909 756 756 45 0 0.0163 0.0288 COX3 935 810 810 36 0 0.0072 0.0222 VAR1 453 1197 1302 82 190 0.0070 0.2500
very low π (0.00008) compared to other clades (~ 0.001, Additional file2: Table S2).
The VAR1 gene is a particularly variable, highly AT rich and prone to non-synonymous mutations and
indels. These indels mostly represent GC-rich byp-like elements able to cause jumps in protein translation in other yeast species [33]. Two positions were described, one named‘common’ and another downstream with GC
Fig. 1 Allele distribution across mitochondrial CDSs. a Distribution of major (blue) and minor (red) alleles for the 259 polymorphic positions in the 234 S. cerevisiae unique complete profiles (which include 353 isolates). Profiles are ordered according to their phylogenetic relationship using the phylogenetic neighbour-joining tree (left side). b The numbers of unique alleles for each mitochondrial CDS show a dramatic difference between genes
cluster in inverted orientation [54]. We identified 35 al-lelic variants of VAR1 gene harbouring these two clus-ters in 117 isolates, mainly belonging to the mosaic groups (N = 52) (Additional file2: Table S1). While most of the reported cases harboured the GC cluster either in the common (N = 91, accounting for 18 different VAR1 alleles), or in both positions (N = 6, across 4 VAR1 al-leles) [54], a large fraction of the observed allelic variants here only harboured the GC cluster in the second site (N = 19, across 13 VAR1 alleles). We also discovered two novel variants, one with GC cluster at the common pos-ition but in inverted orientation (2 isolates) and the sec-ond with the GC cluster in tandem duplication at the second position (3 isolates).
In addition to the canonical ORFs, we characterized the four non-canonical ORFs F-SceIV (OMEGA intron), F-SceI (RF3), RF2 and F-SceIII (RF1) [31, 32]. F-SceIV is relatively uncommon in the population (198 isolates), while F-SceI, RF2 and F-SceIII are more spread (447, 542 and 477 isolates, respectively). These three ORFs are known to contain GC clusters, which often intro-duce frame shifts in the sequences. In F-SceIII, we identified three GC clusters positions. The first pos-ition is particularly rare (43 isolates), and in two cases, the GC cluster is truncated. The other two GC clus-ters are much more abundant (in 277 and 206 isolates, re-spectively). We identified 6 distinct GC cluster positions in both RF2 and F-SceI (see Additional file 2: Table S1). Altogether, these results uncovered high variability of mitochondrial sequence across the S. cerevisiae natural population.
Extensive admixture of mitochondrial genomes
We investigated the mitochondrial genome population structure using the eight concatenated CDS to calculate the phylogenetic network using SPLITSTREE [55]. The dataset comprises 239 non-redundant CDS profiles, with 234 S. cerevisiae isolates with complete CDS sequences and five S. paradoxus representatives [56] as outgroups. The resulting intertwined network shows a strong inter-connectivity of the sequences, underlying frequent his-torical recombination (Fig. 2a). In contrast, classical phylogenetic trees are unable to consistently group the isolates (Fig.2b). Using ADMIXTURE [57], we observed that the opposite edges of the trees fall in the same population for low K values (K = 2–3), further under-lying a poor grouping.
Mitochondrial population structure appears to poorly reflect the clustering obtained from the nuclear genome. For example, the early divergent Taiwanese lineage based on nuclear genome does not show higher sequence distance. However, isolates belonging to the mosaic groups of the S. cerevisiae population show the highest degrees of admixture, indicating that
outbreeding has impacted both mitochondrial and nu-clear genomes.
We then calculated the coefficient of concordance‘W’ using the congruence among distance matrix (CADM) metric [58] to be 0.79, with 0 indicating complete dis-agreement and 1 complete dis-agreement between distance matrixes. This value indicates a relatively good concord-ance between the phylogenic networks of mitochondrial and nuclear genomes. This is likely driven by isolates with very close mitochondrial sequence often also having similar nuclear genome sequence, while the main branches of the mitochondrial tree are discordant. We further compared phylogenetic trees and networks based on concatenated sequences derived from the 8 mito-chondrial CDSs and 8 nuclear genes previously used for phylogenetic studies [59, 60] in a selection of 14 isolates (Additional file 1: Figure S5). Consistently, mitochon-drial sequences resulted in a wider network, implying a less defined phylogenetic structure and more pro-nounced admixture, with early branching lineages falling within the worldwide non-Chinese lineages. Overall, our results highlight a pronounced separation in evolution-ary histories of the two coexisting genomes, and the ex-tensive mitochondrial genome admixture provides additional support to its mitochondrial inheritance re-quiring recombination-driven replication [34,61,62].
Interspecies introgressions of mtDNA are rare
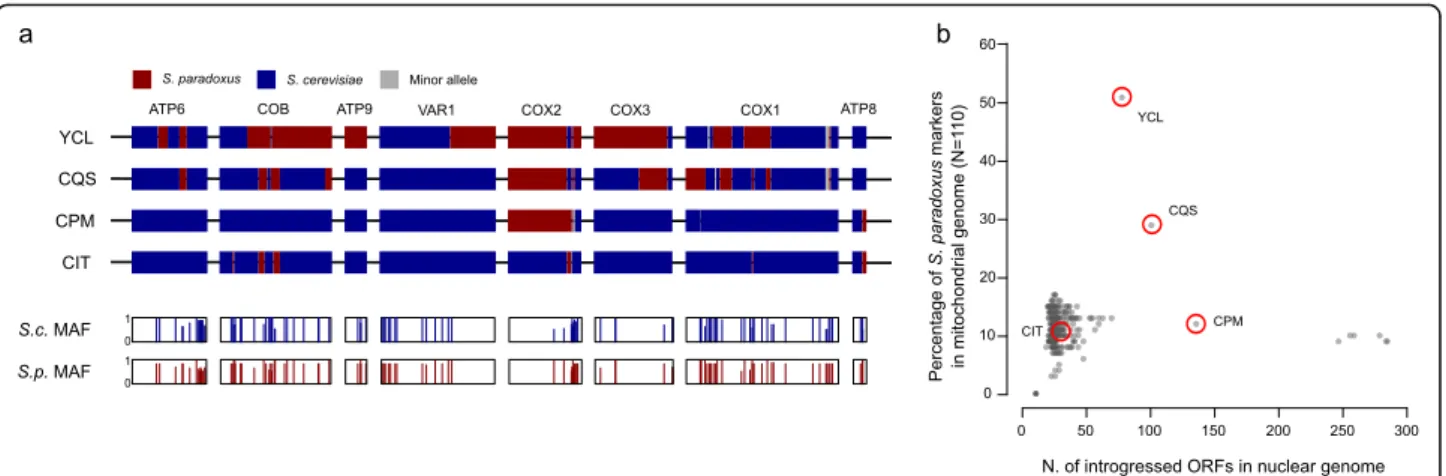
We recently described four clades (namely Alpechin, Mexican Agave, French Guiana and Brazilian bioetha-nol) with abundant S. paradoxus interspecies introgres-sions in the nuclear genome [47]. We analysed the mitochondrial CDSs to search for introgressed alleles. The four clades with abundant nuclear genome intro-gressions did not show any S. paradoxus mitochondrial alleles. Nevertheless, two isolates from America (CQS, YCL) and one from Africa (ADE), all genetically related to the French Guiana and the Mexican Agave clades, harbour two distinct patterns of S. paradoxus mitochon-drial introgressions. We retrieved the complete CDS set for two of them (CQS and YCL), while the third (ADE) is incomplete but very close to YCL. The mitochondria introgression in YCL (YJM1399) strain was already re-ported, but no further analyses were presented [28]. We generated a set of polymorphic markers (methods), to accurately identify the introgression boundaries. The S. cerevisiae major alleles were identified from the 1011 isolates, whereas for S. paradoxus, they were derived from 23 North American isolates for which full chromo-some sequence were available [21,56]. Eurasian S. para-doxus isolates were not included because of their similarity with S. cerevisiae sequences, likely due to an ancient introgression event from S. cerevisiae to S. para-doxus [21, 56, 63]. We generated a catalogue of 110
polymorphic positions and derived different alleles be-tween the two species. Several genes in these two iso-lates were catalogued either as partially or fully introgressed (Fig.3a). Since the frequency of some alleles is close to 50% and often the less common allele of one species is the more common allele of the second one,
there is a chance of calling false-positive introgressions. Nevertheless, long consecutive series of S. paradoxus marker in the COB, ATP9, COX1, COX2 and COX3 genes in YCL, as well as those in the COB, COX1, COX2 and COX3 genes in CQS, are likely to be genuine. The absence of traces of introgression in S. cerevisiae isolates
Fig. 2 Complex mitochondrial genome phylogeny. Only S. cerevisiae isolates with complete CDS data have been used (N = 353) in addition to five S. paradoxus isolates used as an outgroup. a Phylogenetic network of non-redundant concatenated CDS sequences (N = 237 profiles) produced a highly intertwined network driven by recombination with few groups of closely related strains. b The rooted tree (left) shows a weak topology with few nodes (red) with bootstrap values over 75. ADMIXTURE analysis of genomic components (right) with K ranging from 2 to 15 confirms the high degree of mosaicism. The highly divergent Taiwanese lineage (green dot) is not divergent to the other lineages in contrast to the nuclear genome phylogeny
from Europe could be explained by the higher sequence similarity with European S. paradoxus, which prevent the detection. However, introgressions between S. cerevi-siae and European S. paradoxus isolates could also be prevented by the non-collinearity in the structure of their mitochondrial genomes that likely impair the re-combination [56].
We further extend the analysis of the 110 polymorphic sites to 353 isolates with fully assembled CDS. We ob-served additional potential cases of mitochondrial intro-gressions. The isolate YCL mitochondrial sequence harbours over 50% of S. paradoxus markers, possibly in-dicating a recombinant genome derived from a recent transfer event. In addition, a small number of S. para-doxus markers are found in each S. cerevisiae isolate, perhaps due to incomplete lineage sorting. Overall, the number of S. paradoxus markers in the mitochondrial genomes does not correlate with the number of intro-gressed ORFs in the nuclear genomes (Fig.3b), suggest-ing that the interspecies gene flows were independent due to distinct origin and/or fate.
Introns gain and loss during evolution and dispersal
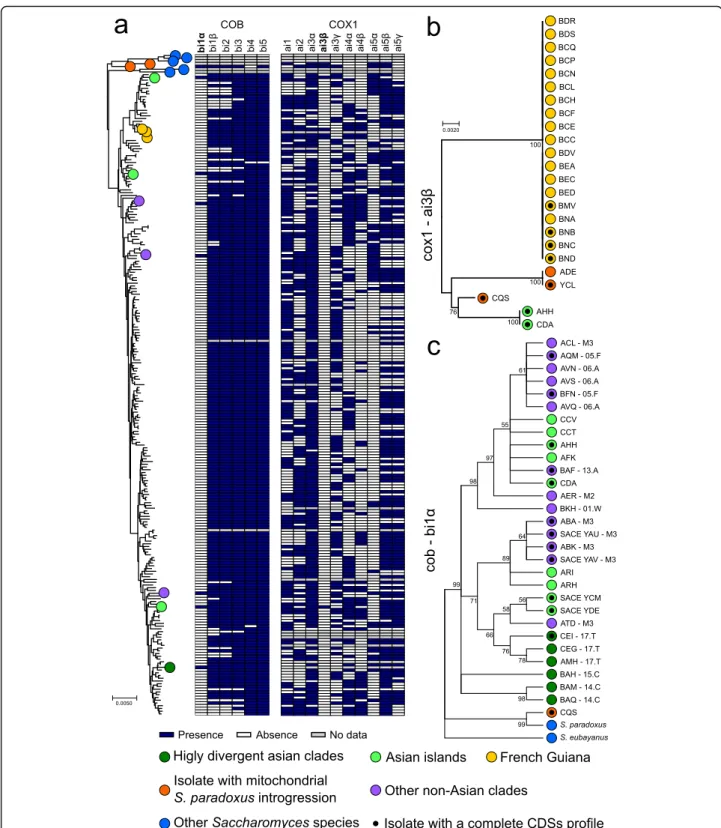
Two mitochondrial protein coding genes, COB and COX1, harbour introns at multiple sites, and we ex-plored their presence-absence patterns in the whole 1011 isolate collection. COX1 introns are found at vary-ing frequencies (median 0.48) with highly variable presence-absence profiles (Fig. 4a). Intron patterns fur-ther support low variability within North American, Malaysian and mixed origin lineages (Additional file 1: Figure S6). In contrast, the groups of loosely related mo-saics (M1, M2 and M3 clusters) show the lowest level of intron conservation, consistent with their admixed gen-etic backgrounds.
The COX1 intron frequencies in the population are consistent with previous report [28], ranging from 26 to 86%. We identified a total of 103 different COX1 intron combinations with two introns, ai4β and ai5α, that are never found together (ai4β is in 89 while ai5α in 85, out of 408 alleles). Given the linkage between these closely spaced intronic positions, they either raised in two an-cestral populations or are unlikely to be brought to-gether by recombination or the double presence is functionally incompatible. Two additional COX1 introns, ai3β and ai4γ, are very rare in S. cerevisiae population. While aI4γ is also absent in most related Saccharomyces species, ai3β intron is present in all of them. The only occurrence of ai3β previously reported in S. cerevisiae was in the YCL isolate, which also contains S. paradoxus introgression around the intron position in COX1. How-ever, although the ai3β intron is present in S. paradoxus, the ai3β intron sequence of YCL is closer to the one found in Lachancea meyersii [28]. In addition to the YCL allele, we found other three variants of ai3β, all re-lated to the Lachancea sequence. Two variants are present in YCL and ADE isolates with abundant S. para-doxus introgressions, while the CQS strain has related version. Additional ai3β intron is present in two Asian isolates and in 19 French Guiana isolates, whose clade is highly introgressed from S. paradoxus (Fig. 4b). The presence of the ai3β intron among these highly intro-gressed lineages suggests separate lateral transfer events from Lachancea, although it cannot be ruled out that these introns where initially transferred from Lachancea, or a related genus, to S. paradoxus before the introgres-sion occurred.
In contrast, the six COB introns are more uniformly present (frequencies ranging from 88 to 99%, Fig. 4a) with the only exception of the recently described bi1α
Fig. 3 Rare S. paradoxus introgressions. a Polymorphic markers between S. cerevisiae and S. paradoxus across the mitochondrial CDSs were used to identify introgression events. Introgression boundaries are set as the midpoint between markers. The two bottom rows indicate the frequency in the population of the major or consensus allele (AF), in the specific position and species. b Number of introgressed ORFs in the nuclear genome does not correlate with the percentage of genetic markers of S. paradoxus in mitochondrial CDS. Only isolates with complete unambiguous CDS data were included (N = 353). Position of isolate reported in a is circled in red
Fig. 4 Intron phylogeny underlies both loss and gain events. a The distribution of intron presence and absence is not consistent with the mitochondrial tree phylogeny. The rare introns bi1α and ai3β are highlighted (bold); intron ai4γ was not found in the sequenced collection and not shown. b Only 4 non-redundant sequences have been found for cox1 ai3β intron. Their sequences are unrelated to other Saccharomyces species, which could not be used for rooting. The peculiarity of the distribution of this intron could suggest a lineage-specific gain event. c Rooted tree of the COB intron bi1α using S. paradoxus and S. eubayanus sequences as an outgroup. Nodes with bootstrap values below 0.5 have been collapsed. Its presence in multiple highly divergent Asian lineages and in other Saccharomyces species is consistent with intron loss following the out-of-China dispersal. The isolate CQS, which harbours introgression in both nuclear and mitochondrial genome, also derive from S. paradoxus origin. This is compatible with the downstream exonic sequence, which also is introgressed
[28] occurring at low frequency (~ 5%). Surprisingly, bi1α is common among the early-branching Asian clades [47]. Other isolates harbour it, mainly mosaic isolates, but segregate at low frequency in non-Asian clades. Its presence in several Saccharomyces outgroup species and in the S. cerevisiae early divergent lineages suggests a loss preceding or during the out-of-Asia dispersal. The intron could have been introduced again, from second-ary contacts with bi1α-positive Asian lines. To test these hypotheses, we constructed a phylogenetic tree using all the bI1α intron sequences and outgroups (Fig. 4c). The bi1α phylogenetic tree shows more variants of Asian se-quences compared to non-Asian ones, which mainly cluster in two groups stemming from separated branches of Asian introns, consistent with multiple separate re-gain events in the worldwide population.
Self-splicing introns have been associated to increased mutation frequencies at the boundary intron/exon [29]. We scanned the exonic sequences in a window of 70 nu-cleotides both upstream and downstream each intron in COX1 and COB. Consistently, the highly mobile COX1 introns are associated with higher frequency of alterna-tive alleles in a 20-nucleotide window adjacent to inser-tion boundaries (Addiinser-tional file1: Figure S7).
Structural rearrangements are rare in mitochondrial genomes
Next, we investigate the size and the presence of structural variation across the mitochondrial genomes. Considering the 250 circularized assemblies, the mitochondrial genome sizes range from 73,450 to 95,658 bp (Additional file 2:
Table S3). As the gene content is entirely conserved be-tween these isolates, this high size plasticity is driven by variability of the intergenic region (ranging from 45,254 to 69,807 bp) and the intron content (ranging from 7748 to 20,024 bp in size) (Additional file1: Figure S8). Both factors are highly correlated to the total mitochondrial genome length (r2 0.769 and 0.756, respectively; correlation-associated p values < 2.0E−04) (Additional file1: Figure S9). Mitochondrial genome size is variable among isolates of the same lineage.
Synteny analysis across the 553 isolates with ome on single scaffold highlights four distinct gen-omic inversions (Fig. 5, Additional file 1: Figure S10). Two strains from the Wine/European and Ale beer lineages, BKI and AQT, share an inversion of the re-gion that ranges from trnW to the COX2 gene, while three closely related Wine/European strains (AIM, BNG and CFB) share a larger inversion that also en-compasses the 15S rRNA gene (Fig. 5b, c). Inversions were also found in BDN (African beer) and CDN (Ecuadorean) and are related to regions ranging from the 15S rRNA or COX1 genes, respectively, to the ATP6 gene (Fig. 5d, e). All inversion boundaries map to highly repetitive AT-rich intergenic regions, which prevent their precise delimitation. Interestingly, all these inversions lead to the loss of a feature shared by most ascomycetous yeast, namely that all mito-chondrial protein-coding genes are transcribed from the same DNA strand [64]. However, mitochondrial functions seem not to be impaired, as these isolates maintain their respiration capabilities.
Fig. 5 Structural variants in the mitochondrial genomes. Schematic of the mitochondrial genome organization annotated for protein-coding genes and rRNA and tRNA genes. The approximate breakpoint locations of the inversions are indicated by dotted lines. These mitochondrial genome organizations are related to different isolates. a S288C (shared by the vast majority of isolates). b AQI and BKI. c AIM, BNG and CFB. d CDN. e BDN
Recent report suggested that the alteration of the gene order within yeast genera could be related to the mito-chondrial genome size [65]. While the Lachancea and Yarrowia clades, with mitochondrial genome less than 50 kb, show high synteny across species [66,67], the Sac-charomyces clade (mitochondrial genome size > 65 kb) is more prone to rearrangements [65]. Indeed structural rearrangements were also detected in the mitochondrial genome of S. paradoxus [56]. Our results suggest that mtDNA structural variation can be tolerated, perhaps re-stricted to balanced events that do not alter the CDS copy number.
Variation in mtDNA copy number reveal natural petite isolates
Mitochondrial copy number can dramatically affect phe-notypes but is hard to measure with high-throughput methods. We estimated mtDNA copy number using the relative coverage of ATP6, COX2 and COX3, which provide robust mapping. The number of mitochondrial genomes is generally constant across clades (Additional file1: Figure S11), with no significant differ-ences between domesticated and wild lineages, with a median of 18 mitochondrial genomes for each haploid nuclear genome. The variation is however particularly high across the population, reaching over 80 copies. As previously reported [68], the mtDNA copy number scales up with ploidy in a linear way, with diploid strains having around double number of mitochondrial ge-nomes and triploid having three times the number, com-pared to haploid cells (Fig.6a).
The presence of mitochondrial genomes is assumed to be the natural state of S. cerevisiae cells, which is defined as rho+. However, strains can lose mitochondrial func-tionality under different conditions either by accumulat-ing mutations (rho−) or by complete loss (rho0) of the mitochondrial genome. These mutants are defined as ‘cytoplasmic petite’ (i.e. ‘small’) because they form small colonies in rich fermentable media due to their slow growth. Since the respiration-mediated ATP production is impaired in petite strains, they are unable to grow in non-fermentable carbon sources. We identified 15 po-tential natural petites isolates (Additional file 2: Tables S1 and S4) from coverage analysis and confirmed that they were unable to grow on non-fermentable carbon sources based media (Fig. 6b). All petite isolates appear to be rho0, with the exception of two rho−isolates: ABM which retained COB gene and AHV which kept ATP9 and VAR1 genes (Additional file 2: Table S4). These rho− isolates, with other five rho0 petite, were laboratory-derived haploid (HO deleted), and since strain manipulation could have caused their mitochondrial condition, they were excluded from further analyses. We examined a selection of four strains for mitochondrial
activity (measured as membrane potential) and volume. We included as controls a wild-type rho+strain and two derived rho0 variants with one wearing an additional mutation (ATP2 G1099T), which partially restore growth in rich media (Michael Breitenbach, unpublished data). As expected, activity data show inability to grow on non-fermentable carbon sources (YPEG). There was, however, no significant variation between mitochondrial volume of wild-type and petites isolates, consistent with the essentiality of maintaining mitochondria also in pe-tite strains (Fig. 6c, Additional file 2: Table S4). We in-vestigated if these natural petites have doubling time defect by measuring growth curves in rich media (YPD). The petite strains showed different growth rates, with two of them having close to normal doubling time (Fig. 6d, e; Additional file2: Table S4). These strains do not have neither ATP2 G1099T nor ATP3 G348T poly-morphism that partially restore growth in rich media (Michael Breitenbach, unpublished data); hence, other compensatory mutations might have partially restored growth in these strains. We cannot rule out that the pe-tite phenotype might have raised during laboratory ma-nipulations; however, restoring near-to-normal growth in some of these isolates has likely required extensive propagation with large population sizes suggesting a more distant mtDNA loss event. Sporulation is known to be impaired in petite isolates [69], and consistently, all natural petite isolates do not sporulate.
Conclusions
The S. cerevisiae yeast has long been considered as an or-ganism with an almost clonal reproduction and strictly uniparental mitochondrial inheritance [34]. Nevertheless, the scenario emerging from our phylogenetic analyses re-vealed that outbreeding and recombination drive mito-chondrial genome evolution. Quantitative variation between mitochondrial and nuclear genomes in admix-ture, population structures and sequence diversity under-lies how differences in biology and selection of two genomes coexisting in the same cells can lead to highly discordant evolutionary trajectories. Furthermore, mito-chondrial genomes are more refractory to interspecies in-trogressions, with only rare examples in the population. However, these rare events further support the contribu-tion from both parental strains to the mitochondrial se-quence, implying transient coexistence of unknown timespan. This situation can lead to incomplete lineage sorting, as suggested by the allele frequency distribution in S. cerevisiae and S. paradoxus mitochondrial genomes.
We observed a broad distribution of mitochondrial genome copy number across the population, of similar magnitude of variation generated in the knockout collec-tion [39], which broadly scales up linearly with nuclear genome ploidy. The occurrence of natural petite strains,
remarkably able to grow in fermentation media without detectable defects, demonstrates how variation in the nuclear genome can compensate the complete loss of mitochondrial genomes. Overall, these observations fur-ther reinforce the strong functional interplay between the two coexisting genomes despite their discordant evo-lutive trajectories. Future efforts will reveal the molecu-lar details of such two-genome interactions and quantify
their contribution toward the species phenotypic variation.
Methods
Mitochondrial genome assembly
We investigated a total of 1011 S. cerevisiae isolates from the 1002 Yeast Genome Project [47]. Among these, 84 isolates already had their complete mitochondrial
Fig. 6 Natural variation in mitochondrial genome copy number. a Mitochondrial genome copy number linearly increase with the nuclear genome content. Fifteen natural petite isolates were detected. The number of isolates is indicated above the corresponding plot. b Spotting assay on non-fermentable carbon source (YPEG) confirms natural petite isolates (a subset of tested isolates is shown). c Mitochondrial activity (as membrane potential) is strongly altered by the lack of mitochondrial genome (black versus grey symbols), while the volume remains unaltered. d Growth curve variation of isogenic strains with normal mitochondria (rho+, red), petite (rho0, green) and petite harbouring the ATP2G1099T suppressing mutation (rho0ATP2 sup, blue). Among natural petites, we can identify both isolates with high doubling time (DT, black solid line) and isolates with recovered growth rate, comparable to petite with suppressor mutations (black dashed line). e Generation times for isolates with different mitochondrial CN show at least two natural petite isolates that seem to have recovered normal growth rate on rich media. Growth curves for the circled isolates are shown in d
sequence available [46]. For all other isolates, we identi-fied mitochondrial scaffolds from whole genome assem-blies through similarity searches with the BLAST suite of programmes [70], using the S288C mitochondrial se-quence (EMBL: KP263414) as a query. In total, 905 mitochondrial assemblies could be retrieved, consisting of 1 to 27 scaffolds (Additional file2: Table S5). Among them, 468 mitochondrial assemblies consist of a single scaffold longer than 70 kb and 166 could be circularized by Circlator [71] bringing the total number of circular-ized assemblies to 250. The final assemblies were linear-ized so that their start corresponds to the starting position of the S288C reference genome (Additional file2: Table S3). As results, 698 assemblies had the full set of CDSs available, 353 of which without any ambiguous position and were hence used for the phylogenetic inferences.
Genes and coding sequences
The sequences of the eight protein-coding genes (ATP6, ATP8, ATP9, COB, COX1, COX2, COX3 and VAR1) were retrieved from the 1011 assemblies by performing BLAST similarity searches. The boundaries of the coding regions of COX1 and COB genes were identified through pairwise global alignments between the gene sequences and the reference CDS, constructed with stretcher [72], and manually refined. The average pairwise diversity π was calculated with Variscan [73] while sequence diver-gence was calculated as the percentage of SNPs. Pres-ences of omega intron and RF1, RF2 and RF3 endonuclease were identified by blast search using a cut-off of 90% of identity on 90% of the sequences. Query sequence were the following: omega intron SGD: S000007279, RF1 accession number KP263414.1 (posi-tions 74495 to 75984), RF2 accession number X06706.1 (positions 52 to 1535) and RF3 accession number CP006487.1 (position 28758 to 30259).
S. paradoxus marker identification
Polymorphic positions were extracted by aligning the isolate CDSs to the S288C ones running MUMmer v3.0 [74] both for the S. cerevisiae collection and a set of 23 North American S. paradoxus strains [21,56]. The three American and Hawaiian S. paradoxus isolates were used while the European and Far East Asian isolates were re-moved due to their similarity to the S. cerevisiae mito-chondrial sequence. SNPs were extracted with the command show-snps and the options –CrIT. For both species, each polymorphic position was evaluated to ob-tain the major allele for both species. All positions where the major alleles differed were retained to generate a marker list of 110 positions scattered across the genome. It is important to notice that, probably due to incom-plete lineage sorting, in most of the cases, the less
common allele of one of the two species corresponds to the more common allele of the other one, which intro-duces a certain amount of noise among the selected markers.
Population structure
A non-redundant database of profiles of mitochondrial CDSs was built for the isolates with complete CDS se-quences. Variant Call Format (VCF) file was created run-ning snp-sites v2.3.3 [75] (snp-sites -v–o mitochondria.vcf ConcatenatedCDS.fasta) on the concatenation of the CDS genes multiple alignment. Plink v1.90 [76] (plink --vcf mitoCDS_conc.vcf --make-bed–out plink.out) was used to prepare the data to run ADMIXTURE v1.3.0 [57] software (admixture plink.out.bed K, with K from 2 to 15) .
The concatenations of CDS were also used to run SplitsTree v4.16.6 [55] and produce the phylogenetic network while the bootstrap of the NJ phylogenetic tree was produced by MEGA v7.0.26 [77].
Identification of rearrangements
The gene coordinates were determined on the one-scaffold assemblies by running tRNAscan for tRNA and BlastN similarity searches for rRNA and protein coding genes. Structural rearrangements were detected by loss of synteny. The rearranged assemblies were further investigated through alignment with the reference mitochondrial gen-ome with MUMmer v3.0 [74], nucmer was used to align the sequences and plots were generated with mummerplot.
Copy number estimation
The number of copies of the mitochondrial genome was assessed by mapping, using BWA v0.7.15 [78] with the op-tion –U 0. The reads of individual strains of three mito-chondrial CDSs (ATP6, COX2, COX3) gave the most reliable copy number estimation. These CDSs were chosen for the lack of introns and their size. Samtools view was used to filter the results with the option –q 20. The copy number for haploid genome was estimated as the ratio be-tween the average of the median coverage for the three mitochondrial CDS and the nuclear genome coverage (me-dian of the me(me-dian coverage for each chromosome). The estimated total copy number for each isolate was calculated as this copy number times the ploidy.
Spotting assay
Cells were pre-grown overnight in liquid YPD before being diluted in water. For each 10-fold dilution, 5μL was spotted either on YPD or YPEG (3% ethanol, 3% glycerol, 1% yeast extract, 2% peptones) agar plates. Plates were then incu-bated 48 h at 30 °C, and images were acquired with a Epson Perfection V330 scanner.
Growth curves
A YPD overnight culture was 1:100 diluted into fresh YPD in a 96-well plate. Cells were incubated for 48 h at 30 °C in a plate reader (Tecan, Infinite F200 Pro). Optical density (600 nm) was monitored every 20 min. Four replicates were run for each strain. The PRECOG software [79] was used to calculate the doubling times.
Mitochondrial activity and volume
Cells grown overnight in liquid YPD were diluted 40× in 200μL of fresh YPD or fresh YPEG (1% yeast extract, 2% peptones, 3% ethanol, 3% glycerol) in a 96-well plate and incubated 5 h at 30 °C. Respectively 8μL/30 μL of cells from YPD/YPEG were then transferred into 192μL/170 μL of a HEPES 10 mM-glucose 2% solution. Samples were washed twice with HEPES-glucose and finally resuspended in 100μL of mitochondrial staining solution (HEPES-glucose + 100 nM MitoTracker Green (Molecular Probes) + 20 nM MitoTracker Deep Red (Molecular Probes)) in a 96-well plate and incubated 30 min in the dark at 30 °C. Mito-Tracker Green is known to accumulate passively into the mitochondria proportionally to their volume, whereas MitoTracker Deep Red is known to accumulate into mito-chondria proportionally to their membrane potential. The samples were analysed on a FACSCalibur using the HTS module. The relative mitochondrial volume was estimated by reading fluorescence in the FL-1 channel, whereas the relative mitochondrial activity was estimated by reading fluorescence in the FL-4 channel.
Petite isolate sporulation activity
The 1011 sequenced collection was phenotyped for sporu-lation efficiency (De Chiara et al., in preparation). Isolates were pre-cultivated in yeast peptone dextrose (YPD; 2% dextrose, 1% yeast extract, 2% peptone, 2% agar) before be-ing diluted 1:50 into 10 mL of pre-sporulation media (YPA; 2% potassium acetate, 1% yeast extract, 2% peptone) and grown 48 h at 30 °C (shaking = 250 rpm). Pre-sporulated cells were transferred to sporulation media (2% potassium acetate) into 250-mL flasks at a 5:1 volume/medium ratio and a final optical density (OD600) of 0.6. The flasks were kept at 23 °C and shaken at 250 rpm. To estimate sporula-tion efficiency, > 100 cells/sample were counted at 24- and 72-h post-transfer to sporulation medium using an optical microscope (Zeiss Axio Lab.A1). Sporulation efficiency was estimated as the number of asci divided by the total cell count.
Supplementary information
Supplementary information accompanies this paper athttps://doi.org/10. 1186/s12915-020-00786-4.
Additional file 1 : Figure S1 Dataset overview. Dataset overview for each clade (named as in Peter et al. 2018) for number of isolates with
genome sequenced, complete CDSs assembled and non-redundant pro-files. Figure S2 Genetic diversity of nuclear and mitochondrial genes for three yeast species. Distribution of theπ values of mitochondrial and nu-clear protein coding genes for S. cerevisiae and two other yeast species, Lachancea kluyveri and Lachancea thermotolerans. S. cerevisiae genetic di-versity is higher in mitochondrial genome compared to nuclear genome in contrast to the two Lachancea species. Figure S3 Inter-clade distances for domesticated and wild lineages. Pink dots represent distances be-tween isolates belonging to domesticated clades, green dots represent distances between isolates belonging to wild clades. Mitochondrial differ-ences in wild clades, do not scale up with the nuclear distance. Domesti-cate clades show higher diversity at lower nuclear distances compared to the wild clades. Figure S4 Scatterplot of intra-clades CDS SNPs percent-ages. Light grey dots represent distances between isolates belonging to distinct clades while dark grey dots represent distances between isolates belonging to the same clade. Dark grey dots circled in black represent isolates belonging to the Mixed origin clade. The line represents the equivalence between the two distances. Dots below the line represent isolate pairs whose mitochondrial distance is lower than the genomic dis-tance. Mixed Origin clade have higher variation in genomic CDS than mitochondrial CDS. Only isolates with complete CDS data have been used (N=353). 5. Figure S5 Comparison of 8-genes networks for mito-chondrial and nuclear sequences. Highly divergent lineages (AMH –Tai-wanese- and BAG -CHNII-) are not early branching neither in the mitochondrial network (a) nor in the mitochondrial neighbour-joining tree (b), since their sequence diversity is not higher than the typical mito-chondrial one. Mixed origin clade isolates confirm a much lower level of nuclear similarity (c and d) compared to the mitochondrial one, in which case their sequences are virtually identical. Finally, three isolates belong-ing to somehow related clades (BLG -Wine/European-, CCL - Mediterra-nean oak- and AQM -French Dairy-), while remaining related also in the mitochondrial network, are located further apart (a). Figure S6 Frequency of different COX1 introns. The heatmap shows the frequency of the COX1 introns across the S. cerevisiae nuclear clades. Black cells indicate presence in >90% the isolates, white cells indicate <10% in the clade. Figure S7 Frequency of SNPs at the exon/intron boundary for COX1 and COB genes. Intron/exon boundaries of COX1 (black dots) are enriched for high frequency minor alleles compared with COB intron/exon boundaries (grey dots). Figure S8 Mitochondrial genome size variation. Size of all genetic elements located on the 250 circularized assemblies, grouped by clade (as described in Peter et al. 2018). Figure S9 Mitochondrial gen-ome size variation is driven by introns and intergenic regions. Correlation between the length of the mt genome and the cumulative size of the (a) CDS, (b) introns (p-value 1.33e-47), (c) intergenic regions (p-value 4.05e-50), (d) intergenic regions and introns. Figure S10 Structural variation in mitochondrial genomes. Dotplots comparison between the reference genome and the mitochondrial assembly of 4 isolates showing different large inversions. Figure S11 Copy number of mtDNA across clades. The copy number is calculated as ratio with nuclear genome, to subtract vari-ation derived by the ploidy. Mitochondrial genome copy number is rela-tively uniform (median ~ 18 copies) with variations in few clades e.g. increased copy number in French Guiana (10.F) isolates.
Additional file 2 : Table S1 Overview of the S. cerevisiae collection. Profile id column indicates the unique combination of CDS alleles. Columns reporting the CDS alleles indicate the id of the sequence as reported in the multi fasta database of the unique sequences (http://1 002genomes.u-strasbg.fr/files/MitochondrialGenomes/
allNonRedundantAlleles.tar.gz). Introns and endonucleases presence/ absence is coded 1, for presence, or 0, for absence. NA indicate unavailable sequence. Endonucleases and omega intron were identified by blast search using a cut-off of 90% of identity on 90% of sequence overlap with a reference sequence (see materials and methods). nt in the reference are indicated with the upstream nucleotide position. Positions of the GC cluster refers to the starting position in the reference sequence. Cluster which are absent in the reference sequence are indicated with the first upstream position.
Acknowledgements
Authors’ contributions
MDC and AF performed the bioinformatics data collection and analyses. BB and MB performed the laboratory experiments. GL and JS designed and supervised the research. MDC, AF, GL and JS wrote the paper. All authors read and approved the final manuscript.
Funding
This work was supported by the France Génomique (ANR-10-INBS-09-08). GL is supported by the Agence Nationale de la Recherche (ANR-11-LABX-0028-01, ANR-13-BSV6-0006-(ANR-11-LABX-0028-01, ANR-15-IDEX-(ANR-11-LABX-0028-01, ANR-16-CE12-0019 and ANR-18-CE12-0004). JS is supported by a European Research Council (ERC) Consolida-tor grant (772505). JS is a Fellow of the University of Strasbourg Institute for Advanced Study (USIAS) and a member of the Institut Universitaire de France.
Availability of data and materials
The datasets supporting the conclusions of this article are included within the article, its additional files and in the 1002 Yeast Genome website dedicated folder,http://1002genomes.u-strasbg.fr/files/
MitochondrialGenomes.
Ethics approval and consent to participate Not applicable
Consent for publication Not applicable
Competing interests
The authors declare that they have no competing interests.
Author details
1Université Côte d’Azur, CNRS, INSERM, IRCAN, Nice, France.2Université de
Strasbourg, CNRS, GMGM UMR 7156, F-67000 Strasbourg, France.
3Fachbereich Biowissenschaften, Universität Salzburg, Salzburg, Austria. 4Institut Universitaire de France (IUF), Paris, France.
Received: 20 December 2019 Accepted: 22 April 2020
References
1. Saraste M. Oxidative phosphorylation at the fin de siècle. Science. 1999;283: 1488–93.
2. Spinelli JB, Haigis MC. The multifaceted contributions of mitochondria to cellular metabolism. Nat Cell Biol. 2018;20:745–54.
3. Gray MW, Burger G, Lang BF. Mitochondrial evolution. Science. 1999;283: 1476–81.
4. Tovar J, Fischer A, Clark CG. The mitosome, a novel organelle related to mitochondria in the amitochondrial parasite Entamoeba histolytica. Mol Microbiol. 1999;32:1013–21.
5. Karnkowska A, Vacek V, Zubáčová Z, Treitli SC, Petrželková R, Eme L, et al. A eukaryote without a mitochondrial organelle. Curr Biol. 2016;26:1274–84. 6. Wallace DC. Why do we still have a maternally inherited mitochondrial
DNA? Insights from evolutionary medicine. Annu Rev Biochem. 2007;76: 781–821.
7. Gray MW. Mitochondrial evolution. Cold Spring Harb Perspect Biol. 2012;4: a011403.
8. Flegontov P, Michálek J, Janouškovec J, Lai D-H, Jirků M, Hajdušková E, et al. Divergent mitochondrial respiratory chains in phototrophic relatives of apicomplexan parasites. Mol Biol Evol. 2015;32:1115–31.
9. Burger G, Gray MW, Forget L, Lang BF. Strikingly bacteria-like and gene-rich mitochondrial genomes throughout jakobid protists. Genome Biol Evol. 2013;5:418–38.
10. Rühle T, Leister D. Assembly of F1F0-ATP synthases. Biochimica et Biophysica Acta (BBA) - Bioenergetics. 2015;1847:849–60.
11. Lee H-Y, Chou J-Y, Cheong L, Chang N-H, Yang S-Y, Leu J-Y. Incompatibility of nuclear and mitochondrial genomes causes hybrid sterility between two yeast species. Cell. 2008;135:1065–73.
12. Ma H, Marti Gutierrez N, Morey R, Van Dyken C, Kang E, Hayama T, et al. Incompatibility between nuclear and mitochondrial genomes contributes to an interspecies reproductive barrier. Cell Metab. 2016;24: 283–94.
13. Atyame CM, Delsuc F, Pasteur N, Weill M, Duron O. Diversification of Wolbachia endosymbiont in the Culex pipiens mosquito. Mol Biol Evol. 2011;28:2761–72.
14. Nadimi M, Daubois L, Hijri M. Mitochondrial comparative genomics and phylogenetic signal assessment of mtDNA among arbuscular mycorrhizal fungi. Mol Phylogenet Evol. 2016;98:74–83.
15. Lassiter ES, Russ C, Nusbaum C, Zeng Q, Saville AC, Olarte RA, et al. Mitochondrial genome sequences reveal evolutionary relationships of the Phytophthora 1c clade species. Curr Genet. 2015;61:567–77.
16. Turissini DA, Gomez OM, Teixeira MM, McEwen JG, Matute DR. Species boundaries in the human pathogen Paracoccidioides. Fungal Genet Biol. 2017;106:9–25.
17. Fontenot BE, Makowsky R, Chippindale PT. Nuclear-mitochondrial discordance and gene flow in a recent radiation of toads. Mol Phylogenet Evol. 2011;59:66–80.
18. Wiesner RJ, Rüegg JC, Morano I. Counting target molecules by exponential polymerase chain reaction: copy number of mitochondrial DNA in rat tissues. Biochem Biophys Res Commun. 1992;183:553–9.
19. Sandor S, Zhang Y, Xu J. Fungal mitochondrial genomes and genetic polymorphisms. Appl Microbiol Biotechnol. 2018;102:9433–48. 20. Zouros E, Freeman KR, Ball AO, Pogson GH. Direct evidence for extensive
paternal mitochondrial DNA inheritance in the marine mussel Mytilus. Nature. 1992;359:412–4.
21. Leducq J-B, Henault M, Charron G, Nielly-Thibault L, Terrat Y, Fiumera HL, et al. Mitochondrial recombination and introgression during speciation by hybridization. Mol Biol Evol. 2017;34:1947–59.
22. Zouros E, Oberhauser Ball A, Saavedra C, Freeman KR. An unusual type of mitochondrial DNA inheritance in the blue mussel Mytilus. Proc Natl Acad Sci U S A. 1994;91:7463–7.
23. Solieri L. Mitochondrial inheritance in budding yeasts: towards an integrated understanding. Trends Microbiol. 2010;18:521–30.
24. Schapira AHV. Mitochondrial diseases. Lancet. 2012;379:1825–34. 25. Lasserre J-P, Dautant A, Aiyar RS, Kucharczyk R, Glatigny A,
Tribouillard-Tanvier D, et al. Yeast as a system for modeling mitochondrial disease mechanisms and discovering therapies. Dis Model Mech. 2015;8:509–26. 26. Song Z, Laleve A, Vallières C, McGeehan JE, Lloyd RE, Meunier B. Human
mitochondrial cytochrome b variants studied in yeast: not all are silent polymorphisms. Hum Mutat. 2016;37:933–41.
27. Ghosh A, Trivedi PP, Timbalia SA, Griffin AT, Rahn JJ, Chan SSL, et al. Copper supplementation restores cytochrome c oxidase assembly defect in a mitochondrial disease model of COA6 deficiency. Hum Mol Genet. 2014;23: 3596–606.
28. Wolters JF, Chiu K, Fiumera HL. Population structure of mitochondrial genomes in Saccharomyces cerevisiae. BMC Genomics. 2015;16:451. 29. Repar J, Warnecke T. Mobile introns shape the genetic diversity of their host
genes. Genetics. 2017;205:1641–8.
30. Foury F, Roganti T, Lecrenier N, Purnelle B. The complete sequence of the mitochondrial genome of Saccharomyces cerevisiae. FEBS Lett. 1998;440:325–31. 31. Michel F. A maturase-like coding sequence downstream of the OXI2
gene of yeast mitochondrial DNA is interrupted by two GC clusters and a putative end-of-messenger signal. Curr Genet. 1984;8:307–17. 32. Séraphin B, Simon M, Faye G. The mitochondrial reading frame RF3 is a
functional gene in Saccharomyces uvarum. J Biol Chem. 1987;262:10146–53. 33. Lang BF, Jakubkova M, Hegedusova E, Daoud R, Forget L, Brejova B, et al.
Massive programmed translational jumping in mitochondria. Proc Natl Acad Sci U S A. 2014;111:5926–31.
34. Dujon B. Mitochondrial genetics revisited. Yeast. 2020;37:191–205. 35. Fritsch ES, Chabbert CD, Klaus B, Steinmetz LM. A genome-wide
map of mitochondrial DNA recombination in yeast. Genetics. 2014;198:755–71. 36. Prasai K, Robinson LC, Scott RS, Tatchell K, Harrison L. Evidence for
double-strand break mediated mitochondrial DNA replication in Saccharomyces cerevisiae. Nucleic Acids Res. 2017;45:7760–73.
37. Peris D, Sylvester K, Libkind D, Gonçalves P, Sampaio JP, Alexander WG, et al. Population structure and reticulate evolution of Saccharomyces eubayanus and its lager-brewing hybrids. Mol Ecol. 2014;23:2031–45. 38. Peris D, Arias A, Orlić S, Belloch C, Pérez-Través L, Querol A, et al. Mitochondrial
introgression suggests extensive ancestral hybridization events among Saccharomyces species. Mol Phylogenet Evol. 2017;108:49–60.
39. Puddu F, Herzog M, Selivanova A, Wang S, Zhu J, Klein-Lavi S, et al. Genome architecture and stability in the Saccharomyces cerevisiae knockout collection. Nature. 2019;573:416–20.
40. Cáp M, Stěpánek L, Harant K, Váchová L, Palková Z. Cell differentiation within a yeast colony: metabolic and regulatory parallels with a tumor-affected organism. Mol Cell. 2012;46:436–48.
41. Tsukada M, Ohsumi Y. Isolation and characterization of autophagy-defective mutants of Saccharomyces cerevisiae. FEBS Lett. 1993;333:169–74. 42. Botstein D, Fink GR. Yeast: an experimental organism for 21st century
biology. Genetics. 2011;189:695–704.
43. Warringer J, Zörgö E, Cubillos FA, Zia A, Gjuvsland A, Simpson JT, et al. Trait variation in yeast is defined by population history. PLoS Genet. 2011;7: e1002111.
44. Dimitrov LN, Brem RB, Kruglyak L, Gottschling DE. Polymorphisms in multiple genes contribute to the spontaneous mitochondrial genome instability of Saccharomyces cerevisiae S288C strains. Genetics. 2009;183:365–83. 45. Bergström A, Simpson JT, Salinas F, Barré B, Parts L, Zia A, et al. A
high-definition view of functional genetic variation from natural yeast genomes. Mol Biol Evol. 2014;31:872–88.
46. Strope PK, Skelly DA, Kozmin SG, Mahadevan G, Stone EA, Magwene PM, et al. The 100-genomes strains, an S. cerevisiae resource that illuminates its natural phenotypic and genotypic variation and emergence as an opportunistic pathogen. Genome Res. 2015;25:762–74.
47. Peter J, De Chiara M, Friedrich A, Yue J-X, Pflieger D, Bergström A, et al. Genome evolution across 1,011 Saccharomyces cerevisiae isolates. Nature. 2018;556:339–44.
48. Freel KC, Friedrich A, Hou J, Schacherer J. Population genomic analysis reveals highly conserved mitochondrial genomes in the yeast species Lachancea thermotolerans. Genome Biol Evol. 2014;6:2586–94. 49. Jiang H, Guan W, Pinney D, Wang W, Gu Z. Relaxation of yeast
mitochondrial functions after whole-genome duplication. Genome Res. 2008;18:1466–71.
50. Jombart T, Devillard S, Balloux F. Discriminant analysis of principal components: a new method for the analysis of genetically structured populations. BMC Genet. 2010;11:94.
51. Kurtzman CP, Robnett CJ. Phylogenetic relationships among yeasts of the “Saccharomyces complex” determined from multigene sequence analyses. FEMS Yeast Res. 2003;3:417–32.
52. Peris D, Langdon QK, Moriarty RV, Sylvester K, Bontrager M, Charron G, et al. Complex ancestries of lager-brewing hybrids were shaped by standing variation in the wild yeast Saccharomyces eubayanus. PLoS Genet. 2016;12: e1006155.
53. Liti G, Carter DM, Moses AM, Warringer J, Parts L, James SA, et al. Population genomics of domestic and wild yeasts. Nature. 2009;458:337–41.
54. Nosek J, Tomaska L, Burger G, Lang BF. Programmed translational bypassing elements in mitochondria: structure, mobility, and evolutionary origin. Trends Genet. 2015;31:187–94.
55. Huson DH, Bryant D. Application of phylogenetic networks in evolutionary studies. Mol Biol Evol. 2006;23:254–67.
56. Yue J-X, Li J, Aigrain L, Hallin J, Persson K, Oliver K, et al. Contrasting evolutionary genome dynamics between domesticated and wild yeasts. Nat Genet. 2017;49:913–24.
57. Alexander DH, Novembre J, Lange K. Fast model-based estimation of ancestry in unrelated individuals. Genome Res. 2009;19:1655–64. 58. Campbell V, Legendre P, Lapointe F-J. The performance of the Congruence
Among Distance Matrices (CADM) test in phylogenetic analysis. BMC Evol Biol. 2011;11:64.
59. Liti G, Barton DBH, Louis EJ. Sequence diversity, reproductive isolation and species concepts in Saccharomyces. Genetics. 2006;174:839–50. 60. Salichos L, Rokas A. Inferring ancient divergences requires genes with
strong phylogenetic signals. Nature. 2013;497:327–31.
61. Kowalczykowski SC. Initiation of genetic recombination and recombination-dependent replication. Trends Biochem Sci. 2000;25:156–65.
62. Chen XJ, Clark-Walker GD. Unveiling the mystery of mitochondrial DNA replication in yeasts. Mitochondrion. 2018;38:17–22.
63. Wu B, Hao W. A dynamic mobile DNA family in the yeast mitochondrial genome. G3 (Bethesda). 2015;5:1273–82.
64. Talla E, Anthouard V, Bouchier C, Frangeul L, Dujon B. The complete mitochondrial genome of the yeast Kluyveromyces thermotolerans. FEBS Lett. 2005;579:30–40.
65. Sulo P, Szabóová D, Bielik P, Poláková S,Šoltys K, Jatzová K, et al. The evolutionary history of Saccharomyces species inferred from completed mitochondrial genomes and revision in the“yeast mitochondrial genetic code.”. DNA Res. 2017;24:571–83.
66. Friedrich A, Jung PP, Hou J, Neuvéglise C, Schacherer J. Comparative mitochondrial genomics within and among yeast species of the Lachancea genus. PLoS One. 2012;7:e47834.
67. Gaillardin C, Neuvéglise C, Kerscher S, Nicaud J-M. Mitochondrial genomes of yeasts of the Yarrowia clade. FEMS Yeast Res. 2012;12:317–31. 68. Grimes GW, Mahler HR, Perlman PS. Nuclear gene dosage effects on
mitochondrial mass and DNA. J Cell Biol. 1974;61:565–74.
69. Briza P, Bogengruber E, Thür A, Rützler M, Münsterkötter M, Dawes IW, et al. Systematic analysis of sporulation phenotypes in 624 non-lethal
homozygous deletion strains of Saccharomyces cerevisiae. Yeast. 2002;19: 403–22.
70. Altschul SF, Madden TL, Schäffer AA, Zhang J, Zhang Z, Miller W, et al. Gapped BLAST and PSI-BLAST: a new generation of protein database search programs. Nucleic Acids Res. 1997;25:3389–402.
71. Hunt M, Silva ND, Otto TD, Parkhill J, Keane JA, Harris SR. Circlator: automated circularization of genome assemblies using long sequencing reads. Genome Biol. 2015;16:294.
72. Myers EW, Miller W. Optimal alignments in linear space. Comput Appl Biosci. 1988;4:11–7.
73. Hutter S, Vilella AJ, Rozas J. Genome-wide DNA polymorphism analyses using VariScan. BMC Bioinformatics. 2006;7:409.
74. Kurtz S, Phillippy A, Delcher AL, Smoot M, Shumway M, Antonescu C, et al. Versatile and open software for comparing large genomes. Genome Biol. 2004;5:R12.
75. Page AJ, Taylor B, Delaney AJ, Soares J, Seemann T, Keane JA, et al. SNP-sites: rapid efficient extraction of SNPs from multi-FASTA alignments. Microb Genom. 2016;2. Available from:https://www.ncbi.nlm.nih.gov/pmc/articles/ PMC5320690/. [cited 2019 Jun 4].
76. Purcell S, Neale B, Todd-Brown K, Thomas L, Ferreira MAR, Bender D, et al. PLINK: a tool set for whole-genome association and population-based linkage analyses. Am J Hum Genet. 2007;81:559–75.
77. Kumar S, Stecher G, Tamura K. MEGA7: Molecular Evolutionary Genetics Analysis version 7.0 for bigger datasets. Mol Biol Evol. 2016;33:1870–4. 78. Li H, Durbin R. Fast and accurate short read alignment with
Burrows-Wheeler transform. Bioinformatics. 2009;25:1754–60.
79. Fernandez-Ricaud L, Kourtchenko O, Zackrisson M, Warringer J, Blomberg A. PRECOG: a tool for automated extraction and visualization of fitness components in microbial growth phenomics. BMC Bioinformatics. 2016;17: 249.
Publisher’s Note
Springer Nature remains neutral with regard to jurisdictional claims in published maps and institutional affiliations.