HAL Id: hal-03112998
https://hal.univ-grenoble-alpes.fr/hal-03112998
Submitted on 18 Jan 2021
HAL is a multi-disciplinary open access
archive for the deposit and dissemination of
sci-entific research documents, whether they are
pub-lished or not. The documents may come from
teaching and research institutions in France or
abroad, or from public or private research centers.
L’archive ouverte pluridisciplinaire HAL, est
destinée au dépôt et à la diffusion de documents
scientifiques de niveau recherche, publiés ou non,
émanant des établissements d’enseignement et de
recherche français ou étrangers, des laboratoires
publics ou privés.
Supramolecular assembly of the Escherichia coli LdcI
upon acid stress
Matthew Jessop, Clarissa Liesche, Jan Felix, Ambroise Desfosses, Megghane
Baulard, Virgile Adam, Angélique Fraudeau, Karine Huard, Grégory Effantin,
Jean-Philippe Kleman, et al.
To cite this version:
Matthew Jessop, Clarissa Liesche, Jan Felix, Ambroise Desfosses, Megghane Baulard, et al..
Supramolecular assembly of the Escherichia coli LdcI upon acid stress. Proceedings of the National
Academy of Sciences of the United States of America , National Academy of Sciences, 2021, 118 (2),
pp.e2014383118. �10.1073/pnas.2014383118�. �hal-03112998�
Supramolecular assembly of the Escherichia coli LdcI
upon acid stress
Matthew Jessopa,1, Clarissa Lieschea,1, Jan Felixa,1,2, Ambroise Desfossesa, Megghane Baularda, Virgile Adama, Angélique Fraudeaua, Karine Huarda, Grégory Effantina, Jean-Philippe Klemana, Maria Bacia-Verloopa,
Dominique Bourgeoisa, and Irina Gutschea,3
aInstitut de Biologie Structurale (IBS), Université Grenoble Alpes (UGA), Commissariat à l’énergie atomique et aux énergies alternatives (CEA), CNRS,
F-38044 Grenoble, France
Edited by Wah Chiu, Stanford University, Stanford, CA, and approved November 17, 2020 (received for review July 14, 2020)
Pathogenic and commensal bacteria often have to resist the harsh acidity of the host stomach. The inducible lysine decarboxylase LdcI buffers the cytosol and the local extracellular environment to ensure enterobacterial survival at low pH. Here, we investigate the acid stress-response regulation ofEscherichia coli LdcI by com-bining biochemical and biophysical characterization with negative stain and cryoelectron microscopy (cryo-EM) and wide-field and superresolution fluorescence imaging. Due to deleterious effects of fluorescent protein fusions on native LdcI decamers, we opt for three-dimensional localization of nanobody-labeled endogenous wild-type LdcI in acid-stressedE. coli cells and show that it orga-nizes into distinct patches at the cell periphery. Consistent with recent hypotheses that in vivo clustering of metabolic enzymes often reflects their polymerization as a means of stimulus-induced regulation, we show that LdcI assembles into filaments in vitro at physiologically relevant low pH. We solve the structures of these filaments and of the LdcI decamer formed at neutral pH by cryo-EM and reveal the molecular determinants of LdcI poly-merization, confirmed by mutational analysis. Finally, we propose a model for LdcI function inside the enterobacterial cell, providing a structural and mechanistic basis for further investigation of the role of its supramolecular organization in the acid stress response.
cryo-EM
|
SMLM|
lysine decarboxylase|
LdcIC
ell survival requires the adaptation of metabolism to changing environmental demands. Biochemical regulation of metabolic enzymes by cellular metabolites has been intensely studied for many decades. In addition, a growing body of recent light mi-croscopy observations highlights the spatial regulation of enzymes by stimulus-induced phase separation into distinct loci—liquid droplets, amyloid-like aggregates, or ordered polymers (1, 2). In eukaryotes, the observed condensation of fluorescently labeled metabolic enzymes is triggered by stress, including medium acid-ification, hypoxia, and nutrient limitation. Enterobacteria such as Escherichia coli, Salmonella, and Vibrio encounter these types of conditions in the host gastrointestinal tract (3). One of the key enterobacterial proteins expressed during the acid stress response, upon oxygen limitation and regulated by the nutrient stress alar-mone guanosine tetraphosphate (ppGpp), is the acid stress-inducible lysine decarboxylase LdcI (4–7). LdcI has been scruti-nized since the early 1940s because of direct links between the efficiency of the acid stress response and pathogenicity (8–10). This enzyme transforms lysine into cadaverine while consuming protons and producing CO2, thereby contributing to buffering of the bacterial cytosol and the extracellular medium under acid stress conditions to promote bacterial survival. While both the structure and the function of LdcI have been thoroughly studied (7, 11), nothing is known about its localization inside the bacterial cell, because its fluorescent protein fusions were previously de-scribed to form inclusion bodies (12).Whereas the overwhelming majority of superresolution fluores-cence imaging is focused on eukaryotes, optical studies of bacterial systems are nearly exclusively centered on large macromolecular
complexes with obvious superstructure such as cytoskeletal, cell division, chromosome partitioning, RNA degradation, and secre-tion machineries (13–15). As for bacterial metabolic enzymes, a handful of examples of their regulation by phase separation through stimulus-triggered polymerization concern well-conserved oligomeric proteins involved in nucleotide and amino acid me-tabolism, such as CTP synthase (16, 17) and glutamine synthetase (18). Interestingly, these enzymes are also able to assemble into filaments in vitro, and their in vivo condensates, detected both in bacteria and in eukaryotes, have been suggested to corre-spond to the polymerized state of the enzymes. Other examples of bacterial metabolic enzymes purified as polymers from bac-terial extracts or forming polymers in vitro are the aldehyde-alcohol dehydrogenase AdhE (19) and the hydrogen-dependent CO2reductase HDCR (20).
Specific to bacteria, LdcI is a decamer composed of five dimers tightly arranged into pentameric double rings (Protein Data Bank [PDB] ID: 3N75) (7). Interestingly, in vitro these double rings were observed by negative stain electron microscopy (ns-EM) to stack on top of one another into filament-like structures (7, 9) but only at nonphysiological pH below 5, under which LdcI should not be significantly expressed. Here, to address the spatial localization of theE. coli LdcI, we start by critically evaluating the effects of
Significance
Bacteria possess a sophisticated arsenal of defense mechanisms that allow them to survive in adverse conditions. Adaptation to acid stress and hypoxia is crucial for the enterobacterial transmission in the gastrointestinal tract of their human host. When subjected to low pH,Escherichia coli and many other enterobacteria activate a proton-consuming resistance system based on the acid stress-inducible lysine decarboxylase LdcI. Here we develop generally applicable tools to uncover the spatial localization of LdcI inside the cell by superresolution fluorescence microscopy and investigate the in vitro supra-molecular organization of this enzyme by cryo-EM. We build on these results to propose a mechanistic model for LdcI function and offer tools for further in vivo investigations.
Author contributions: I.G. designed research; M.J., C.L., J.F., A.D., M.B., V.A., A.F., K.H., G.E., J.-P.K., M.B.-V., D.B., and I.G. performed research; M.J., C.L., J.F., A.D., M.B., V.A., J.-P.K., D.B., and I.G. analyzed data; and M.J., J.F., and I.G. wrote the paper.
The authors declare no competing interest. This article is a PNAS Direct Submission.
This open access article is distributed underCreative Commons
Attribution-NonCommercial-NoDerivatives License 4.0 (CC BY-NC-ND).
1M.J., C.L., and J.F. contributed equally to this work.
2Present address: Unit for Structural Biology, VIB Center for Inflammation Research,
Tech-nologiepark-Zwijnaarde 71, 9052 Ghent, Belgium.
3To whom correspondence may be addressed. Email: irina.gutsche@ibs.fr.
This article contains supporting information online athttps://www.pnas.org/lookup/suppl/
doi:10.1073/pnas.2014383118/-/DCSupplemental.
Published December 28, 2020.
BIO
fluorescent protein (FP) labeling in vitro, with an ambition to define the optimal constructs for subsequent chromosomal ma-nipulations. To this end, we overexpress and purify different FP fusions of LdcI, perform their structural and biochemical char-acterization in vitro, and observe the distribution of the overex-pressed constructs in vivo. This methodological section enables us to propose a workflow that brings together examinations of in vivo protein localization with in vitro biochemical and ns-EM charac-terization of the purified FP fusions in order to ensure artifact-free optical imaging investigations. This analysis is followed by unveiling a patchy distribution of endogenous LdcI inside the E. coli cell upon acid stress. Because this condensation of LdcI into patches is reminiscent of stress-induced polymerization, in particular in yeast, we subsequently investigate the in vitro archi-tecture of LdcI at pH 5.7. We show that at this physiological pH, corresponding to the optimum of the LdcI enzymatic activity, LdcI is a polymer assembled of stacked decamers, and solve the poly-mer structure by cryoelectron microscopy (cryo-EM). For com-parison, we also determined the cryo-EM structure of the LdcI decamer at neutral pH. In addition, mutational analysis of the LdcI stack-forming interfaces allowed identification of critical residues involved in stack formation. Finally, we discuss the ob-served LdcI localization pattern in light of the wealth of available functional and imaging data and offer a structural and mechanistic basis of supramolecular LdcI assembly, which will aid in the design of future experiments linking LdcI stack formation toE. coli acid stress fitness.
Results
Fluorescent Protein Fusions Affect LdcI Structure without Modifying Localization of the Overexpressed Fusion Constructs.Because of the small size of the E. coli cell, we opted for imaging by single molecule localization microscopy (SMLM) (21–24). We there-fore started by creating fusions of LdcI with genetically encoded phototransformable FPs. Considering that LdcI is an acid stress response enzyme, we chose either mGeosM (25) or Dendra2T69A (26) as FP markers because of their relatively low pKavalues, high monomericity, and high fluorescence quantum yields. In the LdcI decamer structure, the N termini are oriented inwards and toward the central pore of the double ring, while the C termini point to the ring periphery and are readily accessible from the outside. Therefore, on the one side, one could assume that an N-terminal labeling with an FP would be likely to interrupt the LdcI tertiary structure. On the other side, the only well-characterized binding partner of LdcI, the AAA+ ATPase RavA, is known to interact precisely with the C-terminal β-sheet of LdcI (27). Assembly of two copies of double-pentameric rings of LdcI and five copies of hexameric RavA spirals results in a huge 3.3-MDa macromolecular cage of intricate architecture and largely unknown function (27–29). The LdcI–RavA cage is proposed to assist assembly of specific respiratory complexes in E. coli and to counteract acid stress under starvation conditions by alleviating ppGpp-dependent inhibition of LdcI (30–32). Thus, although these functions still require further investiga-tion, preservation of the RavA-binding propensity should be one of the criteria for assessing the suitability of an LdcI–FP fusion. Therefore, both N- and C-terminal fusion constructs with either mGeosM or Dendra2T69Aattached to LdcI via an appropriate linker were cloned into dedicated plasmids and overexpressed at conditions optimized for LdcI overproduction (Methods). Expression of fusion proteins was immediately de-tected by wide-field fluorescence imaging that showed a similar distribution for the four fusions (Fig. 1A). Each construct was then purified in order to assess its structural integrity and RavA-binding capacity in vitro, with a goal of defining the most suitable construct for the subsequent creation of a corre-sponding chromosomal fusion.
The N-terminal Dendra2T69A–LdcI fusion exclusively formed dimers at pHs between 5.7 and 7.5, confirming the structure-based prediction that the fluorescent tag at this position would perturb the dimer–dimer interaction (Fig. 1B andSI Appendix, Fig. S1). Admittedly, native LdcI was shown to dissociate into dimers in vitro at pH above∼7.5, but in this pH range LdcI is not supposed to be expressed in the cell and therefore this dissoci-ation may be irrelevant. Surprisingly, in contrast to Dendra2T69A– LdcI, mGeosM–LdcI assembled into regular symmetric nonnative higher-order oligomers, with a dramatically altered quaternary structure (Fig. 1B andSI Appendix, Fig. S1). These oligomers were built of three LdcI tetramers, bridged together by additional densities. Noteworthy, mEos2, the fluorescent protein from which mGeosM was derived, crystallizes as a tetramer (PDB ID: 3S05) that can be straightforwardly fitted into the LdcI-bridging densities (Fig. 1B). This illustrates that despite the fact that mGeosM was designed as a monomeric FP (with the first“m” explicitly standing for monomeric), some residual oligomeric tendency is still main-tained. This propensity of mGeosM to oligomerize when bound to LdcI may be driven by avidity effects—as LdcI dimers begin to assemble into a decamer, the local concentration of mGeosM increases to such a point that oligomerization becomes energetically favorable, despite the apparent monomer behavior of mGeosM in gel filtration (25). This is also in line with the known propensity of mEos2, from which mGeosM is derived, to form tetramers at high concentration (33). To conclude, both N-terminal fusions induced nonnative assembly of LdcI in vitro. Although the in vivo context may further influence the oligomerization properties, the observed perturbed oligomerization in vitro casts doubts on the physiological relevance of these constructs for in vivo studies.
As expected, C-terminal LdcI fluorescent fusions formed dec-amers with protruding densities that can be attributed to flexibly attached FPs (Fig. 1B and SI Appendix, Fig. S1). Nevertheless, despite the long flexible linker between LdcI and the FP, these constructs were unable to interact with RavA as shown by biolayer interferometry (BLI)-binding studies (Methods andSI Appendix, Fig. S1). This means that the functionality of these fusions cannot be considered as entirely retained. Thus, none of the four fusions were directly suitable for an in-depth imaging analysis under conditions of native LdcI expression upon acid stress that we planned to undertake. Altogether, we demonstrated that struc-tural integrity and unaltered interaction with known partners are useful readouts for functional preservation. Based on this result we propose that, when feasible, purification and structure– function analysis of FP fusions should be performed prior to in-terpretation of the protein localization inferred from observation of FP fusions by optical methods. This workflow can be used for example in cases where chromosomal manipulation for assess-ment of intact function is difficult and/or the phenotype is con-dition dependent or unclear, whereas basic in vitro biochemical and ns-EM characterization can be efficiently set up.
Immunofluorescence of LdcI inE. coli under Acid Stress Reveals Its Supramolecular Organization.Imaging techniques relying on ge-netically encoded FPs fused to the protein of interest are un-matched in terms of labeling specificity and efficiency. In addition, they do not require delivery of fluorescent molecules across the cell wall and do enable live cell imaging and single molecule tracking. In principle, because none of the FP fusions possessed the properties of native LdcI, to minimize the deleterious effect of the N-terminal or C-terminal FP fusions on the LdcI function, one could have opted for coexpression of a small amount of the FP-labeled LdcI with the wild-type (WT) LdcI. However, knowing the intricate regulation of the native LdcI promoter (see below), we decided to rather turn to immunofluorescence superresolution imaging of the endogenous enzyme. One of the drawbacks of this technique is the requirement for exogenous labeling and therefore the fixation and permeabilization of cells. These procedures are
known to potentially affect cell morphology and/or ultrastructure, and therefore, when possible, the use of live cell imaging with FP fusions, or observation of unfixed samples under cryogenic con-ditions would be preferred. In addition, fixation, permeabilization, and specific exogenous labeling in bacteria present unique chal-lenges because of the complex, often multilayered cell wall (34, 35). A significant advantage of immunolabeling, however, is the possibility of direct imaging of the WT protein, which should circumvent the dangers associated with FP fusions described above. The three prerequisites for imaging of WT systems by immuno-based labeling in general and of LdcI in particular are 1) availability of an antibody or nanobody (antibody fragment de-rived from heavy-chain-only camelid antibody) coupled to an or-ganic fluorescent dye and directed toward the native protein, 2) precise knowledge of endogenous expression conditions, and 3) validation of an efficient permeabilization and immunolabeling technique that enables the antibody/nanobody to enter the cell and specifically target the protein of interest without altering its native organization.
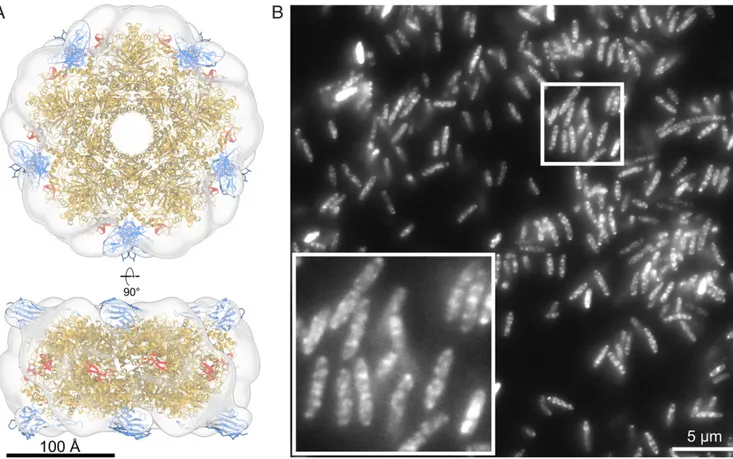
As a first step toward immunofluorescence SMLM imaging of endogenous LdcI, we probed an anti-LdcI nanobody, hereafter called anti-LdcI-Nb. The complex between purifiedE. coli LdcI and the nanobody was purified by size exclusion chromatography (SEC) (Methods), and imaged by ns-EM. The resulting three-dimensional (3D) map of the LdcI/anti-LdcI-Nb complex dem-onstrates binding of anti-LdcI-Nb to each LdcI monomer in the decamer and reveals the location of the interaction site which is clearly distinct from the RavA-binding site (Fig. 2A andSI Ap-pendix, Fig. S2). This nanobody was thus identified as a suitable labeling agent for LdcI imaging inE. coli cells and labeled with the fluorescent dye Alexa Fluor 647 (AF647) or Alexa Fluor 488 (AF488) (Methods).
Consistent with published data, LdcI expression could be in-duced by a pH shift experiment (i.e., transfer of bacteria from pH
7.0 into a pH 4.6 growth medium) in the presence of lysine under oxygen-limiting conditions (SI Appendix, Fig. S3A). While the WT strain grew well under these conditions and efficiently buffered the extracellular medium up to pH 6.2 in∼1.5 to 2 h (SI Appendix, Fig. S3A) concomitantly with the increase in the level of LdcI expression (SI Appendix, Fig. S3 B and C), the growth and the acid stress response of the ΔldcI mutant strain were severely impaired (SI Appendix, Fig. S3A). Since the peak of LdcI expression by the wild-type cells was achieved between 1 and 2 h after exposure to acid stress (SI Appendix, Fig. S3 B and C), a time point of 90 min was chosen for the subsequent labeling and imaging experiments. The specificity and performance of anti-LdcI-Nb in immunofluorescence labeling of permeabilizedE. coli cells were characterized by flow cytometry and wide-field fluo-rescence imaging (SI Appendix, Fig. S3 D and E). Both techniques demonstrated that in the absence of LdcI expression no specific fluorescence is seen, confirming the suitability of anti-LdcI-Nb for immunofluorescence studies. Thus, the above-mentioned prereq-uisites for immuno-based imaging of cellular LdcI have been ful-filled. Noteworthy, the LdcI expression profile highlighted a considerable asset of the usage of immunolabeling instead of FP fusions for visualization of the endogenously expressed LdcI: in-deed, the transient nature of the expression and the necessity of work under oxygen-limiting conditions may have created difficul-ties due to the longer maturation time of the FPs under these conditions.
Initial characterization of the cellular distribution of LdcI 90 min after exposure ofE. coli cells to acid stress was carried out by wide-field fluorescence imaging. Based on these images, it appeared that natively expressed LdcI did not display a homo-geneous cytoplasmic distribution but rather showed a patchy localization pattern (Fig. 2B). Three-dimensional stochastic op-tical reconstruction microscopy (STORM) imaging subsequently provided a more detailed view of this patchy distribution.
Fig. 1. Fluorescent protein fusions affect LdcI structure without significantly altering cellular localization of overexpressed constructs. (A) Wide-field fluo-rescence microscopy images of E. coli cells overexpressing the fluorescent fusion proteins in A. Green fluofluo-rescence= FP–LdcI, blue fluorescence = DAPI-stained DNA. (B) ns-EM 3D maps of FP-tagged LdcI purified at pH 7.0, with fitted models. (Left) Dendra2T69A–LdcI forms dimers, with fluorescent barrels located next
to the N terminus of LdcI as expected. (Second from Left) mGeosM–LdcI forms large nonnative oligomers, composed of three LdcI tetramers bridged by tetramers of mGeosM. (Second from Right and Right) Both C-terminal fluorescent fusions LdcI–mGeosM and LdcI–Dendra2T69Aform decamers, with
pro-trusions at the C terminus (colored in red) attributed to flexibly linked fluorescent proteins. Fitted PBD models are as follows: LdcI, 3N75; Dendra2, 2VZX; and mGeosM, 3S05 (mEos2 crystal structure).
BIO
As shown in Fig. 3 and inSI Appendix, Fig. S4andMovies S1–S5, the labeling density was lower in the center of the bacterium. This indicates a propensity for LdcI to cluster near the cell pe-riphery, toward the inner membrane and the cell poles, rather than being distributed homogeneously through the volume. Re-cent investigations argue that, in most cases, in vivo clustering of metabolic enzymes corresponds to their polymerized states and represents an efficient means of regulation of enzymatic activity and metabolic homeostasis in response to a stimulus (1, 2). Thus, structure determination of these polymers is a crucial step toward the understanding of regulation mechanisms. We previously documented that in vitro at pH below 5 and high concentration, LdcI decamers indeed tend to stack (7). However, at pH 5.7, optimal for LdcI expression and enzymatic activity and likely corresponding to the internal pH upon acid stress, the oligomeric state of LdcI has not yet been addressed by EM. Supposing that the high local concentration of LdcI, clustered in patches in the E. coli cell under acid stress conditions, is likely to induce enzyme polymerization via stack formation, we next examined the LdcI assembly state at pH 5.7 by cryo-EM and discovered that it does indeed form straight polymers (Fig. 4).
Structural Determinants of LdcI Stack Formation Revealed by Cryo-EM.In order to understand the molecular determinants of LdcI polymerization at low pH and to provide a framework for the analysis of LdcI function under acid stress, we solved the 3D structures of the LdcI decamer at pH 7.0 and of LdcI stacks at pH 5.7 by cryo-EM (Methods, Fig. 4, andSI Appendix, Figs. S5 and S6 and Table S1). The 2.8-Å resolution structure of the LdcI
decamer at pH 7.0 (Fig. 4A) is extremely similar (SI Appendix, Tables S2 and S3) to the LdcI crystal structure solved at pH 8.5 in an inhibited ppGpp-bound state (7). However, contrary to pH 7.0 and even pH 6.2 where LdcI is still predominantly decameric (11), LdcI forms straight rigid filaments on the cryo-EM grid at pH 5.7, which corresponds to the pH of maximum LdcI enzy-matic activity (Fig. 4B). The structure of a three-decamer stack was solved to a resolution of 3.3 Å, revealing the structural de-tails of acid stress-induced LdcI polymerization (Fig. 4C). LdcI decamers stack tightly on top of one other, with negligible ro-tation between decamers along the stack. Each dimer fits snugly in the interdimer groove of decamers above and below.
A comparison of LdcI decamer structures taken from the LdcI stack cryo-EM map (at pH 5.7), the LdcI decamer cryo-EM map (at pH 7.0), and the crystal structure of decameric LdcI crys-tallized with bound ppGpp at pH 8.5 (PDB ID: 3N75) reveals some remarkable differences between the stack structure and the two decamer structures (Fig. 4D and E andSI Appendix, Tables S2 and S3). While the three structures do not show any major differences at the monomer level, a structural alignment of an LdcI dimer extracted from the LdcI decamer structures with a dimer extracted from the LdcI stack structure uncovers a rigid body-like rotation between monomers around a hinge region located at the monomer-to-monomer interface (SI Appendix, Tables S2 and S3and Fig. 4D). This rotation results in a 5° tilt when comparing the N-terminal wing domains in LdcI dimers, and an overall slightly decreased diameter of the central cavity inside the stacked LdcI rings (Fig. 4 D and E), which may
Fig. 2. Anti-LdcI-Nb is a useful tool to probe cellular localization of endogenous LdcI under acid stress conditions. (A) Ns-EM 3D reconstruction of the LdcI decorated by anti-LdcI-Nb. An LdcI decamer (gold, PDB ID: 3N75) and 10 nanobodies (blue, PDB ID: 1MEL, anti-lysozyme nanobody) are fitted in the density, with the nanobody binding at the top and bottom of the decameric ring. The C-terminal RavA-binding site is indicated in red and is in a spatially distinct location from the bound nanobodies. (Scale bar, 100 Å.) (B) Wide-field fluorescence microscopy image of wild-type E. coli MG1655 cells grown at pH 4.6 for 90 min stained with anti-LdcI-Nb labeled with AF488. (Inset) Zoom of the image showing punctate fluorescence patterns. (Scale bar, 5μm.)
contribute to the tight packing of each monomer into the grooves of an opposing decamer in the stack.
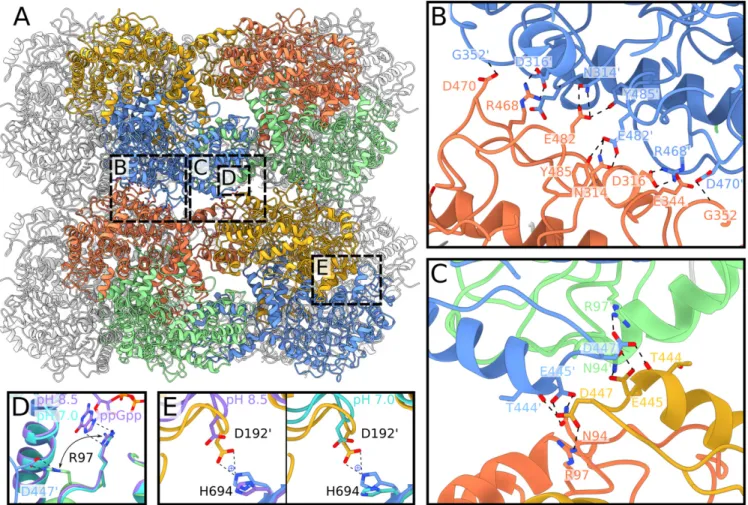
A careful examination of the LdcI stack structure shows that two major interdecamer interfaces situated at a two-fold sym-metry axis perpendicular to the stack direction contribute to stack formation (Fig. 5A). In particular, the first interface (Fig. 5B) is formed between residues R468, D470, E482, and Y485 situated in the ppGpp-binding domain (amino acids 418 to 564), and residues N314, D316, and G352 from the pyridoxal phos-phate (PLP)-binding domain (amino acids 184 to 417). R468 sits between D316′ and E344′ from a neighboring decamer, and makes electrostatic interactions through itsη1 and η2 nitrogen atoms with D316′. In addition, D470 interacts with the backbone of G352′, and E482 forms hydrogen bonds with N314′ and Y485. The second interface (Fig. 5B) is formed between residue N94 of the wing domain (amino acids 1 to 130) of one set of opposing dimers and a stretch of four residues in the ppGpp-binding domain—T444, E445, S446, and D447—at the end of helix α16 from a second set of opposing dimers. The wing domain residue N94 makes hydrogen bonds with E445′ of an opposing dimer. A second charged residue, D447, interacts with the backbone of T444′ and is held in place by R97 from the wing domain of a neighboring dimer in the same decamer.
Considering that the LdcI polymerization is induced by acid stress, we wondered which residues in the interface would be sensitive to pH changes. Surprisingly, most of the side chains involved in the interdecamer interface are charged arginine (pKa 13), aspartate, and glutamate residues (pKaof 4 and 3, respec-tively), which do not change protonation state in the pH window relevant for LdcI activity (pH 5 to 7) (36). Nonetheless, other residues, situated outside the interaction interfaces, may drive stack formation through pH-dependent interactions that would in turn lead to the observed intermonomer rotation and the as-sociated constriction of the LdcI central cavity, coupled to the alignment of complementary contacts at interfaces one and two (Fig. 4 D and E). We note for example that H694 should be protonated in the LdcI stack structure at pH 5.7 but deproto-nated in the two ring structures at pH 7.0 and pH 8.5, and that an electrostatic interaction between H694 and D192 situated in the
linker region is present in the stack structure only (Fig. 5E). The formation of this salt bridge between H694 and D192 at pH 5.7, but not at pH 7.0 or higher, may thus directly contribute to the reorientation of monomers in the LdcI dimers, tightening of LdcI decamers, and alignment of interaction interfaces leading to subsequent stack formation at low pH.
To validate the observed interactions at the interdecamer in-terface, and to assess the individual importance of key residues involved in LdcI stack formation, we constructed four LdcI point mutants (R468E, R97E, H694A, and H694N), two double mu-tants (R97E/R468E and E445A/D447A), and one triple mutant (E445A/D447A/R468E). The mutants were purified following the protocol for wild-type LdcI (Methods), diluted into a buffer at pH 5.7 and observed by ns-EM (SI Appendix, Figs. S7 and S8). Although the grid preparation procedure for ns-EM yields stacks that are shorter and more curved and distorted when compared to the cryo-EM data (Fig. 4B andSI Appendix, Figs. S7 and S8), our previous observations of the five paralogousE. coli amino acid decarboxylases justify the validity of this approach for a qualitative comparative analysis (7, 36). Ns-EM images make immediately apparent that the E445A/D447A double mutant does not have a significantly altered capability of stack formation at pH 5.7 when compared to WT LdcI, whereas the single R468E mutation is sufficient to completely abolish stack formation. The R97E mutant has a moderate destabilizing effect and displays fewer and smaller stacks then the WT LdcI. Consistent with the major role of R468 in the LdcI stack formation, the R97E/ R468E double mutant and E445A/D447A/R468E triple mutant exclusively occur as decamers at low pH. Altogether, these re-sults reveal that R468 is one of the key determinants of LdcI stack formation. Finally, similarly to the R97E mutant, a modest destabilization of stack formation is observed for the two histi-dine mutants, H694A and H694N, favoring our hypothesis that H694 may have an influence on the propensity of LdcI poly-merization at low pH (SI Appendix, Figs. S7 and S8).
Discussion
Our synergistic approach, combining several in vitro techniques including biochemical characterization of purified fluorescent
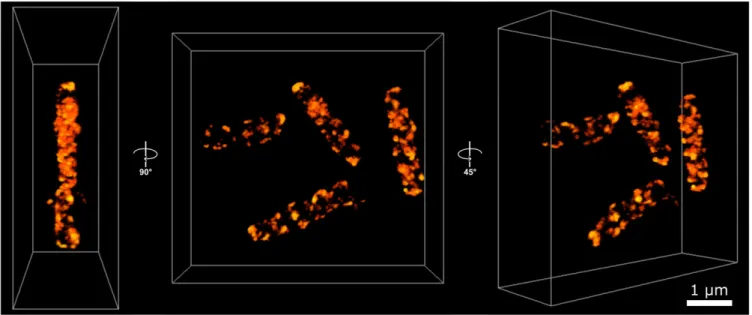
Fig. 3. Three-dimensional STORM imaging of E. coli cells stained with anti-LdcI-Nb reveal a patchy distribution of endogenous LdcI upon acid stress. The 3D-STORM imaging of native LdcI in wild-type E. coli cells 90 min after exposure to acid stress (Methods) with AF647-conjugated anti-LdcI-Nb. Points are colored according to localization density, with brighter points corresponding to higher localization density. The Center panel shows four cells in the field of view, looking down the z axis. Left and Right panels show side and tilted views, respectively. The images in this figure, as well asSI Appendix, Fig. S4andMovies S1–S6suggest a long-range stripy or pseudohelical organization of the patches. (Scale bar, 1 nm.)
BIO
protein fusions, ns-EM observation of mutants, low-resolution ns-EM reconstruction, and high-resolution cryo-EM analysis, with in vivo flow cytometry, wide-field, and 3D-STORM imaging, provides insights into the supramolecular LdcI assembly upon acid stress. This work adds to the very few known examples of regular polymerization as means of regulation of enzymes involved in amino acid metabolism in bacteria. The cryo-EM structure of the LdcI stacks presented here offers a molecular framework for future investigation of the role of LdcI polymerization in the acid stress response.
The high-resolution cryo-EM structures of the stack at pH 5.7 and of the decamer at pH 7.0 complement the previously solved crystal structure of the ppGpp-bound LdcI decamer obtained at pH 8.5. Previous serendipitous cocrystallization of LdcI with the nutrient stress response alarmone ppGpp led to assessment of
the effect of ppGpp on LdcI activity and to a proposal that ppGpp would act as an LdcI inhibitor that prevents excessive lysine consumption upon nutrient limitation during acid stress (7). In addition, a ppGpp-dependent disassembly of the LdcI stacks had already been observed but could not be structurally explained since the ppGpp-binding site is situated between two neighboring dimers inside the LdcI ring (7). Our cryo-EM structures show that one of the residues involved both in ppGpp binding and in the stack formation is arginine 97 (R97). In the crystal structure of ppGpp-bound LdcI, R97 makes a stacking interaction with the guanosine imidazole ring of ppGpp, while in LdcI stacks R97 is involved in a key interaction at the second interface (Fig. 5D), where it locks D447 in a conformation allowing interactions be-tween helices α16 from opposing LdcI decamers. Binding of ppGpp to LdcI interferes with the R97–D447 interaction, thereby
Fig. 4. Cryo-EM analysis of the LdcI decamer at neutral pH and LdcI stacks formed in acid stress conditions. (A) Cryo-EM reconstruction of the LdcI decamer at pH 7.0 from side (Left) and top (Right) views. (Scale bar, 50 Å.) (B) Cryo-EM micrograph of LdcI stacks at pH 5.7. (Scale bar, 100 nm.) (Inset) The 2D class averages displaying clear secondary structural features. (Scale bar, 100 Å.) (C) Top (above) and side (below) views of the cryo-EM reconstruction of a three-decamer LdcI stack. Four dimers are colored either blue/gold or green/coral, corresponding to the coloring of the atomic model presented in Fig. 5. (Scale bar, 50 Å.) (D) Overlay of LdcI dimers at pH 8.5 (PDB ID: 3N75, shown in lilac), 7.0 (shown in cyan), and 5.7 (shown in gold). Alignment was carried out on a single monomer in the dimer pair. There is a 5° shift in the angle between the wing domains of LdcI at pH 5.7 and pH 7.0/8.5. The Inset shows an LdcI dimer (colored blue/yellow), clipped from the map shown in C, and positioned in the same orientation as the dimers shown above. WD, wing domain. (E) Comparison of the central decamer pore diameter between LdcI at pH 8.5, 7.0, and 5.7, showing a 5 Å decrease in the pore size upon stack formation at low pH.
most likely prohibiting correct positioning of D447 at the tip of helixα16, and resulting in a disruption of the second stack inter-face, leading to a moderate yet notable stack destabilization (SI Appendix, Figs. S7 and S8). Furthermore, our cryo-EM structure of ppGpp-free LdcI decamers at neutral pH enables us to rule out the effect of ppGpp on the differences observed between the LdcI stack structure at pH 5.7 and the ppGpp–LdcI crystal structure at pH 8.5. Indeed, despite the absence of ppGpp, R97 is still oriented toward the ppGpp-binding site and away from the interdecamer interface in the pH 7.0 decamer cryo-EM map (Fig. 5D). This suggests that the conformational changes in LdcI driving stack formation are mostly driven by low pH and not by the absence of ppGpp, although the D192 and H694 hinge residues are similarly far apart in the pH 8.5 and pH 7.0 structures (Fig. 5E). Our current work provides a solid experimental and structural basis for a future closer evaluation of the hypothesized role of ppGpp in LdcI regulation in vitro and in vivo (7).
Although the optical imaging experiments performed in this study do not allow quantitative evaluation of the nature of the clusters of endogenous LdcI at the bacterial periphery, we sup-pose, based on the parallel with observations in other systems (1, 2), that they may correspond to LdcI assembled into stacks. Possible reasons for such assembly may be to provide an efficient
way to locally increase the LdcI concentration and to enhance its activity. But why would LdcI, an apparently highly soluble pro-tein, be driven toward the inner membrane? What would be the advantage for acid-stressed E. coli cells to increase the concen-tration of LdcI via stack formation in these particular peripheral locations? Localization of proteins to specific sites in the bac-terial membrane was shown to be generally driven by chemical factors such as the phospholipid composition of the lipid microdomains and by physical factors such as the degree of local curvature or the electric potential of the membrane (37). An attractive hypothesis would be that as an acid stress response protein performing a proton-consuming enzymatic reaction, LdcI may be attracted to proton sinks formed by anionic phos-pholipids which compartmentalize oxidative phosphorylation (OXPHOS) complexes for efficient functioning in bacterial res-piration and adaptation to environmental changes. Indeed, OXPHOS complexes were often described to be unevenly dis-tributed in the membrane in the form of mobile patches (38–42), providing evidence for highly dynamic and spatially organized bioenergetic membranes inE. coli cells (42). In addition, certain bacterial flottilins, which are essential scaffold proteins of the functional membrane microdomains, equivalent to the lipid rafts of eukaryotic cells, also show a patchy distribution and were
Fig. 5. Structural insights into molecular determinants of the LdcI polymerization under acid stress conditions. (A) Atomic model of a two-decamer LdcI stack at pH 5.7. Dimers are colored as shown in the cryo-EM map in Fig. 4. Dashed boxes annotated with“B,” “C,” “D,” and “E” on the two-decamer stack indicate the locations of the zooms shown in B–E. (B) Closeup of the first decamer–decamer interface, which includes the key stack-forming residue R468. (C) Closeup of the second decamer–decamer interface. (D) Overlay of the LdcI decamer structures at pH 8.5 and 7.0 with the LdcI stack structure at pH 5.7, focused on R97. R97 in the LdcI stack (green) adopts a different conformation compared to the one in the pH 8.5 crystal structure (purple, with ppGpp bound) and the pH 7.0 cryo-EM map (cyan, without ppGpp bound). Despite the absence of ppGpp in the pH 7.0 sample, R97 is still oriented toward the ppGpp-binding site. (E) Comparison between the H694–D192′ distance in the LdcI stack at pH 5.7 (colored gold and blue), the LdcI decamer at pH 8.5 (Left, colored purple), and pH 7.0 (Right, colored cyan). Key residues are labeled for all panels, and interactions are shown with dotted lines.
BIO
shown to interact with specific OXPHOS complexes (42, 43). In this regard, two different lines of evidence would be interesting to note. First, LdcI was described to copurify with a partially assembled complex I (44), whereas the LdcI-binding partner RavA, as well as ViaA, the second protein expressed from the ravAviaA operon and which also interacts with RavA, were shown to interact with both complex I and fumarate reductase (31, 32). Second, the otherE. coli PLP-dependent lysine decar-boxylase LdcC, exercising the role of cadaverine biosynthesis irrespectively of acid stress (45), neither binds RavA nor forms stacks (29, 36), despite its 69% identity with LdcI. It is interesting to note that in LdcC the key stack-forming residue R468 has been substituted for an alanine while the interacting D316 has been preserved.
Our STORM images suggest that individual patches have a peripheral distribution with a long-range stripy or pseudohelical organization (Fig. 3,SI Appendix, Fig. S4, andMovies S1–S6). While similar distributions have been documented for bacterial cytoskeletal, cell division, chromosome partitioning, RNA deg-radation, and secretion machineries, the impact on these distri-butions of FPs and other tags used for labeling, demonstrated specifically for YFP-MreB (46), warrants caution in their inter-pretation (14, 47). In contrast, here we observed endogenous wild-type LdcI labeled with anti-LdcI-Nb, which means that the resulting pattern is likely real. Admittedly, we cannot completely exclude a potential perturbation by the employed fixation and permeabilization procedures. Nevertheless, examination of published images of OXPHOS patches (for example ref. 40) also hints to a similar organization. Excitingly, anionic phospholipid-specific dyes and fluorescently labeled antibiotics phospholipid-specific for nascent peptidoglycan synthesis upon cell elongation were also proposed to be distributed on helical or stripe patterns (37, 48–51). It is therefore tempting to imagine that inside the bac-terial cell, LdcI has a tendency to follow a general path upon polymerization governed by the underlying chiral patterns in the cell envelope (52).
Finally, from the methodological view, our work convincingly illustrates that different FP fusion constructs can share the same cellular distribution despite a completely different structure, ne-cessitating caution when inferring intact function from the pres-ervation of the protein localization inside the cell. Our findings emphasize the importance of characterizing FP fusions using both biochemical and structural techniques, such as ns-EM, to ensure that the FP tag disrupts neither structure nor function of the target protein.
Methods
Expression Constructs. For fluorescence studies, several FP fusion constructs were generated starting from an available plasmid containing the coding sequence of LdcI (Uniprot entry P0A9H3), cloned in the pET22b(+) vector with a C-terminal 6xHis-tag (7). All constructs were generated using the Gibson cloning strategy and verified by sequencing analysis. The Gibson assembly was performed using 0.4 U T5 exonuclease, 2.5 U Phusion polymerase, and 400 U Taq ligase (New England Biolabs) in 1× ISO buffer consisting of 100 mM Tris·HCl pH 7.5, 10 mM MgCl2, 0.8 mM dNTP mix, 10 mM
dithio-threitol (DTT), 50 mg polyethylene glycol (PEG)-8000, 1 mM nicotinamide adenine dinucleotide (NAD). A total of 7.5μL of the Gibson Master Mix was mixed with 2.5μL DNA, containing ∼100 ng of vector. The mix was incu-bated for 60 min at 50 °C. Transformations were performed in Top10 com-petent bacteria (One Shot TOP10 chemically comcom-petent E. coli, Invitrogen) and selected using 100 μg/mL ampicillin or 50 μg/mL kanamycin sulfate (Euromedex). Agarose gel purification and DNA plasmid extraction kits were purchased from Macherey-Nagel.
Dendra2T69A–LdcI and mGeosM–LdcI were both cloned in the pET-TEV
vector containing an N-terminal 6xHis-tag and a TEV cleavage site be-tween Denda2T69Aor mGeosM and the LdcI gene. LdcI–Dendra2T69Aand
LdcI–mGeosM were both cloned in the pET22b(+) vector with LdcI followed by either Dendra2T69Aor mGeosM containing an uncleavable C-terminal
6xHis-tag.
The anti-LdcI-Nb was obtained from the nanobody generation platform of the Architecture et Fonction des Macromolécules Biologiques (AFMB) laboratory (Marseille, France). A llama (Llama glama) was immunized with the purified wild-type LdcI. Lymphocytes were isolated from blood sam-ples, a nanobody phage display library was generated, and enrichment of antigen-specific clones was performed using standard procedures (53, 54). Sequences of three positive clones were subcloned in the pHEN6 vector containing the pelB leader sequence from Erwinia carotovora for secretion into the periplasm, and a C-terminal 6xHis-tag (kindly provided by Aline Desmyter, AFMB, Marseille, France). One of the clones was used for the present study to yield anti-LdcI-Nb.
Plasmids, primers, and cloning strategy are summarized inSI Appendix, Table S4.
Protein Purification. LdcI–FP fusions and LdcI mutants were expressed in BL21(DE3) cells grown in Luria-Bertani (LB) medium supplemented with 100μg/mL ampicillin or 50 μg/mL kanamycin sulfate. Protein expression was induced using 40 μM isopropyl β-D-1-thiogalactopyranoside (IPTG, Euro-medex) and carried out overnight at 18 °C. The LdcI–FP fusions and LdcI mutants were purified as previously described for wild-type LdcI (27, 29, 36), in a final buffer containing 25 mM Hepes (pH 7.0), 0.3 M NaCl, 5% glycerol, 1 mM DTT, and 0.1 mM PLP.
The anti-LdcI-Nb was expressed in E. coli WK6 cells, following the protocol described in ref. 53, and purified with immobilized metal affinity chroma-tography (IMAC, using a Ni-NTA column) followed by SEC using a superdex 75 increase 10/300GL column (GE-Healthcare) equilibrated with a buffer containing 25 mM Tris pH 7.4 and 0.3 M NaCl.
In order to characterize the LdcI complex with anti-LdcI-Nb, the two proteins were mixed at a 1:5 molar ratio and submitted to size exclusion chromatography as carried out for LdcI alone but without DTT in the buffer. The top of the peak was taken for subsequent ns-EM analysis.
Ns-EM on LdcI–FP Fusions, LdcI/anti-LdcI-Nb, and LdcI Mutants. FP fusion samples after gel filtration were diluted to a concentration of∼0.025 mg/mL. A total of 3μL was applied to the clean side of carbon on a carbon–mica interface and stained with 2% uranyl acetate (mGeosM–LdcI, LdcI–mGeosM, LdcI–Dendra2T69A, LdcI/anti-LdcI-Nb, LdcI mutants) or 2% sodium
silico-tungstate (Dendra2T69A–LdcI). Images were collected on a 120-kV Tecnai T12
microscope with an Orius 1000 camera (Gatan) or on a 200-kV Tecnai F20 electron microscope with either a OneView camera (Gatan) or a Ceta camera (Thermo Scientific). All images were collected with a defocus range of ap-proximately−1.0 μm to −2.0 μm and with pixel sizes between 2.29 Å/pixel and 3.42 Å/pixel.
Image Processing of LdcI–FP and LdcI/anti-LdcI-Nb. Thirty-six micrographs of Dendra2T69A–LdcI with a pixel size of 2.73 Å/pixel, 368 micrographs of
mGeosM–LdcI with a pixel size of 2.29 Å/pixel, 23 micrographs of LdcI– Dendra2T69A, 92 micrographs of LdcI–mGeosM with a pixel size of 3.42 Å/pixel,
and 124 micrographs of LdcI/anti-LdcI-Nb with a pixel size of 2.82 Å/pixel were used for image analysis.
Contrast transfer function (CTF) estimation was performed with CTFFIND3 (55). Semiautomatic particle selection was carried out with BOXER (56), with box sizes of 98 × 98 pixels for Dendra2T69A–LdcI, 180 × 180 pixels for
mGeosM–LdcI, 128 × 128 pixels for LdcI–Dendra2T69A, and LdcI–mGeosM,
and 112× 112 pixels for LdcI/anti-LdcI-Nb, respectively. Particle extraction followed by several rounds of cleaning by two-dimensional (2D) classifica-tion in RELION 1.4 (57), resulted in the following number of particles for each dataset: Dendra2T69A–LdcI = 7,140, mGeosM–LdcI = 5,514, LdcI–
Dendra2T69A= 832, LdcI–mGeosM = 12,211, and LdcI/anti-LdcI-Nb = 14,075.
For Dendra2T69A–LdcI, initial model generation was carried out in RELION
2.1 (58) without any symmetry applied. For mGeosM–LdcI, initial model generation was carried out in RELION 2.1 with either C1, C3, or D3 symmetry applied. The results of all three calculations being very similar, the model with applied D3 symmetry was selected. For LdcI–Dendra2T69A, LdcI–
mGeosM, and LdcI/anti-LdcI-Nb, the previously determined LdcI decamer structure (PBD ID: 3N75) was filtered to 60 Å and used as an initial model for 3D refinement.
The 3D refinement was carried out for each dataset with applied C2 symmetry for Dendra2T69A–LdcI, D3 symmetry for mGeosM–LdcI, and D5
symmetry for LdcI–Dendra2T69A, LdcI–mGeosM, and LdcI/anti-LdcI-Nb. Rigid
body fitting of LdcI (PBD ID: 3N75), mEos2 (PDB ID: 3S05), and Dendra2 (PDB ID: 2VZX) crystal structures was then carried out in Chimera (59) for the five datasets.
Cryo-EM on LdcI Stacks (pH 5.7). Wild-type LdcI was purified as previously described (11) from an E. coli strain impaired in the production of ppGpp (MG1655ΔrelAΔspoT) in order to avoid any serendipitous ppGpp binding. Purified LdcI was diluted to a final concentration of∼0.25 mg/mL in a buffer containing 25 mM 2-(N-morpholino)ethanesulfonic acid (MES, pH 5.7), 0.3 M NaCl, 5% glycerol, 1 mM DTT, and 0.1 mM PLP. A total of 3μL of the sample was applied to a glow-discharged R 2/1 300 mesh holey carbon copper grid (Quantifoil Micro Tools GmbH) and plunge frozen in liquid ethane using a Vitrobot Mark IV (FEI) operated at 100% humidity. Datasets were recorded at the European Synchrotron Radiation Facility in Grenoble, France (60), on a Titan Krios microscope (Thermo Scientific) equipped with a BioQuantum LS/967 energy filter (Gatan) and a K2 summit direct electron detector (Gatan) operated in counting mode. A total of 2,564 movies of 30 frames were collected with a total exposure of 6 s, total dose of 29.3 e−/Å2, and a slit
width of 20 eV for the energy filter. All movies were collected at a magni-fication of 130,000× g, corresponding to a pixel size of 1.052 Å/pixel at the specimen level. A summary of cryo-EM data collection parameters can be found inSI Appendix, Table S1.
Image Processing of LdcI Stacks (pH 5.7). Motion correction and dose weighting of the recorded movies were performed using MotionCor2 (61). CTF parameters were determined on the aligned and dose-weighted sums using CTFFIND4 (62). After manual inspection of the dose-weighted sums, the best 558 (21.7%) micrographs were selected for further processing. LdcI stacks were manually picked using e2helixboxer in EMAN2 (63). A total of 15,165 LdcI-stack particles were extracted in RELION 3.0 (64) with an extract size of 320 pixels, resulting in boxes containing three LdcI decamers, and with the --helix option with an outer diameter of 160 pixels and a helical rise of 77 pixels. After particle extraction, particle CTF correction was per-formed using Gctf (65). Extracted particles were subjected to 2D classifica-tion in RELION 3.0, resulting in a cleaned dataset containing 15,157 particles. Initial 3D refinement with imposed D5 symmetry was carried out in RELION 3.0, using an initial model generated by manually stacking three LdcI dec-amers (PDB ID: 3N75) in Chimera (59) and low-pass filtering the resulting LdcI stack to 40 Å. The resulting 4.3-Å resolution 3D reconstruction, along with the cleaned particle stack, was subsequently imported into CryoSPARC (66). A final homogeneous 3D refinement in CryoSPARC, using a dynamic mask and imposing D5 symmetry, resulted in a map with a resolution of 3.28 Å based on the 0.143 gold-standard Fourier shell correlation (FSC) criterion (67). The final map was sharpened using a B-factor of−96 Å2. A local
res-olution estimation of the final 3D reconstruction was calculated in RELION 3.0. A summary of cryo-EM data collection parameters and image processing steps for LdcI stacks can be found inSI Appendix, Table S1 and Fig. S5, with local resolution and FSC curves shown inSI Appendix, Fig. S6.
Cryo-EM on LdcI Decamers (pH 7.0). Purified LdcI was dialyzed into a buffer at pH 7.0 and diluted to a concentration of 0.25 mg/mL. A total of 3μL of diluted sample was applied to a glow-discharged (R 2/1 300 mesh holey carbon copper grid (Quantifoil Micro Tools GmbH) and plunge frozen in liquid ethane using a Vitrobot Mark IV (FEI) operated at 100% humidity. Images were recorded on a Glacios microscope (Thermo Scientific) equipped with a Falcon II direct electron detector (Thermo Scientific). A total of 2,772 movies of 29 frames were collected with a total exposure of 1.5 s and a total dose of 45 e−/Å2. All movies were collected at a magnification of 116,086×,
corre-sponding to a pixel size of 1.206 Å/pixel at the specimen level.
Image Processing of LdcI Decamers (pH 7.0). Motion correction was carried out using patch motion correction in CryoSPARC, discarding the first two frames. Initial CTF estimation was then carried out on summed frames using CTFFIND4. A subset of 600 micrographs were subjected to automatic picking using the blob picker in CryoSPARC, resulting in∼238,000 picked particles. Particles were then extracted with a box size of 256× 256 and subjected to 2D classification. Particles from the best classes showing clear secondary structural features for LdcI were selected for homogeneous refinement (with applied D5 symmetry) against EMD-3204 low-pass filtered to 30 Å, resulting in a reconstruction with a resolution of 4.2 Å (FSC= 0.143). This reconstruction was then used to create templates for picking the entire dataset using the template picker in CryoSPARC, after filtering to 12 Å. A total of∼796,000 particles were extracted and subjected to 2D classification, and the best∼428,000 particles were subjected to heterogeneous refine-ment with applied D5 symmetry against the 4.2-Å map, resulting in one higher-resolution class corresponding to∼229,000 particles. These particles were subjected to homogeneous refinement with applied D5 symmetry, resulting in a map with a resolution of 2.76 Å (FSC= 0.143) which was then sharpened with a B-factor of−173 Å2. A summary of cryo-EM data collection
parameters and image processing steps for LdcI decamers can be found in
SI Appendix, Table S1 and Fig. S5, with local resolution and FSC curves shown inSI Appendix, Fig. S6.
Fitting of Structures and Refinement. For fitting of atomic models in the 3D reconstructions of LdcI at pH 5.7 (stack) or pH 7.0 (decamer), two (for the stack) or one copy (for the decamer) of the LdcI X-ray crystal structure (PDB ID: 3N75) were first rigid-body fitted in the corresponding 3D reconstruc-tions using Chimera. Refinement was performed using the Phenix soft-ware package (68) and was identical for both 3D reconstructions. A first round of real space refinement was carried out with enabled rigid-body, global minimization, local grid search and atomic displacement parameter (ADP) refinement parameters, and imposing rotamer, Ramachandran, non-crystallographic symmetry (NCS), and reference model (PDB ID: 3N75) re-straints. After several rounds of manual correction in Coot (69), a final round of real space refinement was then performed using the same settings, but without rigid body refinement and without applying reference restraints, and setting the“nonbonded_weight” parameter to 500. A summary of re-finement and model validation statistics can be found in SI Appendix, Table S1.
pH Shift Experiment. Stationary phase cultures, which were grown overnight from single colonies in LB medium, were diluted to OD600∼0.01 and regrown
at 37 °C within∼1 h 45 min in fresh LB medium to an OD600of 0.1. From this
culture, 14 mL was transferred to 15-mL Falcon tubes and pelleted by cen-trifugation at room temperature for 5 min. The supernatant was decanted, whereby systematically around 200μL LB remained in the Falcon tube. The pellet of bacteria was resuspended and afterward, LB-4.6 containing 30 mM
L-lysine was added to the cells up to 14 mL. To prepare LB-4.6 medium, LB powder (Sigma-Aldrich) was completely dissolved in distilled water by stirring for 30 min. The pH of 4.6 was then adjusted using HCl. After auto-claving, sterile filteredL-lysine was added to LB-4.6. For this,L-lysine was dissolved in an aliquot of LB-4.6, sterile filtered, and mixed with the remaining LB-4.6. A total of 30 mML-lysine was used. In order to grow the culture under oxygen-limiting conditions, the lid of the Falcon tube was closed and the tubes were placed at 37 °C on a shaker (150 rpm). After defined time points, aliquots were taken for OD600 measurement, pH
measurement, sodium dodecyl sulphate–polyacrylamide gel electrophoresis (SDS-PAGE), or immunofluorescence. For each time point, a new tube was opened and not reused further.
Western Blotting. SDS-PAGE was performed with a Bio-Rad electrophoresis chamber using standard 12% reducing SDS-PAGE gels. Proteins were trans-ferred to a nitrocellulose membrane (Bio-Rad) using a Trans-Blot Turbo Transfer System (Bio-Rad). The membrane was blocked for 1 h using 5% bovine serum albumin (BSA) in Tris-buffered saline (TBS) buffer supple-mented with 0.1% Tween (TBS-T). Afterward, the membrane was incubated for 1 h with an anti-LdcI antibody (Qalam-Antibodies) in BSA/TBS-T (1:5,000). The membrane was subsequently washed 3× 10 min in TBS-T and incubated for 1 h with horseradish peroxidase (HRP)-coupled anti-rabbit antibody (1:10,000 in BSA/TBS-T). Finally the membrane was washed 3× 10 min in TBS-T. The membrane was rinsed once with TBS, prior to detection of antibody-labeled proteins using ECL reagent (GE Heathcare). Incubation and detection of antibody were performed at 25 °C.
Nanobody Labeling. For the labeling reaction, 50μL nanobody (i.e., 200 μg) was pipetted into a 1.5-mL tube, placed on ice, and supplemented with 5.5μL of 1 M bicarbonate buffer at pH 8.3. A total of 100 μg of Alexa-647 or Alexa-488 N-hydroxysuccinimide (NHS) ester dye (Life Technologies, A37573 and A20000) were dissolved in 10 μL dimethyl sulfoxide (DMSO) to final concentration of 10 mg/mL. A total of 5μL (i.e., 40 nmol) dye in DMSO was added to the protein and incubated for 1 h at room temperature in a shaking block, covered with an aluminum foil to protect the dye from the light. Excess dye was removed by iterative buffer exchange using a 3K spin column (Amicon-Ultra-4 Centrifugal Filters Ultracell 3K, Millipore UFC800396) to phosphate buffered saline (PBS). The degree of labeling was inferred from measuring the OD.
Cell Preparation for Immunofluorescence Staining of E. coli Cells with Nanobodies. For immunofluorescence staining, cells were subjected to a pH shift in order to induce LdcI expression, as described in the pH Shift Exper-iment above. At 90 min after the pH shift, the OD600of the cell culture was
measured, and the volume of cells corresponding to OD= 4, with OD = 1 corresponding to about 8× 10⁸cells per mL, were collected by
centrifuga-tion. After removal of LB by pipetting, cells were resuspended in 2 mL of
BIO
4% formaldehyde (FA) in PBS (made from 16% formaldehyde solution, methanol-free from Thermo Scientific). Falcons were placed on a rotor for constant agitation for 45 min at room temperature. After fixation, cells were collected by centrifugation and the solution was removed by pipetting. Cells were then resuspended in 14 mL PBS (Gibco, Thermo Scientific) to remove and dilute the fixative. Cells were permeabilized for 10 min using 2 mL 0.1% Triton X-100 in PBS and subsequently washed three times with 10 mL PBS. Finally, cells were transferred to 1.5-mL tubes, centrifuged, and resuspended in 200μL 1% BSA/PBS (BSA/PBS solution was dissolved for 30 min and sterile filtered to avoid clumps). After 30 min of incubation, 0.5μg anti-LdcI-Nb, labeled with the dedicated dye, was added to the 200μL bacteria BSA/PBS suspension. Cells were incubated with the labeled anti-LdcI-Nb for 16 h at 4 °C. The next day, cells were washed three times with 1 mL PBS, centrifuged to remove antibody solution, and resuspended in 250μL PBS. When needed, Hoechst 33342 (Sigma-Aldrich) was added to a final concentration of about 100 ng/mL.
Wide-Field Imaging and Flow Cytometry. For epifluorescence imaging, 2μL of cells was placed between a glass slide and a coverslip, which had been carefully pressed together, and observed using an inverted IX81 microscope, with a UPLFLN 100× oil immersion objective (numerical aperture [N.A.] 1.3) (Olympus), using the appropriate specific excitation and emission filters for AF488 (GFP-3035B set, Semrock) and DAPI (DAPI-5060B set, Semrock). Ac-quisitions were performed with Volocity software (Quorum Technologies) with a sCMOS 2048× 2048 camera (Hamamatsu ORCA Flash 4, 16 bits/pixel) achieving a final magnification of 64 nm per pixel. For flow cytometry, 50μL of cell suspensions were injected in a MACSQuant VYB flow cytometer (Miltenyi Biotech) using the 488-nm excitation and 525/50-nm emission channel (B1). AF488 positive populations were estimated after forward scatter and side scatter gating on the cells. Data were further processed with MACSQuantify software (Miltenyi Biotech).
STORM Imaging. For single molecule localization microscopy, cells were transferred to a glucose buffer containing 50 mM NaCl, 150 mM Tris (pH 8.0), 10% glucose, 100 mM MEA (mercaptoethylamine) and 1× Glox. Glox was prepared as a 10× stock and contained 1 μM catalase and 2.3 μM gluco-seoxidase. Menzel glass slides (Thermo Scientific) and precision coverslips (1.5H from ThorLabs) were cleaned for 30 min using an ultraviolet (UV)-ozone cleaning device (HELIOS‐500, UVOTECH Systems). A total of 2 μL of immunolabeled cells was placed onto a glass slide and covered with the coverslip, then cells were carefully spread by pressing glass slides firmly to-gether and the sides were sealed with transparent nail polish to avoid evaporation. Mounted samples were imaged on a homemade SMLM set up based on an IX81 microscope (Olympus). STORM was performed by focusing a 643-nm excitation laser beam (Toptica Diode laser) to the back focal plane of an oil immersion UAPON100X (N.A. 1.49) objective. The intensity of the laser was tuned using an Acousto-Optical Tunable Filter (OATF, Quanta Tech). Acquisition was obtained with a 16 bits/pixel Evolve 512 electron-multiplying charge-coupled device (EMCCD, Photometrics) using Meta-morph (Molecular Devices), for a final pixel size of 123 nm. Three-dimensional STORM based on point-spread-function astigmatism (70) was performed using a cylindrical lens (LJ1516L1-A, Thorlabs) placed in the detection light path. STORM datasets consisting of about 30,000 frames, using a 643-nm laser power density of 3 kW/cm2and a 405-nm laser power density of up to 1 W/cm2
and a frametime of 50 ms, were acquired with an EMCCD gain set to 200. Three-dimensional point spread function calibration was achieved using
tetraspec beads. Finally, data were processed with the Thunderstorm plugin (71) in ImageJ (72). Three-dimensional images were rendered with Visp (73) using a minimum neighbor density threshold of 20 to 28. A total of about 25,000 localizations with a median localization precision of∼17 nm were recorded per cell. Due to the long-lived and potentially environmentally de-pendent blinking of AF647, we refrained from attempting a quantitative evaluation of the LdcI molecular copy number from our STORM data. Never-theless, the data appear consistent with earlier estimations (500 to 1,000 LdcI decamers per cell) (7, 30), assuming 100% labeling efficiency and an average of approximately three blinking events per molecule.
Biolayer Interferometry Measurements. For BLI binding studies, RavA with a biotinylated C-terminal AviTag was expressed and purified as previously described (28). BLI experiments were performed in 1× Hepes buffered saline (HBS) with a pH of 7.0 (25 mM Hepes, 300 mM NaCl, 10 mM MgCl2,
10% glycerol) supplemented with 1× kinetics buffer (0.1% wt/vol BSA, 0.02% vol/vol Tween-20), 1 mM ADP, 1 mM DTT, and 0.1 mM PLP. Experiments were performed using the BLItz System instrument (FortéBio), operated at room temperature. Before the start of each BLI experiment, RavA-AviTag was incu-bated with 1 mM ADP for 10 min. Streptavidin-coated biosensors (FortéBio) were functionalized with biotinylated RavA-AviTag, then quenched with 10μg/mL biocytin. Experiments with the wild-type LdcI are adapted from ref. 28. For C-terminal LdcI–FP fusions, pins were dipped in wells containing a range of LdcI–FP concentrations from 0 to 1,000 nM, with no binding signal recorded at any concentration of LdcI–FP.
Data Availability. Cryo-EM maps, along with the corresponding fitted atomic structures, have been submitted to the EM Data Bank (EMDB) and Protein Data Bank (PDB) with accession codesEMD 10850and PDB6YN6for LdcI stacks (pH 5.7), andEMD 10849and PDB6YN5for LdcI decamers (pH 7.0). ACKNOWLEDGMENTS. We thank Guy Schoehn for establishing and manag-ing the cryoelectron microscopy platform, Emmanuelle Neumann for pro-viding initial training, and Rose-Laure Revel-Goyet and Françoise Lacroix for support and access to the M4D Cell Imaging Platform. We are grateful to Aymeric Peuch for help with the usage of the EM computing cluster and Daniel Thédie, Kévin Floc’h, and Joel Beaudoin for discussions. We thank Alain Roussel and Aline Desmyter for the nanobody production and Julien Perard for help with the cloning of the Dendra2T69A–LdcI construct. We
ac-knowledge the European Synchrotron Radiation Facility for provision of beam time on CM01. This work was funded by the European Union’s Horizon 2020 research and innovation programme under grant agreement 647784 to I.G. The nanobody generation platform of the AFMB laboratory (Marseille, France) was supported by the French Infrastructure for Integrated Structural Biology (FRISBI) ANR-10-INSB-05-01. For electron and fluorescence microscopy studies, this work used the platforms of the Grenoble Instruct-ERIC Centre (Integrated Structural Biology [ISBG]; UMS 3518 Centre National de recherche Scientifique, Commissariat à l’énergie atomique et aux énergies alternatives, Université Grenoble Alpes, European Molecular Biology Laboratory [CNRS-CEA-UGA-EMBL]) with support from FRISBI INSB-05-02) and GRAL (ANR-10-LABX-49-01) within the Grenoble Partnership for Structural Biology. The electron microscope facility (Glacios electron microscope) is supported by the Rhône-Alpes Region (Fonds Européen de Développement Régional), the Fondation Recherche Médicale (FRM), the CNRS, the University of Gre-noble and the Groupement d’Intérêt Scientifique Infrastrutures en Biologie Sante et Agronomie (GIS-IBISA). J.F. was supported by a long-term European Molecular Biology Organization (EMBO) fellowship (ALTF441-2017) and a Marie Skłodowska-Curie actions individual fellowship (789385, RespViRALI).
1. C. K. Park, N. C. Horton, Structures, functions, and mechanisms of filament forming enzymes: A renaissance of enzyme filamentation. Biophys. Rev. 11, 927–994 (2019).
2. M. Prouteau, R. Loewith, Regulation of cellular metabolism through phase separation of enzymes. Biomolecules 8, 160 (2018).
3. F. C. Fang, E. R. Frawley, T. Tapscott, A. Vázquez-Torres, Bacterial stress responses during host infection. Cell Host Microbe 20, 133–143 (2016).
4. N. Watson, D. S. Dunyak, E. L. Rosey, J. L. Slonczewski, E. R. Olson, Identification of elements involved in transcriptional regulation of the Escherichia coli cad operon by external pH. J. Bacteriol. 174, 530–540 (1992).
5. J. W. Foster, Escherichia coli acid resistance: Tales of an amateur acidophile. Nat. Rev. Microbiol. 2, 898–907 (2004).
6. P. L. Moreau, The lysine decarboxylase CadA protects Escherichia coli starved of phosphate against fermentation acids. J. Bacteriol. 189, 2249–2261 (2007). 7. U. Kanjee et al., Linkage between the bacterial acid stress and stringent responses:
The structure of the inducible lysine decarboxylase. EMBO J. 30, 931–944 (2011). 8. E. F. Gale, The bacterial amino acid decarboxylases. Adv. Enzymol. Relat. Areas Mol.
Biol. 6, 1–32 (1946).
9. D. L. Sabo, E. A. Boeker, B. Byers, H. Waron, E. H. Fischer, Purification and physical properties of inducible Escherichia coli lysine decarboxylase. Biochemistry 13, 662–670 (1974).
10. E. F. Gale, H. M. R. Epps, The effect of the pH of the medium during growth on the enzymic activities of bacteria (Escherichia coli and Micrococcus lysodeikticus) and the biological significance of the changes produced. Biochem. J. 36, 600–618 (1942). 11. E. Kandiah et al., Structural insights into the Escherichia coli lysine decarboxylases and
molecular determinants of interaction with the AAA+ ATPase RavA. Sci. Rep. 6, 24601 (2016).
12. B. Zhao, Investigation of the Regulation of the Lysine Decarboxylase LdcI Activity by the Alarmone ppGpp and MoxR Family AAA+ ATPase RavA (University of Toronto, 2012).
13. I. V. Surovtsev, C. Jacobs-Wagner, Subcellular organization: A critical feature of bacterial cell replication. Cell 172, 1271–1293 (2018).
14. W. Margolin, The price of tags in protein localization studies. J. Bacteriol. 194, 6369–6371 (2012).
15. A. Gahlmann, W. E. Moerner, Exploring bacterial cell biology with single-molecule tracking and super-resolution imaging. Nat. Rev. Microbiol. 12, 9–22 (2014).