HAL Id: hal-02993397
https://hal.archives-ouvertes.fr/hal-02993397
Submitted on 6 Nov 2020HAL is a multi-disciplinary open access archive for the deposit and dissemination of sci-entific research documents, whether they are pub-lished or not. The documents may come from teaching and research institutions in France or abroad, or from public or private research centers.
L’archive ouverte pluridisciplinaire HAL, est destinée au dépôt et à la diffusion de documents scientifiques de niveau recherche, publiés ou non, émanant des établissements d’enseignement et de recherche français ou étrangers, des laboratoires publics ou privés.
Physiological effects (heart rate, respiration rate and
EEG) of rapid relaxation devices with sensorial
immersion: a pilot study
Norma Gomes, Sepideh Iranfar, Kostiantyn Maksymenko, Slah Aridhi, Alice
Guyon
To cite this version:
Norma Gomes, Sepideh Iranfar, Kostiantyn Maksymenko, Slah Aridhi, Alice Guyon. Physiological effects (heart rate, respiration rate and EEG) of rapid relaxation devices with sensorial immersion: a pilot study. Journal of Interdisciplinary Methodologies and Issues in Science, Journal of Interdisci-plinary Methodologies and Issues in Science, 2020, Vol. 9 - Methods to assess the effects of sensory stimulations on wellness, �10.18713/JIMIS-021120-9-2�. �hal-02993397�
Physiological effects (heart rate, respiration rate and EEG) of rapid relaxation
devices with sensorial immersion: a pilot study
Norma GOMES1#, Sepideh IRANFAR2#, Kostiantyn MAKSYMENKO3, Slah ARIDHI2 and Alice
GUYON*1
1 - Université Côte d’Azur- CNRS UMR 7275- IPMC- Gérard Lambeau’s Laboratory - 660 route des Lucioles-06560 Valbonne, France
2 - Sensoria Analytics- Business Pole- 1047 Route des Dolines, Allée Pierre Ziller, 06560 Valbonne, France 3 - Université Côte d’Azur- INRIA-Sophia Antipolis-Méditerranée 2004 Route des Lucioles, 06902
Valbonne, France
*Correspondance : alice.guyon@ipmc.cnrs.fr # both authors contributed equally to the work
DOI : 10.18713/JIMIS-021120-9-2
Soumis le Quatre Avril Deux mille vingt – Publié le 2 novembre 2020
Volume: 9 – Year: 2020
Volume title: Methods to assess the effects of sensory stimulations on wellness Editors: Martine Adrian-Scotto, Gabriel Gandolfo, Sandra Perez
Abstract
Rapid relaxation devices developed by private companies propose rapid solutions to fight against stress or anxiety. However, there have been insufficient scientific studies on these devices. In a previous article, we evaluated the variation of 15 physiological and psychological parameters before
and after relaxation in 4 groups of participants using 3 different rapid (15 minute) relaxation devices
with sensorial immersion and a control group using no device. This pilot study included 40 participants, 12 males and 28 females, aged 27-68 years old with an average of 42.7 ± 11.5 years old and showed that some parameters were more relevant for the analysis of these relaxation devices and suggested some differences in the relaxation processes between devices. We hypothesized that by analyzing physiological parameters recorded during the rapid relaxation process in the same population, we could unravel the previously observed pre-post treatment variations. The measurements included brain wave electroencephalography (Muse2 EEG) recordings, respiration rhythm (mechanical abdominal movements) and heart rate variability parameters (PPG signals). The objective of the study was to identify the physiological parameters recorded during relaxation of interest to discriminate the groups and to study the effects of the devices on these parameters. The EEG recordings showed differences in dominant waves between groups. In addition, the Be-Breathe intervention group exhibited a decreased respiration rate compared to the control group, and a simultaneous increase in heart rate variability parameters, while other groups showed less significant variations in their respiration or heart rate variables, which was confirmed by a k-means cluster analysis.
We discuss how these variations observed during rapid relaxation could contribute to the differences that we previously observed pre and post relaxation interventions. Finally, we built a model to determine which parameters discriminate best between the groups.
Keywords
sensorial immersion relaxation devices, EEG, PPG, respiration rate, heart rate variability, random forest
I INTRODUCTION
Stress and anxiety are considered hallmarks of developed societies (Miller & Kirschbaum, 2019). To meet the increasing demand for relaxation and well-being interventions that support stress management approaches, several companies have developed relaxation immersion installations and technology-assisted relaxation devices (Culbert, 2017). Increasing evidence confirms the benefits of longer-term approaches, such as several weeks of yoga and/or meditation training (Goyal et al., 2014;Pal et al., 2014; Pascoe et al., 2017; Saeed et al., 2019). However, no scientific studies exist for one-off, short duration techniques (Culbert, 2017). Therefore, the stress reduction efficacies of such techniques are not known, nor are the physiological and psychological consequences of the use of such devices.
This pilot study aims to analyze three different rapid relaxation sensorial immersion devices compared to a control group, where no device was employed by testing their effectiveness on various aspects of relaxation. The three devices have been previously described in Gomes et al., 2020 (companion paper in this volume). Briefly, group 2 (G2) tested the Neural Up device: this solution was developed by iCare Sciences, and is composed of a patented acoustic technology based on relaxing sound frequencies (Tibetan sounds) that alternate between right and left ears, giving a sensation of spatialized sound around the body. Group 3 (G3) tested the Ino-Sens Be-Breathe device: this features a warming armchair with a back massage and swing, which is synchronized with the respiratory rhythm and communicates audio-respiratory instructions to the subject to inhale for 5 seconds and exhale for 5 seconds. Group 4 (G4) tested the Cobtek laboratory “Relax Room”: a relaxation cabin that was employed to present a 3D-movie containing virtual images of a realistic universe and then of a fantasy world on an island, with animals (butterfly, turtles) followed by virtual immersion in the water. The movie also presented music that began with a fast rhythm, slowed down during the island travel phase, and came back to the initial rhythm in the end. These three groups were compared to a control group (G1) sitting still in silence for 15 minutes with no device.
A variety of measures have been used to analyze relaxation, including self-report, startle response, behavioral response, autonomic measurement, and neurophysiologic measurement (Mauss and Robinson, 2009). In our previous study, we analyzed a set of 15 parameters measured before and after a 15- minute period of relaxation. We used objective physiological parameters that are known to be modulated by stress and the relaxation effects of yoga and meditation, such as heart rate, blood pressure, SpO2 and posture (Dickinson et al., 2008; Pal et al., 2014). We also included psychological parameters such as application of a set of stress and anxiety self-evaluation questionnaires, including the Perceived Stress Scale (PSS) and State-Trait Anxiety Inventory-Y (STAI-Y1) (Klainin-Yobas et al., 2015) and scales to measure subjective muscular and nervous relaxation, well-being and energy gain. It has previously been found that a period of relaxation could modify attention and cognitive performances (Lupien et al., 2009), therefore we also applied a set of three attention tests in our experiment. Using these measures, we showed that the different relaxation devices tested could act on different parameters. For instance, we showed that nervous relaxation was observed in G1 and G2, while muscular relaxation was detected in G3 accompanied by a significant decrease in blood pressure. Cognitive effects were notable for G4 (for example, an improvement in sustained attention target accuracy) with improvement of posture, but no other noticeable effect on physiological parameters.
Here we ask whether studying the brain waves and the autonomic activity (respiration rhythm and heart rate variability) of the participants during the relaxation treatment could explain the preferential effect on some parameters measured after the relaxation period (compared to before) using the different devices.
To evaluate the brain activity, we used the ElectroEncephaloGram (EEG) Muse2 system (Suhaimi, 2018). The different brain wave frequencies measured by EEG have been associated with different
states of mind: gamma (32 - 100 Hz) with heightened perception, learning and attention; beta (13 – 32 Hz) with concentration, thinking and attention; alpha (8 – 13 Hz) with relaxation, idle but still alert; theta (4 – 8 Hz) with deep states of meditation and dreams; and delta (0.5 to 4 Hz) with deep sleep and dreamless (Desai, Tailor et al., 2015; Li 2015; Suhaimi N. S., 2018). In a resting-state EEG, the ratio between frontal power in the slow theta frequency band and the fast beta frequency band (the theta/beta ratio, TBR) has often been negatively related to attentional control, but it is increased during mind wandering (van Son et al. 2019). Thus, TBR was also included as an informative index for relaxation in our experiment.
During the relaxation period, we also analyzed respiratory rhythm and cardiovascular parameters, using the PhotoPlethysmoGraph (PPG), which can objectively detect emotion-related physiological responses (Christie and Friedman, 2004), by measuring Heart Rate Variability (HRV). HRV represents variations between consecutive heartbeats (beat interval) over time. This beat-to-beat variation in heart rhythm is considered normal and even desirable, with a large body of evidence reporting that higher variability of heart rhythm is associated with reduced mortality, improved quality of life and relaxation (Makivić, 2013). In addition to analyzing the variations of PPG parameters in each group, we present a model based on core PPG variables that classifies the percentage of participants in each group who experienced a larger difference when comparing relaxation parameters before and after treatment.
Here, we present the results obtained during the relaxation period and compare them to the previous Pre-Post measurements in order to characterize the devices and identify differences that could explain their preferential impacts on some parameters measured after relaxation. By analyzing physiological parameters recorded during the rapid relaxation process in the same population, we add information to the previously observed pre-post treatment variations. The objective of the study is to identify the physiological parameters recorded during relaxation of interest to discriminate the groups. For this purpose, we use a random forest model to determine the most important parameters that can distinguish the groups relaxing with a device from the control group.
II MATERIALS AND METHODS 2.1 Participants
We have conducted the experiment with 40 healthy volunteers. The participants were between 24 to 68 years old (28 women and 12 men). They were distributed in four groups (10 participants per group) using pseudo-randomization in order to acquire comparable groups in terms of age and sex. Briefly, male participants were listed by increasing ages and randomization was made within subgroups of four men of the nearest age to allocate them to each group (G1-G4). Same protocol was applied to women. There were seven women and three men in each group.
All participants declared that there they were not dependent on drugs or alcohol, except four participants smoking occasionally (one in each group). Participants were not taking medication except three participants taking medicine for hyper or hypothyroidism (which were stabilized). The majority of participants were from Université Côte d’Azur or French research centers (students, teachers, employees, etc.). Both French and English speakers participated and participants could select either English or French language for the surveys. The whole protocol, including the relaxation phase (15 minutes) and the measurements of the parameters (pre and post relaxation), lasted 1 hour. The experiments were performed at room temperature (20-23°C) between 10 am. and 6 pm. on 4 consecutive weeks in April-May 2019.
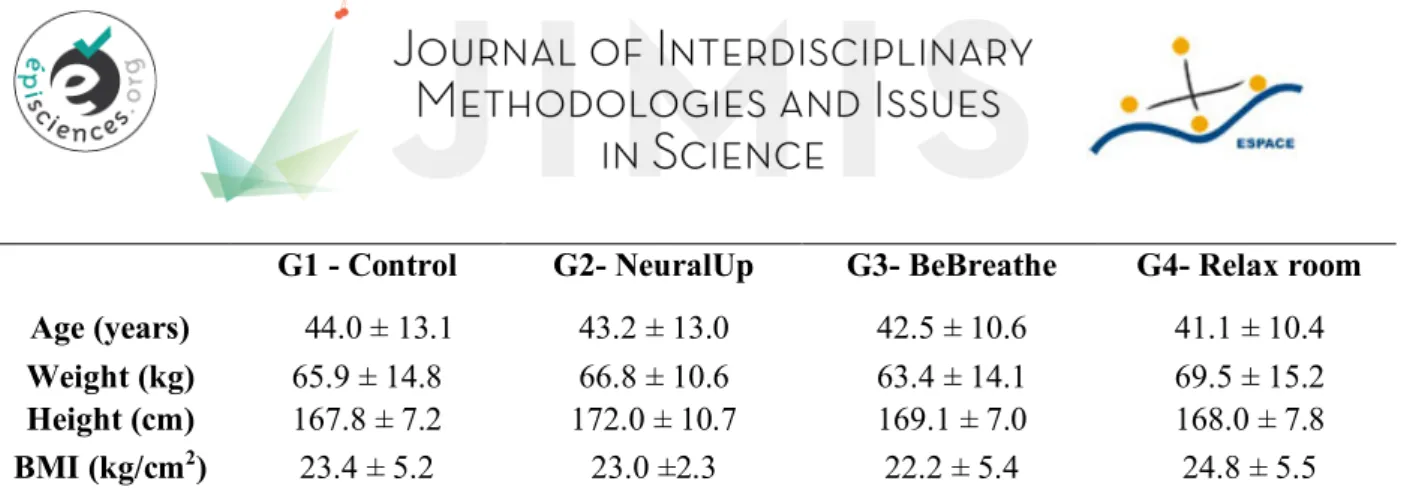
G1 - Control G2- NeuralUp G3- BeBreathe G4- Relax room
Age (years) 44.0 ± 13.1 43.2 ± 13.0 42.5 ± 10.6 41.1 ± 10.4
Weight (kg) 65.9 ± 14.8 66.8 ± 10.6 63.4 ± 14.1 69.5 ± 15.2
Height (cm) 167.8 ± 7.2 172.0 ± 10.7 169.1 ± 7.0 168.0 ± 7.8
BMI (kg/cm2) 23.4 ± 5.2 23.0 ±2.3 22.2 ± 5.4 24.8 ± 5.5
Table 1: Characteristics of the participants in terms of age, weight, height and BMI. Mean ± s.e.m. N=10 per group. One-way ANOVA non-significant between groups for each parameter. BMI: body mass index.
As mentioned in the companion paper in this issue (Gomes et al. 2020), the average level of perceived stress and anxiety of the participants at the beginning of experiment was similar in each group.
2.2 Relaxation devices
For all groups, the relaxation phase lasted for 15 minutes. We named the groups as follows: G1 for the control group; G2, Neural UP device; G3, Be-breathe chair; and G4, Cobtek “Relax Room”. They are described in Gomes et al. 2020 (companion paper in this volume).
Briefly, in G1 (control group), the subjects remained seated in an armchair with their eyes closed. They were equipped with noise-cancelling headphones and asked to breathe calmly throughout the 15-minute session.
In G2 tested (Neural Up device) developed by iCare Sciences, participants listened to a patented acoustic technology based on relaxing sound frequencies (Tibetan sounds) that alternate between right and left ears, giving a sensation of spatialized sound around the body. The subjects remained seated in an armchair with their eyes closed and were equipped with noise-cancelling headphones. After a 2.5-minute rest, the headphones delivered the Neural Up sound for 10 minutes, followed by a 2.5-minute rest.
In G3, participants tested the Ino-Sens Be-Breathe device. This features a warming armchair with a back massage and swing, the chair moving gently in synchronization with the subject’s respiratory rhythm while communicating audio-respiratory instructions to the subject to inhale for 5 seconds and exhale for 5 seconds. The subjects were installed in the Be-Breathe chair, instructed to breathe with their abdomen and equipped with noise-cancelling headphones and a sleeping mask that covered their eyes. The Be-Breathe chair was configured for a complex 15-minute sequence including: 1-minute rest, 1-minute audio instructions where the chair reached the horizontal position; 9 minutes of respiration movements driven by the armchair where the participant had a back massage and swing for the last 7 minutes in rhythm with respiration; then 3 minutes of rest in an inclined position and finally coming back to the seated position and resting for 1 minute. In G4, participants tested the Cobtek laboratory “Relax Room”: A relaxation cabin was employed to present a 3D-movie containing virtual images of a realistic universe and then of a fantasy world on an island, with animals (butterflies, turtles) followed by virtual immersion in the water. The movie also presented sounds that began with a fast tempo and slowed down during the island travel phase, and came back to the initial rhythm in the end. The subjects remained seated in a chair, equipped with glasses for 3D vision, in front of a large screen. After a 3-minute rest, the 3-D movie was presented for a duration of 9 minutes followed by a 3-minute rest.
2.3 Protocol
We developed a protocol in order to test and compare the effect of the different devices. The authors assert that all procedures contributing to this work comply with the ethical standards of the relevant national and institutional committees on human experimentation and with the Helsinki Declaration of 1975, as revised in 2008. The French ethics committee of Université Côte d’Azur (CERNI-“Comité d’Ethique pour les Recherches Non Interventionnelles”, ethics committee for
non-interventional research) approved this protocol. The order of the different measurements for each participant was determined in this protocol (see Gomes et al. 2020, companion paper in this issue).
2.4 Data acquisition and analysis
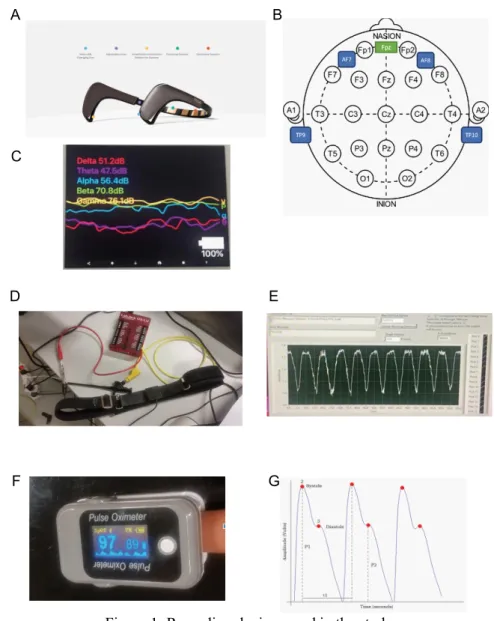
Figure 1: Recording devices used in the study.
A: The Muse 2 EEG headset showing the location of the 4 sensors. B: Position of the electrodes in the Muse 2 headset.
C: Screen of Muse Monitor showing the absolute waves.
D: Respiration belt connected to Lab Jack and to a digital oscilloscope. E: Example of recorded respiration rhythm signals.
F: Finger pulse oximeter PPG captor.
G: PPG typical signal and its analysis (from Moraes et al., 2018).
During the relaxation session, we recorded the following measurements throughout the 15-minute period of relaxation.
2.4.1 EEG
EEG was recorded using the MUSE2 headset (Fig. 1A). The positions for Muse data collection are indicated with the head points from TP9 (left ear), AF7 (left forehead), AF8 (right forehead), TP10 (right ear), and reference point at Fpz, (Fig. 1B). EEG signals (Fig. 1C) were recorded with a
third-D E
F G
A B
party app known as Muse Monitor obtained from Google App Store, developed by James Clutterback, set with a notch filter of 60Hz. The recorded EEG signals were stored in CSV files. The amplitude of raw EEG data for each of the four sensors was in the range of 0.0 to 1682.815 µV at a data acquisition rate of 256Hz.
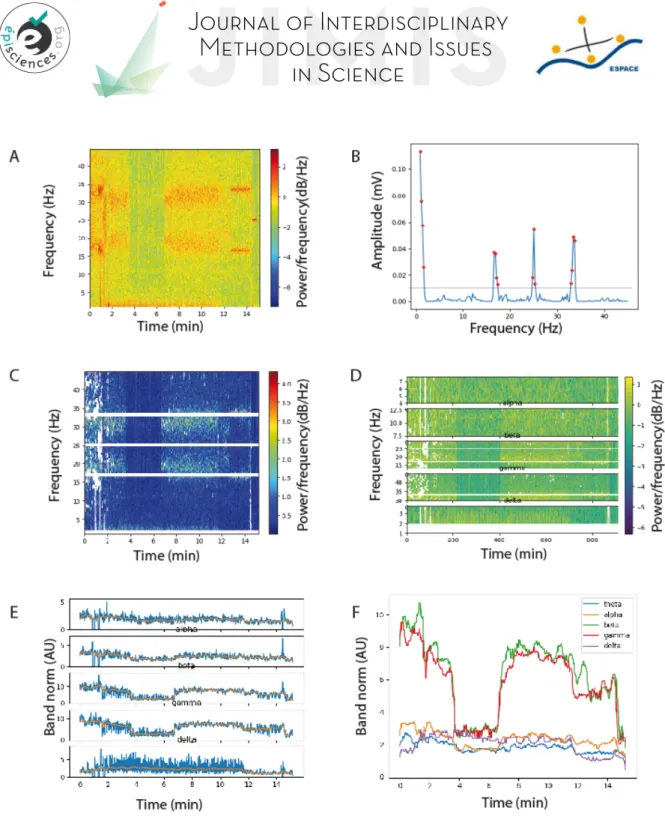
In the next step, we computed the Short Time Fourier Transform (STFT), a sequence of Fourier transforms of a windowed signal providing the time-localized frequency information for situations in which frequency components of a signal vary over time, in order to build the respective spectrograms (intensity plots of STFT magnitude over time). Figure 2A illustrates the spectrogram generated after applying STFT. The sliding window used was 1024 samples with an overlap of 900 samples. The colors of the spectrum represent the power of the frequencies. Orange and red mean that frequencies are very dominant at this part. Such predominant high amplitude signals represent noise, as normal electroencephalography signals do not contain high amplitude signals according to the literature. In addition, unexpected frequencies sometimes appear briefly during the recording. We decided to filter all data in a way that limits noise and provides reliable information.
To remove physiological/biological or non-physiological artifacts, we applied an amplitude method to set a threshold limiting power of each frequency, using Scypi and Numpy toolboxes in Python. A threshold was set manually at 100 µV (by observation of the data) and all values above this threshold were discarded (Fig. 2B), since the biological range of amplitude of brain wave is maximum at 50 µV based on the available scientific pieces of evidence (Hugdahl, 2001).
We obtained a cleaned and filtered spectrogram (Fig. 2C) and then analyzed the EEG signal over time in order to separately observe the dynamic of the different waves (Fig. 2D): Delta wave (1 - 4 Hz), Theta wave (4 - 8 Hz), Alpha wave (7.5 - 13 Hz), Beta wave (13 - 30 Hz), Gamma wave (30 – 45 Hz). We then plotted the power of different frequency brain waves against time separately (Fig. 2E) and then superimposed them in a single graph (Fig. 2F).
We then discretized the EEG data into six segments of 2.5 min by calculating the area under each curve (each wave power) for each time segment. A period 2.5 minutes was previously found to be sufficient to extract PPG parameters (Makivić, 2013) and thus it was also chosen for the other parameters (EEG and respiration) in order to be able to make comparisons.
We calculated the normalized averaged power of each wave (relative to the sum of the powers of all waves in each segment) for each participant. We then presented these values in color code in a heatmap (Fig. 3B and Fig. 4A). Finally, we averaged those values for all electrodes and for all participants in a group, in order to present a graph representing the power of each wave against time in the six consecutive segments of 2.5 minutes (Fig 3C).
Figure 2: EEG signal analysis.
A- Representative example of a spectrogram obtained by applying a SFFT on the EEG signal. B- Use of the amplitude method to filter the noise. A threshold was set manually at 100 µV. C- Filtered spectrogram after noise removal.
D- Separation of the spectrogram in different frequency bands against time.
E- Wave amplitude of each filtered EEG frequency band against time. AU: arbitrary unit. F- Wave amplitude of all filtered EEG frequency band against time. AU: arbitrary unit.
2.4.2 Respiratory rhythm
Respiratory rhythm was measured using a belt with an optic captor of stretch, detecting movement (prototype created by Jean Guyon, Fig. 1D): the respiratory rhythm was captured by an oscilloscope, and signals were visualized and stored using Owon and LabJack softwares (Fig. 1E). One recording was not acquired in Group 2 due to a technical problem. The signals of respiration rhythm recorded for 15 minutes using the respiration belt (Fig. 1D) were acquired at a sampling rate of 10 or 50 Hz
and stored in .CAP files and in .DAT files (Fig. 1E). Both types of files were analyzed using pClamp 10.2 Clampfit software and the raw data was exported in Excel 2016 CVS files. The data were then analyzed to determine the respiratory frequency by sliding windows of 1 minute using software developed by Sensoria Analytics. We then calculated the average value of the respiratory frequency by segments of 2.5 minutes (150 sec). For each participant we thus obtained 6 values of respiratory rhythm for the six 2.5-min time windows from 0 to 15 minutes.
2.4.3 PPG
PPG was recorded using a pulse oximeter (Fingertip) adjusted at the left index (Fig. 1F and G). The oximeter was connected by Bluetooth to a computer. PPG signals were recorded in CSV files, which were analyzed by Sensoria Analytics. Briefly, the sampling rate of the recording was 125 Hz. A band pass filter from one to 12 Hz was applied to data. Besides, the third-order Chebyshev filtered was applied to improve the quality of the PPG signal.
This technique detects changes in blood volume during a cardiac cycle by illuminating the skin with red and infrared light and measuring changes in light absorption. PPG signals give information on the state of the blood vessels, which are tightly related to the heart activity, but there is a delay (Allen, 2007). Indeed, PPG waveform is related to the amplitude of the systole pulse wave (P1), the amplitude of the diastole pulse wave (P2), the time interval between beats (t1), etc. of the cardiac cycle (Fig. 1G). It thus allows calculating the cardiac rhythm and heart rate variability (HRV) parameters (Makivić, 2013; Shaffer and Ginsberg, 2017), which can be analyzed in the time domain and in the frequency domain, providing valuable information about the control of the cardiovascular system (Shaffer and Ginsberg, 2017). PPG signals also indicate the percent of hemoglobin (Hb) molecules bound with oxygen molecules, named SpO2 (Askarian, Jung et al., 2019) against time. Using the Sensoria Analysis software, we measured against time the following parameters: - SpO2
- Three different time domain measures of heart rate variability: STD(HR), the standard deviation of heart rate, giving indication on the total variability of heart rate; SDNN, the standard deviation of all NN intervals (N means normal sinus beats; abnormal beats, such as ectopic beats, have been removed), and log(RMSSD), RMSSD being root mean square of successive RR interval differences (R meaning all sinus beat here). Both SDNN and log (RMSSD) are giving indication on the importance of the parasympathetic system activation.
- A frequency domain measure of HRV, ln (LF/HF), natural logarithm of low frequency band (0.04-0.15Hz) power over high frequency band (0.15-0.4Hz) power, frequencies obtained by Fast Fourier Transform (FFT). In the frequency domain, using mathematical algorithms to apply spectral power density method, it is possible to determine distinct frequency bands, called spectral components. Empirical evidence suggests that the activity of the sympathetic nervous system influences the low frequency band (LF) of the HRV, from 0.04 to 0.15 Hz, while the parasympathetic nervous system is predominantly reflected in the high frequency band (HF), from 0.15 to 0.4 Hz, and also possibly in a proportion of LF (von Rosenberg, Chanwimalueang et al., 2017; Moraes, Rocha et al., 2018). We were interested in computing LF/HF ratio to understand the relationship between parasympathetic and sympathetic autonomic nervous system in order to verify the relaxation effects of the different devices, since parasympathetic system activity is closely related to relaxation states. - Two non-linear (Poincare plot) measures of HRV (SD1 and SD2, standard deviation if we plot all heart beat RR(n) intervals against RR(n+1) intervals, the diameters of the final ellipse-shaped dots will be SD1 and SD2 perpendicular the line of identity and along the line of identity, respectively). A high SD2 means a high variability in adjacent RR and is associated with health and relaxation states.
The values of the PPG parameters were computed for periods of 2.5 minutes for each participant and averaged for each these six segments per group, as this period (2.5 min) is considered to be sufficient to extract reliable HRV features from PPG signal (Shaffer and Ginsberg, 2017). One of
the PPG recordings from G2 was discarded because it was of bad quality (not the same participant as for respiration data).
2.5 Statistics
For the statistical analysis, we used Sigmaplot, Prism and InvivoStat software.
To evaluate the effects of the relaxation protocols on the different parameters measured during the relaxation and then discretized on segments of 2.5 min, we used repeated measures two-way ANOVA (time x 4 groups). We then used pairwise tests adjusted for multiple comparisons by Holm/Bonferroni correction. P values < 0.05 were considered significant.
2.6 Clustering participants into two groups, with high and low relaxation impacts
Cluster analysis is the process of grouping data points into two or more clusters, such that data points belonging to the same cluster are more similar to one another than those in different clusters, based only on the available data points (Nidheesh et al., 2017). We created a model to cluster people into two groups based on the difference between pre and post HRV scores. To evaluate the impact of the relaxation, we considered the difference between the first and fifth segments as an indication of relaxation. Segment 1 represents a resting period before the beginning of relaxation protocol and segment 5 is the last segment of relaxation before return to rest. Most HRV parameters are expected to increase after relaxation and respiratory rhythm is expected to decrease, thus we computed the difference between first and last experimental segments to find the effect of relaxation on HRV and Respiratory Rate (RR) parameters. Using k-means unsupervised algorithm, we clustered all participants based on the computed difference into two clusters: Cluster 1 consisting of participants who showed high variations in the HRV and RR scores and Cluster 2 corresponding to participants whose HRV and RR were stable and for which no significant changes were found between the scores of first and last experimental segments.
Using labels generated by K-means and multicollinearity method, we selected 9 important variables to create a model that can predict a high or low relaxation impact on the users based on their initial state. To create this model, we used different algorithms such as bagged tree, support vector machine and logistic regression. We used 80% of the data to train and 20% of the data to validate the models.
2.7 Random forest
We applied a random forest algorithm (Archer and Kimes, 2008) for quantifying the relevance of the physiological variables to differentiate between device groups (G2, G3, and G4) and control group (G1). We built a script in Python 3.7.0 using libraries related to random forest (like “RandomForestClassifier”) imported from the package “sklearn”. We created a random forest classifier, trained it with the features (Pre/Post physiological measurements obtained in Gomes et
al. 2020, companion paper in this volume, and EEG data) and the labels (name of the groups). After
training, we determined the feature importance (percentage of relevance) for each variable to differentiate between groups. We used 75% of the data for training and the other 25% to test the model for checking the accuracy.
III RESULTS 3.1 EEG
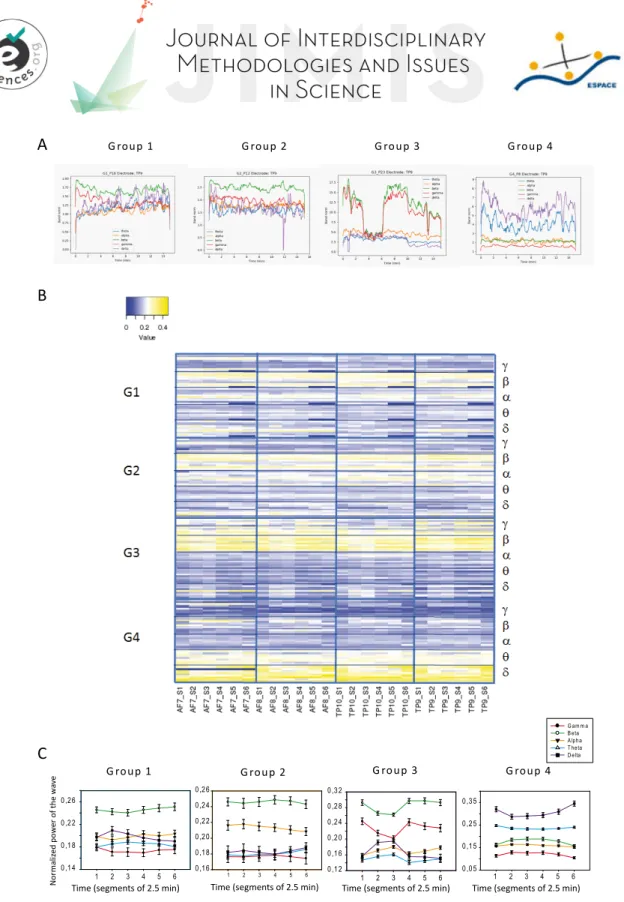
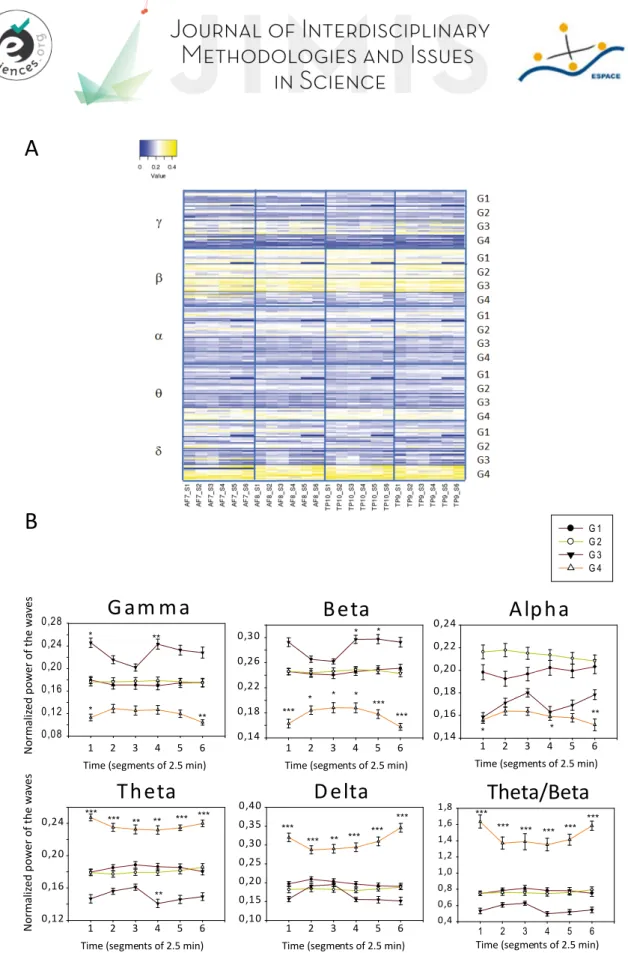
Figure 3 A shows representative examples for each group of recordings of the power of the five different waves against time: Delta wave (1 - 4 Hz), Theta wave (4 - 8 Hz), Alpha wave (7.5 - 13 Hz), Beta wave (13 - 30 Hz), Gamma wave (30 – 45 Hz).
The discretized EEG data with six segments of 2.5 min is presented in a color code in the heatmap of Figure 3B for each of the four electrodes (AF7, AF8, TP10, and TP9).
As we observed no significant differences between the signals recorded for each separated electrode (Fig. 3B), we calculated the average of the values from the 4 electrodes for each participant and then averaged them per group. Figure 3C shows the averages (± sem) of the 5 waves power for each group. Figure 4 presents the same kind of analysis showed in Figure 3, but with EEG data grouped by waves, instead of by groups. This enables a clear view of the behavior of each specific wave for the 4 different groups.
In the control group (G1), Figure 3B reveals that there was huge variability in the EEG recordings of the volunteers. Four of them showed prevalent gamma and beta waves (usually correlated with attention). For two of them, alpha waves (which are supposed to be dominant during relaxation) prevailed. Interestingly, this occurred in participants who regularly practiced meditation. In one participant, delta and theta waves were dominant. These waves are supposed to appear during sleep and indeed, the participant declared at the end that they had fallen asleep. One participant showed a dominance of beta waves and another showed no specific dominance. On average, beta waves were dominant among G1 relative to the other waves (Fig. 3C).
In G2, where the participants were listening to meditation songs, three participants had prevalent beta and alpha waves (often associated with relaxation). These were participants who used to practice meditation. Five participants showed a dominance of gamma and beta waves (often considered to correlate with attention), and two participants showed a majority of delta and theta waves (usually associated with sleep). On average, beta and alpha waves (associated with relaxation state) were dominant among G2 relative to the other waves (Fig. 3C). The G2 group exhibited a higher power of alpha waves relative to the other groups (Fig. 4B), suggesting a good relaxation state, with the wave power being almost stable during the whole intervention.
In G3 (Be-breath chair), nine out of ten participants showed dominant gamma and beta waves (usually linked to attention). The other participant presented large delta, theta and beta waves (and declared to have fallen asleep). On average, gamma and beta waves had a dominant power in G3, where the participants are receiving instructions (to properly breath) and have their vestibular system stimulated by the chair movements, meaning their levels of attention are high during the relaxation intervention. In terms of variation over time, interestingly, gamma and beta waves transiently decreased while alpha, theta and delta waves increased during segments 2 and 3 relative to segment 1, probably due to a deeper relaxation state at the beginning of the Be-Breathe protocol (deep breaths, back massage, swinging).
In G4, all participants showed dominant delta and theta waves (which can also be observed during slow-wave sleep periods) with a slight reversible drop down during the relaxation (period including segments 2-5 relative to segments 1 and 6). Note that all these participants kept their eyes opened in the dark throughout the entire 15-minute recording period, a condition that differs from the other groups. On average, theta and delta waves were strongly dominant in G4. The strong power of delta and theta waves suggests that the participants probably entered a state close to hypnosis (Jensen, Adachi et al., 2015). Delta waves showed a slight reversible decrease while gamma and beta waves showed a slight reversible increase during the period including segments 2-5 relative to segments 1 (beginning) and 6 (end; Fig. 3C) suggesting a slight increase of attention level of the participants during the 3D movie projection phase. However, as can be observed in Figure 4B, the TBR ratio was significantly higher in G4 during the entire relaxation session as compared to the other groups suggesting that this type of relaxation essentially involved mind wandering while, in other groups, participants maintained rather focused attention during the relaxation period.
Figure 3: Comparison between groups of the EEG waves recoded with the Muse2 system.
A-Representative examples of recordings obtained from one participant of each group at one of the 4 electrodes (TP9).
B-Heatmap of the normalized power of the different waves (discretized per segment of 2.5 min) represented for each group (each line represents a single participant) C-Comparison against time of the averages (± sem) of different wave power for each group.
G roup 1 G roup 2 G roup 3 G roup 4
Time (segments of 2.5 min) Time (segments of 2.5 min) Time (segments of 2.5 min) Time (segments of 2.5 min)
N or m al ized p ow er of t he w av e C B
A G roup 1 G roup 2 G roup 3 G roup 4
1 2 3 4 5 6 0,14 0,18 0,22 0,26 1 2 3 4 5 6 0,16 0,18 0,20 0,22 0,24 0,26 G am m a B eta A lpha T heta D elta 1 2 3 4 5 6 0,12 0,16 0,20 0,24 0,28 0,32 1 2 3 4 5 6 0,05 0,15 0,25 0,35
Figure 4: Power of EEG waves recoded with the Muse2 system for the four groups. A- Heatmap of the normalized power of the different waves for each group.
B- Comparison over time of the averages of the wave power for each frequency band measured for the four groups. Two-way ANOVA with repeated measures revealed significant effect of groups and an interaction. * p<0.05, ** p<0.01, *** p<0.001, pairwise tests adjusted for multiple comparisons by Holm/Bonferroni correction. N=10 per group (except in G1 where one participant was excluded because the end of the recording was not usable).
B
Gam ma
1 2 3 4 5 6 0,08 0,12 0,16 0,20 0,24 0,28 G 1 G 2 G 3 G 4Beta
1 2 3 4 5 6 0,14 0,18 0,22 0,26 0,30Alpha
1 2 3 4 5 6 0,14 0,16 0,18 0,20 0,22 0,24Theta
1 2 3 4 5 6 0,12 0,16 0,20 0,24Delta
1 2 3 4 5 6 0,10 0,15 0,20 0,25 0,30 0,35 0,40 No rm al iz ed p ow er o f th e w av esTime (segments of 2.5 min) Time (segments of 2.5 min) Time (segments of 2.5 min)
Time (segments of 2.5 min) Time (segments of 2.5 min)
* * ** ** *** No rm al ized p ow er o f th e w av es * * * * *** *** * * ** * *** *** ** ** ** *** *** *** *** *** *** *** **
A
1 2 3 4 5 6 0,4 0,6 0,8 1,0 1,2 1,4 1,6 1,8Time (segments of 2.5 min)
Theta/Beta
***
3.2 Respiration
For each participant, we recorded the respiratory movements using a belt placed on the abdomen (Fig 2A) using a stretch captor sending information to an oscilloscope. Figure 5A shows representative recordings for a participant of each group.
From these data, we calculated the respiratory frequency on sliding windows of one minute over the 15 minutes of the experiment. Figure 5B shows the curves obtained for the same participants as the ones shown in Figure 5A.
We then discretized the value of respiratory frequency over six successive segments of 2.5 minutes as we did for the EEG analyses. Figure 5 C illustrates representative data (median ± 25% and 75% quartiles of the respiration frequency calculated over periods of 2.5 minutes) for the same participants from each group.
Figure 5: Representative data of respiratory recordings for one participant of each group. A- Data recorded with the respiratory belt. Expanded traces are presented at the top, and respiratory recordings over the 15 minutes for the same representative participants are given below. B- Frequency of respiratory movements calculated from the data presented in A using 1-minute sliding widows. C- Median
± 25% and 75% quartiles of the respiration frequency calculated over periods of 2.5 minutes.
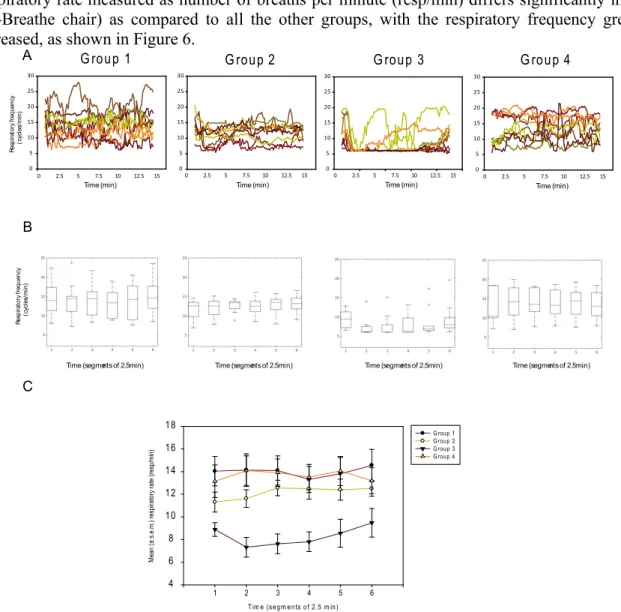
The curves representing the respiratory frequency against time for all participants in each group are shown in Figure 6A. Notice the greater variability in respiratory frequency among participants in G1 and G4, which was reduced in G2, and the strong reduction in respiratory frequency to 6 cycles
per minute in almost all participants in G3, due to the Be-Breathe protocol guiding them in “cardiac coherence respiration”.
We then determined the median and mean values over six successive segments of 2.5 minutes for each group. The median ± 25-75% quartiles for each group over those six periods are shown in Figure 6B. The mean ± s.e.m. is presented in Figure 6C for the 4 groups superimposed.
Respiratory rate measured as number of breaths per minute (resp/min) differs significantly in G3 (Be-Breathe chair) as compared to all the other groups, with the respiratory frequency greatly decreased, as shown in Figure 6.
Figure 6: Respiratory data for each group per 2.5 min segment. A- Superimposed curves of respiratory frequency for all participant of each group.
B- Box plot showing the median ± 25% and 75% quartiles of calculated respiratory frequency over six successive periods of 2.5 minutes for all groups. Stars represent values that were considered out of range by the software.
C- Superimposed curves showing the mean ± s.e.m. of respiratory frequency (numbers of respirations /min) calculated over six successive periods of 2.5 minutes. Two-way ANOVA with repeated measures revealed an effect of group with no effect of time and no interaction. G3 differed significantly from all the other groups (using Homl-Sidak method). N=10 per group except G2 (N=9, one recording is missing in G2 due to a technical problem with the oscilloscope).
3.3 PPG
Using a finger oximeter, we analyzed the PPG signals in order to measure the following parameters: heart rate, time domain measures of heart rate variability (STD (HR), SDNN and log (RMSSD)),
G roup 1 0 5 10 15 20 25 30 G roup 2 0 5 10 15 20 25 30 G roup 3 G roup 4 0 5 10 15 20 25 30 0 2.5 5 7.5 10 12.5 15 0 2.5 5 7.5 10 12.5 15 0 2.5 5 7.5 10 12.5 15
Time (min) Time (min) Time (min)
Res p ira to ry fr eq uen cy ( cy cl es /m in ) A B C Res p ira to ry fr eq uen cy ( cy cl es /m in )
Time (segments of 2.5min) Time (segments of 2.5min) Time (segments of 2.5min) Time (segments of 2.5min)
T im e (se gm en ts o f 2.5 m in ) 1 2 3 4 5 6 Me an (± s .e .m. ) r es pir at or y ra te (r es p/ mi n) 4 6 8 10 12 14 16 18 G roup 1 G roup 2 G roup 3 G roup 4 0 5 10 15 20 25 30 Time (min) 0 2.5 5 7.5 10 12.5 15
frequency domain measures of HRV (ln (LF/HF)) and non-linear (Poincare plot) measures of HRV (SD1 and SD2). We also measured the SpO2 against time.
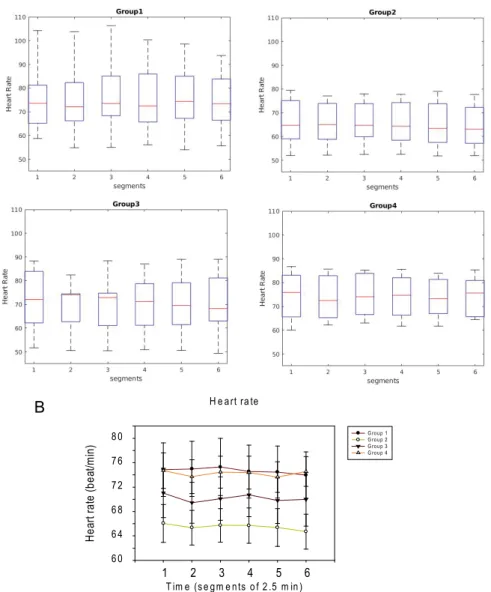
For analyzing the data against time, we discretized the data in 6 segments of 2.5 minutes each, in the same manner as the EEG and respiration data. On average, heart rate did not show significant variations among groups or against time during the relaxation period (Fig. 7).
For analyzing the data against time, we discretized the data in 6 segments of 2.5 minutes each, as for EEG and respiration data. On average, heart rate did not show significant variations among groups or against time during the relaxation period (Fig. 7).
Figure 7: Heart rate per group and per segment. A- median ± 25% and 75% quartiles B- mean ± s.e.m. Two-way ANOVA with repeated measures revealed no significant effect of time, groups or interaction.
N=10 per group except G2 (N=9). H e art ra te T im e (s e gm e nts o f 2 .5 m in ) 1 2 3 4 5 6 H ea rt ra te (bea t/m in ) 6 0 6 4 6 8 7 2 7 6 8 0 G ro u p 1 G ro u p 2 G ro u p 3 G ro u p 4 B A
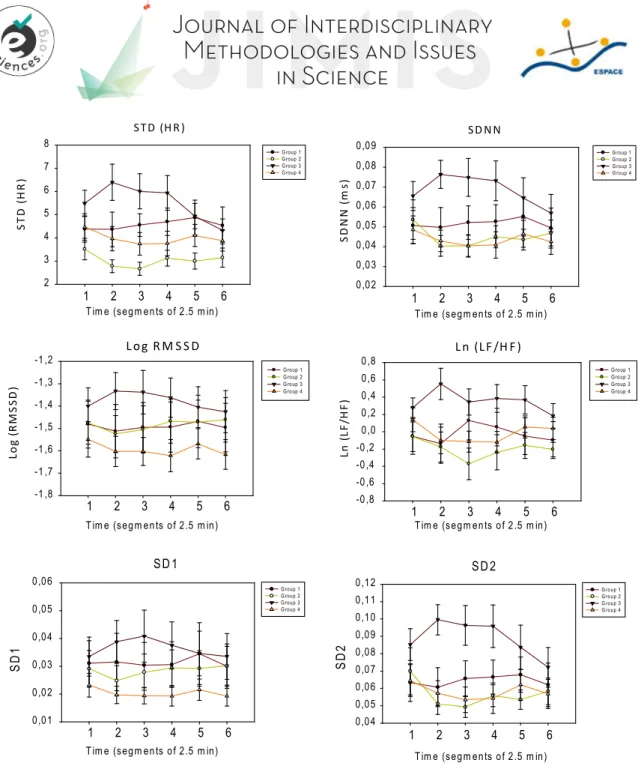
Figure 8: Heart rate variability parameters. A-Standard deviation of heart rate. Two-way ANOVA with repeated measures revealed a significant effect of group, no effect of time and an interaction (G3 differed significantly from G2 and for segments 1 to 5, p<0.05 pairwise test adjusted for multiple comparisons by Holm/Bonferroni correction. N=10 per group). B- Standard deviation of NN (SDNN). Two-way ANOVA with repeated measures revealed a significant interaction but no effect of group or time. G3 differed significantly from G2 and G4 at segments 2 and 3. C- Log (RMSSD). Two-way ANOVA with repeated measures revealed no significant interaction, no effect of group or time. D-Ln (LF/HF), two-way ANOVA with repeated measures revealed significant interaction, but no effect of group or time. G3 significantly differed from G1 at segment 2 and from G2 at segments 2 and 3. E- SD1, two-way ANOVA with repeated measures revealed no significant effect of group, no effect of time and no interaction. F-SD2. Two-way ANOVA with repeated measures revealed a significant interaction and an effect of group but no effect of time. G3 differed from G4 at segments 2 and 3, and from G2 at segments 2, 3 and 4. N=10 per group except G2 (N=9).
We also studied the effect of the relaxation period on heart rate variability parameters. During relaxation period, HRV is supposed to increase (longer R-R intervals), because of attenuated activity of the sympathetic nervous system and augmented parasympathetic nervous system activity. The intervals between R-R peaks should become longer and less uniform (increased R-R variability). STD (H R ) 1 2 3 4 5 6 ST D (HR ) 2 3 4 5 6 7 8 SD NN 1 2 3 4 5 6 SDN N (m s) 0,02 0,03 0,04 0,05 0,06 0,07 0,08 0,09 G roup 1 G roup 2 G roup 3 G roup 4 Log R M S S D 1 2 3 4 5 6 Lo g (R M SS D ) -1 ,8 -1 ,7 -1 ,6 -1 ,5 -1 ,4 -1 ,3 -1 ,2 G roup 1 G roup 2 G roup 3 G roup 4 Ln (LF /H F ) 1 2 3 4 5 6 Ln (L F/ H F) -0,8 -0,6 -0,4 -0,2 0,0 0,2 0,4 0,6 0,8
Tim e (segm ents of 2.5 m in) Tim e (segm ents of 2.5 m in)
Tim e (segm ents of 2.5 m in) Tim e (segm ents of 2.5 m in)
G roup 1 G roup 2 G roup 3 G roup 4 SD 2 1 2 3 4 5 6 S D 2 0,04 0,05 0,06 0,07 0,08 0,09 0,10 0,11 0,12 G roup 1 G roup 2 G roup 3 G roup 4 SD 1 1 2 3 4 5 6 S D 1 0,01 0,02 0,03 0,04 0,05 0,06 G roup 1 G roup 2 G roup 3 G roup 4
Tim e (segm ents of 2.5 m in) Tim e (segm ents of 2.5 m in)
G roup 1 G roup 2 G roup 3 G roup 4
As illustrated in Figure 8, the heart rate variability parameters measured were higher in G3 compared to the other groups during the relaxation period, particularly in segments 2-4, especially the STD (HR), SDNN and ln (LF/HF) and SD2. G2 and G4, on average, showed lower values for the heart rate variability parameters while the G1 values were intermediate.
Figure 9: Mean peripheral capillary oxygen saturation (SpO2) ± s.e.m. calculated over six successive periods of 2.5 minutes for each group.
Two-way ANOVA with repeated measures revealed significant effect of time, groups and an interaction. G3 differed significantly from G1 at segments 2 to 5, from G2 at segments 5 and 6 and from G4 at segment 6. N=10 per group except G2 (N=9).
We also measured SpO2 against time. As shown in Figure 9, SpO2 decreased during relaxation in groups G1, G2 and G4, probably due to the lower amplitude of respiration movement except in G3, where it remained stable until the end because the Be-Breathe chair promoted the amplitude of the respiration movements.
3.4 Cluster analysis using PPG data
Using cluster analysis, we compared the results obtained at the end of the relaxation (segment 5) to the results at the beginning of relaxation (segment 1) to determine if potential changes occurred in the assessed variables. We found a tendency for some variables to increase or decrease while other variables were almost stable throughout the experiment. We used a k-means clustering algorithm (Nidheesh et al., 2017) to label users with the largest changes after the relaxation treatment. Nine variables were identified by the multi-collinearity procedure: heart rate, standard deviation of the heart rate, SDNN, SDSD, SD1, SD2, SD2/SD1, respiratory rate and standard deviation of the respiratory rate; meaning that they are the most important variables that showed changes between segments 1 and 5 and had the best accuracy according to the model. K-means grouped 20 users in one cluster and 19 participants in the other. Based on the pattern of reduction or increase of the scores of the members in each cluster, Cluster 1 was labeled as the group showing the greatest relaxation effects. Accordingly, 51% of subjects exhibited a large relaxation impact on their cardio-vascular and respiratory parameters throughout the experiment. The distribution of participants showing a strong impact of relaxation or not in different groups is shown in Table 2. 70% of G3 showed important modifications of their physiological parameters during the experiment. Participants in this group showed significant and high variation in Respiratory Rate and its standard deviation. Only 33% of G2 and 50% of G4 were showing significant variations after relaxation.
S pO2
1
2
3
4
5
6
S p O 2 (% ) 96,5 97,0 97,5 98,0 98,5 99,0 99,5 G roup 1 G roup 2 G roup 3 G roup 450% of G1 showed major differences at the end of the experiment. Note that if a participant was already in a relaxed state at the beginning of the relaxation session, the probability of observing a large relaxation effect will be low, due to a ceiling effect.
Table 2: Distribution of Clusters 1 and 2 among the experimental groups obtained with the classifier model.
The labels generated by k means were used to classify participants through a classifier learner. The model is supposed to determine whether subjects showed high impact of relaxation or not according to the changes that the subjects showed at the end of the experiment in comparison to the initial states (parameters) they had at the beginning. Several algorithms were used to classify the data, validation of the learning was done by withholding 20% of the data. The highest accuracies were obtained using an ensemble bagged tree and a support vector machine, 100% and 97%, respectively. The ensemble bagged tree was used as the final classification to generate the model. The confusion matrix of this model is shown in Table 3.
Real class 1 100% 0%
Real class 2 0% 100%
Predicted class 1 Predicted class 2 Table 3: Confusion matrix.
3.5 Random forest algorithm
Most studies assessing relaxation are based only on subjective surveys. Since our study measured physiological parameters, which are more objective, we were especially interested in verifying the existence physiological benefits that were specific to each device, when comparing these parameters to the control group. We applied a random forest algorithm to quantify the relevance of the physiological variables studied in the companion paper in this issue (Gomes et al. 2020) and to differentiate between device groups (G2, G3, and G4) and the control group (G1).
Cluster 1 “high impact of relaxation” Cluster 2 “low impact of relaxation” Total people 20 19 Group 1 5 5 Group 2 3 6 Group 3 7 3 Group 4 5 5
Feature Relevance
Name G2 versus G1 G3 versus G1 G4 versus G1
Posture 0.3455093582482733 0.14946486061637582 0.14879330191721551 Heart Rate 0.20484417166016994 0.21700610922707242 0.3265461613887154
SpO2 0.23858690631638677 0.173974921499356 0.22708527753231214 Mean BP 0.21105956377517002 0.459554108657196 0.2975752591617568
Accuracy 40% 60% 40%
Table 4 - Feature importance (percentage of relevance) for each variable to differentiate between groups using a device (G2, G3, and G4) and control group (G1), revealed after training a model using Random
Forest (model’s accuracy is shown on the bottom). Most relevant parameters are highlighted.
As we can observe in Table 4, the level of accuracy for discriminating between groups using these parameters is poor (40-60%), meaning that we cannot accurately identify specific physiological change due to one specific device based only in the Pre/Post data.
However, by adding EEG data to this model (mean power of each EEG wave measured during the entire 15-minute relaxation period), we obtained more accurate information. As we can observe in Table 5, in these conditions, the level of accuracy for G3 and G4 became optimal (100%) and, for G2, the accuracy increased from 40% to 60%.
Feature Relevance
Name G2 versus G1 G3 versus G1 G4 versus G1
Posture 0.2092553225046759 0.06953245987588247 0.005886610380360382 Heart Rate 0.08956932887448853 0.07370756026931617 0.020948081863022334 SpO2 0.119043706217724 0.0731636803936804 0.01879249166838453 Mean BP 0.10467748679961614 0.16472654514557122 0.023082030122655126 Gamma 0.07918072602591816 0.10085891045662695 0.12337927929103525 Beta 0.07128287938652661 0.1219299263655216 0.1892523669947777 Alpha 0.10107638440974218 0.1354412144603432 0.08754937308062312 Theta 0.11115153660402853 0.161195636645101 0.20645093403510062 Delta 0.11476262917728021 0.09944406638795711 0.32465883256404093 Accuracy 60% 100% 100%
Table 5 – Feature relevance level of Pre/Post and during relaxation physiological data for differentiating between groups using a device (G2, G3, and G4) and control group (G1), revealed after training using a random forest model (accuracy is shown at the bottom). The most relevant parameters are highlighted.
For G3, the most relevant variables are the mean blood pressure and the whole set of EEG waves (no significative jumps among the waves relevance from 10 to 16%). For G4, the most relevant variables are mean power of Delta, Theta and Beta waves, with a strong value for Delta (32%), and with high TBR (ratio Theta/Beta).
For discriminating between G2 and G1, the level of accuracy is still poor (60%), meaning that since the conditions of these 2 groups were very similar (the only difference was the listening to meditation songs in G2), the results obtained in both groups were also very similar, making it difficult to discriminate between G2 and G1.
Overall, this model is able to determine which physiological parameters best discriminate between the device and control groups.
IV CONCLUSIONS AND REFERENCES 4.1 Discussion
In a previous article (Gomes et al. 2020, companion paper in this volume), we compared the effects of the three different relaxation devices on physiological, psychological and cognitive parameters measured before and after a relaxation treatment compared to a control group where participants did not use any device. In this previous study, we showed that each type of relaxation protocol acted selectively on some of the parameters measured. For instance, participants from G2 presented a decrease in subjective nervous relaxation, participants from G3 presented decreased blood pressure and subjective muscle relaxation, and participants from G4 presented improved posture and better results in certain attention tests. Even participants from G1 presented a subjective increase in nervous relaxation after just 15 minutes of rest with no specific device.
In the present study, in order to try to better understand how each device could lead to relaxation on selected parameters, we studied the same participants and compared the variations in physiological parameters (brain waves, respiration and heart rate parameters) measured during the 15 minute relaxation session using these three commercial devices (compared to the control group). This study have some limitations. Due to the sample of participants used in the study (students and teachers from the University), the generalizability of this study with larger sample size may pose problems for replication with other populations. The low sample of participants also prevented a true random allocation. The use of a control group as compared to three others groups was supposed to help discriminating relaxing stimulations from other sensory stimulations. However, given the high variability observed in the control group, it did not really facilitate the determination of the effects of the relaxing sensory stimulations.
Indeed, the control group, where the participants were simply seated in an armchair and told to relax and breathe calmly (G1), we observed large variability in EEG waves and respiration rhythm among the participants. This group included both people who are used to practicing relaxation or meditation techniques, and untrained people. In trained people, just sitting still for 15 minutes could be sufficient to benefit from relaxation, as attested by the subjective nervous relaxation measured in this group (see Gomes et al., 2020, companion paper in this volume). However, for people who were not used to these kinds of practices, sitting still 15 minutes in a chair was not relaxing and specific relaxation devices could help them to reach a relaxation state. This could explain the high variability observed in this group.
Neural Up (G2) was noted to improve the subjective nervous relaxation, but only subtle improvements in relaxation were observed when comparing to the control group during relaxation: a smaller variability in respiration rate between participants in G2 compared to G1 and increased power of alpha waves in G2 compared to all the other groups (Fig. 4B). This device was conceived to reduce stress by acting on the nervous system through the auditory pathway using specific sound frequencies to promote a meditating state. Indeed, alpha waves are frequently observed to correlate with relaxation and meditation (Desai et al., 2015; Li, 2015; Suhaimi, 2018). Further studies will be needed to evaluate the efficacy of these sound frequencies. The small effect observed compared to G1 is probably due to the similarity of the G2 and G1 conditions (apart from the spatialized sound), because the G1 participants already showed relaxation effects and also because of the small numbers of participants. Indeed, in the random forest model for discriminating between G2 and G1, the level of accuracy was poor (60%), meaning that since the conditions of these 2 groups were very similar (seated in a regular chair, eyes closed, noise-cancelling headphones, with the only difference of listening to meditation songs in G2), the results obtained in both groups were also very similar, making it difficult to discriminate between G2 and G1.
The Be-Breathe chair (G3 device) encouraged deeper, slower respiration, as attested by the respiration rhythm measurements. We also observed changes in HRV parameters during relaxation including an increase in STD(HR), SDNN, ln(LF/HF) and SD2. An increase in HRV is classically associated with health and relaxation (Makivić, 2013). Indeed, these changes led to improved physiological changes after the treatment, for example decreased blood pressure and subjective muscular relaxation, and this was confirmed by the clustering model of HRV parameters in which 70% of participants of G3 showed significant beneficial changes of these parameters. This suggests that the Be-Breathe device was able to improve relaxation in terms of physiological aspects, when compared to the control group. This device was conceived to decrease stress by improving physiological parameters through deepening respiration, which was indeed confirmed in our study. G3 participants showed a particular pattern of EEG waves with dominant gamma and beta waves, likely due to the attention focus on respiration. Indeed, in G3, participants listened to instructions asking them to pay attention to their respiration while they had their eyes covered with an eye mask, their posture changed and a back massage. The random forest model revealed that for G3, the most relevant variables were the mean blood pressure and the whole set of EEG waves, confirming that the Be-Breathe device of G3 can provide benefits in terms of reduced blood pressure while the EEG wave behavior suggests a capacity to relax people by focusing their attention on their respiration. Indeed, gamma and beta waves (often related to attention) are dominant in this group. Overall, participants experiencing relaxation in G3 were more relaxed than participants in control group in terms of physiological parameters.
In the Relax Room (G4), participants watched a 3D movie, thus they kept their eyes opened during the 15 minutes in the dark, which differs from all the other groups. During relaxation G4 participants did not show major respiration or HRV changes relative to the control group. However, they presented an interesting pattern of EEG waves in which the observed dominant waves were in the low frequency band (Theta and Delta waves). In the random forest model for G4 the most relevant variables were indeed the mean power of Delta, Theta and Beta waves. In G4, the Theta over Beta Ratio (TBR) was the highest in this group (Fig. 4B), suggesting that this device promoted mind wandering rather than focused attention (van Son et al. 2019). This device was designed to encourage people to relax prior to tests (specifically, tests to reveal the presence of Alzheimer’s disease). The G4 relaxation treatment was indeed able to improve some cognitive performances that were measured right after the relaxation, compared to before the treatment, particularly the sustained attention performance in cognitive tasks suggesting reduced impulsivity (Gomes et al., 2020). Decreasing the level of attention during the relaxation period could thus have improved the level of attention immediately after the relaxation intervention.
Surprisingly, our EEG data showed no significant effect against time. Similarly, we did not observe significant variation in heart rate over time. Only some PPG features (SpO2, for example) and respiration data showed variations against time. PPG data in our study therefore can better explain changes induced during the relaxation period than EEG in terms of short-term physiological changes.
The random forest model confirmed the data revealed by our statistical analyses, which, given the low sample size for this study, informed us about the specific parameters revealed by the study in each group.
4.2 Conclusion
In conclusion, our study could help to identify the most suitable relaxation device for individuals. For instance, we showed that G2 seems to promote a meditation state as suggested by their EEG with predominant alpha and beta waves recorded during relaxation period, G3 would be more appropriate for body relaxation and ample breathing movements, while G4 would elicit mind
wandering then increasing attention after the treatment. The ability to choose the device that would maximize relaxation for each individual would represent a great advance and would provide better health and well-being in a shorter time. While most studies are currently based on subjective measurements only, our study, which also includes objective criteria such as physiological measurements in the evaluations, provides a more detailed and objective analysis.
References
Allen J. (2007). Photoplethysmography and its application in clinical physiological measurement. Physiol Meas 28(3): R1-39.
Archer K. J., Kimes R. V. (2008). Empirical characterization of random forest variable importance measures. Computational Statistics & Data Analysis 52, 2249-2260.
Askarian B., Jung K., Chong J. W. (2019). Monitoring of Heart Rate from Photoplethysmographic Signals Using a Samsung Galaxy Note8 in Underwater Environments. Sensors (Basel) 19(13).
Christie I. C., Friedman B. H. (2004). Autonomic specificity of discrete emotion and dimensions of affective space: a multivariate approach. Int J Psychophysiol 51(2): 143-153.
Culbert T. (2017). Perspectives on Technology-Assisted Relaxation Approaches to Support Mind-Body Skills Practice in Children and Teens: Clinical Experience and Commentary. Children (Basel) 4(4).
Desai R., Tailor A., Bhatt T. (2015). Effects of yoga on brain waves and structural activation: A review. Complement Ther Clin Pract 21(2): 112-118.
Dickinson H., Campbell F., Beyer F., Nicolson D., Cook J., Ford G., Mason J. (2008). Relaxation therapies for the management of primary hypertension in adults: a Cochrane review. J Hum Hypertens 22(12): 809-820.
Gomes N., IranfarS., Aridhi S., Guyon A. (2020) Physiological and psychological effects of rapid relaxation devices
using sensorial immersion: a pilot study. JIMIS Volume 9(DOI : 10.18713/JIMIS-021120-9-1).
Goyal M., Singh S., Sibinga E. M., Gould N. F., Rowland-Seymour A., Sharma R., Berger Z., Sleicher D., Maron D. D., Shihab H. M., Ranasinghe P. D., Linn S., Saha S., Bass E. B. and Haythornthwaite J. A. (2014). Meditation programs for psychological stress and well-being: a systematic review and meta-analysis. JAMA Intern Med 174(3): 357-368.
Hugdahl K. (2001). The Electroencephalogram. Psychophysiology-The Mind-Body Perspective. H. U. Press.
Jensen M.P., Adachi T., Hakimian S. (2015). Brain Oscillations, Hypnosis, and Hypnotizability. Am J Clin Hypn 57(3): 230-253.
Klainin-Yobas P., Oo W. N., Suzanne Yew P. Y., Lau Y. (2015). Effects of relaxation interventions on depression and anxiety among older adults: a systematic review. Aging Ment Health 19(12): 1043-1055.
Li Z., Xu J., Zhu T. (2015). Prediction of Brain States of Concentration and Relaxation in Real Time with Portable Electroencephalographs. Computer Science. arXiv arXiv:1509.07642.
Lupien S. J., McEwen B. S., Gunnar M. R., Heim C. (2009). Effects of stress throughout the lifespan on the brain, behaviour and cognition. Nat Rev Neurosci 10(6): 434-445.
Makivić B., Djordjević N. M., Willis M. S. (2013). Heart rate variability (Hrv) as a tool for diagnostic and monitoring performance in sport and physical activities. J Exerc Physiol Online 16: 103–131.
Mauss I. B., Robinson M. D. (2009). Measures of emotion: A review. Cogn Emot 23(2): 209-237.
Miller R., Kirschbaum C. (2019) Cultures under stress: A cross-national meta-analysis of cortisol responses to the Trier Social Stress Test and their association with anxiety-related value orientations and internalizing mental disorders. Psychoneuroendocrinology. 105:147-154. doi: 10.1016/j.psyneuen.2018.12.236.
Moraes J. L., Rocha M. X., Vasconcelos G. G., Vasconcelos Filho J.E., de Albuquerque V.H.C., Alexandria A.R. (2018). Advances in Photopletysmography Signal Analysis for Biomedical Applications. Sensors (Basel) 18(6).
Pal G. K., Ganesh V., Karthik S., Nanda N., Pal P. (2014). The effects of short-term relaxation therapy on indices of heart rate variability and blood pressure in young adults. Am J Health Promot 29(1): 23-28.
Pascoe M .C., Thompson D. R., Ski C. F. (2017). "Yoga, mindfulness-based stress reduction and stress-related physiological measures: A meta-analysis." Psychoneuroendocrinology 86: 152-168.
Saeed S., Cunningham K., Bloch R. (2019). Depression and Anxiety Disorders: Benefits of Exercise, Yoga, and Meditation. Am Fam Physician 99(10): 620-627.
Shaffer F., Ginsberg J. P. (2017). An Overview of Heart Rate Variability Metrics and Norms. Front Public Health 5: 258.
Suhaimi N. S., Teo J., Mountstephens J. (2018). Emotional State Classification in Virtual Reality Using Wearable Electroencephalography. IOP Conf. Ser.: Mater. Sci. Eng. 341 012016.
Von Rosenberg W., Chanwimalueang T., Adjei T., Jaffer U., Goverdovsky V. Mandic D. P. (2017). Resolving Ambiguities in the LF/HF Ratio: LF-HF Scatter Plots for the Categorization of Mental and Physical Stress from HRV. Front Physiol 8: 360.
A Acknowledgements:
The authors would like to thank all the volunteers that participated in this study. We thank Christian Müller from Ino-Sens for allowing us to use the Be-Breathe chair, Chris Hayot from Icare Science for allowing us to use the Neural Up software, and Philippe Robert, Renault David and Auriane Gros for welcoming us in Cobtek and allowing us to use the “Relax Room”. We thank Patricia Bouret, Fabienne Colette, Solène Granjeon-Noriot and Thomas Lorivel for their statistical advice. We thank Jean Guyon for the generous gift of a prototype of the respiratory belt. We thank Karina Aridhi and Abby Cuttriss (from the Office of International Scientific Visibility, Université Côte d'Azur) for English corrections.
B Data availability.
The data that support the findings of this study are available from the corresponding authors on reasonable request. C Author contribution
N.G. and A.G. performed the acquisition and the data analysis. S.I., K.M., and S.A. contributed to the analysis. A.G. took the lead in writing the manuscript. All authors provided critical feedback and helped shape the analyses interpretation and manuscript. All authors approved the final version of this manuscript.
D Conflict of interest.
The authors declare they have no conflict of interest. The devices used in this study were kindly loaned by the companies with their agreement to proceed to the experiments. A research collaboration contract was signed between Sensoria Analytics and the CNRS.
E Financial support.
This work was supported by the French government through the UCA-Jedi project managed by the National Research Agency (ANR-15- IDEX-01) and, in particular, by the interdisciplinary Institute for Modeling in Neuroscience and Cognition (NeuroMod) of the Université Côte d’Azur. Norma Gomes was funded by Neuromod institute of UCA. Sepideh Iranfar was funded by Sensoria Analytics startup.