HAL Id: hal-01787886
https://hal.inria.fr/hal-01787886v2
Submitted on 27 Jun 2018HAL is a multi-disciplinary open access archive for the deposit and dissemination of sci-entific research documents, whether they are pub-lished or not. The documents may come from teaching and research institutions in France or abroad, or from public or private research centers.
L’archive ouverte pluridisciplinaire HAL, est destinée au dépôt et à la diffusion de documents scientifiques de niveau recherche, publiés ou non, émanant des établissements d’enseignement et de recherche français ou étrangers, des laboratoires publics ou privés.
pathways in presymptomatic Huntington’s disease
Yi Hong, Lauren O’Donnell, Peter Savadjiev, Fan Zhang, Demian
Wassermann, Ofer Pasternak, Hans Johnson, Jane Paulsen, Jean-Paul
Vonsattel, Nikolaos Makris, et al.
To cite this version:
Yi Hong, Lauren O’Donnell, Peter Savadjiev, Fan Zhang, Demian Wassermann, et al.. Genetic load determines atrophy in hand cortico-striatal pathways in presymptomatic Huntington’s disease. Human Brain Mapping, Wiley, In press, �10.1002/hbm.24217�. �hal-01787886v2�
Genetic load determines atrophy in hand cortico-striatal
pathways in presymptomatic Huntington’s disease
Yi Hong1*, Lauren J. O’Donnell2, Peter Savadjiev2, Fan Zhang2, Demian Wassermann6, Ofer
Pasternak2, Hans Johnson4, Jane Paulsen4, Jean-Paul Vonsattel5, Nikos Makris3, Carl F. Westin2†,
and Yogesh Rathi2†
1 Department of Computer Science, University of Georgia, Athens, GA, USA
2 Department of Radiology, Brigham and Women’s Hospital, Harvard Medical School, Boston, MA, USA 3 Department of Psychiatry, Massachusetts General Hospital, Harvard Medical School, Boston, MA, USA 4 Department of Psychiatry, University of Iowa, Iowa City, IA, USA
5 Department of Pathology and Cell Biology, Columbia University, New York, NY, USA 6 Athena team, INRIA Sophia Antipolis Mediterranee, France
* 415 Boyd Graduate Studies Research Center, University of Georgia, Athens, GA 30602 yi.hong@uga.edu, (706) 542-8214
† Equal contribution
Abstract
Huntington’s disease (HD) is an inherited neurodegenerative disorder that causes progressive breakdown of striatal neurons. Standard white matter integrity measures like fractional anisotropy and mean diffusivity derived from diffusion tensor imaging were analyzed in prodromal-HD subjects; however, they studied either a whole brain or specific subcortical white matter structures with connections to cortical motor areas. In this work, we propose a novel analysis of a longitudinal cohort of 243 prodromal-HD individuals and 88 healthy controls who underwent two or more diffusion MRI scans as part of the PREDICT-HD study. We separately trace specific white matter fiber tracts connecting the striatum (caudate and putamen) with four cortical regions corresponding to the hand, face, trunk, and leg motor areas. A multi-tensor tractography algorithm with an isotropic volume fraction compartment allows
estimating diffusion of fast-moving extra-cellular water in regions containing crossing fibers and provides quantification of a microstructural property related to tissue atrophy. The tissue atrophy rate is separately analyzed in eight cortico-striatal pathways as a function of CAG-repeats (genetic load) by statistically regressing out age effect from our cohort. The results demonstrate a statistically significant increase in isotropic volume fraction (atrophy) bilaterally in hand fiber connections to the putamen with increasing CAG-repeats, which connects the genetic abnormality (CAG-repeats) to an imaging-based microstructural marker of tissue integrity in specific white matter pathways in HD. Isotropic volume fraction measures in eight cortico-striatal pathways are also correlated significantly with total motor scores and diagnostic confidence levels, providing evidence of their relevance to HD clinical presentation.
Keywords: Prodromal-HD, diffusion MRI, isotropic volume fraction, CAG-repeats, cortico-striatal pathways
1. Introduction
Huntington’s disease (HD) is a genetic brain disorder that causes physical and mental decline, including uncontrollable movements, emotional problems, and loss of thinking abilities. Huntington’s disease is caused by expansion of CAG (cytosine-adenine-guanine) repeats in the Huntington (HTT) gene, with a threshold of 36 or more repeats (Vonsattel and DiFiglia, 1998). During the presymptomatic (prodromal-HD) phase, individuals do not manifest the characteristic motor symptoms necessary for a diagnosis, but they have been shown to exhibit mild sub-clinical cognitive, psychiatric and motor deficits. Symptoms of Huntington’s disease vary between individuals and its progression may evolve over years before formal diagnosis. Studies show that brain atrophy occurs gradually and typically starts years before symptom onset. Although this inherited disease currently has no cure, identification of reliable markers might be useful for future Huntington’s disease clinical trials to monitor disease progression and evaluate therapeutic efficacy (Ross et al., 2014).
Neuroimaging provides a powerful tool for detecting, understanding, and monitoring disease progression. Early works proposed to use Magnetic Resonance Imaging (MRI) to elucidate structural abnormalities in Huntington’s disease (Bohanna et al., 2008; Georgiou-Karistianis et al., 2013). In the PREDICT-HD and TRACK-HD studies, MRI measures, e.g., the whole-brain volume, caudate and putamen volumes, were examined to understand Huntington’s disease progression (Paulsen et al., 2008; Tabrizi et al., 2013; Paulsen et al., 2014). Several studies
have shown that volume reductions in the striatum, particularly within the caudate, can be observed as early as 10 years before diagnosis in prodromal-HD individuals (Harris et al., 1999; Thieben et al., 2002; Paulsen et al., 2008). Volume reductions in the globus pallidus (Harris et al., 1999; Thieben et al., 2002) and thalamus (Harris et al., 1999; Paulsen et al., 2006) have also been observed. The literature on cortical thinning has however been controversial. While some studies have found decreased cortical thickness in prodromal-HD (Rosas et al., 2005; Nopoulos et al., 2007; Bohanna et al., 2008), others have found increased grey matter volume (Aylward et al., 1996; Aylward et al., 1998; Paulsen et al., 2006). The relatively large longitudinal TRACK-HD study failed to find differences in cortical volumes at baseline and 12 months (Tabrizi et al., 2009; Tabrizi et al., 2011) in prodromal-HD, but did find reduced cortical thickness in occipital areas in prodromal-HD individuals who were closest to diagnosis at 24 months (Tabrizi et al., 2012), suggesting that cortical thickness changes may not be tied to motor symptom onset or that they occur only as secondary collateral damage measurable late in the prodromal-HD stage of the illness.
In addition to volumetric measures, studies of tissue microstructure have shown changes in Huntington’s disease. Mean diffusivity derived from diffusion weighted magnetic resonance imaging (dMRI) was found to have increased in the prefrontal cortex of prodromal-HD subjects (Rosas et al., 2006; Phillips et al., 2013; Matsui et al., 2014). In addition, the IMAGE-HD study (Poudel et al., 2015) showed evidence of longitudinal decline in white matter integrity in symptomatic Huntington’s disease using diffusion tensor imaging (DTI, a special case of dMRI which assumes a Gaussian diffusion profile at each voxel) data. DTI studies have also provided evidence of white matter degeneration in terms of reduced fractional anisotropy and increased radial diffusivity. It was suggested that these measures may provide unique information about the time-course and diagnosis of neurodegeneration in prodromal-HD (Liu et al., 2016). Other studies have reported reduced fractional anisotropy in several regions including the corpus callosum (Stoffers et al., 2010; Phillips et al., 2013), frontal tracts (Poudel et al., 2014; Phillips et al., 2014), thalamic tracts (Stoffers et al., 2010; Phillips et al., 2014), and white matter surrounding the striatum (Stoffers et al., 2010). These DTI findings have been thought to reflect degeneration at the cellular level and a reduction in white matter tract integrity (due to reduction in fractional anisotropy). Another recent work (Shaffer et al., 2016) used a multi-tensor tractography framework to analyze changes in the motor pathways in three groups clustered using the CAP score (product of CAG-repeats and age). The results showed significant differences in fractional anisotropy in the three groups in the motor pathways.
However, as has been shown in several recent works in diseases such as schizophrenia and Parkinson’s (Pasternak et al., 2015; Rotenberg et al., 2015; Planetta et al., 2016), the DTI model is simplistic and may not be appropriate to draw inferences about the neurobiological abnormalities in tissue. Adding an isotropic volume fraction compartment (Pasternak et al., 2009) to the standard DTI model provides more specificity and allows to quantify the volume fraction of fast moving extra-cellular water. The existence of the isotropic volume fraction has been validated in mouse models of demyelination and tissue loss (Wang et al., 2011). Similarly, it has been used in popular models like neurite orientation dispersion and density imaging (NODDI) (Zhang et al., 2012). In their work on comparing different diffusion models, Panagiotaki et al. show that adding an isotropic compartment better explains the dMRI signal (Panagiotaki et al., 2012).
In the study of schizophrenia and Parkinson’s (Pasternak et al., 2015; Rotenberg et al., 2015; Planetta et al., 2016), the authors have shown that including this isotropic volume fraction compartment provides better neurobiological clarity about the underlying tissue abnormality. For example, an increase in the isotropic volume fraction component could indicate loss of neurons or tissue atrophy. In schizophrenia, a simple DTI model pointed to decreased fractional anisotropy in several brain regions implying decreased white matter integrity. However, incorporating the isotropic volume fraction model pointed to widespread neuro-inflammation as a possible mechanism and very little change in white matter integrity (Pasternak et al., 2009; Pasternak et al., 2015). Thus, we hypothesize that the inferences drawn from the DTI model about reduced white matter integrity in Huntington’s disease may not be entirely accurate and need to be further tested using more advanced models of diffusion as is done in this work.
Recent studies on mouse models of Huntington’s disease have reported the existence of widespread brain atrophy in several brain regions (Steventon et al., 2016). Consequently, in this paper, we propose to use the isotropic volume fraction (a measure of tissue atrophy) estimated in an unscented Kalman filter based multi-tensor tractography framework (Malcolm et al., 2010; Baumgartner et al., 2012) to characterize white matter atrophy in prodromal-HD subjects. This framework allows to trace fiber tracts through crossing fiber regions while simultaneously estimating the isotropic volume fraction along the tracts. We hypothesize that we see a higher isotropic volume fraction in prodromal-HD subjects compared to normal controls, indicating increased brain atrophy. Note that, most earlier works have not investigated this aspect of Huntington’s disease pathophysiology due to the limitations of the DTI model.
Another novel aspect of our work is the design of a methodology to extract specific cortico-striatal tracts corresponding to the hand, face, trunk, and leg motor regions, as shown in Fig. 1. Previous studies have shown that the cortico-striatal pathway in the brain is key to early Huntington’s disease symptomatology and that Huntington’s disease affects the white matter causing dysfunction due to neuronal loss in the striatal circuits and cortical neurons that make up the cortico-striatal pathways (Macdonald and Halliday, 2002; Cepeda et al., 2003; Cepeda et al., 2007; Vonsattel et al., 2008). However, for the first time in this study, we trace and differentially analyze these specific tracts connecting the hand, face, trunk, and leg areas in the cortex to the caudate and putamen (Haber and Calzavara 2009) and estimate the isotropic volume fraction in these tracts in a large longitudinal data set. This allows us to evaluate the sensitivity of isotropic volume fraction to detect tissue atrophy in different motor areas and its specificity to different anatomical parts of the cortico-striatal pathway.
To investigate if specific cortico-striatal pathways exhibit differential rates of atrophy in prodromal-HD subjects, we analyze the PREDICT-HD data, which is a longitudinal dataset collected from gene expansion negative controls and subjects with prodromal-HD. Specifically, we investigate the longitudinal isotropic volume fraction from three perspectives: 1) its sensitivity to brain atrophy in prodromal-HD subjects in comparison to healthy controls; 2) its correlation to genetic load, the CAG repeats; 3) its correlation to behavioral and clinical tests, such as total motor scores and diagnostic confidence level. We performed these tests using linear mixed-effects models for the population of healthy controls and prodromal-HD, respectively. The experimental results (after multiple hypothesis correction) indicate that the isotropic volume fraction, specifically in the bilateral hand motor tracts could be used as an imaging marker of genetic load and symptom severity in prodromal-HD.
2. Materials and methods
In this work, we analyzed the longitudinal diffusion MRI data set of prodromal-HD subjects acquired as part of the PREDICT-HD project (Paulsen et al., 2014). Under the guidance of an expert neuroanatomist (Dr. Makris) we manually created a modification of the Desikan-Killiany cortical atlas (Desikan et al., 2006) typically used with FreeSurfer (Fischl et al., 2004), to produce a new atlas that includes delineations of the hand, face, trunk, and leg sub-regions of the motor cortex. These new expert-defined atlas regions were spatially mapped to the T1-weighted image of each individual subject. Whole brain multi-tensor tractography was performed on the dMRI data and white matter tracts connecting the striatum (caudate and putamen) with each of the four cortical motor regions were
extracted, as shown in Fig. 1. The isotropic volume fraction was estimated in each of the fiber bundles (a total of sixteen fiber bundles; four cortico-caudal and four cortico-putamen in each hemisphere) and mixed-effects models (Pinherio and Bates, 2004) were used to analyze the data as described in the subsequent section.
2.1. Linear mixed-effects model
Typically, regression models are selected to estimate the correlation between variables, for example, the correlation of the isotropic volume fraction with age, CAG, or total motor scores. Mixed-effects models are an extension of standard regression models and are more suitable for longitudinal data because they can account for the dependency due to repeated measures or data in groups. A mixed-effects model has both fixed and random effects while a standard regression model has only fixed effects. Specifically, the fixed-effects terms in a mixed-effects model correspond to the conventional regression part, and the random-effects terms are associated with individual experimental units drawn at random from a population. In this paper, we use a linear mixed-effects model to study a population of longitudinal data, i.e., the population of healthy controls and the population of prodromal-HD subjects. Assume in a population there are N subjects and the dMRI measures for subject 𝑖 (𝑖 = 1, … , 𝑁) are collected at 𝑛𝑖 time points. For such longitudinal data, the mixed-effects model estimates the relationship between a dMRI measure and associated subject attributes through multilevel regression. The model can be expressed as:
𝑦𝑖𝑗= 𝛽0+ 𝛽1𝑥𝑖𝑗+ 𝛾0𝑖+ 𝛾1𝑖𝑢𝑖𝑗+ 𝜖𝑖𝑗, 𝑖 = 1, 2, … , 𝑁, 𝑗 = 1, 2, … , 𝑛𝑖. (1)
Here, 𝑦𝑖𝑗 corresponds to the response, e.g., the isotropic volume fraction, for the 𝑖-th individual measured at the 𝑗-th time point; 𝑥𝑖𝑗 is the independent variable and depends on the task, e.g., the age of the subject or the CAG repeats if
we regress out the age effect later; 𝑢𝑖𝑗 is the independent variable in the random effect term analogous to 𝑥𝑖𝑗. The parameters 𝛽0 and 𝛽1 are the average intercept and slope shared among the population, while 𝛾0𝑖 and 𝛾1𝑖 are the
random effects intercept and slope, the specific parameters for subject 𝑖. The random variable 𝜖𝑖𝑗∼ 𝑁(0, 𝜎2) is the
independent error, which follows a normal distribution with zero mean and a standard deviation of 𝜎. The random effects are designed to account for the dependency of the data in several variables. For example, the dependency could exist in the data collected from the same subject, the same gender (Zielonka et al. 2013), the same scanner, or subjects with the same CAG repeats. Hence, our linear mixed-effects model has the following formulation:
𝑦𝑖𝑗= 𝛽0+ 𝛽1𝑥𝑖𝑗+ 𝛾0𝑖𝑠𝑢𝑏+ 𝛾1𝑖𝑠𝑢𝑏𝑢𝑖𝑗+ 𝛾0𝑘𝑔𝑒𝑛+ 𝛾1𝑘𝑔𝑒𝑛𝑣𝑖𝑗+ 𝛾0𝑟𝐶𝐴𝐺+ 𝛾1𝑟𝐶𝐴𝐺𝑤𝑖𝑗+ 𝛾0𝑠𝑠𝑐𝑎𝑛+ 𝛾1𝑠𝑠𝑐𝑎𝑛𝑠𝑖𝑗+ 𝜖𝑖𝑗, (2)
fixed effects random effects
fixed effects random effects
where 𝑘 represents male or female, 𝑟 is the number of CAG repeats, 𝑠 represents the scanner site; while 𝑢𝑖𝑗, 𝑣𝑖𝑗, 𝑤𝑖𝑗,
and 𝑠𝑖𝑗 are random effect variables analogous to 𝑥𝑖𝑗. Note that our data was collected at several different sites, and
hence we use the scanner site as a co-variate to account for scanner related differences. This linear mixed-effects model can be used to detect the caudate and putamen volume loss over age, to measure the change in the isotropic volume fraction with age in a population, and to estimate the correlation of the isotropic volume fraction with total motor scores and diagnostic confidence levels.
Meanwhile, we are also interested in exploring the correlation between the isotropic volume fraction and CAG repeats for Huntington’s disease subjects. As is known from literature, dMRI measures such as fractional anisotropy and the isotropic volume fraction change with age. To compute correlation between the isotropic volume fraction and CAG repeats, we should first remove the effect of age on the estimated the isotropic volume fraction. Therefore, we estimated the change in the isotropic volume fraction with age in the normal control population and regressed it out from the HD group. In particular, we used the above linear mixed-effects model (Eq. 2) to estimate the normal control group trend, represented by the fixed effects parameters (𝛽0𝑛𝑜𝑟𝑚𝑎𝑙 and 𝛽1𝑛𝑜𝑟𝑚𝑎𝑙). With respect to the
estimated normal control group trend, we compute the residuals of the isotropic volume fraction for prodromal-HD subjects 𝛿𝑦𝑖𝑗𝐻𝐷 as follows:
𝛿𝑦𝑖𝑗𝐻𝐷 = 𝑦𝑖𝑗𝐻𝐷− (𝛽0𝑛𝑜𝑟𝑚𝑎𝑙+ 𝛽1𝑛𝑜𝑟𝑚𝑎𝑙𝑥𝑖𝑗𝐻𝐷), (3)
where 𝑥𝑖𝑗𝐻𝐷represents the age of the HD subject and 𝑦𝑖𝑗𝐻𝐷represents its measured the isotropic volume fraction. This
is further used to compute the correlations between the residuals and CAG repeats using the linear mixed-effects model. In this task, since the age effect has been regressed out, 𝑥𝑖𝑗 in Eq. 2 corresponds to CAG repeats,
𝑦𝑖𝑗 corresponds to the isotropic volume fraction residuals for prodromal-HD subjects, and the random effects involve
the subject-, gender-, and scanner-specific dependency.
2.2. PREDICT-HD data
We use data collected by the PREDICT-HD project (Paulsen et al., 2014), an observational study of the earliest signs of Huntington’s disease. This study involved more than 600 participants, but we used the data from only those individuals who have at least two MRI scans. This yielded 331 subjects with 830 scans collected at 2 to 5 time
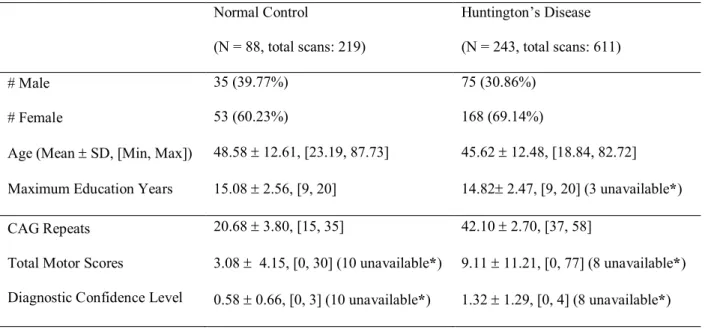
points. Specifically, 202 subjects have 2 scans, 94 subjects have 3 scans, 31 subjects have 4 scans, and 4 subjects have 5 scans. Additionally, the PREDICT-HD study provides genetic load for each subject, i.e., the CAG repeats, and clinical scores, e.g., total motor scores and diagnostic confidence levels after each visit. The demographic and clinical information of the data used in this study is shown in Table 1.
Participants. This study included 243 individuals with prodromal-HD and 88 normal controls. All participants were right handed and underwent at least two longitudinal imaging sessions, resulting in a total of 611 prodromal-HD and 219 healthy control imaging sessions. Additional demographic characteristics for this sample are shown in Table 1. The groups did not differ in terms of number of imaging sessions performed per participant, overall duration of time between imaging sessions, or education. PREDICT-HD exclusion criteria included (a) sufficient motor signs for a motor diagnosis at study entry; (b) history of traumatic brain injury or other central nervous system injury or diseases; (c) pacemakers or metallic implants; (d) prescribed antipsychotic or phenothiazine-derivative antiemetic medication in the past six months; and (e) clinical evidence of unstable medical or psychiatric illness.
Imaging Parameters. A total of 830 T1 and T2-weighted anatomical and diffusion-weighted images were acquired on 3T scanners at 15 sites, representing 3 scanner manufacturers (GE, Philips, and Siemens). Due to varying scanning site capabilities and support resources, a minimum set of criteria were specified for merging the diffusion- weighted imaging (DWI) data sets from different sites: 1) Only DWI data sets with more than 28 quality approved gradient directions, 2) voxel volume was required to be less than 9.6 cubic mm with a maximum voxel length of 2.4mm, 3) All directional gradients needed to be within 2% of 1000 for their b-value, and 4) anatomical coverage needed to completely include all the tracts of interest. The most frequently used MRI acquisition parameters are given in Table 2. After visual inspection of all images, we excluded 13 T2-weighted MRI scans, resulting in 636 multimodal and 13 single modal inputs for structural MRI processing. Processed T2-weighted images were then used along with DWI data in the diffusion analysis pipeline and the T1-weighted images were used for the 13 sessions where the T2- weighted images were not available.
2.3. Image Processing
Structural and diffusion-weighted MR images were processed using the BRAINSTools suite (https://github.com/BRAINSia/ BRAINSTools.git) and ANTs packages (Avants et al., 2009). An extensible
processing pipeline was developed in Nipype (Gorgolewski et al., 2011) that utilizes high performance computing resources to achieve time-efficient data processing and tractography analysis on large-scale multi-center diffusion-weighted images.
Structural MRI Processing. Structural MR Images (T2-weighted (T2-w) and/or T1-weighted (T1-w) images) were utilized to fix susceptibility-induced anatomical distortions in diffusion-weighted imaging data and provide precise anatomical labeling for dMRI processing and analysis. All available structural modalities, T1- and when available T2-weighted images, of each dataset were processed jointly to improve the robustness of the processing using complimentary information provided by multiple modalities. In the 13 cases where the T2 image was not available, a T1-only data processing was performed to identify anatomical brain regions. The T1-only morphometric processing was accurate enough for the subsequent tracts of interest extraction method. First, structural MR data were spatially normalized to a common reference orientation defined by anterior commissure-posterior commissure (AC-PC) line and inter-hemispheric fissure (Lu and Johnson, 2010; Ghayoor et al., 2017). The images were then processed through an Expectation Maximization (EM) and a fuzzy k-Nearest Neighbor (KNN) tissue classification that incorporates bias-field correction, image registration, and tissue classification (Kim and Johnson, 2013; Ghayoor et al., 2016). Whole brain segmentation (i.e. labeling) was performed first by applying the standard FreeSurfer pipeline (Fischl et al., 2004), and then by augmenting the resulting Desikan-Killany segmenation of the cortex (Desikan et al., 2006) with a custom-made parcellation of the motor cortex into four functional sub-regions, as described in further detail in a section below.
Diffusion MRI Processing. The dMRI processing first employed the quality-control procedures described in our previous works (Matsui et al., 2014; Oguz et al., 2014) to prepare dMRI scans by removing slice-wise and interlace artifacts as well as correcting for eddy-current and motion artifacts. The quality-controlled dMRI scans were further processed to integrate susceptibility artifact correction using a non-linear constrained registration in the phase-encoding direction available from the ANTs packages (Avants et al., 2009). The constrained registration only allows warping within the plane (i.e. within image slice) for the phase encoding direction, and is primarily used to improve anatomical alignment of the diffusion images to the morphometric scans. To enhance the quality of our data and to allow for detection of multiple fibers from the sparse set of gradient directions acquired, we used our compressed
sensing algorithm (Michailovich et al., 2011; Rathi et al., 2014) to reconstruct the signal into a canonical set of 81 gradient orientations.
Multi-tensor tractography. Whole brain tractography was performed using our multi-fiber (multi-tensor) model to trace through crossing fiber regions. The multi-tensor unscented Kalman filter tractography (UKFt) method consisted of two anisotropic tensors along with an isotropic volume compartment to model fast extracellular water diffusion (Malcolm et al., 2010; Baumgartner et al., 2012; Reddy and Rathi, 2016). The model estimated a convex combination of weights for the anisotropic fiber compartment and the isotropic volume compartment with the diffusivity of the isotropic volume set to 3 x 10⁻³ s/mm2 as in our previous work (Pasternak et al., 2009;
Baumgartner et al., 2012). UKFt parameter settings were determined via empirical testing on a subset of the dataset. To maximize sensitivity to the cortico-striatal connections, the fractional anisotropy and generalized anisotropy thresholds for seeding/stopping tractography were set to 0.06, and 10 fiber seeds were initiated per voxel. All tractography results (for all subjects) underwent a quality check using the white matter analysis (O’Donnell and Westin, 2007) quality control tool, which enables rapid visual inspections of tractography results by human experts. Subjects that failed this quality control check were excluded.
Extracting cortico-striatal tracts for hand, face, trunk, and leg regions. The extraction of the tracts under investigation in the present study requires a cortical atlas that defines the hand, leg, face and trunk functional sub-regions of the motor cortex. However, the standard Desikan-Killany atlas (Desikan et al., 2006) typically used with FreeSurfer does not distinguish between different sub-regions of the motor cortex. However, the FreeSurfer processing pipeline allows users to create custom-made cortical atlases (Fischl et al., 2004).
To that effect, under the guidance of an expert neuroanatomist (Dr. Makris), we manually delineated the hand, leg, face and trunk sub-regions of the motor cortex on the anatomical (T1) MRI images of six healthy control subjects that were not part of the present study. We then used the “mris_ca_train” FreeSurfer command to create a new atlas which augments the standard Desikan-Killany atlas with these new four regions. Then, the “mris_ca_label” and “mri_aparc2aseg” FreeSurfer commands were used to individually map this new atlas to all the subjects used in the present study.
This newly created, custom-made cortical parcellation was used in conjunction with the White Matter Query Language (WMQL) (Wassermann et al., 2016), in order to perform tract extraction. WMQL is a powerful, automated tract extraction method that uses gray matter regions of interest from the cortical parcellation as
anatomical queries for constructing white matter tracts. Specifically, for each cerebral hemisphere in each subject, we used WMQL to extract the tracts that connect each of the four motor cortex subregions (hand, face, trunk, and leg) to one of the two subcortical nuclei (caudate, putamen), for a total of eight tracts for each hemisphere.
3. Results
Caudate/Putamen volume loss. To confirm the reported decrease in volume size of caudate and putamen (Paulsen et al., 2008) in our data set, we investigated the volume size changes in both normal control and prodromal-HD groups. The changes were captured by using a linear mixed-effects model as in Equation (2), where the explanatory variable is the age and the response variable is the volume size). By applying this model to the longitudinal data for the caudate and putamen, we estimated a global intercept 𝛽0 and slope 𝛽1 for each structure in each group. A p-value
for each parameter was also obtained and adjusted by the use of linear step-up (LSU) procedure originally introduced by Benjamini and Hochberg (Benjamini and Hochberg, 1995) to indicate the significance of the estimate. As shown in Fig. 2, the solid lines depict the global trend of volume loss over age, and the bars depict the FDR-adjusted p-values of the global estimate of the slope. The FDR-adjusted p-values for the intercept estimates are all close to zero, which are not shown in Fig. 2. Considering a significance level of 0.05, all estimates for global intercepts and slopes are statistically significant (see Supplementary material, Table 1 for the actual p-values). That is, there is a correlation between volume size of caudate and putamen with age. Compared with the normal control group, the prodromal-HD group had a reduced volume size for the caudate and the putamen and a significantly faster degeneration rate as expected.
Isotropic volume fraction changes over age for different sensorimotor areas. To investigate longitudinal changes in the isotropic volume fraction (related to tissue atrophy), we leverage the longitudinal data and use the linear mixed-effects model to estimate group trends for both normal controls and prodromal-HD groups. Fig. 3 shows the isotropic volume fraction changes in fiber bundles from hand, face, trunk, and leg sensorimotor areas to left and right caudate and putamen, respectively. Overall, most of the estimated trends suggest an increase in the isotropic volume fraction with age, from the four cortical areas to the caudate and putamen. Based on the estimated p-values (after FDR correction) for the intercept (not shown in Fig. 3) and slope, the prodromal-HD group trends are all significant at the level of 0.05 (also see Supplementary material, Table 2 for the actual p-values). For the
normal control group, while fiber bundles associated with the caudate have no significant increase in the isotropic volume fraction, some fiber bundles associated with the putamen show significant changes in the isotropic volume fraction, including the left putamen to hand, face, and leg areas, as well as the right putamen to hand, trunk, and leg regions (see Fig. 3). These results indicate that for Huntington’s disease, significant isotropic volume fraction changes were detected in all cortico-striatal pathways, while for healthy controls the pathways connecting the putamen show more significant isotropic volume fraction changes than those connected to the caudate.
It is worth to mention that the isotropic volume faction contributes only about 10-15% (0.1-0.15) of the total signal volume fraction, as shown in Fig.3. This is small and in-line with that expected in white matter tissue. However, it is elevated in HD due to tissue atrophy. In light of the histology work of (Wang et al. 2011), it is likely that there exist small pockets of fast moving water within the tissue, which indicate tissue atrophy as is known to exist in HD. Differential rate of increase in the isotropic volume fraction with age. To further investigate which region shows a faster rate of increase in the isotropic volume fraction (or atrophy), we estimated group trends in different regions for both normal control and prodromal-HD subjects. In particular, we compared the isotropic volume fraction difference between these two groups at age 50 (years), as the fit from linear regression has the lowest uncertainty at this age. Specifically, we estimated the isotropic volume fraction at age 50 for both groups and then computed their difference. To ensure robustness of the results, we color coded the rates such that the blue bars indicate connections for which the slope was statistically significant (after FDR correction). As shown in Fig. 4 (top row), at the age of 50 years, the average isotropic volume fraction in the prodromal-HD group is larger than that for the normal control group in almost all cortico-striatal pathways. The top two significant fiber connections on the list are hand to the bilateral putamen, as shown on the top right of Fig.4.
In addition, the rate of increase in the isotropic volume fraction in prodromal-HD subjects is also faster than controls in almost all pathways. By discarding estimates with adjusted p-value larger than 0.05 (the gray bars in Fig. 4), the fiber bundles connecting hand and leg to right putamen show the fastest increase in the isotropic volume fraction (i.e., fastest rate of atrophy). The fiber bundle connecting hand to left putamen also shows similar rate of atrophy. Thus, after accounting for the normal degeneration rate (from healthy controls), the cortico-striatal hand motor fibers seem to degenerate faster than other fiber tracts in Huntington’s disease.
Isotropic volume fraction correlation with genetic load. The number of CAG repeats determines whether a subject will develop Huntington’s disease during his or her lifetime. We aim to find the correlation between this genetic load and isotropic volume fraction in the prodromal-HD group. To achieve this goal, we first regress out the effects of normal aging on changes in the isotropic volume fraction, and then estimate the relationship between the isotropic volume residuals and CAG repeats in prodromal-HD subjects. Although no significant correlations are found in caudal connections, motor regions connected to the putamen show significant correlations, for example, hand to the left and right putamen and leg to the right putamen, as shown in Fig. 5 (also see Supplementary material, Table 3 for the actual p-values). In addition, face to the left putamen and trunk to the right putamen (in Fig. 5) also show a significant change in the slope, indicating strong correlation between the isotropic volume fraction and CAG repeats in these regions. These results indicate that the isotropic volume fraction correlates with the genetic load in prodromal-HD subjects, and it further confirms that the putamen (and its motor connections) could play a critical role in early assessment of degeneration in Huntington’s disease.
Isotropic volume fraction correlates with clinical scores. To further explore the relationship of the isotropic volume fraction with clinical scores, we used total motor scores and diagnostic confidence levels of prodromal-HD subjects using linear mixed-effects models. These scores are used to define motor diagnosis in at-risk individuals, and we study them only in prodromal-HD subjects. In addition, for each motor area we average the isotropic volume fraction from the bilateral tracts of the caudate or the putamen. The experimental results are shown in Fig. 6. In all regions except for trunk to the caudate for testing total motor scores correlation, the isotropic volume fraction was significantly correlated with both total motor scores and diagnostic confidence level with p < 0.05 (see FDR corrected p-values in Supplementary material, Table 4).
Exploratory tissue fractional anisotropy (FAt) and mean diffusivity analyses. We also investigated if white
matter integrity as measured by tract-specific fractional anisotropy (FAt) was affected in prodromal-HD, as has been
reported in several works using the standard DTI model (Poudel et al., 2015; Liu et al., 2016). Using our multi-tensor and isotropic volume compartment model, we found no statistically significant differences in the rate of change of FAt (slope) with age between the prodromal-HD and normal control group. We note that the FAt measure
used in this work is obtained from the principal diffusion tensor estimated and oriented along the fiber tracts and thus is different than the standard DTI-based fractional anisotrophy measure (which does not account for crossing fibers). Further, FAt also did not correlate with CAG-repeats in the prodromal-HD subjects. The change in mean
diffusivity (proportional to the trace of the principal diffusion tensor) with age also did not differ between the two groups, except for the fiber bundle connecting the putamen with the hand motor areas. Thus, when using a different model of diffusion, we find that only the atrophy-related measure of the isotropic volume fraction to be statistically different between the groups.
4. Discussion
In this paper, we present a unique longitudinal study of Huntington’s disease in a large cohort of subjects by delineating specific fiber tracts connecting the striatum with four cortical motor regions, i.e., hand, face, trunk, and leg. Our approach utilizes the dependency in the longitudinal data by using linear mixed-effects models. We analyzed the isotropic volume fraction, a measure of tissue atrophy, in the cortico-striatal pathways and determined its correlation with age, genetic load, and clinical severity scores.
Previous studies on Huntington’s disease often performed group comparison between Huntington’s disease (or prodromal-HD) subjects and normal controls based on CAP scores (Zhang et al., 2011; Shaffer et al., 2016). The CAP score is computed using the number of CAG repeats and the subject’s age. Here, instead of using the CAP score, we demonstrate a direct correlation of the isotropic volume fraction with CAG-repeats, by removing aging related effects in our longitudinal data. To the best of our knowledge, this is the first time that the genetic load in the prodromal-HD group has been shown to correlate with abnormality in specific cortico-striatal white matter tracts using an image-based marker. Significant correlations of the isotropic volume fraction (indicating atrophy) with CAG repeats are seen in connections to the four motor areas, especially to the hand motor areas (Fig. 5). The fibers connecting the cortical hand motor area demonstrate more atrophy than other motor areas. While our study connects the imaging, genetic and behavioral measures (motor scores), a recent study (Collins et al., 2014) showed that hand tapping performance was correlated with CAG-repeats and could be used as a longitudinal behavioral marker to assess progression of Huntington’s disease. In a similar spirit, we believe that the proposed isotropic volume fraction estimated in the white matter tracts connecting the hand motor area could be used as an imaging marker of disease severity with possible use to monitor therapeutic interventions.
Furthermore, our results confirm earlier results on the volumetric loss in both caudate and putamen (Niccolini and Politis, 2014). A faster volume loss rate is detected in the caudate in prodromal-HD, as shown in Fig. 2. This result is consistent with the previous studies on longitudinal change in basal ganglia volume and studies on rate of caudate
atrophy in patients with Huntington’s disease (Aylward et al., 1997; Aylward et al., 2000). This previous study suggested that change in caudate volume may be useful for assessing treatment effectiveness in both pre-symptomatic and pre-symptomatic subjects. However, our analysis of white matter microstructure from dMRI measures in the cortico-striatal pathways shows that the fibers connecting motor areas to the putamen are more affected in prodromal-HD than those to the caudate, especially as demonstrated by the isotropic volume fraction changes over age (Fig. 3) and the correlation of the isotropic volume residuals with CAG-repeats (Fig. 5). A recent study (Singhal and Kim, 2017) also shows that caudate has a less degree of involvement in Huntington’s disease and putaminal hypometabolism exceeds caudate changes on 18F-FDG PET imaging. Thus, the motor fibers connected to the putamen may be a better imaging marker for assessing structural changes in prodromal-HD.
Previous DTI studies on Huntington’s disease suggested that fractional anisotropy is more sensitive than mean diffusivity in detecting structural changes in prodromal-HD (Liu et al., 2016). However, in our experiments, the isotropic volume fraction outperforms both fractional anisotropy and mean diffusivity by demonstrating stronger correlation with age and CAG-repeats. We should note that, using a more advanced model of diffusion that incorporates multiple crossing fibers and an isotropic volume compartment lends increased specificity and sensitivity to the obtained results as seen in studies on other neurodegenerative disorders such as Parkinson’s disease (Planetta et al., 2016; Lyall et al., 2017). Our results indicate that the isotropic volume fraction could be a potential imaging maker for monitoring the progression of Huntington’s disease.
Figure legend list:
Fig 1. White matter tracts connecting the striatum (top: caudate and bottom: putamen) with four cortical motor regions (left to right: hand, face, trunk, and leg).
Fig 2. Volume loss of the caudate and putamen over age. Lines illustrate estimates of the group trend for each population, normal controls (NC) or subjects with Huntington’s disease (prodromal-HD). Grey areas show the 95% confidence intervals for the estimated group trends. Bars indicate the FDR-corrected p-values for the estimation of slope (decay rate).
Fig 3. Longitudinal analysis of the isotropic volume fraction of the caudate and putamen, connected with four motor regions, i.e., hand, face, trunk, and leg. Lines show the estimated group trend for each population, normal control
(NC) and prodromal-HD. Grey areas show the 95% confidence intervals for the estimated group trends. Bars present the FDR-adjusted p-values for the estimation of slope using the linear mixed-effects model. An adjusted p-value less than 0.05 indicates the estimate is significant and reliable. The title of each sub-figure details tractography
connections that were reliably traced from the total scans in each group.
Fig 4. Comparison of the isotropic volume fraction between Normal Control (NC) and prodromal-HD groups. Top: the averaged isotropic volume fraction values estimated at the age of 50 years old for different regions. Bottom: the degeneration rates (slopes of estimated group trends) for different regions. From left to right: NC group, HD group, and their differences. Gray bars were used in those regions where estimate for the slope is not significant at the level of 0.05 (i.e., no significant correlation between isotropic volume fraction and age), while blue bars indicate that the results are significant at the level of 0.05. (Cau: Caudate, Put: Putamen).
Fig 5. Correlations between the isotropic volume fraction residuals (after regressing out the effect of age) and CAG repeats in prodromal-HD group for white matter connections to left caudate, left putamen, right caudate, and right putamen (from top to bottom). Lines depict estimates of group trends, gray areas indicate their 95% confidence intervals, and bars indicate the corresponding p-values of the estimated intercepts (𝛽0) and slopes (𝛽1). The title of
each sub-figure details tractography connections and the number of scans for which robust connections were obtained out of total scans in prodromal-HD group.
Fig 6. Correlations between the isotropic volume fraction and (a) total motor scores (TMS), (b) diagnostic confidence level (DCL) in prodromal-HD group for caudate (top) and putamen (bottom). Lines show estimates of group trends, gray areas indicate their 95% confidence intervals, and bars present the corresponding FDR-corrected p-values of the estimated intercepts (𝛽0) and slopes (𝛽1).
Funding
This work was supported by U01NS083223 (PI: Westin), U01CA199459 (PI: O’Donnell Open Source Diffusion MRI Technology for Brain Cancer Research), R01MH097979 (PI: Rathi), P41EB015902 PI: Westin (co-investigators O’Donnell and Rathi), R01NS040068, and Neuroimage Analysis Center.
References
Avants BB, Tustison NJ, Song G, Gee JC (2009): Ants: Open-source tools for normalization and neuroanatomy. HeanetIe 10: 1-11.
Aylward EH, Anderson NB, Bylsma FW, Wagster MV, Barta PE, Sherr M, et al. (1998): Frontal lobe volume in patients with Huntington's disease. Neurology 50(1): 252-258.
Aylward EH, Codori AM, Barta PE, Pearlson GD, Harris GJ, Brandt J (1996): Basal ganglia volume and proximity to onset in presymptomatic Huntington disease. Archives of neurology 53(12): 1293-1296.
Aylward EH, Codori AM, Rosenblatt A, Sherr M, Brandt J, Stine OC, et al. (2000): Rate of caudate atrophy in presymptomatic and symptomatic stages of Huntington's disease. Movement Disorders 15(3): 552-560.
Aylward EH, Li Q, Stine OC, Ranen N, Sherr M, Barta PE, et al. (1997): Longitudinal change in basal ganglia volume in patients with Huntington's disease. Neurology 48(2): 394-399.
Baumgartner C, Pasternak O, Bouix S, Westin CF, Rathi Y (2012): Filtered multi-tensor tractography using free water estimation. In International Society for Magnetic Resonance in Medicine Meeting.
Benjamini Y, Hochberg Y (1995): Controlling the false discovery rate: a practical and powerful approach to multiple testing. Journal of the royal statistical society Series B (Methodological): 289-300.
Bohanna I, Georgiou-Karistianis N, Hannan AJ, Egan GF (2008): Magnetic resonance imaging as an approach towards identifying neuropathological biomarkers for Huntington's disease. Brain research reviews 58: 209-225.
Cepeda C, Hurst RS, Calvert CR, Hernández-Echeagaray E, Nguyen OK, Jocoy E, et al. (2003): Transient and progressive electrophysiological alterations in the corticostriatal pathway in a mouse model of Huntington's disease. Journal of Neuroscience 23(3): 961-969.
Cepeda C, Wu N, André VM, Cummings DM, Levine MS (2007): The corticostriatal pathway in Huntington's disease. Progress in neurobiology 81(5): 253-271.
Collins LM, Lazic SE, Barker RA (2014): A retrospective analysis of hand tapping as a longitudinal marker of disease progression in Huntington’s disease. BMC neurology 14(1): 1.
Desikan RS, Segonne F, Fischl B, Quinn BT, Dickerson BC, Blacker D, et al. (2006): An automated labeling system for subdividing the human cerebral cortex on MRI scans into gyral based regions of interest. NeuroImage 31: 968– 980.
Fischl B, Van Der Kouwe A, Destrieux C, Halgren E, Ségonne F, Salat DH, et al. (2004): Automatically parcellating the human cerebral cortex. Cerebral cortex 14(1): 11-22.
Georgiou-Karistianis N, Scahill R, Tabrizi SJ, Squitieri F, Aylward E (2013): Structural MRI in Huntington's disease and recommendations for its potential use in clinical trials. Neuroscience and Biobehavioral Reviews 37: 480-490.
Ghayoor A, Paulsen JS, Kim RE, Johnson HJ (2016): Tissue classification of large-scale multi-site MR data using fuzzy k-nearest neighbor method. In SPIE Medical Imaging International Society for Optics and Photonics: 97841V.
Ghayoor A, Vaidya JG, Johnson HJ (2017): Robust Automated Constellation-Based Landmark Detection in Human Brain Imaging. Neuroimage.
Gorgolewski K, Burns CD, Madison C, Clark D, Halchenko YO, Waskom ML, et al. (2011): Nipype: a flexible, lightweight and extensible neuroimaging data processing framework in python. Frontiers in neuroinformatics 5: 13.
Haber SN, Calzavara R (2009): The cortico-basal ganglia integrative network: the role of the thalamus. Brain research bulletin, 78(2-3), 69-74.
Harris GJ, Codori AM, Lewis RF, Schmidt E, Bedi A, Brandt J (1999): Reduced basal ganglia blood flow and volume in pre-symptomatic, gene-tested persons at-risk for Huntington's disease. Brain 122(9): 1667-1678.
Kim EY, Johnson HJ (2013): Robust multi-site MR data processing: iterative optimization of bias correction, tissue classification, and registration. Frontiers in neuroinformatics 7: 29.
Liu W, Yang J, Burgunder J, Cheng B, Shang H (2016): Diffusion imaging studies of Huntington's disease: A meta-analysis. Parkinsonism & Related Disorders 32: 94-101.
Lu W, Johnson H (2010): Introduction to ITK resample in-place image filter. The insight journal 3-6.
Lyall AE, Pasternak O, Robinson DG, Newell D, Trampush JW, Gallego JA, et al. (2017): Greater extracellular free-water in first-episode psychosis predicts better neurocognitive functioning. Molecular Psychiatry.
Macdonald V, Halliday G (2002): Pyramidal cell loss in motor cortices in Huntington's disease. Neurobiology of disease 10(3): 378-386.
Malcolm JG, Shenton ME, Rathi Y (2010): Filtered multitensor tractography. IEEE transactions on medical imaging 29(9): 1664-1675.
Matsui JT, Vaidya JG, Johnson HJ, Magnotta VA, Long JD, Mills JA, et al. (2014): Diffusion weighted imaging of prefrontal cortex in prodromal Huntington's disease. Human brain mapping 35(4): 1562-1573.
Michailovich O, Rathi Y, Dolui S (2011): Spatially regularized compressed sensing for high angular resolution diffusion imaging. IEEE transactions on medical imaging 30(5): 1100-1115.
Niccolini F, Politis M (2014): Neuroimaging in Huntington’s disease. World journal of radiology 6(6): 301.
Nopoulos P, Magnotta VA, Mikos A, Paulson H, Andreasen NC, Paulsen JS (2007). Morphology of the cerebral cortex in preclinical Huntington’s disease. American Journal of Psychiatry 164(9): 1428-1434.
O'Donnell LJ, Westin CF (2007): Automatic tractography segmentation using a high-dimensional white matter atlas. IEEE transactions on medical imaging 26(11): 1562-1575.
Oguz I, Farzinfar M, Matsui J, Budin F, Liu Z, Gerig, G, et al. (2014): DTIPrep: quality control of diffusion-weighted images. Frontiers in neuroinformatics 8: 4.
Panagiotaki E, Schneider T, Siow B, Hall MG, Lythgoe MF, Alexander DC (2012): Compartment models of the diffusion MR signal in brain white matter: a taxonomy and comparison. Neuroimage, 59(3): 2241-2254.
Pasternak O, Westin CF, Dahlben B, Bouix S, Kubicki M (2015): The extent of diffusion MRI markers of neuroinflammation and white matter deterioration in chronic schizophrenia. Schizophrenia research 161(1): 113-118.
Pasternak O, Sochen N, Gur Y, Intrator N, Assaf Y (2009): Free water elimination and mapping from diffusion MRI. Magnetic Resonance in Medicine 62(3): 717-730.
Paulsen JS, Langbehn DR, Stout JC, Aylward E, Ross CA, Nance M, et al. (2008): Detection of Huntington’s disease decades before diagnosis: the Predict-HD study. Journal of Neurology, Neurosurgery & Psychiatry 79(8): 874-880.
Paulsen JS, Long JD, Ross CA, Harrington DL, Erwin CJ, Williams JK, et al. (2014): Prediction of manifest Huntington’s disease with clinical and imaging measures: A prospective observational study. Lancet Neurol 13(12): 1193–1201.
Paulsen JS, Magnotta VA, Mikos AE, Paulson HL, Penziner E, Andreasen NC, et al. (2006): Brain structure in preclinical Huntington’s disease. Biological psychiatry 59(1): 57-63.
Phillips O, Sanchez-Castaneda C, Elifani F, Maglione V, Di Pardo A, Caltagirone C, et al. (2013): Tractography of the corpus callosum in Huntington’s disease. PloS one 8(9): e73280.
Phillips O, Squitieri F, Sanchez-Castaneda C, Elifani F, Caltagirone C, Sabatini U, et al. (2014): Deep white matter in Huntington's disease. PloS one 9(10): e109676.
Pinherio JC, Bates DM (2004): Mixed-effects models in S and S-PLUS. Statistics and Computing Series.
Planetta PJ, Ofori E, Pasternak O, Burciu RG, Shukla P, DeSimone JC, et al. (2016): Free-water imaging in Parkinson’s disease and atypical parkinsonism. Brain 139 (Pt 2): 495-508.
Poudel GR, Stout JC, Churchyard A, Chua P, Egan GF, Georgiou-Karistianis N (2015): Longitudinal change in white matter microstructure in Huntington's disease: The IMAGE-HD study. Neurobiology of disease 74: 406-412.
Poudel GR, Stout JC, Salmon L, Churchyard A, Chua P, Georgiou-Karistianis N, et al. (2014): White matter connectivity reflects clinical and cognitive status in Huntington's disease. Neurobiology of disease 65: 180-187.
Rathi Y, Michailovich O, Laun F, Setsompop K, Grant PE, Westin CF (2014) Multi-shell diffusion signal recovery from sparse measurements. Medical image analysis 18(7): 1143-1156.
Reddy CP, Rathi Y (2016): Joint Multi-Fiber NODDI Parameter Estimation and Tractography Using the Unscented Information Filter. Frontiers in Neuroscience 10: 166.
Reilmann R (2014): Huntington disease: natural history, biomarkers and prospects for therapeutics. Nature reviews Neurology 10: 204-216.
Rosas HD, Hevelone ND, Zaleta AK, Greve DN, Salat DH, Fischl B (2005): Regional cortical thinning in preclinical Huntington disease and its relationship to cognition. Neurology 65(5): 745-747.
Rosas HD, Tuch DS, Hevelone ND, Zaleta AK, Vangel M, Hersch SM, et al. (2006): Diffusion tensor imaging in presymptomatic and early Huntington's disease: selective white matter pathology and its relationship to clinical measures. Movement Disorders 21(9): 1317-1325.
Ross CA, Aylward EH, Wild EJ, Langbehn DR, Long JD, Warner JH, Scahill RI, Leavitt BR, Stout JC, Paulsen JS, Reilmann R. Huntington disease: natural history, biomarkers and prospects for therapeutics. Nature reviews Neurology 2014; 10: 204-216.
Rotenberg D, Pasternak O, Shenton M, Voineskos A (2015): Correction for extracellular free water eliminates associations of fractional anisotropy with aging and neurodegenerative disease. Biological Psychiatry 77(9): 95S-95S.
Shaffer JJ, Ghayoor A, Long JD, Kim RE, Lourens S, O’Donnell LJ, et al. (2016): Longitudinal diffusion changes in prodromal and early HD: evidence of white-matter tract deterioration. Human Brain Mapping.
Singhal T, Kim CK (2017): Putaminal Hypometabolism Exceeding Caudate Abnormalities on 18F-FDG PET in Huntington Disease. Clinical Nuclear Medicine 42(7): e343-344.
Steventon JJ, Trueman RC, Da Ma EY, Bayram-Weston Z, Modat, M, Cardoso J, et al. (2016): Longitudinal in vivo MRI in a Huntington’s disease mouse model: Global atrophy in the absence of white matter microstructural damage. Scientific Reports 6.
Stoffers D, Sheldon S, Kuperman JM, Goldstein J, Corey-Bloom J, Aron AR (2010): Contrasting gray and white matter changes in preclinical Huntington disease An MRI study. Neurology 74(15): 1208-1216.
Tabrizi SJ, Langbehn DR, Leavitt BR, Roos RA, Durr A, Craufurd D, et al. (2009): Biological and clinical manifestations of Huntington's disease in the longitudinal TRACK-HD study: cross-sectional analysis of baseline data. The Lancet Neurology 8(9): 791-801.
Tabrizi SJ, Reilmann R, Roos RA, Durr A, Leavitt B, Owen G, et al. (2012): Potential endpoints for clinical trials in premanifest and early Huntington's disease in the TRACK-HD study: analysis of 24 month observational data. The Lancet Neurology 11(1): 42-53.
Tabrizi SJ, Scahill RI, Durr A, Roos RA, Leavitt BR, Jones R, et al. (2011): Biological and clinical changes in premanifest and early stage Huntington's disease in the TRACK-HD study: the 12-month longitudinal analysis. The Lancet Neurology 10(1): 31-42.
Tabrizi SJ, Scahill RI, Owen G, Durr A, Leavitt BR, Roos RA, et al. (2013): Predictors of phenotypic progression and disease onset in premanifest and early-stage Huntington's disease in the TRACK-HD study: analysis of 36-month observational data. The Lancet Neurology 12: 637-649.
Thieben MJ, Duggins AJ, Good CD, Gomes L, Mahant N, Richards F, et al. (2002): The distribution of structural neuropathology in pre‐clinical Huntington’s disease. Brain 125(8): 1815-1828.
Vonsattel JPG, DiFiglia M (1998): Huntington disease. Journal of neuropathology and experimental neurology 57(5): 369.
Vonsattel JPG, Keller C, del Pilar Amaya M (2008): Neuropathology of Huntington's disease. Handbook of clinical neurology 89: 599-618.
Wassermann D, Makris N, Rathi Y, Shenton M, Kikinis R, Kubicki M, Westin CF (2016): The white matter query language: a novel approach for describing human white matter anatomy. Brain Structure and Function 221(9): 4705-4721.
Wang Y, Wang Q, Haldar JP, Yeh FC, Xie M, Sun P, Tu TW, Trinkaus K, Klein RS, Cross AH, Song SK (2011): Quantification of increased cellularity during inflammatory demyelination. Brain, 134(12): 3590-3601.
Zhang Y, Long JD, Mills JA, Warner JH, Lu W, Paulsen JS (2011): Indexing disease progression at study entry with individuals at‐risk for Huntington disease. American Journal of Medical Genetics Part B: Neuropsychiatric Genetics 156(7): 751-763.
Zielonka D, Marinus J, Roos R, Michele G, Donato SD, Putter H, Marcinkowski J, Squitieri F, Bentivoglio AR, Landwehrmeyer GB (2013): The influence of gender on phenotype and disease progression in patients with Huntington's disease. Parkinsonism & related disorders 19(2): 192-197.
Zhang H, Schneider T, Wheeler-Kingshott CA, Alexander DC (2012): NODDI: practical in vivo neurite orientation dispersion and density imaging of the human brain. Neuroimage, 61(4): 1000-1016.
corresponding parameters were not available for some subjects. SD: standard deviation. Normal Control (N = 88, total scans: 219) Huntington’s Disease (N = 243, total scans: 611) # Male # Female
Age (Mean SD, [Min, Max]) Maximum Education Years
35 (39.77%) 53 (60.23%) 48.58 12.61, [23.19, 87.73] 15.08 2.56, [9, 20] 75 (30.86%) 168 (69.14%) 45.62 12.48, [18.84, 82.72] 14.82 2.47, [9, 20] (3 unavailable*) CAG Repeats Total Motor Scores
Diagnostic Confidence Level
20.68 3.80, [15, 35] 3.08 4.15, [0, 30] (10 unavailable*) 0.58 0.66, [0, 3] (10 unavailable*) 42.10 2.70, [37, 58] 9.11 11.21, [0, 77] (8 unavailable*) 1.32 1.29, [0, 4] (8 unavailable*)
Table 2 Summary of the representative MRI parameters used by each manufacturer. Diffusion-weighted imaging (DWI) data was acquired with 32 – 237 directions; TR: repetition time; TE: echo time; TI: inversion time.
Mode Manufacturer TR (ms) TE (ms) TI (ms) Thickness (mm) Acquisition Matrix Bandwidth (Hz/pixel) Flip Angle T1 GE 6.5 2.8 400 1 256, 256, 216 244.1 12 Philips 7.7 3.5 1.1 220, 218, 164 241 8 Siemens 2,300 2.87 900 1.1 256, 256, 240 238 10 T2 GE 3,000 82.5 1.4 288, 288, 160 244.1 90 Philips 2,500 183.6 1.1 220, 218, 164 583 90 Siemens 4,800 430 1.4 256, 250, 160 592 90 DWI GE 17,000 87.2 2.4 128, 128 1,953.12 90 Philips 9,679 92 2 128, 128 1,566.02 90 Siemens 12,000 92 2 128, 128 1,565 90
Hand Face Trunk Leg
Caudate
(b
)
Table 1 The slope, t-statistic, estimated degrees of freedom (DF), and associated FDR-corrected p-values for correlation between caudate and putamen volume loss and age (cf. Fig. 2). All correlations are significant at a significance level of 0.05.
Normal Control Huntington’s Disease Slope t-Stat DF p-Value Slope t-Stat DF p-Value Left Caudate -9.2347 -2.8497 216 4.7991e-3 -63.6013 -10.075 603 1.4442e-21
Right Caudate -12.0076 -3.6132 214 5.0257e-4 -63.2369 -9.9663 607 1.8083e-21
Left Putamen -30.8260 -6.4565 211 1.4495e-9 -49.6062 -8.9647 603 3.8796e-18
Right Putamen -29.0864 -6.8354 215 3.3251e-10 -46.8855 -9.1738 602 9.6031e-19
Table 2 The slope, t-statistic, estimated degrees of freedom (DF), and associated FDR-corrected p-values for correlation between isotropic volume fraction and age (cf. Fig. 3). *In these regions, normal control or Huntington’s disease groups show significant changes in isotropic volume fraction at a significance level of 0.05.
Normal Control Huntington’s Disease Slope (10-3) t-Stat DF p-Values Slope (10-3) t-Stat DF p-Values
Left Caudate Hand Face Trunk Leg 0.4410 1.6148 194 0.1728 1.3038 6.4163 539 1.3002e-9* 0.3571 2.1778 210 0.0611 0.7133 4.8499 575 2.3160e-6* 0.3868 1.4445 203 0.2184 0.7259 3.2555 561 0.0013* -0.0953 -0.2988 157 0.7655 0.7553 3.7125 476 0.0003* Left Putamen Hand Face Trunk Leg 0.5166 4.3121 202 0.0004* 0.8653 6.4029 555 1.3002e-9* 0.4167 2.3924 205 0.0470* 0.3687 3.5611 558 0.0005* 0.0893 1.0394 201 0.3691 0.6306 5.3025 558 2.9310e-7* 0.3662 2.5095 182 0.0415* 0.5750 4.8706 524 2.3160e-6*
Right Caudate Face Trunk Leg 0.3077 1.8964 206 0.1054 0.8103 5.6908 573 5.3852e-8* 0.3650 1.2484 204 0.2844 0.7693 3.7406 555 0.0003* 0.1047 0.4490 194 0.6975 0.5340 3.1855 526 0.0015* Right Putamen Hand Face Trunk Leg 0.5069 3.4185 200 0.0041* 0.9193 6.5131 546 1.3002e-9* 0.1388 0.6830 205 0.5662 0.7718 5.9120 578 1.8502e-8* 0.3968 3.0431 206 0.0106* 0.7675 5.6617 561 5.4746e-8* 0.6707 3.7390 205 0.0019* 1.0549 6.8896 561 2.4118e-10*
Table 3 The intercept and slope with their t-statistic, estimated degrees of freedom (DF), and associated FDR-corrected p-values for correlation between isotropic volume fraction and the genetic load, CAG (cf. Fig. 5). *indicates significant correlations (FDR corrected p-value < 0.05).
0 1
Intercept t-Stat DF P-Values Slope (10-3) t-Stat DF p-Values
Left Caudate Hand Face Trunk Leg 0.0489 1.2676 538 0.3653 -0.8964 -0.9734 538 0.4812 0.0420 1.6034 575 0.2334 -0.8452 -1.3806 575 0.3704 -0.0275 -0.7290 561 0.6217 0.5862 0.6585 561 0.6383 0.06341 1.5716 472 0.2334 -1.0428 -1.0868 472 0.4443 Left Putamen Hand Face Trunk Leg -0.0605 -2.7329 556 0.0345* 1.7114 3.2387 556 0.0068* -0.0454 -2.3334 558 0.0639 1.2007 2.5994 558 0.0307* -0.0155 -0.7814 558 0.6217 0. 5938 1.2595 558 0.3704 0.0079 0.3586 524 0.8229 0. 0575 0.1094 524 0.9738 Right Caudate Hand Face Trunk Leg -0.0130 -0.3780 496 0.8229 0. 5266 0.6459 496 0.6383 -0.0014 -0.0503 574 0.9599 0.3392 0.5299 574 0.6816 -0.0387 -1.1404 555 0.4074 1.1603 1.4335 555 0.3704 0.0512 1.6662 526 0.2334 0.9404 -1.2840 526 0.3704
Right Putamen Face Trunk Leg 0.0017 0.0739 579 0.9599 0.0138 0.0247 579 0.9803 -0.0505 -2.3971 562 0.0639 1.3746 2.7283 562 0.0263* -0.0624 -3.4471 561 0.0097 1.5809 3.7022 561 0.0030*
Table 4 The slope, t-statistic, estimated degrees of freedom (DF), and associated FDR-corrected p-values for correlation of isotropic volume fraction and clinical scores (total motor scores and diagnostic confidence level, cf. Fig. 6). Except for the connection from trunk to the caudate (colored in red), isotropic volume fractions in other regions are significantly correlated with total motor scores /diagnostic confidence level.
Total Motor Scores Diagnostic Confidence Level Slope (10-3) t-Stat DF p-Values Slope t-Stat DF p-Values
Caudate Hand Face Trunk Leg 0.8886 4.7418 461 4.4355e-6 0.0059 3.5451 460 0.0009 0.6563 4.6976 552 4.4355e-6 0.0041 4.0057 552 0.0002 0.8182 1.9485 521 0.0519 0.0041 2.1821 521 0.0296 0.5393 2.6763 432 0.0088 0.0038 2.6551 432 0.0094 Putamen Hand Face Trunk Leg 0.6479 5.0405 527 1.2785e-6 0.0039 2.7872 526 0.0073 0.5353 6.1561 537 1.1525e-8 0.0043 5.4032 539 3.9358e-7 0.4044 5.1996 539 7.5747e-7 0.0021 3.4316 537 0.0010 0.5330 6.0492 493 1.1528e-8 0.0042 5.8373 495 7.6851e-8