HAL Id: hal-00373276
https://hal.archives-ouvertes.fr/hal-00373276
Submitted on 2 Sep 2020HAL is a multi-disciplinary open access archive for the deposit and dissemination of sci-entific research documents, whether they are pub-lished or not. The documents may come from teaching and research institutions in France or abroad, or from public or private research centers.
L’archive ouverte pluridisciplinaire HAL, est destinée au dépôt et à la diffusion de documents scientifiques de niveau recherche, publiés ou non, émanant des établissements d’enseignement et de recherche français ou étrangers, des laboratoires publics ou privés.
Stable dispersions of highly anisotropic nanoparticles
formed by cocrystallization of enantiomeric diblock
copolymers
Daniel Portinha, François Boué, Laurent Bouteiller, Géraldine Carrot,
Christophe Chassenieux, S. Pensec, Günter Reiter
To cite this version:
Daniel Portinha, François Boué, Laurent Bouteiller, Géraldine Carrot, Christophe Chassenieux, et al.. Stable dispersions of highly anisotropic nanoparticles formed by cocrystallization of enantiomeric diblock copolymers. Macromolecules, American Chemical Society, 2007, 40 (11), pp.4037-4042. �10.1021/ma070467v�. �hal-00373276�
Stable dispersions of highly anisotropic nanoparticles
formed by co-crystallization of enantiomeric diblock
copolymers
D. Portinha,a,e F. Boué,c L. Bouteiller,*a G. Carrot,c C. Chassenieux,b S. Penseca and G. Reiterd
a Laboratoire de Chimie des Polymères, UMR 7610 CNRS, Université Pierre et Marie Curie, 4 place
Jussieu, 75252 Paris Cedex 05, France
b Physicochimie des Polymères et des Milieux Dispersés, UMR 7615 CNRS, Université Pierre et Marie
Curie, ESPCI, 10 rue Vauquelin, 75231 Paris Cedex, France
c Laboratoire Léon Brillouin, UMR 12 CNRS-CEA, 91191 Gif-sur-Yvette Cedex, France
d Institut de Chimie des Surfaces et Interfaces, 15 rue Jean Starcky, BP 2488, 68057 Mulhouse, France
e current address: IMP/LMM, Ingénierie des Matériaux Polymères, Laboratoire des Matériaux
Macromoléculaires, UMR5223, INSA-Lyon, F-69621, France
Abstract
Stable dispersions of anisotropic particles with nanometer dimensions can be prepared in a selective solvent through co-crystallization (stereocomplexation) between two enantiomeric-poly(lactide) block
The only driving force for self-assembly is between PLLA and PDLA. The good colloidal stability of the dispersion, makes it possible to study the evolution of the particle shape and dimensions with time. The formation of these highly anisotropic particles was studied by a combination of techniques (infrared spectroscopy, light scattering, small angle neutron scattering and atomic force microscopy).
Introduction
Block copolymers self-assemble in selective solvents of one of the blocks to form structures with nanometer dimensions. Particles with different kinds of shapes can be obtained, depending on the nature of the insoluble block. For example, if the insoluble block is amorphous, the polymer is referred to as a
coil-coil diblock copolymer and spherical particles are commonly obtained,1 even if other morphologies
have been observed.2 On the other hand, if the insoluble block self-organizes within the core, a variety
of shapes can result. One case is referred to as rod-coil block copolymers, where the organization results
from the packing of the rigid insoluble block.3 Another case is referred to as crystalline-coil block
copolymers, where organization is driven by crystal packing forces which define the structure of the
core.4-10 Such systems generally lead to thin platelet structures consisting of flat chain-folded crystalline
domains surrounded by a solvated brush of the soluble block. The high specificity of the crystallization process potentially offers the possibility to control and tune the shape of the particles, which could then be used as high information content building blocks for nanotechnology applications.
Within the field of crystalline-coil copolymers, we are interested in the formation of nanoparticles resulting from the non-covalent interactions between a mixture of AB and A’B’ diblock copolymer,
such that the A and A’ blocks can co-crystallize.11,12 One of the main advantages of such a system is the
preparative technique of the particles, obtained by simply mixing the solutions of each diblock.
Among the polymers able to co-crystallize, we used poly(lactide)-containing diblock copolymers. Poly(L-lactide) (PLLA) and poly(D-lactide) (PDLA) are semi-crystalline polymers which form a racemic crystal called stereocomplex, showing a much higher stability than for crystals of each single
polyenantiomer, due to the packing of helices of opposite configurations.13,14 In previous papers, we
showed that a mixture of poly(L-lactide)-b-poly(caprolactone) and
poly(lactide) sequences.11a,b The poly(caprolactone) block is supposed to improve the colloïdal stability by steric repulsion and to limit the growth of the particles. However, for this system involving
symmetrical diblock copolymers (Mn PLA = Mn PCL = 8500 g/mol), very large particles were obtained. Except
for very low concentrations, these particles settled down after a week, thus preventing the control of their growth. The effect of various experimental parameters on the kinetics and the size of the particles were pointed out. In particular, reducing the length of the PLA block was shown to improve the
colloïdal stability.15
We report in this paper our results on a system involving block copolymers with a very short PLA
sequence (Mn PLA = 2800 g/mol, Mn PCL = 7300 g/mol), for which the driving force for self-assembly is
reduced. In this case, the stability of nanoparticles is much better and makes it possible to study the evolution of their shape and dimensions with time. AFM and SANS combined characterization proves that well controlled anisotropic cylindrical particles are obtained.
Experimental section
Well defined PCL-b-PLLA and PCL-b-PDLA were synthesized by ring-opening polymerization.16
Caprolactone and then optically active lactide were sequentially polymerized. Before adding the lactide monomer, an aliquot of the PCL was withdrawn from the reactor and analyzed by SEC. The characteristics of these polymers are presented in Table 1.
Table 1. Characteristics of copolymers 1 and 2.
PCL block diblock
polymer Mna Ipa Mna Ipa composition b
PCL-b-PLLA 1 13000 1.13 15900 1.17 59-b-36
PCL-b-PDLA 2 15000 1.14 17200 1.14 69-b-42
a SEC in THF; polystyrene reference (uncorrected).
b x-b-y means DP
n PCL = x, DPn PLA = y. DPn PCL was determined by SEC in THF after conversion to absolute
molar masses.17 DP
Static and dynamic light scattering measurements were performed with an experimental set up
previously described,18 at a wavelength (l0) of 514.5 nm. Samples were prepared by dissolving
separately the same weight of each copolymer in THF (analytical reagent, Prolabo) at room temperature. Then, the initial solutions were filtered through Whatman Anotop filters (porosity 0.2 µm) and finally mixed together. The correlation functions were measured at 25°C and at various angles of
observation (q) ranging from 30 to 130°, and have been analysed thanks to the REPES routine.19 The
characteristic average relaxation times (t) were q2-dependent meaning that diffusive motions were
probed. They could thus be used to calculate apparent diffusion coefficients D = (q2t)-1, where q is the
scattering wave vector defined as q=(4pn/l0sin(q/2)) with n the refractive index of the solvent. Finally,
an apparent hydrodynamic radius of the scattering species has been estimated using the Stokes-Einstein
relation : Rh,app = kT/6phD, where k is the Boltzmann constant, T the absolute temperature and h the
viscosity of the solvent. The Rayleigh ratio of the solutions (DRq), which has been measured by static
light scattering is given by DRq=Rtol(Isol(q)-Isolv(q))/Itol(q) where Isol(q), Isolv(q) and Itol(q) are the intensity
scattered respectively by the solution, the solvent and the toluene used as a reference. Rtol (the Rayleigh
ratio of toluene) equals 0.33 10-4 cm-1.
Infrared spectra were recorded at room temperature on a Nicolet Avatar 320 FTIR spectrometer in KBr cells of 0.015 to 0.1 cm path length. The spectra were corrected by subtracting the spectrum of
pure THF in the same cell. Stereocomplex conversion was deduced from the intensity of the nC=O lactide
vibration band (1763 cm-1), after fitting the experimental spectra between 1700 and 1800 cm-1 to a
combination of 3 Lorentzian curves.
SANS experiments were performed on PACE spectrometer at the LLB (Saclay, France). Solutions in
deuterated solvent (d8-THF) were used. The scattering vector q is defined as usual, assuming elastic
scattering, as q=(4p/l)sin(q/2), where q is the angle between incident and scattered beam. Data were corrected for the empty cell signal and the polymer and solvent incoherent background. A light water
Atomic force microscopy (AFM) images of the particles were taken using a Nanoscope IIIa AFM (Digital Instruments) at ambient conditions in the tapping mode, providing information on topography (height-mode) and material contrast (phase-mode). When measuring small objects, the finite size of the measuring device (the “tip” of the AFM, having a radius of curvature of about 10-20 nm) has to be taken into account.
Results and Discussion
Prior to any solution studies, we checked that these copolymers with short PLA sequences (40 lactoyl units) could form a stereocomplex in the solid state, because the lowest limit of sequence length for
stereocomplex formation in PCL-b-PLA copolymers has been reported to be in this range.20 Solutions of
1 and 2 in dichloromethane were mixed, and the solvent was evaporated. DSC analysis of the blend
shows, beside the melting of PCL (53°C), a second melting point at 192°C (data not shown). This is evidence of the formation of a stereocomplex, because copolymers 1 and 2 alone have melting points at 132°C and 133°C respectively. It suggests that these copolymers can potentially also form the stereocomplex in solution.
1. Growth of the particles
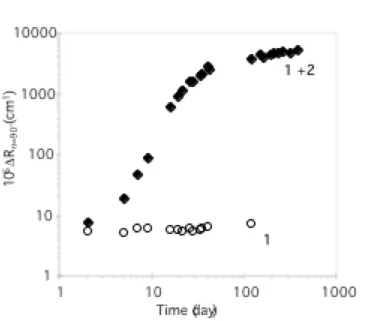
The self-assembly in solution of the mixture of copolymers 1 and 2 was then studied by scattering techniques. Fresh solutions of 1 and 2 at 10 g/L in THF were prepared separately and mixed together. The behavior of the resulting solution was compared to the solution of the copolymers alone at the same concentration. Static light scattering results (Figure 1) show the time evolution of the excess Rayleigh ratio measured at an angle of 90° for the mixture and for a solution of 1, respectively.
Figure 1. Time evolution of the scattered intensity measured at q = 90° for solutions of 1 alone, and of
the mixture 1 + 2 in THF (C = 10 g/L, T = 25°C).
The scattered intensity for the reference solution of 1 remains constant with time, which shows that at this concentration, no aggregation is observed. In contrast, for the mixture of 1 and 2, the intensity increases steadily for more than a month, and then slowly levels off to reach an apparent plateau. This seemingly trivial point is worth emphasizing: in the conditions of the experiment, no unspecific aggregation of the homochiral polylactide blocks occurs. The only driving force for self-assembly is between PLLA and PDLA. It was previously shown that for longer blocks, this is not the case
anymore.11b The increase of DRq
=90° by two orders of magnitude, indicates that large particles are formed.
It is also worth noting that this solution remains optically clear over more than a year, which proves that stable sub-micrometer particles are formed in solution.
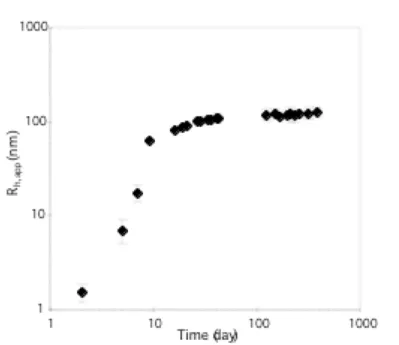
Figure 2 presents the variation of the apparent hydrodynamic radius (Rh,app) measured by dynamic light
scattering experiments carried out on the same solutions. For the mixture, a bimodal distribution of relaxation times was obtained until 20 days, and then a single peaked distribution was detected. In the case of the bimodal distribution, the fast mode (with dimensions around 2 nm) was related to free chains. After 20 days, the contribution of the growing particles to the overall scattered intensity totally
overwhelms the scattering from the free chains, so that the latter cannot be detected. A quantitative analysis of the amount of non-associated chains is discussed below.
As far as the particles are concerned, their hydrodynamic radius increases during 40 days and then a stable value of 120 nm is reached. However, the uncertainty in this size range is too large to exclude a slow further growth of the particles.
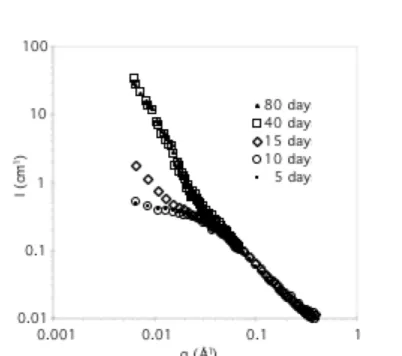
The kinetics of the association was also studied by small angle-neutron scattering. The variation of the scattered intensity with the scattering vector q, for solutions of 1 and 2 is represented in Figure 3.
Two different ranges can be distinguished: first, for q values larger than 0.03 Å-1, the intensity profile is
independent of the age of the solution, and is very likely to be the scattering of free chains, as discussed
below. Second, for q values lower than 0.03 Å-1, the intensity increases with time until 40 days and
finally remains constant. A quantitative analysis of these data is presented at the end of this paper.
Figure 2. Time dependence of the apparent hydrodynamic radii for a solution of the mixture 1 + 2 in
Figure 3. Scattered intensity measured by SANS, for a solution of 1 + 2 in d8-THF, at different times (C = 10 g/L, T = 25°C).
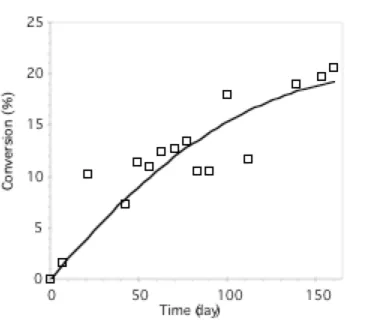
As described before for a similar system,11b FTIR spectroscopy can be used to show that a
stereocomplex is formed in solution. Indeed, the vibration band for disordered polylactide chains (1763
cm-1) is gradually replaced by a vibration band corresponding to the stereocomplexed poly(lactide)
chains (1747 cm-1). A quantitative analysis allows us to monitor the conversion of stereocomplex with
time.11b This curve, represented in Figure 4, shows that the stereocomplexation is slow and affects only
about 10% of poly(lactide) sequences after 2 months. At this stage, it is difficult to explain the reasons of this low extent of association. However, a hypothesis can be found in the early work of Lotz et al.,
dealing with the self-assembly of poly(styrene)-b-poly(ethylene oxide) in solution.5a The authors
observed a fractionation of the sample due to the polydispersity of the diblock copolymers: chains containing short crystallizable blocks and/or long PS sequences might not be able to take part in the self-assembly. In our case, this fractionation effect might be important because the degree of polymerization of the crystallisable block is very low.
At this stage, a couple of intermediate conclusions can be derived: (i) large particles (RH ≈ 120 nm) are formed, but they are mixed with a very significant proportion of free chains (≈ 90%); (ii) the growth of the particles slows down after 40 days, although it is not stopped completely (Figure 1).
Figure 4. Time dependence of the conversion measured by FTIR for a solution of 1 + 2 in THF (C = 10
g/L, T = 25°C).
2. Stability of the particles
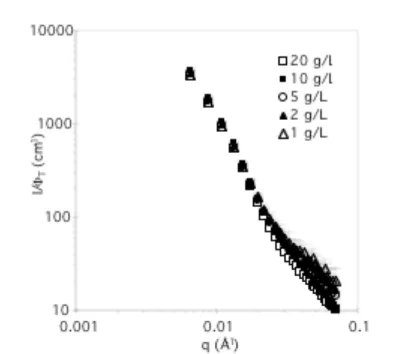
The stability of the particles toward dilution was investigated, because a dilution step is necessary to prepare samples for microscopy analysis. Consequently, a solution of 1 and 2 was prepared, and after 40 days, this solution was diluted to 4 different concentrations, and the concentration-normalized scattered intensity of each solution was analyzed by SANS (Figure 5). In the low q range, corresponding to the particles, all the curves are well superimposed, attesting that the structure does not change much when aged solutions are diluted. In the high q region, the uncertainty is too high to figure out any influence.
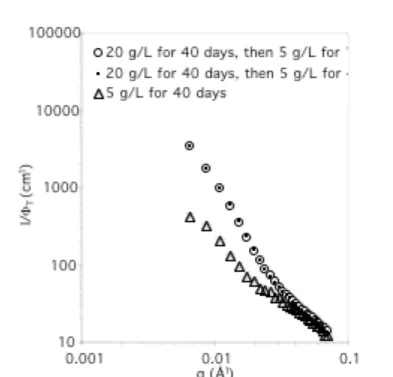
To monitor the long term stability, one of the diluted solutions (5 g/L) was characterized again 40 days later (Figure 6). No evolution can be detected. Moreover, the scattered intensity is much stronger than for a solution prepared at 5 g/L from the start. This shows that the latter particles have not reached
The effect of dilution on the size of the particles was also monitored by static light scattering measurements. As can be seen in Figure 7, the apparent hydrodynamic radius of the particles is almost constant when solutions are diluted by a dilution factor as high as 10.
All these results prove that the particles are very stable with dilution.
Figure 5. Normalized SANS data (in absolute units divided by the volume fraction FT), for a solution of
1 + 2 in d8-THF prepared at 20 g/L and diluted after 40 days (T = 25°C). The measurement was performed a few hours after the dilution.
Figure 6. Normalized SANS data, for 3 solutions of 1 + 2 in d8-THF at 5 g/L prepared in different ways (T = 25°C).
Figure 7. Apparent hydrodynamic radius of particles in solutions of 1 + 2 in THF, prepared at 10 g/L
3. Shape of the particles
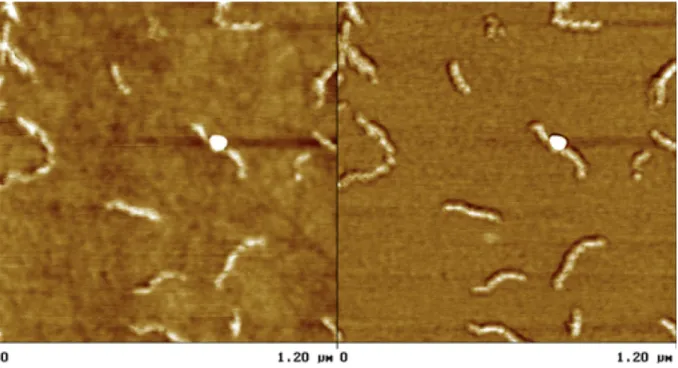
AFM was used to observe the shape of the particles. A solution of 1 and 2 at a concentration of 10 g/L was prepared, aged and finally diluted a hundred fold just before spin-coating on a silicon wafer. A representative picture is shown in Figure 8, where elongated objects are observed. The phase image shows that these particles are harder than the background, which is compatible with the crystalline nature of the stereocomplex and with the presence of a large amount of free chains making a continuous layer. The length of the particles is polydisperse and can be as high as 350 nm. On the other hand, the width of the particles is quite uniform. We measured 30 to 40 nm, however, due to convolution with the tip size, the actual size is somewhat less. The height of these anisotropic particles cannot be estimated due to the continuous layer of free chains on the surface of the substrate. In fact, the most striking point is that the particles seem to be bent. Existing theoretical work on crystalline-coil or rod-coil assemblies
predict "hockey puck" micelles, disks or needles, but not such bent objects.4,21 A tentative structure which
could reconcile these observations and theoretical considerations, would be some kind of pearl necklace structure, where the pearls are rigid crystalline particles. Further experiments are under way to improve the quality of the microscopy observations and to propose a structural model.
Of course, there is also the possibility that the particles seen on Figure 8 are not present as such in solution, but result from the aggregation of smaller particles during solvent evaporation. To test this possibility, a quantitative fit of the previous SANS data was performed, based on the following model.
Figure 8. Tapping mode AFM characterization of a 6 months old, 10 g/L solution of 1 + 2 in THF,
diluted and spin-coated on a silicon wafer.
Because FTIR results indicate that free chains are present in solution, the total scattered SANS
intensity (Itotal) was decomposed in 2 terms corresponding respectively to free chains (Ifc(q)) and to
particles (Iagg(q)) (Eq 1).
(1)
The free chains were accounted for by using the form factor of gaussian chains (Eq2): (2)
where rfc and rsolv are the scattering length densities of the chains and the solvent, respectively, FT is
the volume fraction of the copolymer, Vp the molecular volume of a chain, Rgfc its radius of gyration, Ffc
the weight fraction of the free chains and q the wave vector.
polycaprolactone blocks forming a brush at the surface of the crystalline core. The scattered intensity due to the particles can then be expressed as:
(3)
where N represents the aggregation number of the particles, R the average radius of the cylindrical particles and U is a measure of the radial polydispersity, which we assume to correspond to a
log-normal distribution.23
First, the radius of gyration of the free chains (Rgfc = 2.5 nm) was determined by fitting the
experimental results for a solution of 1 alone. Then, FT and Vp were calculated from the known
composition of the solution, and the contrast for the chains was assumed to be the same as the contrast
for the particles. Finally, the experimental curve was fitted by adjusting the values of R, U, RCL (radius of
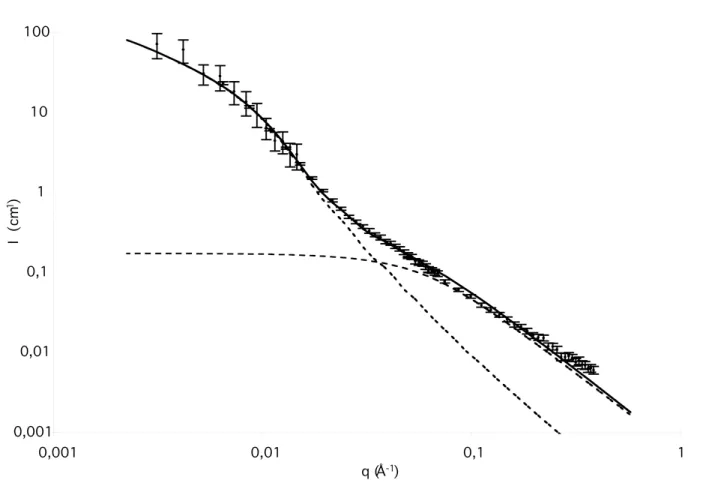
gyration of the polycaprolactone blocks) and Ffc (Figure 9).24 The following values were derived: R = 6.2
nm, U = 0.3, RCL = 1.3 nm and Ffc = 0.96.25 These values are consistent with the values observed by AFM
for the radius of the cylindrical particles (less than 15 to 20 nm) and for the low radial polydispersity. The SANS results are also consistent with the fraction of free chains measured by FTIR spectroscopy (around 90%).
The good agreement between the SANS, FTIR and AFM results is gratifying and suggests that the particles seen by AFM after spin-coating are indeed present in the solution.
Figure 9. Scattered intensity measured by SANS, for a solution of 1 + 2 in d8-THF (40 days, C = 10 g/L, T = 25°C), and fit of the data with a model taking into account "hairy" cylindrical particles and free chains. The respective contributions from particles and free chains are represented as dotted lines.
Conclusion
The self-assembly in solution of block copolymers PCL-b-PLLA and PCL-b-PDLA was examined. At the concentration investigated, stereocomplexation is the only aggregation process that occurs: no aggregation of one copolymer alone is observed. Moreover, the particles formed are stable over months and are not sensitive to dilution. This allowed us to characterize their shape. We obtain a good agreement when combining light scattering and SANS from solutions and AFM after spin coating. Well-controlled and highly anisotropic particles are observed.
Supporting Information available: SANS: form factors used and fit of the data with a model taking
into account spherical particles and free chains. This material is available free of charge via the Internet at http://pubs.acs.org.
References and Notes
(1) (a) Tuzar, Z.; Kratochvil, P. Adv. Colloid Interface Sci., 1976, 6, 201.(b) Price, C. Pure Appl.
Chem., 1983, 55, 1563.
(2) (a) Zhang, L.; Eisenberg, A. Science 1995, 268, 1728. (b) Zhang, L.; Yu, K.; Eisenberg, A.
Science 1996, 272, 1777. (c) Won, Y.-Y.; Davis, H. T.; Bates, F. S. Science 1999, 283, 960. (d)
Discher, B. M.; Won, Y.-Y.; Ege, D. S.; Lee, J. C.-M.; Bates, F. S.; Discher, D. E.; Hammer, D. A.
Science 1999, 284, 1143.
(3) (a) Lee, M.; Cho, B.-K.; Zin, W.-C. Chem. Rev. 2001, 101, 3869. (b) Klok, H.-A.; Lecommandoux, S. Adv. Mater. 2001, 13, 1217.
(4) (a) Birshtein, T. M.; Zhulina, E. B. Polymer 1990, 31, 1312. (b) Vilgis, T.; Halperin, A.
Macromolecules 1991, 24, 2090.
(5) (a) Lotz, B.; Kovacs, A. J. Kolloid-Z. Z. Polym. 1966, 209, 97. (b) Lotz, B.; Kovacs, A. J.; Bassett, G. A.; Keller, A. Kolloid-Z. Z. Polym. 1966, 209, 115.
(6) (a) Cogan, K. A.; Gast, A. P. Macromolecules 1990, 23, 745. (b) Gast, A. P.; Vinson, P. K.; Cogan-Farinas, K. A. Macromolecules 1993, 26, 1774. (c) Lin, E. K.; Gast, A. P. Macromolecules
1996, 29, 4432.
(7) Reiter, G.; Hoerner, P.; Hurtrez, G.; Riess, G.; Sommer, J.-U.; Joanny, J.-F. J. Surf. Sci. Tech.
1998, 14, 93.
(8) (a) Richter, D.; Schneiders, D.; Monkenbusch, M.; Willner, L.; Fetters, L. J.; Huang, J. S.; Lin, M.; Mortensen, K.; Farago, B. Macromolecules 1997, 30, 1053. (b) Monkenbusch, M.; Schneiders, D.; Richter, D.; Willner, L.; Leube, W.; Fetters, L. J.; Huang, J. S.; Lin, M. Physica B 2000, 276-278, 941.
(9) (a) Massey, J. A.; Temple, K.; Cao, L.; Rharbi, Y.; Raez, J.; Winnik, M. A.; Manners, I. J. Am.
Chem. Soc. 2000, 122, 11577. (b) Frankowski, D. J.; Raez, J.; Manners, I.; Winnik, M. A.; Khan, S. A.;
Spontak, R. J. Langmuir 2004, 20, 9304.
(10) (a) Chen, W. Y.; Li, C. Y.; Zheng, J. X.; Huang, P.; Zhu, L.; Ge Q.; Quirk, R. P.; Lotz, B.; Deng, L.; Wu, C.; Thomas, E. L.; Cheng, S. Z. D. Macromolecules 2004, 37, 5292. (b) Zheng, J. X.; Xiong, H.; Chen, W. Y.; Lee, K.; van Horn, R. M.; Quirk, R. P.; Lotz, B.; Thomas, E. L.; Shi, A.-C.; Cheng, S. Z. D. Macromolecules 2006, 39, 641.
(11) (a) Portinha, D.; Belleney, J.; Bouteiller, L.; Pensec, S.; Spassky, N.; Chassenieux, C.
Macromolecules 2002, 35, 1484. (b) Portinha, D.; Bouteiller, L.; Pensec, S.; Richez, A.; Chassenieux,
C. Macromolecules 2004, 37, 3401. (c) Richez, A.; Belleney, J.; Bouteiller, L.; Pensec, S. J. Polym.
Sci.: Polym. Chem. 2006, 44, 6782.
(12) Kang, N.; Perron, M.-E.; Prud’homme, R. E.; Zhang, Y.; Gaucher, G.; Leroux, J. C. Nano Lett.
2005, 5, 315.
(13) (a) Ikada, Y.; Jamshidi, K.; Tsuji, H.; Hyon, S.-H. Macromolecules 1987, 20, 904. (b) Tsuji, H.
Macromol. Biosci. 2005, 5, 569.
(14) (a) Okihara, T.; Tsuji, M.; Kawaguchi, A.; Katayama, K. J. Macromol. Sci. Phys. 1991, 30, 119. (b) Brizzolara, D.; Cantow, H.-J.; Diederichs, K.; Keller, E.; Domb, A. J. Macromolecules 1996, 29, 191. (c) Cartier, L.; Okihara, T.; Lotz, B. Macromolecules 1997, 30, 6313.
(15) Pensec, S.; Portinha, D.; Bouteiller, L.; Chassenieux, C. Encyclopedia of Nanoscience and
Nanotechnology; Schwarz, A.; Contescu, C.; Putyera, K. Eds.; Marcel Dekker: New York, 2004; pp
405-414.
(19) Stepanek, P. In Dynamic Light Scattering: the method and some applications; Brown, W., Ed.; Clarendon Press: Oxford, 1993; Chapter 4.
(20) Stevels, W. M.; Ankoné, M. J. K.; Dijkstra, P. J.; Feijen, J. Macromol. Symp., 1996, 102, 107. (21) (a) Raphaël, E.; de Gennes, P. G. Makromol. Chem., Macromol. Symp., 1992, 62, 1. (b) Williams, D. R. M.; Fredrickson, G. H. Macromolecules 1992, 25, 3561.
(22) Pedersen, J. S. J. Appl. Cryst., 2000, 33, 637.
(23) This model does not take into account the bending of the particles.
(24) The length of the cylinders had no measurable influence on the calculated curve.
(25) We do not get information on the length of the rods, or in other words on the aggregation number N, which is expected, since the size of the rods is much larger than the one corresponding to the SANS q range. However, we fit data to a rod. Trying to fit to the form factor of "hairy" spherical particles instead of "hairy" cylindrical particles results in the impossibility of fitting the data at the smallest q values (see Supporting Information).
for Table of Contents use only