HAL Id: hal-00003842
https://hal.archives-ouvertes.fr/hal-00003842
Preprint submitted on 10 Jan 2005
HAL is a multi-disciplinary open access
archive for the deposit and dissemination of
sci-entific research documents, whether they are
pub-lished or not. The documents may come from
teaching and research institutions in France or
abroad, or from public or private research centers.
L’archive ouverte pluridisciplinaire HAL, est
destinée au dépôt et à la diffusion de documents
scientifiques de niveau recherche, publiés ou non,
émanant des établissements d’enseignement et de
recherche français ou étrangers, des laboratoires
publics ou privés.
Bertrand Le Floch, J. Cernicharo, S. Cabrit, D. Cesarsky
To cite this version:
Bertrand Le Floch, J. Cernicharo, S. Cabrit, D. Cesarsky. Shock-induced PDR in the Herbig-Haro
object HH2. 2004. �hal-00003842�
Shock-induced PDR in the Herbig-Haro object HH 2
B. Lefloch
1, J. Cernicharo
2, S. Cabrit
3, and D. Cesarsky
4 1Laboratoire d’Astrophysique de l’ Observatoire de Grenoble, BP 53, 38041 Grenoble Cedex, France
2
Consejo Superior de Investigaciones Cient´ıficas, Instituto de Estructura de la Materia, Serrano 123, E-28006 Madrid
3
LERMA, Observatoire de Paris, UMR 8112, France
4
Max-Planck Institut f¨ur Extraterrestrische Physik, 85741 Garching, Germany tomorrow; yesterday
Abstract. We report mid-infrared (5 − 17µm) and SO, CO,13
CO millimeter line observations of the protostellar jet HH 2 and the parental molecular cloud. We have detected for the first time mid-infrared emission along a protostellar jet. We find that the outflowing gas extends much further away than the Herbig-Haro object HH 2, showing direct evidence that downstream gas has been accelerated by previous outflow events. These gas layers appear to have been detached from the parental cloud, as they are distributed around a cavity, probably dug by protostellar outflow(s). SO emission is detected in shocked gas regions associated with outflows. The UV field produced in the strong shock region HH 2H-A has produced a low-excitation Photon-Dominated Region at the walls of the cavity, which is detected in the PAH emission bands and in the continuum between 5 and 17µm. This continuum arises from very small grains transiently heated by a FUV field G ≃ 20G0, which probably formed
from evaporation of dust grain mantles in shocks.
Key words.ISM: Herbig-Haro objects — ISM: individual objects (HH 1/2) — ISM: jets and outflows — ISM: dust - Stars: formation
1. Introduction
The Herbig-Haro system HH 1-2 is one of the best-studied star forming region. It attracted early attention because of the spectacular shock emission regions HH 1 and HH 2 that trace the interaction of the protostellar jet with the ambient cloud. This jet is characterized by rather high ve-locities in the ionic and atomic material (up to 480 km s−1)
and large proper motions in the impact region, as mea-sured with HST (Bally et al. 2002). The optical jet is as-sociated with a molecular outflow, first mapped in CO by Moro-Mart´ın et al. (1999). The jet makes a strong inclina-tion angle with the line of sight ≈ 80o
. The high-velocity, collimated component of the outflow (the “molecular jet”) covers deprojected velocities of 15 − 80 km s−1. This
sys-tem was first studied by Martin-Pintado & Cernicharo (1987) who suggested that the spatial distribution of the molecular emission resulted from the interaction of the outflowing jet with the ambient molecular cloud, produc-ing cavities and density enhancements along the walls of these cavities.
In the HH 2 region, the impact in the ambient gas results in shocks with a wide range of velocities : from 20 − 30 km s−1in the rim, corresponding to the individual
Send offprint requests to: [email protected]
knots E-K (Lefloch et al. 2003) up to 180 km s−1 in the
Mach disk region, which was identified as the optical knots HH 2H-2A. Observations in the UV ( Boehm-Vitense et al. 1982; Raymond et al. 1997) and X-ray (Pravdo et al. 2001) show extended emission from this shock region.
There has been a long debate as to whether such a high-energy field would have any noticeable impact on the local surroundings. Based on previous molecular line ob-servations, the gas downstream of HH 2 appears to be in a quiescent state. However, Davis et al. (1990) report an en-hanced abundance of HCO+in that region. Torelles (1992)
obtained a similar result for NH3. A detailed study by
Girart et al. (2002) revealed the peculiar chemical compo-sition of the molecular emission peak in the region down-stream of HH 2: some molecules were found largely over-abundant (CH3OH, H2CO, HCO+, SO, SO2) and others,
like CS and HCN, were underabundant. These features appeared to agree qualitatively with chemical models of UV-irradiated gas clumps (Wolfire & K¨onigl 1993; Viti & Williams 1999), which predict large abundance enhance-ments in a wide variety of molecular species, from either purely gas phase reactions or the release from icy grain mantles. Time-dependent modelling by Viti et al. (2003) could account for some of the molecular abundances mea-sured by Girart et al. (2002), paying special attention to
the HCO+ emission. Other observational evidence of the
impact of the UV field on the ambient gas around HH 2 came from the observation of the FIR lines [CII] 158µm and [OI] at 63 and 145µm with ISO/LWS at 80′′
reso-lution by Molinari & Noriega-Crespo (2002). They found that shock models cannot account for the line intensities measured and concluded that at least part of the emission must arise from a PDR associated with HH 2, but lack of angular resolution prevented any further characterization. Their modelling also made the assumption that the PDR is excited mainly by 2γ UV photons.
On the other hand, it is well established that shocks can strongly alter the chemical composition in the en-trained gas of protostellar outflows (see e.g. Bachiller & Perez-Gutierrez, 1997). Indeed, recent HCO+J = 1 → 0
interferometric observations by Dent, Furuya & Davis (2003) reveal a high-velocity component moving along HH 2. The authors conclude that the observed HCO+
abundance enhancement is consistent with shock chem-istry in the turbulent mixing layer associated with the jet. In this article, we reassess the nature of the molecular emission around HH 2, from 5-17µm spectro-imaging ob-servations of the HH 2 region obtained with the ISOCAM camera onboard ISO and complementary observations of millimeter transitions of CO,13CO and SO, at the IRAM
30m telescope, paying special attention to the position studied by Girart et a. (2002), which we will refer to as the “molecular emission peak”. Our observations show HH 2 to be even more complex than initially thought. We find that previous outflow episodes have accelerated gas ahead of HH2 and have dug a cavity in the parental cloud. Shocked gas is detected along the walls of the cav-ity. The mapping of SO emission shows that it is associ-ated with the shock interaction of the outflowing gas with the parental cloud. The strong J-type shocks associated with HH 2H-A have induced the formation of a Photon-Dominated Region (PDR) at the inner wall of the cavity, which could be mapped and characterized in the mid-IR.
2. Observations
The CO and 13CO millimeter line data were obtained at
the IRAM 30m telescope and have been presented and discussed in Moro-Mart´ın et al. (1999), hereafter MM99.
The SO transitions 34 −23 at 138.17864 GHz and
23−12 at 99.299883 GHz were observed with the IRAM
30m telescope in March 1993. The observing conditions were very good, with typical system temperatures of 180-200K at 2mm. The angular resolution of the telescope is 17′′ and 24′′, respectively, at these frequencies. An
auto-correlator with a spectral resolution of 20kHz was used as a spectrometer. The data was smoothed to obtain a kinematical resolution of ≈ 0.05 km s−1. The SO emission
was mapped with a 15′′ sampling over a region of about
200′′ by 200′′ centered on the VLA 1 source. The flux
is expressed in units of main-bream brightness tempera-ture. The efficiency of the telescope was 0.65 and 0.55 at 99.299883 GHz and 138.17864 GHz respectively.
The mid-infrared observations were obtained with the ISO satellite (Kessler et al., 1996) and the ISOCAM in-strument (Cesarsky et al. 1996). The low resolution spec-tra (λ/∆λ = 40) between 5 and 17µm were obtained in revolution 691 with the Circular Variable Filter (CVF) with a pixel scale of 6′′ and a total field of view of 3′
cen-tered on the HH 2 object. We present the data reduced with the pipeline version OLP10. The size (HPFW) of the Point Spread Function (PSF) is ≈ 6′′ for a pixel scale of
6′′.
Accurate astrometry (better than 2”) was established using a second CVF map containing the optically visi-ble Cohen-Schwartz (CS) star, taken in revolution 873. Details are given in Cernicharo (2000) and Lefloch et al. (2003). The zodiacal light and a possible large-scale emis-sion across the field were suppressed by subtracting a ref-erence spectrum from the whole dataset. A spectrum of the residual emission, away from HH 2, is shown in panel A of Fig. 8c (the “empty field”). In addition to the CVF map we obtained an image of the flux integrated in the range 5.0 − 8.5µm, including the H2 pure rotational lines
S(8)-S(4) and the PAH bands at 6.2 and 7.7µm. We extracted a map of the continuum emission in the range 13.9−15.5µm, outside the interval of emission of the [Ne 2], [Ne 3] and H2
S(2) lines. The data are presented in Figure 8. Coordinates are offsets (arcsec) relative to the position of VLA1 : α2000= 05h36m22.6s, δ2000= −06◦46′25′′.
The SNR of the data is not very high; we have av-eraged the signal over four fields typical of the region, which are drawn in Fig. 8 : in the cloud (A), along the jet (D), and over the “ring” (B,C, see below). The interstel-lar extinction towards HH 2 was estimated by Hartmann & Raymond (1984), who measured typical reddenings E(B − V ) = 0.11 − 0.44. Based on the extinction curve of Rieke & Lebofsky (1985), it appears that the flux dered-dening corrections are negligible and we use uncorrected flux values in what follows.
3. Entrained gas in the HH 2 region
Although the region has been extensively studied and sev-eral outflows identified (see e.g. Chernin & Masson 1995; Correia, Griffin & Saraceno 1997) it is only recently (1999) that the molecular counterpart to the HH 1-2 jet was dis-covered (Moro-Martin et al. 1999). The confusion in the HH 2 region is indeed very high; because of the weakness of the outflow emission and a propagation close to the plane of the sky (about 10o
, Noriega-Crespo, Calvet & B¨ohm 1991), it is difficult to identify the different kinematical components in line spectra.
Several observations suggest that the medium in front of HH 2 has been accelerated in the past. Henney, Raga & Axon (1994) showed that the medium in front of the counterjet of HH 2 (HH 1) is moving at a considerable velocity, 200 km s−1. Ogura (1995) reported the presence
of two giant bowshocks symetrically located at 30 arcmin from the protostellar core and aligned with HH 1-2, ejected some 104yr ago. These bowshocks were interpreted as the
Fig. 1. (left) Map of the high-velocity outflow emission in the12
CO(2-1) line (thick black contours) superposed on the map of the 13
CO(2-1) emission (thick white contours) and a [SII] image of the region (greyscale; Reipurth et al. 1983). The image has been saturated to outline the ring and the weak emission downstream of HH2. The redshifted wing of the HH 2 outflow is drawn in dashed contours. Contours range from 4 to 20 K km s−1 by step of 2 K km s−1. The blueshifted wing is drawn in solid
contours. First contour and contour interval are 1 and 0.5 K km s−1respectively. The white stars mark the position of the HH 2
knots A to L. The position of the regions discussed in the text (the “ring” and the molecular emission peak downstream HH 2) are indicated. (right) Map of the13
CO(2-1) emission integrated between 5.5 and 6.75 km s−1(thick white contours) and between
9.5 and 12 km s−1(dashed) superposed on a [SII] image of the region (greyscale). Intensity contours range 6 to 11 K km s−1.
signature of previous ejections from the source powering the HH 1-2 jet. We have re-analyzed more thoroughly the
12CO data presented by MM99 to search for any hint of
outflow/ejections older than the HH 1-2 jet mapped by them.
3.1. A CO outflow ahead of HH 2
We show in Fig. 1 the CO J = 2 → 1 high-velocity gas emission in the HH 2 region, as mapped by MM99. The redshifted (vlsr = 12 − 16 km s−1) outflow wing
associ-ated with the HH 2 jet extends between the driving source VLA 1 and the HH object (the H2 knots of shocked gas
are marked by white stars in Fig. 1. Close inspection of the data reveals another CO component, well colli-mated, which propagates downstream of the red wing at
blueshiftedvelocities (vlsr= 2 − 4 km s−1). A spectrum of
the CO outflowing gas near the brightness peak at offset position (60′′,−75′′) is displayed in Fig. 2. The blueshifted
wing overlaps very well the ambient gas layers, as traced by 13CO. The maximum of brightness in the blue
com-ponent is detected in the region that coincides with the HCO+ high-velocity wing reported by Dent, Furuya &
Davis (2003). This kinematical component extends from knots HH 2 K-E and propagates over ≈ 50′′, ahead of knot
L (see Fig. 1). The optical [SII] emission of HH 2 reveals a faint jet that propagates ahead of HH 2 and coincides spatially with the CO blueshifted outflow (see left panel in Fig. 1). This jet is likely to be the driving source of the blueshifted molecular material.
A crude estimate of the parameters in the outflowing gas was made by assuming a kinetic temperature of 30 K.
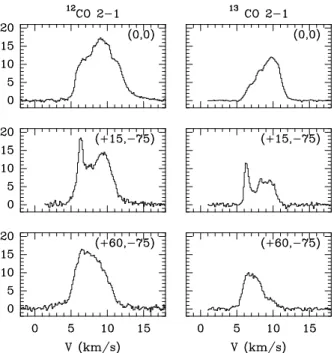
Fig. 2.Montage of12
CO(2-1) and13
CO(2-1) spectra at 3 po-sitions : the protostellar core (top), the “ring” (middle), and the “molecular peak” downstreamm HH 2 (bottom).
As can be seen in Fig. 2, the CO spectra indicate antenna temperatures of ≃ 20 K, which is a lower limit to the in-trinsic line brightness. The brightness temperature of the very optically thick CO lines provides a lower limit to the actual gas kinetic temperature, which is about 25 K. An upper limit is provided by the main-beam brightness temperature ≃ 40 K; we adopt an intermediate value of 30 K in this work. This value is characteristic of the am-bient gas and may underestimate the actual temperature in the outflowing gas. It is higher than the 13 K estimated by Girart et al. (2002). These authors obtained this esti-mate indirectly, based on a multi-transition Monte-Carlo analysis of HCO+
. We favor our approach, which relies directly on the observation of a “standard” tracer; excita-tion problems can be very severe for HCO+. The presence
of a thermal gradient in the layers cannot be excluded, in which case the temperature at the surface (traced by the low-excitation CO line) could be higher than in the inner denser regions probed by HCO+.
Integrating the wing emission in the range 2 − 4 km s−1, we find a mass of 0.015 M
⊙ and a momentum
of 0.1 M⊙km s−1. These parameters compare well with
those derived for the high-velocity molecular outflow as-sociated with the HH 2 jet. This blueshifted component appears relatively well collimated and is aligned with the redshiftedHerbig-Haro jet HH 2, which suggests a common origin for both ejections. Both components slightly overlap at the position of the knots E-F-K, where the maximum of shocked H2 emission is detected in the mid-IR (Lefloch
et al. 2003). The alignment and overlap is better seen in the higher-angular resolution observations of Dent, Furuya
& Davis (2003). Though appealing, it is not clear if this change of orientation results from precession of the jet driving source (blue and red components would be trac-ing two different ejections) or from deflection upon impact on dense obstacle (the components are tracing one single jet). Both components have approximately the same (pro-jected) size ≈ 50′′ = 3.3 × 10¹⁷
cm, and could trace two ejections separated by 500 yr, assuming a typical ejection velocity of 200 km s−1. This blueshifted outflow and the
optical jet downstream of HH 2 provide direct evidence that material ahead of HH2 has already been accelerated by previous outflowing ejections.
3.2. The high-density gas emission
SO is a tracer whose emission is more highly contrasted than CO because its abundance can be greatly enhanced in shocks and in the high-temperature central protostel-lar regions (the “hot cores” of low- and high-mass proto-stars), where grain mantles are evaporated and S-bearing molecules released in the gas phase. SO is therefore espe-cially suited to map the shocked gas of the outflow and its interaction with the ambient cloud. We detected ex-tended SO emission over the entire surveyed region. We show in Fig. 3 a channel map of the velocity-integrated flux of the SO 34−23 line. We found two maxima ; the
first one is located at position (−75′′, 12′′), the second one
lies very close to knot HH 2L at position (60′′,−75′′), in
very good agreement with the “molecular peak” position determined by Girart et al. (2002). At this position, SO lines are bright (∼ 4 K), more than twice as bright as in the protostellar core, where the HH 1 jet is detected as a blue wing, and in the HH 2 outflow (see Fig. 4).
We concentrate on the region downstream HH 2 in what follows. From the half-power contour, we estimate a transverse (deconvolved) size of ≈ 20′′, hence barely
re-solved by our observations. We show in Fig. 4 the profiles obtained in a 4-point cut in declination across the bright-ness peak at (60′′, −75′′). The line profiles peak at about
6.5 km s−1. However, they are characterized by several
kinematical components, which vary between adjacent po-sitions, separated by 15′′. At δ = −90′′, a secondary
com-ponent is detected at 6.89 km s−1. The velocity channel
map suggests that the 7 km s−1 component peaks at lower
declination, near position (50′′, −90′′). Unfortunately, the
data sampling is lower in that region (30′′) and does not
allow us to resolve details in the structure of this fea-ture. North of the peak (δ > −60′′), a secondary
compo-nent is detected at 10 km s−1. It is is rather weak, with
Tmb ∼1 K, but it is unambiguously detected across the
whole map. It is spatially associated with low-redshifted gas which extends from the VLA 1 protostellar core to HH 2 and beyond. Overall, the gas traced by SO does not appear quiescent in the region downstream of HH 2.
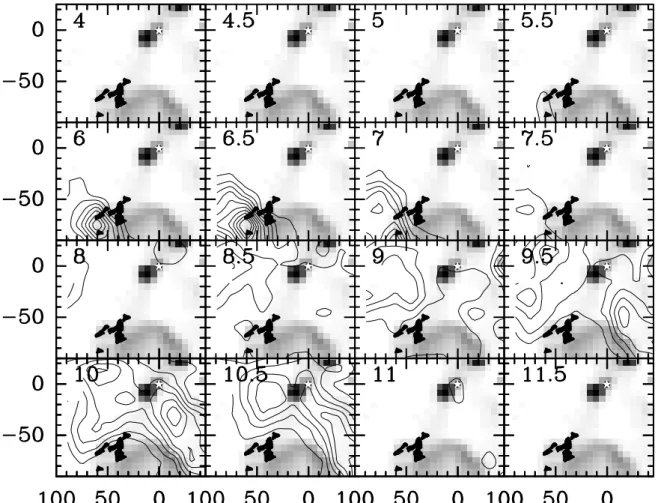
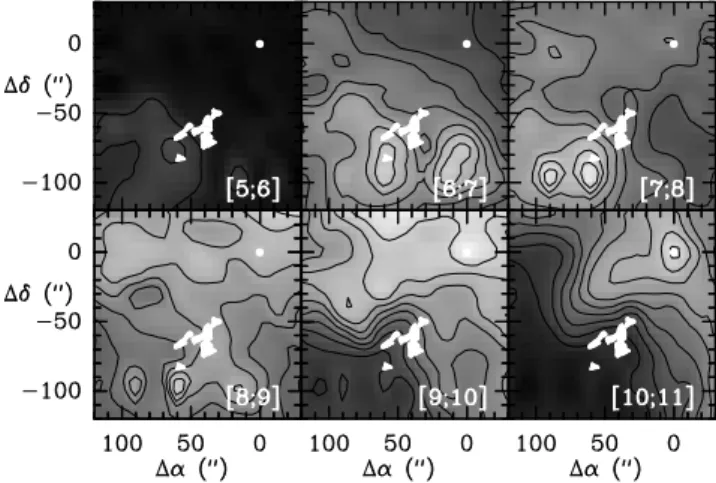
Fig. 3.Velocity-integrated intensity channel map of the SO 34− 23 emission in the HH 1-2 region (contours), superposed on
the 5.0 − 8.5µm emission map obtained with ISO. First contour and contour interval is 0.2 K. Velocity is indicated in the top right corner of each panel. The position of VLA 1 is marked by a white star. The individual HH knots are drawn in black. Coordinates are in arcsec offset with respect to VLA 1.
3.2.1. Physical properties of the SO emission
We have carried out an LVG analysis of the SO emis-sion at a few positions close to the brightness peak region, considering one single gas component. We have neglected any thermal and/or density gradients in the emitting gas layer, despite the fact that the SO emission arises from a shocked gas layer, as we discuss below in Sect.3.2.2. Taking into account such an effect would introduce an additional degree of freedom in the modelling, for which the present observational data set does not bring any constraints. We
adopt a kinetic temperature of 30 K, similar to that deter-mined in the lower-density gas traced by CO (see above). Collisional rates for SO have been derived from those of CS-H2computed by Green & Chapman (1978); the
proce-dure for3
Σ molecules is described by Fuente et al. (1990). We obtained very similar results using the more recent col-lisional rates computed by Green (1994) and extrapolated at temperatures lower than 50K.
At the peak, both lines are bright with main beam tem-peratures of 4.2 K and 4.7 K for the 23−12and 34−23
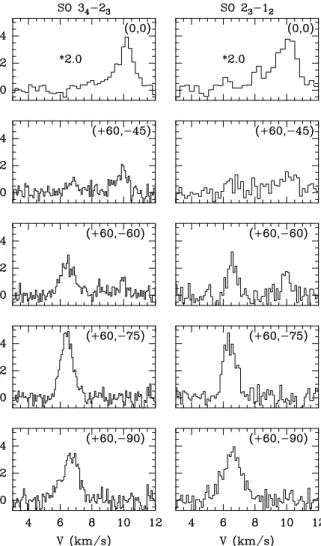
tran-Fig. 4.Spectra of the SO 34− 23and 23− 12lines observed
to-wards the molecular emission peak downstream HH 2 at offset position (60′′, −75′′) and the protostellar source VLA 1. Flux
is in main-beam brightness temperature. Line intensities have been multiplied by 2.0 for the VLA 1 spectra.
sitions respectively. Linewidths are ≈ 1 km s−1. We find a
solution for a column density N (SO) = 5.6 × 10¹³
cm−2
and a gas density n(H2) = 5.5 × 105cm−3. The lines are
optically thin with opacities of 0.45 and 0.23 for the 34−23
and 23−12respectively. The LVG calculations predict
in-tensities of 2.2 K for the 56−45 219.9494 GHz and 0.91 K
for the 67−56 261.8437 GHz, both transitions observed
by Girart et al. (2002) at the SO peak. This is in good agreement with the line brightness, once corrected for the beam dilution factor (respectively 0.257 and 0.322).
We note that a lower temperature, of the order of 15K for the emitting gas, would require much higher densities, of the order of n(H2) = 5 × 106cm−3, and N (SO) ≃ 6.5 ×
1013cm−2. These densities are far too high and lead to a
flux much larger than what is observed for the 56−45and
67−56 transitions (2.7 K and 1.3 K respectively). These
results differ somewhat from the simple LTE analysis by Girart et al. (2002). Indeed, the excitation temperature
Fig. 5.Variations of the SO 34− 23/23− 12 (thick solid) and
67− 56/56− 45 (thick dashed) intensity line ratios with
tem-perature and density at the molecular peak. The SO column density is taken to be 5.6×10¹³
cm−2(see text). Thin contours
draw the values at 90 and 110
ranges from 24 K for the 23−12 transition down to 9 K
for the 67−56 transition, showing that these transitions
are far from being thermalized.
Taking into account the uncertainties in the bright-ness determination, it appears that various sets of physi-cal conditions can account for the observed lines. We have explored the range of solutions in the parameter space de-fined by the density and the temperature, adopting the SO column density determined above at the brightness peak (the “best solution”). We show in Fig. 5 the in-tensity line ratios 34−23/23−12 (thick solid line) and
67−56/56−45 (thick dashed line). A good agreement is
obtained for densities in the range 3 − 6 × 10⁵
cm−3 and
temperatures between 25 and 40 K. Allowing a variation of 10% for each ratio, we find that the density has to be more than 105
cm−3, and the temperature less than 100 K.
If the density n(H2) is larger than 2.5 × 105cm−3 i.e. the
average gas density in the layer (see Sect. 4.1), the tem-perature is relatively well constrained, between 20K and 60K. Observations of higher-excitation transitions of SO (and CO) would help constrain the temperature.
Comparison of the relative intensities at the neighbour-ing positions (Fig. 4) shows that the 34−23intensities is
lower than 23−12, suggesting a change of excitation
con-ditions, namely a lower density. An LVG analysis yields a column density N (SO) = 3.0 − 4.0 × 1013cm−2 and
a density n(H2) ≃ 2 × 105cm−3. If the gas temperature
were lower, typically 15 K, the densities derived would be n(H2) ≃ 6 − 7 × 105cm−3, which is very unlikely for
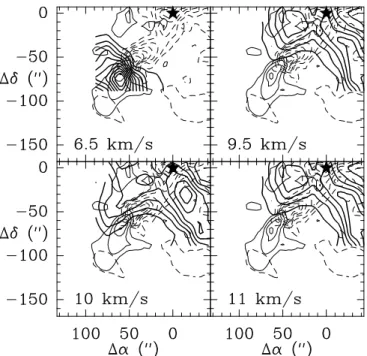
struc-Fig. 6.Comparison of the emission distribution of the SO 34−
23 (black contours) at various velocity intervals (6.5, 9.5, 10,
10.5 km/s) with the CO 2-1 high-velocity outflow. First contour and contour interval are 0.2 K.
tures with a size of 1017cm in the molecular cloud. The
densities derived from our LVG approach are very similar to those quoted by Dent et al. (2003), from millimeter dust continuum, and from modelling of the HCO+
emission by Girart et al. (2002).
The secondary component at 10 km s−1detected North
of the SO peak (δ = −60′′ and δ = −45′′) is characterized
by high-excitation conditions with a ratio 34−23/23−12∼ 1.5. Such a high value is found only at the SO emis-sion peak ahead of HH 2 (it is less than 1 elsewhere in that area). Carrying out an LVG analysis of the posi-tion (60′′, −45′′) and adopting a kinetic temperature of
30 K, we find a gas density n(H2) = 5 × 106cm−3 and
N (SO) = 2.0 × 10¹³
cm−2. Again, the density estimate
re-lies on the temperature adopted, but we stress that 30 K is probably a reasonable lower limit (lower temperatures require even higher densities, ∼ 107
cm−3, irrealistically
large for the large-scale entrained gas of a molecular out-flow). The emitting gas is therefore characterized by high densities, much larger than in the ambient parental cloud, and possibly warmer temperatures. Taking into account that this gas is moving into the ambient cloud, we con-clude that at least part of the SO component is tracing gas shocked and/or accelerated by the HH 2 jet.
3.2.2. Origin of SO emission
How does the distribution of the SO-emitting gas relate to the CO outflowing gas detected in HH 2 ? Figure 6 shows that SO traces the large-scale features associated with the
accelerated gas detected in CO on each side of the pro-tostellar core at 8.5 km s−1. In the protostellar core itself,
the SO line profiles exhibit blue- and red-shifted wings, which are the signature of the HH 1-2 outflow. We did not find any evidence of emission along the jet down to HH 2; instead, we detect in the same velocity range emis-sion that is spatially shifted with respect to the jet; such a shift could be an indication that the emission arises from the jet rim, i.e. the low-velocity shock region of the jet (see Lefloch et al. 2003). The gas column densities de-rived are indeed comparable to the values encountered in other young protostellar outflows, like L1157 (Bachiller & Perez-Gutierrez, 1997). Observations at higher-angular resolution would help clarify this point.
As discussed above, the high-velocity blushifted out-flow propagates into the gas layers downstream of HH 2, where SO is detected at velocities equal or very close to ambient (Fig. 6). The SO emission is elongated perpendic-ular to the CO outflow direction, which propagates across the SO region -limited by the contour at half-power- and finishes ≈ 40′′ Southeast of the SO peak. Both ambient
SO and high-velocity CO brightness peaks are very close to each other (less than 10′′) and to knot HH 2L, where
shocked molecular gas is detected (see e.g. Lefloch et al. 2003). This peak coincides with the maximum of density and of SO column density. Analysis of the physical con-ditions shows that the gas is denser than in the ambient parental cloud and could be warmer than the 30 K es-timated from CO. The detection of high-velocity gas at the position where the density is highest suggests that SO is tracing the impact of the flow in the cloud. Also, the amount of SO material detected along the HH 2 jet and the layers downstream of HH 2 are similar (to less than a factor of 3), which suggests a common mechanism, and the column densities derived are typical of protostellar outflows.
Because the inclination of the flow with respect to the line of sight is very large, it is difficult to determine at which velocity SO emission occurs when the flow impacts the gas layers. Detailed modelling would help constrain the physical conditions of the shock that could account for the SO emission detected or if on the contrary UV radiation plays an important role in the emission detected.
4. A cavity in the cloud
In the previous section, we showed evidence that the protostellar outflow from VLA 1 has propagated beyond HH 2. Its impact on the ambient gas causes shocks which are detected in high-density tracers such as SO. Previous studies of the gas and dust structure in multiple star form-ing regions suggest that flows can have some other impact on the cloud dynamics; the study of NGC 1333 revealed for instance the presence of cavities in the cloud, appar-ently dug by the protostellar outflows (see e.g. Lefloch et al. 1998). We study in this section the large-scale distri-bution of the molecular gas kinematics around HH 2, to
Fig. 7.Map of the velocity-integrated 13
CO(2-1) intensity in the HH 2 region. First contour and contour interval are 2 and 1 K km s−1 respectively. Velocity interval is indicated in
the bottom right corner. The invidual HH knots are drawn in white.
search for any similar impact of the outflowing gas on the parental cloud.
4.1. The low-density gas around HH 2
We have studied the distribution of the low-density molec-ular gas by mapping the emission of the 13
CO(2-1) line. We present in Fig. 7 the map of the velocity-integrated flux in the range 5-11 km s−1. Three regions can be
dis-tinguished depending on the strength of the emission : the ambient cloud, between 8 and 9 km s−1; a fragment
downstream of HH 2, between 5 and 8 km s−1; the
“fila-ment” southwest of the protostellar core, between 10 and 11 km s−1.
We do not find any evidence of a large-scale veloc-ity gradient in the cloud. The velocveloc-ity field in the cloud and the “filaments” are rather smooth. The latter overlaps very well with the border of the cloud. On the contrary, there is a striking morphological association between the layers at blue velocities (5 − 8 km s−1) and the ambient
cloud (see right panel in Fig. 1) : the integrated emission of the fragment matches exactly the border of the ambient cloud, which is possible only because there is barely any ambient emission.
We detect two local maxima in the fragment down-stream of HH 2 : one coincides with the “molecular emis-sion peak” and the other peaks at the center of the optical “ring” at offset position (15′′, −90′′) (see Fig. 8d). The
gas in the fragment peaks at ≈ 6.3 km s−1. The emission
is characterized by bright lines (∼ 10 K) with a narrow linewidth (∼ 1 km s−1; see offset position (15′′, −75′′) in
Fig. 2).
An LVG calculation performed with a temperature of 30 K gives a column density N (H2) ≃ 6.0 × 1021cm−2 at
both positions in the layers. We note that the line opac-ity is quite high (≃ 0.68); it is probably the reason for
the lack of contrast in the emission. The gas column den-sity derived is in rough agreement with the determina-tion obtained by Dent, Furuya & Davis (2003), who found N (H2) = 2 × 1022cm−2 at the peak from dust
millime-ter continuum observations. From the mean H2density in
the gas (∼ 2 × 10⁵
cm−3), we find that the thickness of
the emitting region is ∼ 3 − 6 × 10¹⁶
cm (5′′
−10′′), much smaller than the extent over the sky. The emission appears to be distributed in a sheet of dense gas rather than in a “round clump”. This means that the dense “ambient” gas emission is distribued around a cavity.
4.2. Shocked H
2around the cavity
Our ISOCAM/CVF observations (Fig. 8d) reveal some weak H2 emission in the S(2) and the S(3) lines above the
4σ level in the gas shell where the second13CO maximum
is detected - offset position (15′′,−90′′). The H
2 emission
is detected at the border of the gas layer, where the ex-tinction is much less (Av≃4 at the molecular peak). The maximum of absorption in the center of the gas shell at (15′′,−90′′)) is responsible for the annular appearance of
the structure.
The H2 emission follows the distribution of the
mid-infrared continuum and the 11.3µm PAH band. The CVF spectra obtained towards the ring are similar to those of low-excitation galactic Photon Dominated Regions, such as Chamameleon, which are exposed to a low FUV field of a few ten times the ISRF (Boulanger et al., 1998). In none of the galatic PDRs of similar excitation conditions has H2 been detected. Therefore, we conclude that the
S(2) and S(3) lines are tracing shocked gas over the shell. The non-detection of higher-J H2transitions suggests
low-excitation conditions, perhaps due to low-velocity shocks or previous (old) shocks. This strengthens our hypothesis that the shell of dense gas has been shaped by shocks, most likely from outflows.
It is therefore no wonder that the mid-IR emission map shows no correlation with the millimeter thermal dust emission, which traces the “cold” dust. This component is detected mainly in the protostellar condensation VLA1-4 and in the layers ahead of HH 2 (Dent, Furuya & Davis 2003). The ring and the jet coincide with a minimum in the “cold” dust emission. Conversely, the maximum of ab-sorption in the layer ahead of HH 2 prevents any mid-IR radiation from escaping the border of the cavity.
4.3. Dust grain properties
The dust grains in the ring exhibit properties very dif-ferent from those observed in the protostellar envelopes of VLA 1-4. In the ring, we do not find any evidence at all of the presence of mantle ices. The silicate absorption is so large towards VLA 1 that it makes it difficult to analyse the mantle composition. The lower absorption in the envelope of VLA 4 allows us to characterize the com-position of the mantle ices : H2O, CH3OH, CH4, CO2
Fig. 8. (a) Mid-infrared emission integrated between 5 and 8.5µm superposed on an optical [S 2] image of HH 2 (Reipurth, 1993). Contours range from 3 to 5.6 mJy by step of 0.2mJy/pixel (px), from 6 to 10 mJy by step of 1 mJy/px, from 15 to 20 mJy by step of 5mJy/px. (b) High-velocity COJ = 2 → 1 emission (white contours) superposed on the 5.0 − 8.5µm integrated mid-infrared map (colourscale). Contours range from 4 to 20 K km s−1 by step of 2K km s−1. The position of the individual
shocks A-L are marked with stars. Red polygons delineate the fields used to compute individual spectra. (c) Spectra of the mid-infrared emission between 5.0 and 17µm. (d) Emission detected towards the “ring” West of HH 2H in :13
CO(2-1) : contours range from 6 to 11 K km s−1 by step of 1 K km s−1; H
2 S(2) 12.2µm : contours range from 4 to 10mJy by step of 2mJy/px;
13.9 − 15.4µm continuum : first contour is 4.mJy, following contours range from 4.5mJy to 7.5mJy by step of 1mJy/px; PAH 11.3µm band : contours range from 2 to 4.5 mJy by step of 0.5mJy/px. The CVF maps were convolved with a Gaussian of 12” HPFW to outline the extended emission. The rms in the 11.3µm PAH map and the continuum map is 0.3mJy/ px; it is ≈ 1mJ y/ px in the H2 S(2) map
(Cernicharo et al. 2000). A broad bump from 11 to about 14µm is detected all over the ring. Such a bump is inter-preted as the signature of crystalline silicates, although the exact composition would require complementary data at longer wavelengths. Note that crystalline silicates have also been detected around the CS star (Cernicharo et al. 2000). Standard dust grains are expected to undergo deep changes in their composition when crossing shock(s) in the protostellar jet, as they release their icy mantle into the gas phase, either because of sputtering or shattering (Jones et al. 1994). Such processes result in an enrichment of the population of very small grains. Most likely, the very small grains detected by ISOCAM in the jet and in the ring are the result of this enrichment. In this context, a simple explanation for the detection of crystalline silicates is that they were originally present in grain cores and had already started to crystallize before the mantles evapo-rated. Further spectroscopy with the instruments onboard SPITZER should allow us to better constrain the compo-sition and the physical parameters of the dust grains. As discussed above, the peculiar gas composition ahead of HH 2 most likely results from shock(s) too. Molecular line observations at higher angular resolution should be under-taken to better constrain the parameters of the shock.
4.4. What is the origin of the cavity ?
The peculiar geometry of the gas fragment downstream of HH 2 suggests that it could have been detached from the parental cloud. At least two observational facts suggest that the outflow activity could be responsible for detach-ing this fragment. First, the border of the ambient cloud coincides with the location of the knots HH 2A-K, where violent, dissociative shocks are detected. Second, the out-flow wing downstream of HH 2 coincides very well with the gas fragment, in the plane of the sky. Both gas components (the fragment and the outflow wing) are blueshifted with respect to the ambient cloud.
On the other hand, the momentum carried away by the blushifted outflow wind is ≈ 0.1 M⊙km s−1, i.e. a
fac-tor of a few less than the momentum necessary to detach the fragment from the cloud. The sum of several ejec-tions in the past could have provided enough momentum; we speculate that another outflow, much more powerful, could be responsible for digging the cavity in the ambient cloud. When looking at the velocity channel map of SO emission (Fig. 3), it is interesting to note that the fila-ment southwest of the core : a) consists of dense gas (SO), b) is velocity-shifted with respect to the ambient cloud, c) closely follows the border of the latter. Such a config-uration is suggestive of a shock front propagating from the border of the cavity into the cloud. The orientation of such an outflow would probably be closer to North-South than the actual HH 1-2 jet.
5. Photon-Dominated Region in HH 2
The emission integrated between 5 and 17µm is shown in Figs. 8a-b. The SNR rms is ∼ 0.1mJy in the map. Protostar VLA 4 (Cernicharo et al. 2000) is detected as a bright point source in Figs. 8a-b. After subtracting the contribution of the ambient cloud, estimated from a ref-erence position, the residual flux appears very weak; a spectrum of the emission averaged over a reference field centered at (+100′′, −35′′) shows a contribution less than
∼ 1 mJy (panel A in Fig. 8c). Hence, the emission dis-cussed here arises from the HH 2 region. Southeast of the protostellar core down to HH 2, we detect mid-infrared emission along the HH 2 jet. The average flux level was estimated over field D and is about 5 mJy longwards of 10µm (5σ above the rms noise level). The spatial coinci-dence with the CO high-velocity outflow (Fig. 1) suggests a physical assocation with the latter. The nature of the CVF emission appears to be mainly continuum in the jet, as indicated by the spectrum of Field D (Fig. 8c). This is the first time that mid-infrared continuum emission is reported towards a protostellar jet.
The map of the pure continuum between 13.9 and 15.4µm shows that most of the flux comes from a ring-like structure (hereafter the “ring”) of 60′′diameter (0.13 pc),
westwards of HH 2H (Fig. 8d), This annular structure is detected in the optical SIIline (Reipurth et al. 1993) and in the 5.0 − 8.5µm emission map. The minimum of emis-sion in the center of the ring coincides with the peak of gas column density detected in 13
CO, at offset position (15′′,−75′′). This provides direct evidence that the
mid-IR “ring” and the molecular gas surrounding the cavity are closely related. The average spectrum of the ring ob-tained in field C shows the emission of the UIBs between 6.2 and 11.3µm, which are a direct tracer of the local UV field. Identification is more difficult in the Southern part of the ring (field B); the SNR is not high enough to con-clude about a gradient in the PAH abundance. However, the continuum emission detected in the South testifies to the fact that the whole gas layer is illuminated by UV photons, on the rear side.
The emitting region, as traced by the 11.3µm map (Fig. 8d), coincides very well with the pure continuum emission distribution. In the jet, on the contrary, we note that there is no hint of PAH emission bands. The relatively low SNR and the strong cloud extinction prevent us from drawing a conclusion about the presence/absence of PAHs along the jet.
A rough estimate of the FUV field intensity is obtained by integrating the flux in the ISOCAM band. This yields an infrared luminosity L ∼ 0.01 L⊙, and a FUV field : G =
20G0. This is fully consistent with the estimate obtained
by Molinari & Noriega-Crespo (2002) from the analysis of the FIR [CII] 158µm and [OI] 63µm, 145µm lines and the FIR continuum observed at 80′′resolution with ISO/LWS.
We note that our direct estimate of the FUV lies in the low range of values (20-1000 G0) required by the models
of UV-driven photochemistry (Viti et al. 2003) to account for the molecular emission ahead of HH 2.
Continuum emission in the jet and the ring could be fitted by a greybody with an opacity law τν ∝ ν and a temperature Td = 200 − 250 K. Assuming that the
emis-sion comes from typical interstellar a(big) dust grains, we find that the amount of material corresponds to an Av ≃0.1 − 1 × 10⁻⁶, which translates into very low gas column densities. The efficiency of dust grains with a size as small as 0.003µm is too low (Draine & Lee, 1984) to reach equilibrium temperatures of this order, unless the UV field is actually very strong, far above our estimate. Most likely, we are observing the emission of very small dust grains, transiently heated to high temperatures by the local UV field.
Weak continuum flux is also detected across the HH object and West of the protostellar core VLA 1-4. This extension coincides with the border of the cavity in the molecular cloud.
5.1. HH 2H as exciting source of the PDR
Previous observations in the UV have revealed strong ex-tended emission in the direction of HH 2H-2A (B¨ ohm-Vitense et al 1982; Raymond et al. 1997). The other sources in the field detected by IUE are HH 1 and the Cohen-Schwartz star; both are located too far away to account for the PDR observed around HH 2. Analysis of optical high-ionization lines has shown evidence for a J-type shock with velocities of ∼ 180 km s−1 moving
into previously accelerated gas (optical measurements in-dicate proper motions up to 400 km s−1 towards HH2H
and HH2A (Bally et al. 2002), identifying HH2H as the actual jet impact region (or Mach disk region). HH2H-2A is therefore the most plausible candidate as an exciting source; it is also the only place where X-ray emission has been detected in the region (Pravdo, 2001).
HUT measurements by Raymond et al. (1997) show that the UV continuum is dominated by 2 photon radia-tion of collisionally excited H atoms longwards of 1750˚A. At shorter wavelengths, the continuum is dominated by H2 Lyman emission bands. Once corrected for the
inter-stellar extinction, the total UV luminosity is ∼ 0.3 L⊙; it
is distributed roughly equally between both mechanisms. The exact solid angle encompassed by the ring is difficult to estimate. Following our hypothesis that the outflow has dug a cavity around HH 2, it is reasonable to assume that the ring and the molecular emission peak ahead of HH2 are at about the same distance to the UV source, knots H-A (50′′). The diameter of the ring is 60′′, hence the
fraction of photons intercepted by the ring is ∼ 5%, which compares well with the mid-IR luminosity radiated by the very small grains in the walls of the cavity (3% of the UV luminosity produced in HH2H-2A).
The possibility of a similar mechanism (strong J-shocks) to account for the mid-infrared emission along the protostellar jet, between VLA 1 and HH 2, should be
ex-plored. Deep sensitive spectroscopy of the entrained gas could allow one to constrain such possibility. Another pos-sibility is that the jet region is actually almost free of dust grains after the crossing of the strong shocks which are now impacting HH 2. In this case we would be detecting the walls of a dust-free cavity around the jet, illuminated either by HH 2H or by the powering source.
6. Summary and conclusions
The observations presented in this paper allow us to draw a more complete and complex picture of the HH 2 region. In addition to the high-velocity molecular outflow associ-ated with the optical jet HH 1-2, we have detected another outflow component that propagates over 50′′in the
molec-ular gas downstream HH 2. This outflow is associated with a weak jet detected in the optical, which appears to come from HH 2. The orientation of this component in the sky differs from the HH 2 jet and could be the result of jet de-flection on the dense obstacles responsible for the knots of H2emission in HH 2. Another possibility is that this
com-ponent traces a previous ejection from the source, which would be precessing. High angular resolution observations should allow us to test the first hypothesis, by comparison with numerical modelling (see e.g. Raga & Canto 1995)
This provides direct evidence that the molecular gas ahead of HH 2 has been affected by protostellar ejections. It is consistent with the detection of optical bow-shocks at large distances from the HH 1-2 region. Several kine-matical components are detected in the gas downstream of HH 2. Observations of SO reveal the presence of very dense gas (∼ 2 − 5 × 10⁵
cm−3) associated with the
low-velocity shocks along the HH 2 jet, and in the blueshifted outflow, close to knot HH 2L. The latter position coincides with the peak of emission in the region. We conclude that SO is probably tracing the shock interaction of the outflow with the ambient gas.
The gas layers downstream of HH 2 exhibit evidence of shocks : East of HH 2, ISOCAM observations detect H2 line emission in the gas layers, which is the
signa-ture of shocks, probably old enough to be detected only in the low-excitation transitions S(2) and S(3). The gas layers have been shaped in a shell, probably as the result of prostellar outflow interaction with the cloud. Actually, the morphology and kinematics of the filament Southwest of the protostellar core are compatible with their tracing a shock-compressed“back side” of the cavity (the “front side” being the gas shell downstream of HH 2).
ISOCAM observations show emission from very small grains at the inner surface of the cavity downstream of HH 2. This could result from the shattering and sputter-ing of large interstellar dust grains in the outflow/cloud interaction. We find that the UV field produced in the strong shock HH 2H-A, which illuminates the inner side of the cavity, creates a Photon-Dominated Region of FUV intensity G ∼ 20G0. It is sufficient to account for the
emission of the very small grains and the PAHs detected. Mid-infrared emission along the jet remains a puzzle; deep
mid-infrared spectroscopy along the jet could allow one to determine the origin of the emission, in particular if it is related to strong dissociative shocks between the source and HH 2.
Our observations indicate that some of the molecular species whose abundance is found enhanced in the gas downstream of HH 2 are actually produced in the region of outflow interaction with the cloud. Mapping at better angular resolution, comparable to the data presented here, should be undertaken. In combination with detailed shock modelling, it would allow us to explore the shock hypoth-esis and estimate its relative contribution with respect to UV-induced photodesorption in the gas phase enrichment of “unusual” molecular species.
Acknowledgements
J. Cernicharo acknowledges the Spanish DGES for this research under grants AYA2000-1784 and AYA2003-2784. We thank Dr. F. Boulanger for many stimulating discus-sions on the ISOCAM observations of HH 2.
References
Bachiller, R., Perez Gutierrez, M., 1997, ApJ, 487, L93 Bally J., Heathcote, S., Reipurth, B., Morse, J., Hartigan, P.,
and Schwartz, R. 2002, ApJ, 123, 2667
B¨ohm-Vitense, E., B¨ohm, K.H., Cardell, J.A., Nemec, J.M. 1982, ApJ, 262, 224
Boulanger, F., Abergel, A., Bernard, J.P., et al., in “Star Formation with the Infrared Space Observatory”, ASP Conference Series, 1998, vol. 132, pg 15, eds. J. Yun & R. Liseau,
Cernicharo, J., Noriega-Crespo, A., Cesarsky, D., et al., 2000, Science, 288, 649
Cesarsky, C.J., Abergel, A., Agnese, P., et al., 1996, A&A, 315, L32
Davis, C.J., Dent, W.R.F., Bell Burnell, S.J., 1990, MNRAS, 244, 173
Dent, W.R.F., Furuya, R.S., Davis, C.J., 2003, 339, 633 Draine, B.T., Lee, H.M., 1984,ApJ, 285, 89
Fuente, A., Cernicharo, J., Barcia, A., Gomez-Gonzalez, J., 1990, A&A, 231, 151
Girart, J.M., Viti, S., Williams, D.A., Estalella, R., Ho, P.T.P., 2002, A&A, 388, 1004
Green, S., 1994, ApJ, 434, 188
Green, S., & Chapman, S., 1978, ApJS, 37, 169 Hartmann, L. & Raymond, J.C., 1984, ApJ, 276, 560 Henney, W.J., Raga, A.C., Axon, D.J., 1994, ApJ, 427, 305 Hester, J.J., Stapelfeldt, K.R., Scowen, P.A., 1998, ApJ, 116,
372
Hollenbach, D., & McKee, C. F. 1989, ApJ, 342, 306
Jones, A.P., Tielens, A.G.G.M., Hollenbach, D.J., McKee, C.F., 1994, ApJ, 433, 797
Kessler, M.F., Steinz, J.A., Anderegg, M.E., 1996, A&A, 315, L27
Lefloch, B., Cernicharo, J., Cabrit, S., et al., 2003, ApJ, 590, L41
Martin-Pintado, J., Cernicharo, J., 1987, A&A, 176, L27 Molinari, S., Noriega-Crespo, A., 2002, ApJ, 123, 2010 Moro-Mart´ın, Cernicharo, J., Noriega-Crespo, A.,
Mart´ın-Pintado, J., 1999, ApJ, 520, L111 (MM99)
Ogura, K., 1995, ApJ, 450, L23
Pravdo, S. H., Feigelson, E.D., Garmire, G., Maeda, Y., Tsuboi, Y., Bally, J., 2001, Nature, 413, 708
Raga, A.C., Cant´o, J., 1995, RmxAA, 31, 51 Rieke, G.H., Lebofsky, M.J., 1985, ApJ, 288, 618
Raymond, J., Blair, W.P., & Long, K.S. 1997, ApJ, 489, 314 Reipurth, B., Heathcote, S., Roth, M.,Noriega-Crespo, A.,
Raga, A.C. 1993, ApJ, 408, L408
Torelles, J.M., Rodriguez, L.F., Canto, J. et al., 1992, ApJ, 396, 95
Viti, S., Williams, D.A., 1999, MNRAS, 310, 517
Viti, S., Girart, J.M, Garrod, R., et al., 2003, A&A, 399, 187 Wolfire, M.G., K¨onigl, A., 1993, ApJ, 415, 204
![Fig. 1. (left) Map of the high-velocity outflow emission in the 12 CO(2-1) line (thick black contours) superposed on the map of the 13 CO(2-1) emission (thick white contours) and a [SII] image of the region (greyscale; Reipurth et al](https://thumb-eu.123doks.com/thumbv2/123doknet/14619482.546970/4.892.103.831.249.619/velocity-emission-contours-superposed-emission-contours-greyscale-reipurth.webp)
![Fig. 8. (a) Mid-infrared emission integrated between 5 and 8.5µm superposed on an optical [S 2 ] image of HH 2 (Reipurth, 1993)](https://thumb-eu.123doks.com/thumbv2/123doknet/14619482.546970/10.892.146.832.64.902/fig-infrared-emission-integrated-superposed-optical-image-reipurth.webp)
