HAL Id: hal-00300981
https://hal.archives-ouvertes.fr/hal-00300981
Submitted on 14 Nov 2002HAL is a multi-disciplinary open access
archive for the deposit and dissemination of sci-entific research documents, whether they are pub-lished or not. The documents may come from teaching and research institutions in France or abroad, or from public or private research centers.
L’archive ouverte pluridisciplinaire HAL, est destinée au dépôt et à la diffusion de documents scientifiques de niveau recherche, publiés ou non, émanant des établissements d’enseignement et de recherche français ou étrangers, des laboratoires publics ou privés.
Estimated variability of below-cloud aerosol removal by
rainfall for observed aerosol size distributions
C. Andronache
To cite this version:
C. Andronache. Estimated variability of below-cloud aerosol removal by rainfall for observed aerosol size distributions. Atmospheric Chemistry and Physics Discussions, European Geosciences Union, 2002, 2 (6), pp.2095-2131. �hal-00300981�
ACPD
2, 2095–2131, 2002 Below-cloud aerosol removal C. Andronache Title Page Abstract Introduction Conclusions References Tables Figures J I J I Back CloseFull Screen / Esc
Print Version Interactive Discussion
c
EGU 2002
Atmos. Chem. Phys. Discuss., 2, 2095–2131, 2002 www.atmos-chem-phys.org/acpd/2/2095/
c
European Geosciences Union 2002
Atmospheric Chemistry and Physics Discussions
Estimated variability of below-cloud
aerosol removal by rainfall for observed
aerosol size distributions
C. Andronache
Boston College, Chestnut Hill, Massachusetts, USA
Received: 12 August 2002 – Accepted: 11 October 2002 – Published: 14 November 2002 Correspondence to: C. Andronache (andronac@bc.edu)
ACPD
2, 2095–2131, 2002 Below-cloud aerosol removal C. Andronache Title Page Abstract Introduction Conclusions References Tables Figures J I J I Back CloseFull Screen / Esc
Print Version Interactive Discussion
c
EGU 2002
Abstract
Below-cloud scavenging (BCS) coefficients of aerosols by rainfall are estimated for reported aerosol size distributions measured during field experiments in various envi-ronments. The method employed is based on explicit calculations of the efficiency of collision between a raindrop and aerosol particles. Results show that BCS coefficient
5
increases with rainfall rate and has a significant dependence on aerosol size distribu-tion parameters. Thus, BCS is important for very small particles (with diameters less than 0.01 µm) and for coarse particles (with diameters larger than 2 µm). For rainfall rate R ∼ 1 mm hr−1, the 0.5-folding time of these particles is of the order of one hour. It is shown that BCS is negligible for aerosol particles in the range [0.1-1] µm if compared
10
with in-cloud scavenging rates for low and moderate rainfall rates (R ∼ 0.1 − 10 mm hr−1). The results indicate that a boundary layer aerosol size distribution with coarse mode is drastically affected very shortly after rain starts (in a fraction of one hour) and consequently, the below-cloud aerosol size distribution becomes dominated by parti-cles in the accumulation mode.
15
1. Introduction
The scavenging of aerosol particles (AP) by dry deposition and precipitation represent important processes by which a balance is maintained between the sources and sinks of airborne particles. The wet removal by precipitation is by far the most efficient atmo-spheric aerosol sink and the detailed mechanism of this process involves microphysical
20
interactions between AP and hydrometeors (Pruppacher and Klett, 1997). For practical reasons, the APs wet removal is typically represented in current models by scaveng-ing coefficients in aerosol mass continuity equations. These scavenging coefficients are determined to be a function of bulk quantities available from measurements, such as the precipitation rate at the ground. While significant experimental and theoretical
25
ACPD
2, 2095–2131, 2002 Below-cloud aerosol removal C. Andronache Title Page Abstract Introduction Conclusions References Tables Figures J I J I Back CloseFull Screen / Esc
Print Version Interactive Discussion
c
EGU 2002
conditions (Wang and Pruppacher, 1977; Grover et al., 1977; Wang et al., 1978; Slinn, 1983), recent reports show that the representation of aerosol removal processes in current aerosol transport models remains a source of uncertainty (Rasch et al., 2000). In addition, the understanding of wet removal processes remains crucial in local and regional pollution studies (Dana and Hales, 1975; Radke et al., 1980; Scott, 1982;
5
Chang, 1986; Jylha, 1991, 1999; Sparmacher et al., 1993; Okita et al., 1996; Mircea et al., 2000).
An AP can be removed from atmosphere by (1) nucleation scavenging or by (2) im-paction scavenging. In nucleation scavenging, APs serve as cloud condensation nuclei (CCN) or ice nuclei (IN) in the initial stage of cloud formation and these processes are
10
controlled by the requirements for heterogeneous nucleation in the atmosphere such as supersaturation. In contrast, the impaction scavenging depends on the net action of various forces influencing the relative motion of APs and hydrometeors. Nucleation scavenging dominates the impaction scavenging at the beginning of cloud formation and experimental and model results show that this process can deplete the original
15
aerosol population in air up to 75–90% (Junge, 1963; Flossmann et al., 1985, 1987; Ten Brink et al., 1987; Schumann, 1991). A fraction of APs that are not scavenged by nucleation might become incorporated into cloud and precipitation hydrometeors through impaction scavenging. Similar mechanisms act during in-cloud scavenging (ICS) and below-cloud scavenging (BCS). These mechanisms are: convective
Brown-20
ian diffusion, interception, inertial impaction, thermophoresis, diffusionphoresis, airflow turbulence and electrostatic attraction (a literature review on these processes is given by Pruppacher and Klett, 1997). One significant difference between the ICS and BCS processes is that the in-cloud interstitial aerosol grows typically into cloud droplet (with a diameter of about 10 µm), which makes the collection by falling raindrops very
ef-25
ficient. While the BCS is less efficient than the ICS, there are several environmental conditions when this process is important, especially in cases when mechanical gen-erated large particles are present near the Earth’s surface as will be illustrated in this paper.
ACPD
2, 2095–2131, 2002 Below-cloud aerosol removal C. Andronache Title Page Abstract Introduction Conclusions References Tables Figures J I J I Back CloseFull Screen / Esc
Print Version Interactive Discussion
c
EGU 2002
Major work has been done in the last decades to characterize the BCS based on the concept of efficiency of collision between a falling raindrop and aerosol particles. Earlier work by Greenfield (1957) recognized the role of Brownian motion in increasing efficiency of collision between the raindrop and the very small aerosol particles (with diameters dp < 0.01 µm). Similarly, large particles (with diameters dp > 2 µm) tend 5
to have high collision efficiency because of their inertia. The particles with diameters in the range 0.01 and 2 µm appeared to have a very small efficiency of collision and this size range is named “scavenging gap”. Further work by Slinn and Hales (1971) showed that the thermophoresis could enhance the BCS of aerosols with diameters in the range [0.01–1] µm. Following experimental work and model results by Grover et
10
al. (1977), Wang et al. (1978), Byrne and Jennings (1993), showed that the presence of charge on aerosol particles and raindrops can substantially increase the BCS of aerosols with sizes in the “scavenging gap”. More recent model estimations by Tinsley et al. (1999) indicate that BCS can be increased significantly for aerosols resulted from evaporation of charged cloud drops. Given the complexity of BCS processes, there
15
is no simple general theory to account for all aerosol sizes and for all atmospheric conditions. Particularly, the variability of phoretic forces, electric charge and turbulence tend to affect the BCS of accumulation mode particles and this variability is reflected in the reported experimental and model BCS coefficient values.
While many studies were dedicated to determine the efficiency of collision between
20
raindrops and aerosols of specific particle sizes, there are very few applications of the BCS model to observed ambient aerosol and raindrop size distributions. Earlier calcu-lations by Dana and Hales (1975) indicated that the BCS coefficient for a polydisperse aerosol is generally larger than it would be for a monodisperse aerosol with size equal to some typically used distribution parameter. These studies suggested a need for
25
extensive application of the BCS model to observed atmospheric aerosol size distribu-tions. The purpose of this study is to analyze the dependence of below-cloud aerosol mass scavenging on observed aerosol size distribution characteristics and on rainfall rate. First, we describe the basic concepts used to determine the mass scavenging
co-ACPD
2, 2095–2131, 2002 Below-cloud aerosol removal C. Andronache Title Page Abstract Introduction Conclusions References Tables Figures J I J I Back CloseFull Screen / Esc
Print Version Interactive Discussion
c
EGU 2002
efficient suitable for a mass continuity equation (both for models that describe bin size distribution evolution and for total mass concentration evolution). Then we calculate the mass scavenging coefficient for a variety of aerosol size distributions determined from reported field experimental data with a significant number of samples. Calculations are made for a variety of rainfall rates for cases with coarse mode and for cases dominated
5
by submicron particles. Calculations are compared with experimental results and the implications of BCS on the aerosol 0.5-folding time and on the changes of aerosol size distribution in the BL are discussed.
2. Method
The method used here to evaluate the BCS coefficients is based on the concept of
10
efficiency of collision between an AP and a raindrop (Slinn, 1983; Pruppacher and Klett, 1997; Seinfeld and Pandis, 1998). When a raindrop of diameter Dp falls below the cloud, it creates an airflow with streamlines that deviates from the drop surface. Some of the aerosol particles present in the swept out volume of the raindrop collide with the raindrop and are collected. The total rate of collection of mass of all aerosol
15 particles of diameter dpis nM(dp)d dp Z∞ 0 π 4D 2U t(Dp)E (Dp, dp)nD(Dp)d Dp (1)
where: nM(dp) is the mass size distribution of aerosol, Ut(Dp) is the raindrop termi-nal velocity, nD(Dp) is the raindrop size distribution, and E (Dp, dp) is the collection efficiency, which is assumed to be equal with the collision efficiency (Pruppacher and
20
Klett, 1997). The collection efficiency is defined as the ratio of aerosol mass collected by a drop and the aerosol mass in the swept out volume. The raindrop size distribu-tion is described by an empirical Marshall and Palmer fit, nD(Dp) = ND0exp(−cDp), where ND0 = 8 × 10³m−3mm−1, and c= 4.1R−0.21mm−1, where R is the rainfall rate
ACPD
2, 2095–2131, 2002 Below-cloud aerosol removal C. Andronache Title Page Abstract Introduction Conclusions References Tables Figures J I J I Back CloseFull Screen / Esc
Print Version Interactive Discussion
c
EGU 2002
in mm hr−1 (Marshall and Palmer, 1948). For practical calculations, the raindrop size distribution, nD(Dp) is linked to rainfall rate, R, by
R= π 6
Z∞ 0
D3pUt(Dp)nD(Dp)d Dp (2)
The BCS rate of aerosol of diameter dpcan be written as d nM(dp) d t = −L(dp)nM(dp) (3) 5 L(dp)= Z∞ 0 π 4D 2 pUt(Dp)E (Dp, dp)nD(Dp)d Dp (4)
where L(dp) is the scavenging coefficient of particles of diameter dp.
The raindrop-aerosol collision efficiency E(Dp, dp) has been evaluated both theoret-ically and experimentally in a series of previous papers (as reviewed by Pruppacher and Klett, 1997, Chapter 17). For practical considerations, the available E data are
10
fitted into an expression that covers a wide range of aerosol particle sizes. Based on Slinn (1993) we use the expression of E that is summarized by Seinfeld and Pandis (1998) (Eq. 20.56). Figure 1a illustrates the role of various terms that contribute to the collision efficiency, E, between a raindrop of diameter Dp = 0.1 mm and an aerosol particle of diameter dp: the Brownian diffusion dominates E for particles with
diame-15
ters dp < 0.01 µm, while the interception and impaction become important for larger particles with dp> 1 µm. The effect of raindrop size on the collision efficiency is illus-trated in Fig. 1b. Thus, small aerosol particles are collected more efficient by smaller raindrops than by large raindrops. For coarse aerosol particles, due to important iner-tial term, there are fewer differences in E due to raindrop sizes. The variation of the
20
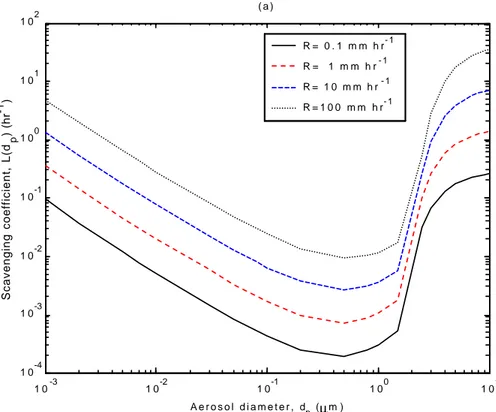
scavenging coefficient of particles of diameter dp, L(dp), given by Eq. (4) is illustrated in Fig. 2a as a function of particle size and rainfall rate, R. For a given aerosol size, we note a variation of about 2 orders of magnitude as R varies between 0.1 and 100
ACPD
2, 2095–2131, 2002 Below-cloud aerosol removal C. Andronache Title Page Abstract Introduction Conclusions References Tables Figures J I J I Back CloseFull Screen / Esc
Print Version Interactive Discussion
c
EGU 2002
mm hr−1, which is a range that covers most of the observed precipitation rates. L(dp) is suitable for description of mass evolution in each bin centered on diameter dp.
The total mass scavenging rate is given by d Ma d t = − Z∞ 0 π 6d 3 pρpL(dp)n(dp)d dp= −LmMa (5)
where, Mais the total aerosol mass concentration, ρpis the aerosol density. The mean
5
mass scavenging coefficient, Lm, is defined by Lm = R∞ 0 d 3 pL(dp)n(dp)d dp R∞ 0 d 3 pn(dp)d dp (6)
where the number size distribution of aerosol, n(dp) is typically represented as a sum of three log-normal modes
n(dp)= 3 X i=1 Ni √ 2πdplog(σi) exp " −log 2 (dp/dgi) 2 log2(σi) # (7) 10
where Ni is the number concentration in the mode i , dgi is the geometric mean diam-eter of the mode i , and σi is the geometric standard deviation of the mode i (generally, from field experiments, i = 1 is the Aitken mode, i = 2 is the accumulation mode and i = 3 is the coarse mode). Figure 2b shows the mean mass scavenging coefficient, Lm, versus the aerosol geometric mean diameter (dg) for several rainfall intensities
(calcu-15
lations are shown for one log-normal mode of aerosol size distribution with σg = 2). This plot illustrates that for a single mode, Lm is dependent on the mean geometric diameter while preserving a similar dependence on R as L(dp). Furthermore, it has been shown that increasing σg, the collision efficiency, E, tends to increase and the “scavenging gap” becomes partially filled (Dana and Hales, 1975; Seinfeld and Pandis,
20
ACPD
2, 2095–2131, 2002 Below-cloud aerosol removal C. Andronache Title Page Abstract Introduction Conclusions References Tables Figures J I J I Back CloseFull Screen / Esc
Print Version Interactive Discussion
c
EGU 2002
3. Results
The model described above is applied to selected available data of aerosol size dis-tributions measured in various environments. It has been recognized that detailed in situ measurements of the full aerosol size spectrum as a function and time and space are still insufficient in order to characterize the variability of aerosol properties on a
5
global scale (Jaenicke, 1993). Furthermore, most of the experimental data of BCS coefficients are limited to laboratory studies and to a subset of aerosol sizes, in the submicron range due to the work related to wet deposition of radionuclides (Sparma-cher et al., 1993). In this work we use detailed size distribution measurements taken over sufficient time intervals in recent field experiments. The results are presented in
10
two parts: (1) calculated BCS coefficients for the full spectrum of aerosol size bution, in cases where three log-normal modes were found to describe the size distri-bution: Aitken, accumulation, and coarse particles; (2) calculated BCS coefficient for measured size distributions with predominant submicron particles.
3.1. Below-cloud scavenging of coarse particles
15
Several cases of aerosol size distribution with coarse mode are used in this section and the log-normal size distribution parameters are summarized in Table 1. Jaenicke (1993) reported aerosol size distributions for several environments: polar, free troposphere, marine, remote continental, desert dust storm, rural, and urban. For each type of aerosol, the size distribution is represented as a sum of three log-normal distributions
20
(Fig. 3a). The calculated mean mass scavenging coefficient Lm is shown in Fig. 3b. For a given aerosol type we note a significant variability of Lm with rainfall rate, R. Also, for a fixed value of R, there is variability in Lm based on aerosol type. The BCS for polydisperse aerosols was noticed in early studies (Dana and Hales, 1975) and the relatively high values of Lm are caused by the presence of coarse mode as will
25
become clear later in this paper. For comparison, we plotted the ICS coefficient based on the method described by Scott (1992). We note that BCS is smaller than the ICS
ACPD
2, 2095–2131, 2002 Below-cloud aerosol removal C. Andronache Title Page Abstract Introduction Conclusions References Tables Figures J I J I Back CloseFull Screen / Esc
Print Version Interactive Discussion
c
EGU 2002
for all conditions considered here. The ICS coefficient is calculated assuming that aerosol particles that enter into cloud are activated as CCN and grow to form a narrow cloud drop size distribution with a typical diameter of ∼ 10 µm. Falling raindrop in cloud collects some of these cloud drops. The physics of collection is similar with the one described above for BCS mechanism but it is dominated by inertial impaction (Scott
5
selected a value E = 0.65 for the collection efficiency between raindrops and cloud drops). Based on these calculations, the aerosol that exhibits coarse mode (where E is high due to interception and impaction terms) will be very efficiently removed by BCS. We further illustrate this aspect using several recent field cases where the coarse mode is important.
10
One instance where coarse mode might be important is the marine boundary layer (MBL) under significant wind conditions near the ocean surface. The ocean is a source of sea salt particles to the atmosphere, and such particles are created during bursting of air bubbles due to breaking waves and spume and splash droplets. These parti-cles are in small number but they can dominate the mass size distribution and can be
15
important in chemical reactions in the marine BL (O’Dowd et al., 1997; Bates et al., 1998). Breaking waves (at wind, w ∼ 3–4 ms−1) produce bubbles that can generate about 10 jet drops with sizes around 1–2 µm up to 10 µm and hundreds of film drops in the submicron range. For w larger than 7–11 ms−1, the tearing of wave crests pro-duces ultra large spume sea-salt particles (O’Dowd et al., 1997). Using a combination
20
of optical particles counters (Particle Measuring Systems ASASP-X, FSSP, and OAP), O’Dowd et al. (1997) compiled a data set of size distribution measurements that cover the range 0.05 to 150 µm radius and wind speeds up to 17 ms−1. The log normal fit for w = 17 ms−1 is shown in Fig. 4a and the calculated Lm is depicted in Fig. 4b. The marine aerosol size distribution from Jaenicke (1993) is shown for comparison.
Gen-25
erally, the data from O’Dowd et al. (1997) shows a coarse mode that is more intense than the one form Jaenicke data. This is due to the intense wind at the surface during the experiment, while the data from Jaenicke (1993) is representative for surface wind in the range 5.5–7.9 ms−1.
ACPD
2, 2095–2131, 2002 Below-cloud aerosol removal C. Andronache Title Page Abstract Introduction Conclusions References Tables Figures J I J I Back CloseFull Screen / Esc
Print Version Interactive Discussion
c
EGU 2002
Similar results are obtained using aerosol size distributions reported by Bates et al. (1998). The measurements of marine aerosol were taken aboard of the NOAA Ship Discoverer during ACE 1 (Intensive 15 November to 14 December 1995) in South Pa-cific (in the region 40–50◦S, 135–155◦E). The number size distribution between 5 and 600 nm was measured with two differential mobility particle sizers (DMPS). The
num-5
ber distribution between 0.6 and 9.6 µm was measured with an aerodynamic particle sizer (APS). The size distribution is shown in Fig. 4c and the corresponding BCS coef-ficient, Lm, in Fig. 4d. Results are compared with data from Jaenicke (1993). We note a smaller coarse mode, due in large to smaller wind speeds, but generally, this set of data is similar with the one recorded by O’Dowd et al. (1997). The results illustrated
10
here suggest that under significant wind near the ocean surface, the BCS is dominated by the removal of coarse sea-salt aerosols.
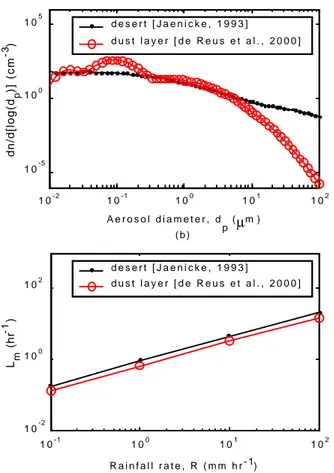
Another example that illustrates the role of coarse particles in BCS is provided by a dust layer measurement over the North Atlantic Ocean during ACE2, near Tenerife, Ca-nary Islands in July 1997 (de Reus et al., 2000). Five instruments were used to derive
15
the aerosol size distribution of particles with diameters ranging from 0.006 to 31 µm in a dust layer sampled between 2.5 and 5.5 km altitude. Results are shown in Fig. 5a for size distribution and Fig. 5b for BCS coefficient for data corresponding to a 2.7 km alti-tude. We note that the measured coarse mode is less intense than the one described by Jaenicke (1993). This can be caused by the fact that data used in our
calcula-20
tion refers to dust measured above the BL while Jaenicke data is more representative for the lower BL. Overall, the results presented for these cases are comparable with calculations based on Jaenicke (1993) data and comparable with ICS coefficient cal-culations, which indicates that marine and dust coarse particles are efficiently removed by BCS.
25
3.2. Below-cloud scavenging of predominantly submicron particles
Many submicron aerosol size distributions were reported for marine and continental locations (Van Dingenen et al., 1995; Covert et al., 1996; Jensen et al., 1996; Raes et
ACPD
2, 2095–2131, 2002 Below-cloud aerosol removal C. Andronache Title Page Abstract Introduction Conclusions References Tables Figures J I J I Back CloseFull Screen / Esc
Print Version Interactive Discussion
c
EGU 2002
al., 1997; Bates et al., 1998; Brechtel et al., 1998; Weingartner et al., 1999). Particu-larly, in marine environment under calm wind conditions, the Aitken and accumulation modes are dominant and significant effort has been dedicated to describe the accu-mulation mode, which is responsible for direct and indirect radiative effects (Charlson et al., 1992; Twomey, 1991; IPCC, 1996). To describe the complete aerosol size
spec-5
trum, the measurements must involve a set of several instruments that simultaneously measure different size ranges. Most of the data used in this section were limited to sub-micron sampling, generally for environmental conditions in which these modes were dominant and the mechanical aerosol production was small (Table 2). These cases are used to illustrate that BCS of submicron particles is generally less efficient, while
10
it can still be an important process for removal of pollution especially for very intense precipitation conditions.
During July 1994, the submicron aerosol size distribution was measured on Tenerife, Canary Islands by Raes et al. (1997). The measurements were taken using a di fferen-tial mobility particle sizer (TSI DMPS model 3932) operating in the size range between
15
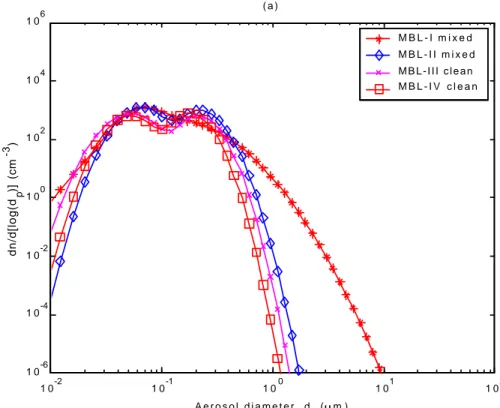
16 and 620 nm. During these measurements in North Atlantic the production of aerosol particles by sea spray was neglected because the average wind speed at Tenerife was about 5 ms−1. Four cases based on average MBL aerosol size distribution properties are shown in our analysis: the mixed cases refer descending air massed from free troposphere (FT) into the MBL. The clean cases refer to aerosol that persisted in the
20
MBL without significant perturbation from the FT or from continental sources (Fig. 6a). For detailed description of conditions that formed these aerosol size distributions see Raes et al. (1997). In this case, the observed aerosol size distribution is dominated by Aitken and accumulation modes. The calculated BCS coefficient Lmis shown in Fig. 6b for two cases and are compared with experimental data of scavenging coefficient for
25
aerosols with diameters dp = 0.23 µm and dp = 2.16 µm based on Sparmacher et al. (1993). We note that Lm for submicron particles from these measurements is in good agreement with measurements for aerosols in comparable size range.
ACPD
2, 2095–2131, 2002 Below-cloud aerosol removal C. Andronache Title Page Abstract Introduction Conclusions References Tables Figures J I J I Back CloseFull Screen / Esc
Print Version Interactive Discussion
c
EGU 2002
to 70◦S for 90 days in 1992 and 1993 (Covert et al., 1996). The number size distribution of the particles was measured with a differential mobility particle sizer (DMPS) cover-ing the range 20 to 600 nm. The cases shown here are representative for observed meteorological, aerosol sources and aging processes (Fig. 7a). Cases 22APR93 and 5DEC93 refer to tropical, bimodal distribution, 7APR93 refers to midlatitude, open
dis-5
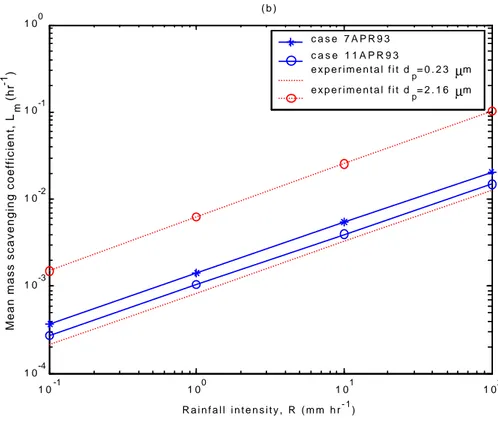
tribution and 11APR93 refers to tropical semi open distribution. For details of the impact of air masses on aerosol size distributions, see Covert et al. (1996). Calculated Lm is shown for cases 7APR 93 and 11APR93 (the other two cases are close to 7APR93) (Fig. 7b). Results are compared with experimental scavenging coefficients for diam-eters dp = 0.23 µm and dp = 2.16 µm based on measurements by Sparmacher et
10
al. (1993). We note that the submicron bimodal distributions are in good agreement with experimental data for the submicron diameter (dp= 0.23 µm).
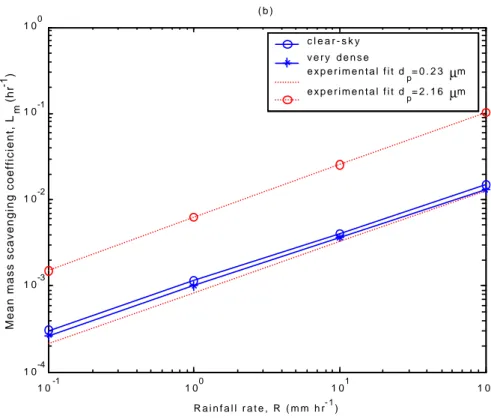
An example of submicron aerosol measured at a continental site is shown here based on measurements of aerosol size distribution at an alpine site (Jungfraujoch; 3580 m asl, Switzerland) from March 1997 to May 1998 (Weingartner et al., 1999).
15
Measurements were taken using a scanning mobility particle sizer (SMPS, TSI 3934), comprising a DMA (TSI 3071) and CNC (TSI 3022), monitoring the size distribution of particles mobility diameters dp= 18–750 nm. The cases are grouped based on the liq-uid water content (LWC) values, as a measure of the cloudiness conditions. Figure 8a shows the measured size distributions. Calculated Lmare shown in Fig. 8b for cases of
20
clear sky and very dense cloudiness and compared with the experimental scavenging coefficients for diameters dp = 0.23 µm and dp = 2.16 µm based on Sparmacher et al. (1993). Note that calculated Lm values compare well with the experimental data for small particles (dp= 0.23 µm).
Similar results are obtained using submicron data from other field experiments (Van
25
Dingenen et al., 1995; Jensen et al., 1996; Brechtel et al., 1998). Calculated Lm for submicron data, particularly for accumulation mode, shows that BCS is not effective, except for very intense rainfall intensities. In contrast, the presence of coarse mode shows that Lm has high values and therefore large particles can be removed fast even
ACPD
2, 2095–2131, 2002 Below-cloud aerosol removal C. Andronache Title Page Abstract Introduction Conclusions References Tables Figures J I J I Back CloseFull Screen / Esc
Print Version Interactive Discussion
c
EGU 2002
for moderate precipitation rates (R ∼ 1 mm hr−1). For a persistent precipitation regime, large particles can be removed shortly after the rain starts and BL remains populated with accumulation particles that are less removed by BCS. However, nucleation scav-enging followed by ICS can be more effective in removal of the particles from this part of the size spectrum. This study shows the importance of BCS for large particles in
5
several cases: windy conditions over MBL when coarse particles dominate the aerosol mass, dust layer events with potential large particles, and possible pollution events with large and fine particles. These cases tend to be more variable and transitory than the accumulation mode.
For a given aerosol distribution case, the BCS coefficient can be expressed as Lm =
10
aRbwhere Lm is in units of hr−1, R is the rainfall rate (in units of mm hr−1) and a and b are coefficients that depend on aerosol characteristics. Table 3 summarizes the results of this work and several reports in recent literature. We note that for cases with coarse particles, a is in the interval [0.24–0.88] and b= 0.7, while for the ICS, a = 1.26 and b = 0.78. For the cases dominated by submicron particles, a is in the interval [0.1– 15
1.13] × 10−3, except for the case of Jylha (1999) who assumed a constant value of E = 0.02 for particles with diameters in the range [0.3–0.9] µm. The values of b are in the interval [0.59–0.94]. We note that generally, the results of this work are comparable with previous calculations for scavenging of large particles and in good agreement with the experimental results of Sparmacher et al. (1993) for submicron particles. Finally,
20
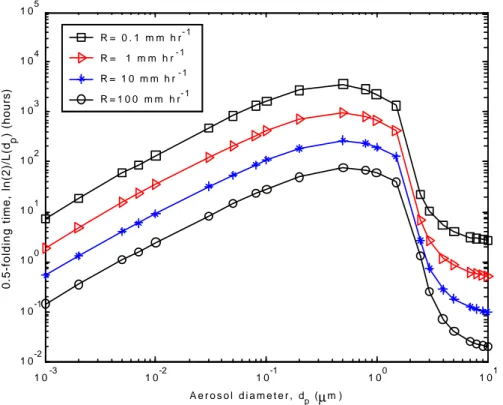
the impact of selective scavenging of various parts of the aerosol spectrum results in a strong dependence of the 0.5-folding time due to BCS, defined as τ= ln(2)/L(dp), on aerosol diameter (Fig. 9). Thus, for R ∼ 1 mm hr−1, τ is of the order of 1 hour for very small and coarse particles and it becomes of the order of days or larger for particles in the accumulation mode. Results suggests that values of Lm calculated using three
25
aerosol modes are appropriate only for short time after beginning of precipitation, and then gradually as the large particles are depleted, Lm tends to values characteristic to accumulation mode.
ACPD
2, 2095–2131, 2002 Below-cloud aerosol removal C. Andronache Title Page Abstract Introduction Conclusions References Tables Figures J I J I Back CloseFull Screen / Esc
Print Version Interactive Discussion
c
EGU 2002
4. Conclusions
We estimated the below-cloud scavenging (BCS) coefficients of aerosols by rainfall for several observed aerosol size distributions reported from field experiments. The method employed is based on explicit calculations of the efficiency of collision between a raindrop and aerosol particles. Results show that BCS coefficient depends mainly on
5
the aerosol size distribution parameters and on rainfall intensity. We found that:
(a) For a given aerosol size, the BCS coefficient varies about two orders of magnitude for a variation of rainfall rate between 0.01 and 100 mm hr−1. For a given rainfall rate, BCS coefficient varies significantly with aerosol diameter.
(b) The BCS is effective for very small particles (with diameters less than 0.01 µm)
10
and for coarse particles (with diameters larger than 2 µm). For these cases, BCS has values comparable with in-cloud scavenging coefficients. For rainfall rate R ∼ 1 mm hr−1, the 0.5-folding time of these particles due to BCS is of the order of one hour. This suggests that for a model description of detailed rapid changes in aerosol size distribution in the BL, it is necessary to use bin defined
15
BCS coefficients, L(dp), and high frequency values of rainfall rate. The presented results show that the BL aerosol size distribution with coarse mode is affected by BCS very shortly after rain starts (in a fraction of one hour). After the removal of very small and coarse particles, the below-cloud aerosol size distribution is dominated by particles in the accumulation mode.
20
(c) For low and moderate rainfall rates (R ∼ 0.1–10 mm hr−1), the BCS is negligible for particles in the range [0.1–1] µm in comparison with in-cloud scavenging . For very intense precipitation (R ∼ 100 mm hr−1), BCS of these particles becomes significant. The results of this work have practical significance for modeling rapid changes of aerosol size distribution in the BL as in the cases of field experiments
25
with continuous high frequency measurements of aerosol size spectrum. Thus, in case of precipitation in the measurement domain, the BCS can contribute
sub-ACPD
2, 2095–2131, 2002 Below-cloud aerosol removal C. Andronache Title Page Abstract Introduction Conclusions References Tables Figures J I J I Back CloseFull Screen / Esc
Print Version Interactive Discussion
c
EGU 2002
stantially to the removal of fine particles (produced by nucleation events, for exam-ple) and coarse particles (such as dust and sea-salt aerosols). Another possible application of this work is in the evaluation and assessment of the efficiency of artificial removal of particles produced during accidental pollution events near the ground. In absence of precipitation, the artificial spraying water drops over the
5
contaminated area can substantially remove particles from the atmosphere and can minimize the amount of material that will be long-range transported by advec-tion.
References
Bates, T. S., Kapustin, V., Quinn, P. K., Covert, D. S., Coffman, D. J., Mari, C., Durkee, P. A., De
10
Bruyn, W. J., and Saltzman, E. S.: Processes controlling the distribution of aerosol particles in the lower marine boundary layer during the First Aerosol Characterization Experiment (ACE1), J. Geophys. Res., 103, D13, 16 369–16 383, 1998.
Brechtel, F. J., Kreidenweis, S. M., and Swan, H. B.: Air mass characteristics, aerosol particle number concentrations, and number size distributions at Maquarie Island during the First
15
Aerosol Characterization Experiment (ACE1), J. Geophys. Res., 103, D13, 16 351–16 367, 1998.
Byrne, M. A. and Jennings, S. G.: Scavenging of sub-micrometer aerosol particles by water drops, Atmos. Environ., 27A, 14, 2099–2105, 1993.
Chang, T. Y.: Estimate of nitrate formation in rain and snow systems, J. Geophys. Res., 91, D2,
20
2805–2818, 1986.
Charlson, R. J., Schwartz, S. E., Hales, J. M., Cess, R. D., Coakley, J. A., Hansen, J. E., and Hofmann, D. J.: Climate forcing by anthropogenic aerosols, Science 255, 423–430, 1992. Covert, D. S., Kapustin, V. N., Bates, T. S., and Quinn, P. K.: Physical properties of marine
boundary layer aerosol particles of the mid-Pacific in relation to sources and meteorological
25
transport, J. Geophys. Res., 101, D3, 6919–6930, 1996.
Dana, M. T. and Hales, J. M.: Statistical aspects of the washout of polydisperse aerosols, Atmos. Environ., 10, 45–50, 1976.
ACPD
2, 2095–2131, 2002 Below-cloud aerosol removal C. Andronache Title Page Abstract Introduction Conclusions References Tables Figures J I J I Back CloseFull Screen / Esc
Print Version Interactive Discussion
c
EGU 2002
observations of dust aerosol over the North Atlantic during ACE2: Indications for heteroge-neous ozone destruction, J. Geophys. Res., 105, D12, 15 263–15 275, 2000.
Flossmann, A. I., Hall, W. D., and Pruppacher, H. R.: A theoretical study of the wet removal of atmospheric pollutants. Part I: The redistribution of aerosol particles captured through nucleation and impaction scavenging by growing cloud drops, J. Atmos. Sci., 42, 4, 583–
5
606, 1985.
Flossmann, A. I., Pruppacher, H. R., and Topalian, J. H.: A theoretical study of the wet removal of atmospheric pollutants. Part II: The uptake and redistribution of (NH4)2SO4 particles and SO2 gas simultaneously scavenged by growing cloud drops, J. Atmos. Sci., 44, 20, 2912– 2923, 1987.
10
Greenfield, S.: Rain scavenging of radioactive particulate matter from the atmosphere, J. Me-teor., 14, 115–125, 1957.
Grover, S. N., Pruppacher, H. R., and Hamielec, A. E.: A numerical determination of the effi-ciency with which spherical aerosol particles collide with spherical water drops due to inertial impaction and phoretic and electric forces, J. Atmos. Sci., 34, 1655–1663, 1977.
15
IPCC: Climate Change 1995: The Science of Climate Change, Cambridge University Press, 572, 1996.
Jaenicke, R.: Tropospheric aerosols, in: Aerosol-cloud-climate interactions, (Ed) Hobbs, P., Academic Press, San Diego, CA, pp. 1–31, 1993.
Jensen, T. L., Kreidenweis, S. M., Kim, Y., Sievering, H., and Pszenny, A.: Aerosol distributions
20
in the North Atlantic marine boundary layer during Atlantic Stratocumulus Transition Experi-ment/Marine Aerosol and Gas Exchange, J. Geophys. Res., 101, D2, 4455–4467, 1996. Junge, C. E.: Air chemistry and radioactivity, Academic Press, New York and London, pp. 382,
1963.
Jylha, K.: Empirical scavenging coefficients of radioactive substances released from Cernobyl,
25
Atmos. Environ., 25A, 263–270, 1991.
Jylha, K.: Relationship between the scavenging coefficient for pollutants in precipitation and the radar reflectivity factor. Part I: Derivation, J. of Applied Met., 38, 1421–1434, 1999. Marshall, J. S. and Palmer, W. M.: The distribution of raindrop with size, J. Meteor., 5, 165–166,
1948.
30
Mircea, M., Stefan, S., and Fuzzi, S.: Precipitation scavenging coefficient: influence of mea-sured aerosol and raindrop size distributions, Atmos. Environ., 34, 5169–5174, 2000. O’Dowd, M., Smith, H. , Consterdine, I. E., and Lowe, J. A.: Marine aerosol, sea-salt, and the
ACPD
2, 2095–2131, 2002 Below-cloud aerosol removal C. Andronache Title Page Abstract Introduction Conclusions References Tables Figures J I J I Back CloseFull Screen / Esc
Print Version Interactive Discussion
c
EGU 2002
marine suphur cycle: a short review, Atmos. Environ., 31, 1, 73–80, 1997.
Okita, T., Hara, H., and Fukuzaki, N.: Measurements of atmospheric SO2and SO4, and de-termination of the wet scavenging of sulfate aerosol for the winter monsoon season over the sea of Japan, Atmos. Environ., 30, 22, 3733–3739, 1996.
Pruppacher H. R. and Klett J. D.: Microphysics of cloud and precipitation, Kluwer Academic
5
Publishers, Dordrecht, Boston, London, pp. 954, 1997.
Radke, L. F., Hobbs, P. V., and Eltgroth, M. W.: Scavenging of aerosol particles by precipitation, J. Atmos. Sci., 19, 715–722, 1980.
Raes, F., Van Dingenen, R., Cuevas, E., Van Velthoven, P. F. J., and Prospero, J. M.: Ob-servations of aerosols in the free troposphere and marine boundary layer of the subtropical
10
Northeast Atlantic: Discussion of processes determining their size distribution, J. Geophys. Res., 102, D17, 21 315–21 328, 1997.
Rasch, P. J., Feichter, J., Law, K., et al.: A comparison of scavenging and deposition processes in global models: results from the WCRP Cambridge Workshop of 1995, Tellus, 52B, 1025– 1056, 2000.
15
Schumann, T.: Aerosol and hydrometeor concentrations and their chemical composition dur-ing winter precipitation along a mountain slope-III. Size-differentiated in-cloud scavenging efficiencies, Atmos. Environ., 25A, 3/4, 809–824, 1991.
Scott, B. C.: Theoretical estimates of the scavenging coefficient for soluble aerosol particles as a function of precipitation type, rate and altitude, Atmos. Environ., 16, 7, 1753–1762, 1982.
20
Seinfeld, J. H. and Pandis, S. N.: Atmospheric Chemistry and Physics, Wiley, New York, pp. 1326, 1998.
Slinn, W. G. N.: Precipitation scavenging, in Atmospheric Sciences and Power Production 1979, Chap 11. Division of Biomedical Environmental Research, U.S. Department of Energy, Washington, D.C., 1983.
25
Slinn, W. G. N. and Hales, J. M.: A reevaluation of the role of thermophoresis as a mechanism of in- and below-cloud scavenging, J. Atmos. Sci., 28, 1465–1471, 1971.
Sparmacher, H., Fulber, K., and Bonka, H.: Below-cloud scavenging of aerosol particles: Particle-bound radionuclide - Experimental, Atmos. Environ., 27A, 4, 605–618, 1993. Ten Brink, H. M., Schwartz, S. E., and Daum, P. H.: Efficient scavenging of aerosol sulfate by
30
liquid-water clouds, Atmos. Environ., 21, 9, 2035–2052, 1987.
Tinsley, B. A., Rohrbaugh, R. P., Hei, M., and Beard, K. V.: Effects of image charges on scav-enging of aerosol particles by cloud droplets and on droplet charging and possible ice
nucle-ACPD
2, 2095–2131, 2002 Below-cloud aerosol removal C. Andronache Title Page Abstract Introduction Conclusions References Tables Figures J I J I Back CloseFull Screen / Esc
Print Version Interactive Discussion
c
EGU 2002
ation processes, J. Atmos. Sci., 57, 2118–2134, 1999.
Twomey, S.: Aerosols, clouds, and radiation, Atmos. Environ., 25A, 2435–2442, 1991.
Van Dingenen, R., Raes, F., and Jensen, N. R.: Evidence for anthropogenic impact on num-ber concentration and sulfate content of cloud-processed aerosol particles over the North Atlantic, J. Geophys. Res., 100, D10, 21 057–21 067, 1995.
5
Wang, P. K. and Pruppacher, H. R.: An experimental determination of the efficiency with which aerosol particles are collected by water drops in subsaturated air, J. Atmos. Sci., 34, 1664– 1669, 1977.
Wang, P. K., Grover, S. N., and Pruppacher, H. R.: On the effect of electric charges on the scavenging of aerosol particles by clouds and small raindrops, J. Atmos. Sci., 35, 1735–
10
1743, 1978.
Weingartner, E., Nyeki, S., and Baltensperger, U.: Seasonal and diurnal variation of aerosol size distributions (10 < dp < 750 nm) at a high-alpine site (Jungfraujoch 3580 m asl), J.
Geophys. Res., 104, D21, 26 809–26 820, 1999.
ACPD
2, 2095–2131, 2002 Below-cloud aerosol removal C. Andronache Title Page Abstract Introduction Conclusions References Tables Figures J I J I Back CloseFull Screen / Esc
Print Version Interactive Discussion
c
EGU 2002
Table 1. Log-normal size distribution parameters for cases with coarse mode
N1 N2 N3 dp1 dp2 dp3 σ1 σ2 σ3 Notes
(cm−3) (cm−3) (cm−3) (µm) (µm) (µm)
3200 2900 0.300 0.020 0.116 1.800 145 1.65 2.39 (a) remote cont.
6650 147 1990 0.015 0.054 0.084 1.67 3.60 1.84 (a) rural
133 66.6 3.1 0.080 0.266 0.580 4.53 1.62 2.48 (a) marine
9900 1110 3640 0.013 0.014 0.050 1.75 4.64 2.17 (a) urban
129 59.7 63.5 0.007 0.250 0.520 4.41 1.79 2.66 (a) free trop.
21.7 0.186 3 × 10⁻⁴ 0.138 0.750 8.600 1.75 1.99 1.95 (a) polar
726 114 0.178 0.002 0.038 21.60 1.76 5.88 2.74 (a) desert
70 3 0.05 0.200 2.000 12.00 1.90 2.00 3.00 (b) marine
210 74 15 0.033 0.110 0.540 1.40 1.41 2.02 (c) marine
33 200 20 0.020 0.090 0.550 1.40 1.60 2.50 (d) dust layer
(a) Compiled size distributions for several aerosol types (Jaenicke, 1993);
(b) Marine aerosol measurements in North East Atlantic MBL under surface wind speed of 17 ms−1(O’Dowd et al., 1997);
(c) Marine aerosol measured in South Pacific MBL during ACE 1 (Bates et al., 1998);
(d) Dust layer sampled at 2.7 km altitude over North Atlantic during ACE 2 (de Reus et al., 2000)
ACPD
2, 2095–2131, 2002 Below-cloud aerosol removal C. Andronache Title Page Abstract Introduction Conclusions References Tables Figures J I J I Back CloseFull Screen / Esc
Print Version Interactive Discussion
c
EGU 2002
Table 2. Log-normal size distribution parameters for selected cases of submicron aerosol measurements
N1 N2 dp1 dp2 σ1 σ2 Notes
(cm−3) (cm−3) (µm) (µm)
319 349 0.066 0.120 1.38 2.00 (a) MBL-I mixed
447 325 0.065 0.217 1.41 1.38 (a) MBL-II mixed
321 207 0.052 0.209 1.47 1.35 (a) MBL-III clean
228 249 0.052 0.178 1.40 1.34 (a) MBL-IV clean
140 120 0.065 0.220 1.47 1.31 (b) 22APR93 280 187 0.055 0.185 1.35 1.42 (b) 5DEC93 1640 40 0.012 0.140 1.72 1.36 (b) 7APR93 285 80 0.030 0.165 1.47 1.33 (b) 11APR93 370 215 0.032 0.120 2.07 1.83 (c) clear sky 518 274 0.042 0.152 1.94 1.65 (c) light 454 303 0.038 0.134 1.72 1.69 (c) moderate 413 259 0.040 0.137 1.68 1.70 (c) dense 312 318 0.042 0.125 1.54 1.77 (c) very dense
(a) Marine aerosol measured in North Atlantic MBL (mixed refers to MBL air mixed with FT air, and clean refers to air that stayed predominantly in the MBL without contamination from FT or continental air) (Raes et al., 1997);
(b) Cases of marine aerosol measured in mid-Pacific MBL (Covert et al., 1996);
(c) Alpine aerosol measured at Jungfraujoch, Switzerland under various cloudiness conditions (Weingartner et al., 1999).
ACPD
2, 2095–2131, 2002 Below-cloud aerosol removal C. Andronache Title Page Abstract Introduction Conclusions References Tables Figures J I J I Back CloseFull Screen / Esc
Print Version Interactive Discussion
c
EGU 2002
Table 3. Summary of below-cloud scavenging coefficient (in units of hr−1) expressed as aRb (where the rainfall rate R is in units of mm hr−1)
a b Reference Note
Cases with coarse aerosol mode
0.24 0.70 This work (a) Urban
0.46 0.70 ” (a) Remote cont.
0.50 0.70 ” (a) Marine
0.45 0.70 ” (a) Rural
0.68 0.70 ” (a) Free trop.
0.34 0.70 ” (a) Polar
0.88 0.70 ” (a) Desert
0.80 0.70 ” (b) Marine
0.30 0.70 ” (c) Marine
0.70 0.70 ” (d) Dust layer
0.36 0.67–0.76 Okita et al. (1996) (e)
1.26 0.78 Scott (1982) (f)
Cases with predominant submicron particles
0.84 × 10⁻³ 0.59 Sparmacher et al. (1993) (g) (dp= 0.23 µm)
1.13 × 10⁻³ 0.60 Sparmacher et al. (1993) (g) (dp= 0.46 µm)
0.92 × 10⁻³ 0.94 Sparmacher et al. (1993) (g) (dp= 0.98 µm)
0.62 × 10⁻³ 0.61 Sparmacher et al. (1993) (g) (dp= 2.16 µm)
2.50 × 10⁻² 0.92 Jylha (1999) (h) Radionuclides
0.85–5.00 × 10⁻³ 0.59–0.61 This work (i) Marine
0.10–0.14 × 10⁻³ 0.59 ” (j) Marine
0.86 × 10⁻³ 0.59 ” (k) Alpine
ACPD
2, 2095–2131, 2002 Below-cloud aerosol removal C. Andronache Title Page Abstract Introduction Conclusions References Tables Figures J I J I Back CloseFull Screen / Esc
Print Version Interactive Discussion
c
EGU 2002
Table 3. Continued ...
(a) Calculations are based on the aerosol types by Jaenicke (1993); (b) Calculations are for marine aerosol data based on O’Dowd et al. (1997); (c) Calculations are for marine aerosol data from Bates et al. (1998); (d) Calculations are for the dust layer aerosol data from de Reus et al. (2000); (e) Experimental estimation for total wet scavenging by Okita et al. (1996); (f) Model calculated in-cloud scavenging coefficient for aerosol particles grown at the size of cloud droplet with dp= 10 µm particle (see text for details); (g) Experimental values by Sparmacher
et al. (1993) for four diameters of aerosol particle collected by rain; (h) Model calculated values for particles with diameters in the range [0.3–0.9] µm and assumed E = 0.02 (Jylha, 1999); (i) Calculations based on submicron marine aerosol from Raes et al. (1993); Calculations based on submicron marine aerosol from Covert et al. (1996); Calculations based on alpine submicron aerosol from Weingartner et al. (1999).
ACPD
2, 2095–2131, 2002 Below-cloud aerosol removal C. Andronache Title Page Abstract Introduction Conclusions References Tables Figures J I J I Back CloseFull Screen / Esc
Print Version Interactive Discussion c EGU 2002 1 0-3 1 0-2 1 0-1 1 00 1 01 1 0-4 1 0-3 1 0-2 1 0-1 1 00 1 01 A e r o s o l d i a m e t e r , d p (µm )
Collision efficiency, E(D
p ,d p ) ( a ) T o t a l B r o w n i a n I n t e r c e p t i o n I m p a c t i o n
Figure 1. (a) Contributions to the collision efficiency, E, between a raindrop of diameter
D
p=0.1 mm and an aerosol particle of diameter d
p: Total (black solid line), Brownian (red
solid line with dots), Interception (blue dashed line), and Impaction (red dotted line).
Fig. 1.a. Contributions to the collision efficiency, E, between a raindrop of diameter Dp = 0.1mm and an aerosol particle of diameter dp: Total (black solid line), Brownian (red solid line with
ACPD
2, 2095–2131, 2002 Below-cloud aerosol removal C. Andronache Title Page Abstract Introduction Conclusions References Tables Figures J I J I Back CloseFull Screen / Esc
Print Version Interactive Discussion c EGU 2002 1 0-3 1 0-2 1 0-1 1 00 1 01 1 0-4 1 0-3 1 0-2 1 0-1 1 00 1 01 A e r o s o l d i a m e t e r , d p (µm )
Collision efficiency, E(D
p ,d p ) ( b ) D p= 0 . 1 m m D p= 0 . 5 m m D p= 1 m m D p= 2 m m
Figure 1. ( b) Collision efficiency versus aerosol diameter for several raindrop diameters.
Fig. 1b. Collision efficiency versus aerosol diameter for several raindrop diameters.ACPD
2, 2095–2131, 2002 Below-cloud aerosol removal C. Andronache Title Page Abstract Introduction Conclusions References Tables Figures J I J I Back CloseFull Screen / Esc
Print Version Interactive Discussion c EGU 2002
1 0-3 1 0-2 1 0-1 1 00 1 01 1 0-4 1 0-3 1 0-2 1 0-1 1 00 1 01 1 02 A e r o s o l d i a m e t e r , d p (µm ) Scavenging coefficient, L(d p ) (hr -1 ) ( a ) R = 0 . 1 m m h r- 1 R = 1 m m h r- 1 R = 1 0 m m h r- 1 R = 1 0 0 m m h r- 1
Figure 2. (a) Mass scavenging coefficient L(d
p) for aerosol of diameter d
pscavenged by
precipitation with a rainfall rate R.
Fig. 2a. Mass scavenging coefficient L(dp) for aerosol of diameter dpscavenged by
ACPD
2, 2095–2131, 2002 Below-cloud aerosol removal C. Andronache Title Page Abstract Introduction Conclusions References Tables Figures J I J I Back CloseFull Screen / Esc
Print Version Interactive Discussion c EGU 2002 1 0-3 1 0-2 1 0-1 1 00 1 01 1 0-4 1 0-3 1 0-2 1 0-1 1 00 1 01 1 02 A e r o s o l m e a n g e o m e t r i c d i a m e t e r , d g (µm )
Mean mass scavenging coefficient, L
m (hr -1 ) ( b ) R = 0 . 1 m m h r- 1 R = 1 m m h r- 1 R = 1 0 m m h r- 1 R = 1 0 0 m m h r- 1
Figure 2. (b) mean mass scavenging coefficient, L
m, versus the aerosol geometric mean
diameter (d
g) for several rainfall intensities. (Calculations are for one log- normal mode of
aerosol size distribution with
σ
g=2).
Fig. 2b. Mean mass scavenging coefficient, Lm, versus the aerosol geometric mean diameter
(dg) for several rainfall intensities. (Calculations are for one log-normal mode of aerosol size
ACPD
2, 2095–2131, 2002 Below-cloud aerosol removal C. Andronache Title Page Abstract Introduction Conclusions References Tables Figures J I J I Back CloseFull Screen / Esc
Print Version Interactive Discussion c EGU 2002 1 0-2 1 0-1 1 00 1 01 1 02 1 0-6 1 0-4 1 0-2 1 00 1 02 1 04 1 06 A e r o s o l d i a m e t e r , d p (µm ) dn/d[log(d p )] (cm -3 ) ( a ) r e m o t e c o n t . r u r a l m a r i n e u r b a n f r e e t r o p . p o l a r d e s e r t
Figure 3. (a) Log- normal aerosol size distribution for several aerosol types: remote
continental, rural, marine, urban, free troposphere, polar and desert, as compiled from
observations (Jaenicke, 1993).
Fig. 3a. Log-normal aerosol size distribution for several aerosol types: remote continen-tal, rural, marine, urban, free troposphere, polar and desert, as compiled from observations (Jaenicke, 1993).
ACPD
2, 2095–2131, 2002 Below-cloud aerosol removal C. Andronache Title Page Abstract Introduction Conclusions References Tables Figures J I J I Back CloseFull Screen / Esc
Print Version Interactive Discussion c EGU 2002 1 0-1 1 00 1 01 1 02 1 0-2 1 0-1 1 00 1 01 1 02 R a i n f a l l r a t e , R ( m m h r- 1)
Mean mass scavenging coefficient, L
m (hr -1 ) ( b ) [ S c o t t , 1 9 8 2 ] r e m o t e c o n t . r u r a l m a r i n e u r b a n f r e e t r o p . p o l a r d e s e r t
Figure 3. (b) Calculated mean mass scavenging coefficient, L
m, for these aerosol types
versus rainfall rate, R. The solid black line represents the calculated ICS coefficient based
on the method described by Scott (1982) (see text for details).
Fig. 3b. Calculated mean mass scavenging coefficient, Lm, for these aerosol types versus
rainfall rate, R. The solid black line represents the calculated ICS coefficient based on the method described by Scott (1982) (see text for details).
ACPD
2, 2095–2131, 2002 Below-cloud aerosol removal C. Andronache Title Page Abstract Introduction Conclusions References Tables Figures J I J I Back CloseFull Screen / Esc
Print Version Interactive Discussion c EGU 2002 1 0-2 1 0-1 1 00 1 01 1 02 1 0-5 1 00 1 05 dn/d[log(d p )] (cm -3 ) ( a ) [ J a e n i c k e , 1 9 9 3 ] [ O ` D o w d e t a l . , 1 9 9 7 ] 1 0-1 1 00 1 01 1 02 1 0-2 1 0-1 1 00 1 01 1 02 L m (hr -1 ) ( b ) [ J a e n i c k e , 1 9 9 3 ] [ O ` D o w d e t a l . , 1 9 9 7 ] 1 0-2 1 0-1 1 00 1 01 1 02 1 0-5 1 00 1 05 A e r o s o l d i a m e t e r , d p (µm ) dn/d[log(d p )] (cm -3 ) ( c ) [ J a e n i c k e , 1 9 9 3 ] [ B a t e s e t a l . , 1 9 9 8 ] 1 0-1 1 00 1 01 1 02 1 0-2 1 0-1 1 00 1 01 1 02 R a i n f a l l r a t e , R ( m m h r- 1) L m (hr -1 ) ( d ) [ J a e n i c k e , 1 9 9 3 ] [ B a t e s e t a l . , 1 9 9 8 ]
Figure 4. (a) Marine aerosol size distribution measured in Northeast Atlantic (O’Dowd et al., 1997), (b) the corresponding mean mass scavenging coefficient; (c) Marine aerosol size distribution measured in South Pacific (Bates et al., 1998) and (d) the corresponding mean mass scavenging coefficient. In all figures, the black curves refer to the marine aerosol from Jaenicke (1993) data, shown for comparison.
Fig. 4. (a) Marine aerosol size distribution measured in Northeast Atlantic (O’Dowd et al., 1997),(b) the corresponding mean mass scavenging coefficient; (c) Marine aerosol size dis-tribution measured in South Pacific (Bates et al., 1998) and(d) the corresponding mean mass scavenging coefficient. In all figures, the black curves refer to the marine aerosol from Jaenicke (1993) data, shown for comparison.
ACPD
2, 2095–2131, 2002 Below-cloud aerosol removal C. Andronache Title Page Abstract Introduction Conclusions References Tables Figures J I J I Back CloseFull Screen / Esc
Print Version Interactive Discussion c EGU 2002 1 0-2 1 0-1 1 00 1 01 1 02 1 0-5 1 00 1 05 A e r o s o l d i a m e t e r , d p (µm ) dn/d[log(d p )] (cm -3 ) ( a ) d e s e r t [ J a e n i c k e , 1 9 9 3 ] d u s t l a y e r [ d e R e u s e t a l . , 2 0 0 0 ] 1 0-1 1 00 1 01 1 02 1 0-2 1 00 1 02 R a i n f a l l r a t e , R ( m m h r - 1) L m (hr -1 ) ( b ) d e s e r t [ J a e n i c k e , 1 9 9 3 ] d u s t l a y e r [ d e R e u s e t a l . , 2 0 0 0 ]
Figure 5. (a) Aerosol size distribution of a dust layer measured over the North Atlantic
Ocean on July 8, 1997 during ACE 2 (de Reus et al., 2000), (b) the corresponding
calculated mean mass scavenging coefficient, L
m. The solid lines correspond to the desert
aerosol type from Jaenicke (1993) shown for comparison.
Fig. 5. (a) Aerosol size distribution of a dust layer measured over the North Atlantic Ocean on 8 July 1997 during ACE 2 (de Reus et al., 2000),(b) the corresponding calculated mean mass scavenging coefficient, Lm. The solid lines correspond to the desert aerosol type from Jaenicke
(1993) shown for comparison.
ACPD
2, 2095–2131, 2002 Below-cloud aerosol removal C. Andronache Title Page Abstract Introduction Conclusions References Tables Figures J I J I Back CloseFull Screen / Esc
Print Version Interactive Discussion c EGU 2002 1 0-2 1 0-1 1 00 1 01 1 02 1 0-6 1 0-4 1 0-2 1 00 1 02 1 04 1 06 A e r o s o l d i a m e t e r , d p (µm ) dn/d[log(d p )] (cm -3 ) ( a ) M B L - I m i x e d M B L - I I m i x e d M B L - I I I c l e a n M B L - I V c l e a n
Figure 6. (a) Marine boundary layer aerosol size distribution observed in North Atlantic
during July, 1994 at Tenerife, Canary Islands (Raes et al., 1997) (mixed cases refer to
MBL aerosol mixed with FT aerosol; clean cases refer to aerosol that stayed
predominantly in the MBL unperturbed by FT or continental sources.
Fig. 6a. Marine boundary layer aerosol size distribution observed in North Atlantic during July, 1994 at Tenerife, Canary Islands (Raes et al., 1997) (mixed cases refer to MBL aerosol mixed with FT aerosol; clean cases refer to aerosol that stayed predominantly in the MBL unperturbed by FT or continental sources.ACPD
2, 2095–2131, 2002 Below-cloud aerosol removal C. Andronache Title Page Abstract Introduction Conclusions References Tables Figures J I J I Back CloseFull Screen / Esc
Print Version Interactive Discussion c EGU 2002 1 0-1 1 00 1 01 1 02 1 0-4 1 0-3 1 0-2 1 0-1 1 00 R a i n f a l l i n t e n s i t y , R ( m m h r- 1)
Mean mass scavenging coefficient, L
m (hr -1 ) ( b ) M B L - I m i x e d M B L - I V c l e a n e x p e r i m e n t a l f i t d p= 0 . 2 3 µm e x p e r i m e n t a l f i t d p= 2 . 1 6 µm
Figure 6. (b) corresponding mean mass scavenging coefficient, L
mfor a mixed and a
clean case. The dotted lines are experimental values of L
mfor particles with diameters
d
p=0.23
µ
m (red dotted line) and d
p=2.16
µ
m (red dotted line with circle) (Sparmacher et
al., 1993).
Fig. 6b. Corresponding mean mass scavenging coefficient, Lmfor a mixed and a clean case.
The dotted lines are experimental values of Lmfor particles with diameters dp= 0.23 µm (red
ACPD
2, 2095–2131, 2002 Below-cloud aerosol removal C. Andronache Title Page Abstract Introduction Conclusions References Tables Figures J I J I Back CloseFull Screen / Esc
Print Version Interactive Discussion c EGU 2002 1 0-2 1 0-1 1 00 1 01 1 02 1 0-6 1 0-4 1 0-2 1 00 1 02 1 04 1 06 A e r o s o l d i a m e t e r , d p (µm ) dn/d[log(d p )] (cm -3 ) ( a ) c a s e 2 2 A P R 9 3 c a s e 5 D E C 9 3 c a s e 7 A P R 9 3 c a s e 1 1 A P R 9 3
Figure 7. (a) Several cases of marine boundary layer aerosol size distribution observed in
mid-Pacific during 1992 and 1993 (Covert et al., 1996).
Fig. 7a. Several cases of marine boundary layer aerosol size distribution observed in mid-Pacific during 1992 and 1993 (Covert et al., 1996)
ACPD
2, 2095–2131, 2002 Below-cloud aerosol removal C. Andronache Title Page Abstract Introduction Conclusions References Tables Figures J I J I Back CloseFull Screen / Esc
Print Version Interactive Discussion c EGU 2002 1 0-1 1 00 1 01 1 02 1 0-4 1 0-3 1 0-2 1 0-1 1 00 R a i n f a l l i n t e n s i t y , R ( m m h r- 1)
Mean mass scavenging coefficient, L
m (hr -1 ) ( b ) c a s e 7 A P R 9 3 c a s e 1 1 A P R 9 3 e x p e r i m e n t a l f i t d p= 0 . 2 3 µm e x p e r i m e n t a l f i t d p= 2 . 1 6 µm
Figure 7. (b) corresponding mean mass scavenging coefficient, L
mfor two typical cases.
The dotted lines are experimental values of L
mfor particles with diameters d
p=0.23
µ
m
(red dotted line) and d
p=2.16
µ
m (red dotted line with circle) (Sparmacher et al., 1993).
Fig. 7b. Corresponding mean mass scavenging coefficient, Lm for two typical cases. The
dotted lines are experimental values of Lm for particles with diameters dp = 0.23 µm (red
ACPD
2, 2095–2131, 2002 Below-cloud aerosol removal C. Andronache Title Page Abstract Introduction Conclusions References Tables Figures J I J I Back CloseFull Screen / Esc
Print Version Interactive Discussion c EGU 2002 1 0-2 1 0-1 1 00 1 01 1 02 1 0-6 1 0-4 1 0-2 1 00 1 02 1 04 1 06 A e r o s o l d i a m e t e r , d p (µm ) dn/d[log(d p )] (cm -3 ) ( a ) c l e a r s k y l i g h t m o d e r a t e d e n s e d e n s e v e r y d e n s e
Figure 8. (a) Alpine aerosol measurements during 1997-1998 at Jungfraujoch (3500 m
asl) Switzerland for different cloudiness conditions (Weingartner et al., 1999).
Fig. 8a. Alpine aerosol measurements during 1997–1998 at Jungfraujoch (3500 m asl) Switzer-land for different cloudiness conditions (Weingartner et al., 1999).
ACPD
2, 2095–2131, 2002 Below-cloud aerosol removal C. Andronache Title Page Abstract Introduction Conclusions References Tables Figures J I J I Back CloseFull Screen / Esc
Print Version Interactive Discussion c EGU 2002 1 0-1 1 00 1 01 1 02 1 0-4 1 0-3 1 0-2 1 0-1 1 00 R a i n f a l l r a t e , R ( m m h r- 1)
Mean mass scavenging coefficient, L
m (hr -1 ) ( b ) c l e a r - s k y v e r y d e n s e e x p e r i m e n t a l f i t d p= 0 . 2 3 µm e x p e r i m e n t a l f i t d p= 2 . 1 6 µm
Figure 8. (b) corresponding mean mass scavenging coefficient, L
mfor two typical cases.
The dotted lines are experimental values of L
mfor particles with diameters d
p=0.23
µ
m
(red dotted line) and d
p=2.16
µ
m (red dotted line with circle) (Sparmacher et al., 1993).
Fig. 8b. Corresponding mean mass scavenging coefficient, Lm for two typical cases. The
dotted lines are experimental values of Lm for particles with diameters dp = 0.23 µm (red
ACPD
2, 2095–2131, 2002 Below-cloud aerosol removal C. Andronache Title Page Abstract Introduction Conclusions References Tables Figures J I J I Back CloseFull Screen / Esc
Print Version Interactive Discussion c EGU 2002 1 0-3 1 0-2 1 0-1 1 00 1 01 1 0-2 1 0-1 1 00 1 01 1 02 1 03 1 04 1 05 A e r o s o l d i a m e t e r , d p (µm ) 0.5-folding time, ln(2)/L(d p ) (hours) R = 0 . 1 m m h r- 1 R = 1 m m h r- 1 R = 1 0 m m h r- 1 R = 1 0 0 m m h r- 1
Figure 9. Aerosol 0.5- folding time due to below-cloud scavenging process only, versus
aerosol particle diameter.
Fig. 9. Aerosol 0.5-folding time due to below-cloud scavenging process only, versus aerosol particle diameter.