HAL Id: hal-00295267
https://hal.archives-ouvertes.fr/hal-00295267
Submitted on 5 Jun 2003
HAL is a multi-disciplinary open access
archive for the deposit and dissemination of
sci-entific research documents, whether they are
pub-lished or not. The documents may come from
teaching and research institutions in France or
abroad, or from public or private research centers.
L’archive ouverte pluridisciplinaire HAL, est
destinée au dépôt et à la diffusion de documents
scientifiques de niveau recherche, publiés ou non,
émanant des établissements d’enseignement et de
recherche français ou étrangers, des laboratoires
publics ou privés.
MINOS: Measurements and relationship with ozone
photolysis
H. Berresheim, C. Plass-Dülmer, T. Elste, N. Mihalopoulos, F. Rohrer
To cite this version:
H. Berresheim, C. Plass-Dülmer, T. Elste, N. Mihalopoulos, F. Rohrer. OH in the coastal boundary
layer of Crete during MINOS: Measurements and relationship with ozone photolysis. Atmospheric
Chemistry and Physics, European Geosciences Union, 2003, 3 (3), pp.639-649. �hal-00295267�
www.atmos-chem-phys.org/acp/3/639/
Atmospheric
Chemistry
and Physics
OH in the coastal boundary layer of Crete during MINOS:
Measurements and relationship with ozone photolysis
H. Berresheim1, C. Plass-D ¨ulmer1, T. Elste1, N. Mihalopoulos2, and F. Rohrer3
1German Weather Service, Meteorological Observatory Hohenpeissenberg, Albin-Schwaiger-Weg 10, D-82383
Hohenpeissenberg, Germany
2University of Crete, Environmental Chemical Processes Laboratory, Heraklion, Greece
3Research Center J¨ulich, Institute for Chemistry and Dynamics of the Geosphere II, J¨ulich, Germany
Received: 4 February 2003 – Published in Atmos. Chem. Phys. Discuss.: 27 February 2003 Revised: 27 May 2003 – Accepted: 27 May 2003 – Published: 5 June 2003
Abstract. Hydroxyl radical (OH) concentrations were
mea-sured in August 2001 at Finokalia Station on the northeast-ern coast of Crete during the Mediterranean Intensive Oxi-dant Study (MINOS). OH was measured based on selected ion chemical ionization mass spectrometry (SI/CIMS) with a time resolution of 30 sec and signal integration of 5 min. The corresponding accuracy, precision, and detection limit were 20% (1σ ), 11% (1σ ), and 2.4 × 10⁵molecules cm−3(2σ ), respectively. OH levels showed a strong diurnal variability with high maxima (approximately 2 × 10⁷molecules cm−3) occurring around 13:30 LT (10:30 UTC) and nighttime val-ues below the detection limit. Daily 24-hour average concen-trations varied between 3.6–6.7 × 106cm−3. For the total measurement period (6–21 August) the mean and standard deviation were 4.5 ± 1.1 × 106cm−3. The OH data set is
analyzed based on a classification into three periods: I: Aug 6–8, II: Aug 9–11, III: Aug 13–18. For each of the three pe-riods the measured OH concentrations are described by the empirical function [OH] = a J(O1D)b, with J(O1D) being the ozone photolysis frequency and a = 1.4 × 10¹⁰s cm−3, 1.7 × 10¹⁰s cm−3, 2.2 × 10¹⁰s cm−3, and b = 0.68, respectively. Taking into account the estimated precision of the OH mea-surements this empirical function using three values for a and one value for b explains 99% of the observed variance of OH. A detailed sensitivity analysis using a CH4−CO box
model was performed to interpret this relationship, in par-ticular the meanings of the pre-exponential factor a and the exponent b. It was found that the value of b which represents the total logarithmic dependence of [OH] on J(O1D) includes
the individual contributions from the photolysis of O3, NO2,
HCHO, HONO, and H2O2which could be determined using
the box model. For the conditions prevailing during the MI-NOS campaign the exponent b was found to be dominated by the contributions from O3- and NO2-photolysis. For the
in-Correspondence to: H. Berresheim
(Harald.Berresheim@dwd.de)
dividual functional dependences between [OH] and J(O1D), [OH] and J(NO2), and J(NO2) and J(O1D) the partial
loga-rithmic derivatives were determined to be 0.5, 0.6, and 0.3, respectively. Overall, the box model yields a value of 0.70 for the exponent b in very good agreement with the correspond-ing value derived from the empirical analysis of the mea-surements. This empirical approach in which the chemical air mass characteristics influencing the OH radical balance and thereby, the self-cleansing efficiency of the atmosphere, are represented by only two parameters which are constant over quite substantial time periods may be used in future ex-periments to test and compare OH measurements made in different atmospheric environments.
1 Introduction
One of the major goals of the Mediterranean Intensive Ox-idant Study (MINOS) was to investigate the effect of an-thropogenic air pollution on the budgets of atmospheric oxi-dants (e.g., ozone) over the Mediterranean region (Lelieveld et al., 2002a). The concentration of the most reactive oxi-dant species in the troposphere, the hydroxyl radical (OH), depends strongly on the ambient levels of ozone and water vapour and on solar irradiance. In the remote atmosphere OH is primarily produced via ozone photolysis at wavelengths less than about 330 nm (Matsumi et al., 2002) followed by reaction of the electronically excited O(1D) atom with water vapour:
O3+hν −→ O(1D) + O2 (R1)
O(1D) + M −→ O(3P) + M (M = N2,O2) (R2)
From the above reaction scheme a primary OH production rate, P(OH), can be derived:
P(OH) = 2J(O
1D)[O
3]kH2O[H2O]
kO2[O2] +kN2[N2] +kH2O[H2O]
(E1) where J(O1D) is the ozone photolysis frequency, and kO2,
kN2, and kH2Oare the rate coefficients for reactions (R2) and (R3), respectively. The average tropospheric lifetime of OH is less than 1 second due to its relatively fast reactions with a large number of both anthropogenic and natural compounds. Major sinks for OH are the reactions with CO, CH4, and
non-methane hydrocarbons (NMHCs) in which peroxy radicals (HO2, RO2; R = organic rest) are produced as intermediate
products. In addition, HO2 is also produced from the
pho-tolysis of formaldehyde, HCHO. In turn, these peroxy radi-cals can be involved in further reactions leading back to OH (secondary OH source), i.e., OH can be recycled via HO2by
reaction with NO or O3:
NO + HO2−→NO2+OH (R4)
O3+HO2−→2O2+OH (R5)
Important loss processes for the sum of OH and HO2radicals
(denoted here as HOx) are:
NO2+OH + M −→ HNO3+M (M = N2,O2) (R6)
and radical self-reactions
OH + HO2−→H2O + O2 (R7)
HO2+HO2−→H2O2+O2 (R8)
HO2+RO2−→ROOH + O2 (R9)
Among these loss reactions (R7-9) dominate in relatively clean NOx-poor environments such as the remote marine
at-mosphere (NOx=NO + NO2), whereas reaction (R6)
dom-inates in relatively polluted air (e.g., Platt et al., 2002; Lelieveld et al., 2002b).
As part of the MINOS experiment daily measurements of ambient OH concentrations were conducted during 6–22 Au-gust 2001, at the ground level station Finokalia on the north-eastern coast of Crete. Specific objectives of these measure-ments were: (1) to study the atmospheric oxidation efficiency and production of OH in the Mediterranean boundary layer, and (2) to provide a data base of diurnally measured OH pro-files for detailed modelling of the local and regional photo-chemistry. In the present work, we first discuss experimental details and the results and uncertainties of the OH measure-ments. Next, the corresponding O3, CO, meteorological and
photolysis frequency data are used to distinguish three peri-ods within the OH data set. In the final part, the variance in the OH data is analyzed for each of these periods by both an empirical function and a box model approach. The paper
concludes with a quantitative assessment of individual con-tributions to the observed OH variance and their relationship with ozone photolysis. For a comprehensive and detailed photochemical model analysis of the OH data the reader is referred to the companion paper by Baboukas et al. (2003).
2 Experimental
2.1 OH measurements
Atmospheric OH concentrations were measured by selected ion/chemical ionization mass spectrometry (SI/CIMS) pre-viously developed by Eisele and coworkers (Tanner et al., 1997; Eisele and Tanner, 1991). During the MINOS cam-paign the system was installed in a mobile field laboratory (container) at Finokalia station (35◦19’ N, 25◦40’ E) on the northeastern coast of Crete. The container was deployed on a plateau near the edge of a cliff approximately 100 m above the coastline and some 20 m vertical distance below and to the west of the summit laboratory operated by the University of Crete (ECPL). The Finokalia site is located about 80 km east of Heraklion and at least 20 km away from major road traffic and small cities further south. The surrounding veg-etation is sparse and consists mainly of some herbs and low bushes. OH was measured continuously between 6–22 Au-gust 2001. In addition, ambient concentrations of H2SO4and
gaseous methane sulfonic acid (MSA) were measured. For the results and interpretation of the sulfur measurements see Bardouki et al. (2003) and Kanakidou et al. (2003). Short interruptions of the measurements occurred due to mainte-nance or power outage problems. The SI/CIMS system of Deutscher Wetterdienst (DWD; German Weather Service) has been described in detail by Berresheim et al. (2000). A brief outline of the measurement technique and of the sys-tem’s performance during MINOS is given here.
Ambient air is sampled at approximately 10 l min−1into the ion reaction region of the system where neutral sam-ple molecules such as H2SO4 are ionized at atmospheric
pressure by charge transfer reactions with NO−3 core ions. The NO−3 ions are produced in a separate sheath gas by a radioactive 241Am source and are subsequently focussed by electrical fields to the sample flow axis. H2SO4 and
MSA molecules directly react with NO−3 yielding the
cor-responding HSO−4 and MSA− product ions. To measure
OH, excess 34SO2 is added to the sample flow before the
ionization region. The SO2completely titrates the sampled
OH within approximately 20 ms producing heavy isotope H342 SO4 molecules which in turn react with NO−3 to
pro-duce H34SO−4 product ions. These differ from the H32SO−4 ions derived from ambient H2SO4by two mass units. The
OH background signal is produced by adding high purity propane to the sample air/SO2 mixture such that all OH is
now scavenged by reaction with propane instead of SO2. A
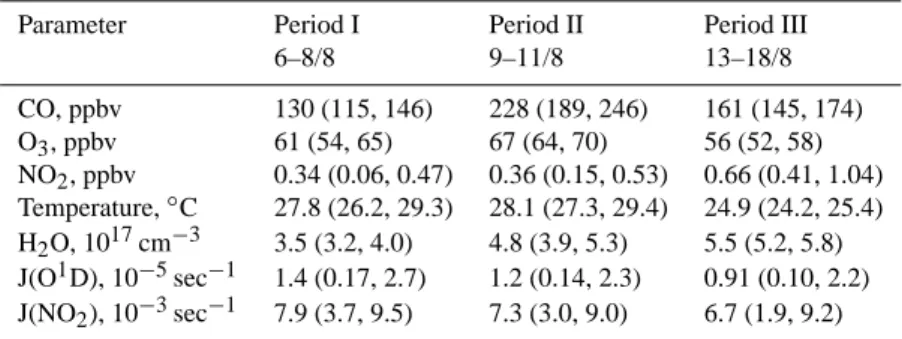
Table 1. Median daytime (03:50–16:50 UTC) levels of atmospheric trace gases and meteorological parameters measured during MINOS.
The data are classified into three periods as defined in the text. Numbers in parentheses show corresponding 18- and 82-percentile values
Parameter Period I Period II Period III
6–8/8 9–11/8 13–18/8 CO, ppbv 130 (115, 146) 228 (189, 246) 161 (145, 174) O3, ppbv 61 (54, 65) 67 (64, 70) 56 (52, 58) NO2, ppbv 0.34 (0.06, 0.47) 0.36 (0.15, 0.53) 0.66 (0.41, 1.04) Temperature,◦C 27.8 (26.2, 29.3) 28.1 (27.3, 29.4) 24.9 (24.2, 25.4) H2O, 1017cm−3 3.5 (3.2, 4.0) 4.8 (3.9, 5.3) 5.5 (5.2, 5.8) J(O1D), 10−5sec−1 1.4 (0.17, 2.7) 1.2 (0.14, 2.3) 0.91 (0.10, 2.2) J(NO2), 10−3sec−1 7.9 (3.7, 9.5) 7.3 (3.0, 9.0) 6.7 (1.9, 9.2)
product ions are forced by electrical fields through a 200 µm diameter aperture into a differentially pumped vacuum re-gion where they are first stripped of neutral ligand molecules, then mass-filtered by a quadrupole (at approximately 2 × 10⁻⁵hPa pressure), and finally detected by an electron mul-tiplier. The OH concentration is determined from the cor-responding H34SO−4 to NO−3 signal ratio and a calibration factor F according to:
[OH] = F(H34SO−4/NO−3) (E2)
During the MINOS campaign calibration measurements were made regularly every hour using a calibration unit which emits filtered UV light at λ = 184.9 nm into the air flow in front of the sample tube. The UV light photolyzes the wa-ter vapor molecules in the sampled air yielding OH concen-trations in the range 0.3–1 × 108cm−3. The generated OH
concentrations are determined based on the known H2O
ab-sorption cross section (Cantrell et al., 1997) and concurrent measurements of [H2O] and the UV photon flux (for details,
see Berresheim et al., 2000). OH was measured at 30 sec time resolution and the corresponding signals were averaged over 5 min intervals. The measurements were corrected by a factor of 0.82 ± 0.03 (1σ ) to account for errors resulting from chemically induced changes in the CIMS sample inlet and titration zones. This correction was based on an iterative ap-proach previously described by Berresheim et al. (2000) and Tanner et al. (1997) using concurrently measured mixing ra-tios of NOx, O3, and CO (see also Table 1; Vrekoussis et al.,
2003; Salisbury et al., 2003). In addition, ambient air mixing ratios of CH4, H2, and HCHO were assumed to be 1900 ppbv,
550 ppbv, and 1 ppbv, respectively (1 ppbv = 10−9mol
sub-stance per mol of air). The latter assumption is supported by airborne HCHO measurements in the lower marine bound-ary layer during MINOS (Kormann et al., 2003; Lelieveld et al., 2002a) and measurements performed at Finokalia dur-ing summer time in 2000 (C. Economou and N. Mihalopou-los, unpublished data). Both the OH data correction factor and the sensitivity of the CIMS instrument showed no sig-nificant trends during the campaign. Therefore, all OH mea-surements during the MINOS campaign were evaluated by
applying a median calibration factor F of 3.12 × 109cm−3. This value already includes the correction by a factor of 0.82 described above.
The precision of the ambient air OH measurements is essentially determined by the signal count statistics of the CIMS instrument, wind turbulence, and chemically induced variability. For the MINOS campaign the precision was es-timated by first determining the reproducibility of the OH calibration. A standard deviation for F of 14% (1σ ) was obtained. Next, contributions from calibration-specific vari-abilities (UV photon flux and H2O measurements) were
de-termined and subtracted yielding an estimated precision of 11% (1σ ) for the ambient OH measurements. The detec-tion limit for OH was calculated to be 2.4 × 105cm−3(2σ ) based on signal count statistics as described by Berresheim et al. (2000).
Measurement accuracy accounts for both precision and systematic uncertainties. The latter were determined to amount to a total of 15% (1σ ) based on contributions from the calibration of the cathodes (8%, 1σ ), the corresponding UV photon flux measurements (8%, 1σ ), the flow velocity in the illuminated zone (8%, 1σ ), and minor contributions (6%, 1σ ) from uncertainties in the [H2O] measurements, the H2O
absorption cross section, and the median value of F. As a fi-nal result, the total accuracy for individual 5 min integrated OH measurements during the MINOS campaign is estimated to be 20% (1σ ).
2.2 Photolysis frequencies and ancillary measurements Photolysis frequencies J(O1D) and J(NO2) were measured
continuously by filter radiometers (Meteorologie Consult, Germany). The accuracy of the J(NO2) filter radiometer was
determined to be 15%, precision better than 3%. For the J(O1D) measurements one sensor pointing upward was used (upper 2π sr). Frequent tests reversing the direction of the sensor showed that the irradiance reflected from the ground (lower 2π sr) contributed 10 ± 3% of the J(O1D) value mea-sured in upward direction. Therefore, total J(O1D) values were obtained by augmenting the upwardly measured values
0 2 4 6 8 10 12 14 16 18 20 22 24 06 08 10 12 14 16 18 20 22 Date, August 2001; UTC
a 0.0 0.5 1.0 1.5 2.0 2.5 3.0 3.5 6 8 10 12 14 16 18 20 22
Date, August 2001; UTC
b
Fig. 1. (a) OH concentration and (b) ozone photolysis frequency
(upper 2π sr +10% from lower 2π sr; see text) measured concur-rently at Finokalia Station during the MINOS campaign. Dots indi-cate individual 5 minute averaged data.
by 10%. The J(O1D) sensor was calibrated against a spec-tral radiometer in November 2001 (B. Bohn, Research Cen-ter J¨ulich, personal communication, 2002). The accuracy of the instrument after calibration was estimated to be 15%, pre-cision is better than 3%.
NO2 was measured by differential optical long-path
ab-sorption (DOAS) as described in detail by Vrekoussis et al. (2003). O3was measured using a Thermo Analyser Model
49C and CO was monitored every 15 min by gas chromatog-raphy equipped with a UV detection technique (Kouvarakis et al., 2002; Salisbury et al. 2003). Meteorological data were measured by both DWD and ECPL using standard instru-ments. The DWD weather station was mounted on a small mast on top of the container. The air flow to the DWD site was always from westerly directions and thus, not blocked by the summit where the ECPL measurements were made. In the present paper we use the DWD data which were in excellent agreement with the ECPL data.
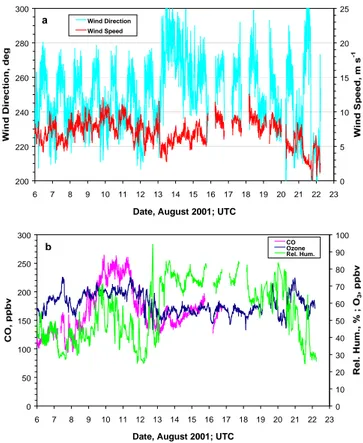
200 220 240 260 280 300 6 7 8 9 10 11 12 13 14 15 16 17 18 19 20 21 22 23 Date, August 2001; UTC
0 5 10 15 20 25 Wind Direction Wind Speed a 0 50 100 150 200 250 300 6 7 8 9 10 11 12 13 14 15 16 17 18 19 20 21 22 23
Date, August 2001; UTC
0 10 20 30 40 50 60 70 80 90 100 CO Ozone Rel. Hum. b
Fig. 2. (a) Local wind direction and wind speed, (b) relative
humid-ity and ozone and CO mixing ratios at Finokalia during the MINOS campaign. The CO data were measured by J. Sciare and are repro-duced here from the companion paper by Salisbury et al. (2003).
3 Results and discussion
3.1 General overview and data classification
Figure 1a shows the temporal profile of the ambient air OH concentration at Finokalia for the whole measurement period of 6–22 August 2001. The corresponding ozone photoly-sis frequency J(O1D) is shown in Fig. 1b. Pronounced diur-nal cycles were observed for both parameters with maximum OH levels occurring roughly between 13:30–14:00 hrs Greek summer time or 10:30–11:00 UTC (lowest local solar zenith angle). Corresponding OH values (5 min averages) typically peaked in the range of 1.5–2.0 × 107cm−3, with individual spikes reaching up to 2.4 × 107cm−3. In general, OH levels
at night were below the detection limit. The average OH con-centration for the whole measurement period was 4.5 ± 1.1
×106cm−3. The noon values of both J(O1D) and J(NO2)
were in the same range as corresponding values measured in May 2000 at the northwestern coast of Crete (Balis et al., 2002). The latter study was part of the Photochemical Activ-ity and Ultraviolet Radiation (PAUR) campaign and included the only previously reported J(O1D) and J(NO2) values
The results shown in Fig. 1a suggest that the OH data can be classified into different periods. Therefore, we examined individual parameters relevant for the OH balance such as corresponding CO, O3, and meteorological data shown in
Figs. 2a and 2b. The CO data measured by J. Sciare have been discussed in detail in the companion paper by Salisbury et al. (2003). To provide a clear context for the following discussion we have reproduced them here in Fig. 2b. Based on the above data analysis we divided the OH data set into three major time periods: I: 6–8 August, II: 9–11 August, and III: 13–18 August (Table 1). These overlap with the cor-responding periods 2, 3, and 4, respectively, defined by Sal-isbury et al. (2003). Period III can easily be distinguished from I and II due to relatively enhanced OH values follow-ing 12 August. Furthermore, local meteorological conditions significantly changed on 12–13 August showing a transition from southwesterly to northwesterly wind directions and a concurrent drop in wind speed (Fig. 2a). In addition, a sig-nificant increase in both absolute humidity (H2O
concentra-tion, Table 1) and relative humidity (Fig. 2b) was observed starting on 12 August, the latter increasing roughly from 30– 50% to 60–80%. Both parameters were highly correlated (R2 = 0.90). Also, O3 mixing ratios dropped from 60–70
to 50–60 ppbv (Fig. 2b). Since 12 August was characterized by significant changes in air mass composition and corre-sponding OH data are missing for the noontime hours this day has been excluded from the present classification. Also, the end of the campaign (past 18 August) has been excluded due to missing CO data and continuously changing meteo-rological and atmospheric chemical conditions. Between 9-11 August both CO mixing ratios and relative humidity (and also [H2O]) showed transient maximum values in correlation
with the advection of air masses impacted by biomass burn-ing (Salisbury et al., 2003). Therefore, we distburn-inguished this episode as period II . The average OH concentrations corre-sponding to the three periods defined above were 3.7 ± 0.7
×106cm−3(I), 4.1 ± 0.7 × 106cm−3(II), and 4.9 ± 1.0 × 106cm−3(III), respectively. In Table 1 statistical results for several parameters with importance for the OH balance are summarized for each of the three periods.
On average, most of the atmospheric chemical observa-tions at Finokalia were consistent with large scale changes in the composition and origin of air masses over the
Mediter-ranean Sea advected to the measurement site. This can
be concluded from a comparison with flight measurements (Traub et al., 2003; de Reus et al., 2003) and from trajec-tory analyses used to categorize the different air masses by composition and origin (Salisbury et al., 2003). The trajec-tory analyses showed that the streamlines of air masses ap-proaching the coast of Crete from northerly directions were deflected to a more westerly direction in the vicinity of the coast. In addition, a regular day-night pattern in both wind direction and wind speed was observed at Finokalia corre-sponding to a land-sea breeze circulation, particularly during the periods I and II and the last days of the campaign (20–
22 August). It cannot entirely be excluded that local and regional contributions from Crete may have contributed to the air mass composition measured at Finokalia. However, both NO and CO measurements at the station indicated no major impact from anthropogenic sources on the island, e.g., from Heraklion. Also, this contribution should have been less significant during daytime than at night since the wind was blowing from the sea during daytime. To check for local impacts due to biogenic emissions from the plants, local herb samples were frequently plucked, then crushed and held into the air sample flow directly next to the CIMS inlet. Corre-sponding effects on the measured OH signals were found to be negligible. As reported by Xu et al. (2003) the concen-trations of biogenic NMHCs emitted from the surrounding vegetation were scarcely measurable.
Having classified the OH data set into three different peri-ods we now examine for each of these periperi-ods the relation-ship between [OH] and J(O1D), the latter parameter exhibit-ing by far the strongest variability in primary OH production (Eq. E1 and Fig. 1b).
3.2 Box model calculations and comparison with empirical approach
The in situ OH concentrations measured at Finokalia (Fig. 1a) represent a quasi-steady state balance between dif-ferent OH sources and sinks. In the lower troposphere the OH lifetime is typically less than 1 second and photostation-ary state equilibrium within the HOx system (= OH + HO2) is
typically achieved within a few minutes (Poppe et al., 1994). Thus, for a typical wind speed of 8 m s−1we may assume that the local OH concentration was determined by the me-teorological and atmospheric chemical conditions prevailing within a distance of at most a few km around the station. Complementary to the detailed model study by Baboukas et al. (2003) we focus in this section more explicitly on an anal-ysis of the relationship between [OH] and J(O1D) by means of a simple box model. Using this alternative approach we attempt to identify the photochemical information contained in the variability of the OH data.
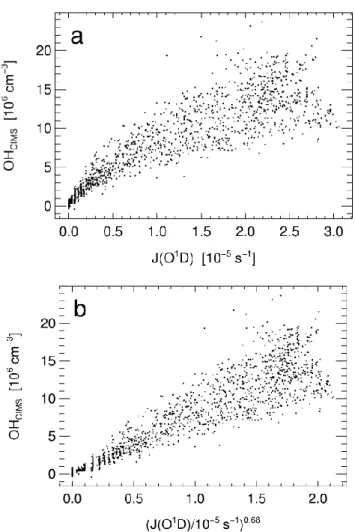
First, a visual comparison between Figs. 1a and b suggests a high degree of correlation between the OH and J(O1D) data. Figure 3a shows the corresponding linear regression analysis. However, it is also obvious that the relationship be-tween both data sets is non-linear. As described by Ehhalt and Rohrer (2000), a more realistic fit which also yields a much better correlation is obtained using an exponential re-lationship:
[OH] = aJ(O1D)b (E3)
A log-log regression of [OH] vs. J(O1D) yields a value of
b = 0.68 ± 0.01 for the exponent. The same value for the exponent was also found for the data subsets corresponding to each of the three periods defined above. Using this value in combination with Eq. (E3), a plot of [OH] vs. J(O1D)0.68
Fig. 3. (a) OH concentrations plotted as a function of J(O1D) for the whole measurement period (6–22 August 2001). (b) Plot of OH vs. J(O1D)0.68. The correlation coefficient is 0.953.
becomes linear with R = 0.953 (Fig. 3b). In the following analysis we want to answer two questions: 1. Can the em-pirical functional expression (E3) and the exponent b = 0.68 be explained by our present knowledge of atmospheric pho-tochemistry? 2. How much of the residual variability shown in Fig. 3b can be attributed to the precision of the CIMS in-strument, how much to atmospheric variability?
The photochemical balance of OH includes as major sources: the reaction of O(1D) atoms with H2O (reaction
R3) and the recycling of OH by reaction of HO2 with NO
and ozone (reactions R4 and R5; see also Baboukas et al., 2003). The production of OH through reaction (R3) depends linearly on J(O1D) because of the strong coupling between reactions (R1), (R2), and (R3). With respect to the HO2
bal-ance one can distinguish between two extreme conditions: 1. At low NO mixing ratios the loss of HO2proceeds mainly
via the self-reaction (R8) resulting in a square root depen-dence of [HO2]on its production rate, P(HO2). HO2in turn
is weakly coupled to the OH concentration through the slow
Fig. 4. Scatter plot of measured J(O1D) vs. J(NO2) for the MINOS-campaign. The line represents the function J(NO2)∼J(O1D)0.30.
reaction with O3(reaction R5). 2. At high NO levels,
reac-tion (R4) is very fast; therefore the coupling between HO2
and OH is strong resulting in a quasi-linear relation between
[HO2]and P(HO2).
Based on these considerations we define three NOx
-“regimes” determining the dependence of [OH] on J(O1D). This classification applies to conditions in which additional HOx sources (e.g., photolysis of aldehydes) are of minor importance as observed during the MINOS campaign (see Fig. 5):
1. Very low NOx(<0.01 ppbv): The major source of OH
is reaction (R3) in which P(OH) depends linearly on J(O1D). A small amount of OH is produced via the reac-tion of HO2with ozone, which has a square root
depen-dence on the production of HO2. Overall, we expect a
slightly less than linear dependence of [OH] on J(O1D).
2. Very high NOx (>10 ppbv): In this case, HO2 levels
should be very low. Again, the major source of OH is re-action (R3) with P(OH) depending linearly on J(O1D). Overall, we expect a quasi-linear relationship between [OH] and J(O1D).
3. Moderate NOx: Here the situation is more complex.
The loss of HO2is controlled by both reactions (R8) and
(R4). The recycling via reaction (R4) is the dominant source of OH. Therefore, J(NO2) becomes an
impor-tant parameter because it controls the NO mixing ratio and introduces an additional dependence on solar irra-diance. The [OH] vs. J(O1D) relationship can be less than, equal to, or stronger than linear, i.e., the value of the exponent b in equation (E3) can range between 0.5 and 1.2 depending on the boundary conditions. For example using an exponent of 1 between J(NO2) and
During MINOS the photochemical conditions
corre-sponded to regime 3) since the mean NO2 mixing ratio
was about 0.4 ppbv (Vrekoussis et al., 2003). For a more detailed analysis we applied a simple box model includ-ing CO-CH4-chemistry and followed the analytical
proce-dure described by Ehhalt and Rohrer (2000) with kinetic parameters from Sander et al. (2003), Bohn and Zetzsch (1997) for HO2+NO, and Ravishankara et al. (2002) for
O(1D)+N2. At Finokalia OH loss due to reactions with
NMHCs was less than 10% during MINOS (according to Baboukas et al., 2003) and has been neglected in our model. The key for understanding the conditions prevailing during MINOS is the relation between the photolysis frequencies J(O1D) and J(NO2) which must be explicitly determined.
Figure 4 shows a well-defined relationship between J(O1D) and J(NO2) which can be explained by the fact that during
the whole MINOS campaign Finokalia station experienced almost always clear sky conditions. The relation between J(O1D) and J(NO2) can be approximated by an exponential
fit:
J(NO2) ∼J(O1D)
c
(E4) Here the exponent c represents the magnitude of the sen-sitivity ratio d{ln(J(NO2))}/d{ln(J(O1D))}. A value of c =
0.30 was found for J(O1D) values larger than 1 × 10⁻⁵s−1 (Fig. 4). This means that if J(O1D) increases by 1%, J(NO2)
increases by 0.3%. To analyze the functional relationship
between measured [OH] and measured J(O1D) we
calcu-lated and added the partial dependences (derivatives) of [OH] on J(O1D) and of [OH] on J(NO2), with the latter being
weighted by the functional relationship between J(O1D) and J(NO2) by the sensitivity of 0.30 (Fig. 4). For average
daytime conditions during the MINOS campaign the par-tial derivatives of [OH] on J(O1D) and on J(NO2) were
calculated to be 0.5 and 0.6, respectively. Thus, the to-tal sensitivity of measured [OH] vs. measured J(O1D) dur-ing the MINOS campaign was found to be approximately 0.68 (= 0.5 + 0.6 × 0.30). Following Ehhalt and Rohrer (2000), we extended this sensitivity analysis to all rele-vant photolysis frequencies as defined by the general expres-sion ∂{ln([OH])}/∂{ln(J)} × d{ln(J)}/d{ln(J(O1D))}, with J = J(O1D) , J(NO2), J(HCHO), J(H2O2), J(HONO) and
cor-responding sensitivities d{ln(J)}/d{ln(J(O1D))} of 1.0, 0.3, 0.59, 0.55 and 0.54, respectively. Because photolysis fre-quencies other than J(O1D) and J(NO2) were not measured
at Finokalia we used their correlation to J(O1D) as published by Kraus and Hofzumahaus (1998) to estimate J(HCHO), J(H2O2), and J(HONO). Mixing ratios of HCHO, H2O2,
and HONO were not measured at Finokalia. However, we assumed a HCHO value of 1 ppbv corresponding approx-imately to the mean HCHO mixing ratio obtained from airborne measurements near the station in the lower ma-rine boundary layer (Kormann et al., 2003; Lelieveld et al, 2002a). For H2O2and HONO we used steady-state mixing
ratios as calculated from the model (max. values: 1 ppbv and
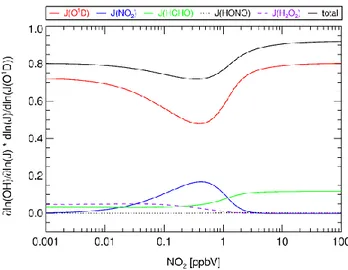
Fig. 5. Sensitivities of [OH] with respect to different photolysis
processes vs. NO2.
0.005 ppbv, respectively). We determined the contributions of the individual photolysis processes to the overall depen-dency of [OH] on J(O1D) for NO2 mixing ratios between
0.001 and 100 ppbv. The other boundary conditions were fixed to mean values as measured during MINOS, in partic-ular J(O1D) for which the average daytime value of 1.3 × 10⁻⁵s−1was used. For each NO2mixing ratio we varied the
value of the individual photolysis frequencies by +1% and calculated the corresponding changes in [OH]. The results are shown in Fig. 5. For the average NO2mixing ratio
dur-ing MINOS of 0.4 ppbv we calculated the total dependence of [OH] on J(O1D), i.e., d[OH]/d{J(O1D)} to be 0.70, which is in quite good agreement to the value of 0.68 derived from the corresponding measurements.
These values are significantly smaller than the correspond-ing values determined from the results of the POPCORN campaign (0.92 from measurements and 0.85 from model calculations, respectively; Ehhalt and Rohrer, 2000). This can be largely explained by significantly different radiation conditions during both campaigns yielding very different overall relationships between J(O1D) and J(NO2). In
con-trast to MINOS, overcast conditions dominated most of the measurement period during POPCORN. In general, for the relatively few days with clear sky conditions an exponent of 0.3 was obtained from equation (E4) which changed to 1 for days with total cloud coverage. During MINOS, short-term transient cloud passages over the measurement site occurred on a few days. As shown in Fig. 4, the corresponding rela-tively small subset of data clearly deviates from the regres-sion curve and, similar to POPCORN, suggests a near-unity exponent (quasi-linear relation) between J(O1D) and J(NO2)
for these conditions. The average value for the correspond-ing exponent c determined from the total POPCORN results using Eq. (E4) was 0.50 (Ehhalt and Rohrer, 2000) in con-trast to the value of 0.30 resulting from the MINOS campaign
Fig. 6. Normalized [OH] vs. J(O1D)0.68for the time period 6–18 August 2001. OHnormis calculated using the parameters aI, aI I,
aI I I shown in Table 2 (see text). The corresponding correlation
coefficient is 0.983.
which was dominated by clear sky conditions. Based on these results, for the relation between [OH] and J(O1D) a slightly higher value of b was modelled for the POPCORN data (b = 0.85) compared to the MINOS data (b = 0.70).
The total [OH] and J(O1D)0.68 data from MINOS were strongly correlated (R = 0.953). Based on our estimated pre-cision of the CIMS instrument (Sect. 2.1) one could expect a maximum correlation with Rmax= 0.986. The difference
be-tween the two R-values can be explained by the variability of components in the data record other than the relation between [OH] and J(O1D). This can be estimated to contribute 6% (= 0.9862−0.9532) to the total variance of [OH]. To identify the cause of this difference we divided the OH dataset into three periods as shown in Table 1. We calculated three individ-ual correlation coefficients between OH and J(O1D)0.68 and found corresponding correlation coefficients of RI= 0.982,
RII= 0.988, and RIII = 0.980, each of which are very close
to Rmax= 0.986. This means that for each of the three time
periods the variability of the measured [OH] data is almost completely explained by the variance of J(O1D) and the
pre-cision of the CIMS instrument. Only 1% of the total vari-ance in [OH] remains unexplained. Most of this remainder can be attributed to 8 obvious outliers out of the 2500 OH data points (Fig. 1). These 8 data points show the highest OH concentrations above 2 × 107cm−3. At least in some cases these may have been caused by local emissions of NO from cars occasionally passing the site (see also Salisbury et al., 2003). However, the number of these outliers is small enough to fall just into the allowed limits of a normal distri-bution.
In summary, from the above analysis we could derive and quantify four principal parameters characterizing the relationship observed between [OH] and J(O1D), namely the exponent b and three different scaling factors aI, aI I,
Table 2. Experimental and model calculated slopes a of the
func-tion [OH] = a J(O1D)0.68for the three time periods of the MINOS
campaign as defined in Table 1. Also given are the correlation
co-efficients R between [OH]CIMSand J(O1D)0.68and the results of
additional model calculations using the lower and the upper bound
of NO2concentrations given in Table 1
Parameter Period I Period II Period III
6–8/8 9–11/8 13–18/8
R([OH]CIMS,J(O1D)0.68) 0.982 0.988 0.980
a(experiment)/x1010s cm−3 1.39 1.71 2.20
a(model)/x1010s cm−3 1.55 1.39 2.26
a(model)/a(experiment) 1.12 0.81 1.03
a(model) NO2lower bound 0.84 0.99 1.86
a(model) NO2upper bound 1.78 1.66 2.44
and aI I I for the corresponding time periods to be used in
conjunction with Eq. (E3). In Fig. 3b the difference be-tween the individual a-values contributed to the scatter in the data plot. To visualize the magnitude of this contri-bution it can be removed by a normalization procedure. We have done this by first dividing each measured [OH] value by the appropriate aj and then scaling the
re-sults such that the mean value is conserved: [OH]norm =
([OH]CIMS,i/aj)/P([OH]CIMS,i/aj)×P([OH]CIMS,i). Here
[OH]CIMS,i denotes the individual [OH] data points, aj the
corresponding experimental scaling factor taken from Ta-ble 2. The result of this normalizing procedure for the time period 6–18 August 2001, is shown in Fig. 6. The correla-tion coefficient between [OH]normand J(O1D)0.68is Rnorm=
0.983 which is very close to the maximum possible value of Rmax= 0.986 (see above). The comparison between Fig. 6
and Fig. 3b clearly demonstrates the extent at which this nor-malization using b and the three parameters aI, aI I, and aI I I
has reduced the variance in the [OH] data set.
A comparison of this result with model calculations of [OH] using measured photolysis frequencies and boundary conditions, is essentially a comparison pertaining to these four quantities aI, aI I, aI I I, and b. As explained above,
the exponent b gives information about the different produc-tion terms of OH. The pre-exponential factor a represents the combination of boundary conditions like mixing ratios of ozone, CO, NMHC, HCHO etc. and kinetic parameters. Using the present approach one can check the combination of these quantities within the limit given by the accuracy of the CIMS instrument. However, even with the very good precision of the CIMS instrument this does not permit an evaluation of the contributions from individual photochem-ical processes determining the concentration of OH during the MINOS campaign. Therefore, we also performed box model calculations using the CO/CH4-model described in
Ehhalt and Rohrer (2000). We calculated three different diur-nal cycles with average boundary conditions given in Table 1,
Fig. 7. [OH]CIMS(crosses) and empirical [OH] calculated from Eq. (E3) and scaling factors given in Table 2 (blue, green, and red line with aI, aI I, and aI I I, respectively).
diurnal cycles of measured J(O1D) and J(NO2) taken from
the very first day of each of the three time periods, and es-timated CH4, H2, and HCHO mixing ratios of 1900 ppbv,
550 ppbv, and 1 ppbv, respectively.
The experimental and model calculated pre-exponential factors aI, aI I, and aI I I are given in Table 2. The individual
values are in agreement with each other within the accuracy of the CIMS instrument of 20%. On average, the difference between the results obtained from the measurements and the model calculations is 7%. The major experimental uncer-tainty seems to be the mixing ratio of NO2. Changing NO2
in the model calculations within the 18- and 82-percentile values given in Table 1 changes [OH] by about a factor of 1.5 higher or lower. On the other hand, the correlation anal-ysis discussed above showed that no major processes have been missed to explain the variability of the measured OH concentration. Therefore, the NO2mixing ratio should have
been relatively constant within each of the three time periods. As a consequence, the 18- and 82-percentile values of NO2
shown in Table 1 seem to reflect mainly the experimental precision of the NO2measurements (Vrekoussis et al., 2003)
than the variability of atmospheric NO2levels.
Equation (E3) can be used to empirically interpolate the OH data based on the corresponding exponential and pre-exponential values. Taking the experimental a-values given in Table 2 and an exponent of 0.68 we calculated a con-tinuous time series of [OH] for the period of 6–18 August (Fig. 7). On 12 August a gap in the OH data occurred due to technical problems. Since the air mass characteristics changed on that day we calculated two corresponding OH profiles using aI I and aI I I , respectively. The two profiles
included in Fig. 7 demonstrate the resulting difference from using either value. Overall, the agreement between the em-pirical calculation and the measured OH data is very good.
The discussion above has shown that the difference between both the measured and calculated OH data is in the range of the estimated accuracy of the CIMS instrument.
4 Conclusions
As part of the MINOS campaign we have conducted highly time-resolved measurements of atmospheric OH, H2SO4,
and methanesulfonic acid (MSA) concentrations at Finokalia Station on the northeastern coast of Crete. The sulfur gas measurements are reported in the companion paper by Bar-douki et al. (2003). In the present study we have eval-uated the results of the OH measurements in conjunction with J(O1D) and J(NO2) photolysis frequencies, mixing
ra-tios of O3, NOx, and CO, and meteorological data
mea-sured at the site. Similar to J(O1D), the OH levels showed
a strong diel variation with peak values of approximately 2
×107molecules cm−3. The mean OH concentration for the
total measurement period (6–21 August 2001; 0–24 hr data) was 4.5 ± 1.1 × 10⁶molecules cm−3which is significantly higher than the zonal (36◦N) and monthly (July) averaged value of 1.5 × 106cm−3 (at 1000 hPa) calculated by Spi-vakovsky et al. (2000) using a global 3D-model.
However, our measured OH data are in close agreement with the MINOS model studies by Baboukas et al. (2003), Kanakidou et al. (2003), and Vrekoussis et al. (2003). The most detailed box model study by Baboukas et al. (2003) which includes NMHC chemistry reproduces the measured OH concentrations very well (R2= 0.95). The largest devi-ations were found for some days during the second half of the campaign when OH was underestimated by about 25%. In the present work we show that these model results are also consistent with the results from a relatively simple box model including CH4−CO-photochemistry. We have used a
sys-tematic approach based on the work of Ehhalt and Rohrer (2000) to analyze the [OH] vs. J(O1D) relationship. Three time periods during the campaign could be distinguished. For each of these periods we inferred the relationship be-tween [OH] and J(O1D) using the empirical function [OH] = a J(O1D)b and explicitly determined the effect of J(NO2)
on this relationship. The corresponding pre-exponential fac-tors aI, aI I, aI I I and the exponent b (whose value turned
out to be the same for all three periods) were used in a nor-malization procedure to describe a fit to the total [OH] data series (except for transition periods). A very good fit to the measured data was obtained. The major surprising result of this analysis was that the variance in the normalized [OH] data could nearly be fully explained (99%) by the variability of J(O1D) (inherently including a small but significant con-tribution by J(NO2)) and the precision of the CIMS
measure-ments.
Based on the value of 0.68 obtained for the exponent b the major sources of OH were found to be ozone photoly-sis and recycling of OH via the HO2+NO reaction. This
means that other processes influencing the local OH produc-tion were unimportant which is in agreement with the model results by Baboukas et al. (2003). Differences in boundary conditions, e.g., mean mixing ratios of NO2, O3, water
va-por, and CO during the three time periods are represented here by the three pre-exponential factors aI, aI I, and aI I I,
respectively.
In conclusion, we recommend that future studies of this kind should include measurements of all parameters ex-pected to be of potential importance for the local OH balance at a particular field site, especially photolysis frequencies and NO and NO2mixing ratios. Furthermore, to detect and
quan-tify different contributions to the OH balance all correspond-ing measurements includcorrespond-ing those of OH need to be made with a sufficiently high degree of precision and accuracy. It will be interesting to test the present empirical approach in further field studies and to determine the degree of complex-ity of both measurements and model calculations required for reproducing locally measured OH concentrations.
Acknowledgements. We thank J. Lelieveld for the opportunity to
participate in MINOS, and M. de Reus and P. Petsalakis for their organizational and logistical help. We are also indebted to the MPI and ECPL teams for their help at Finokalia and collection of data contributing to this work, and especially to G. Stange for his valu-able assistance in carrying out the DWD’s measurements. Fur-thermore, we thank J. Sciare for communicating his CO data, B.
Bohn for calibrating the J(O1D) instrument, and E. Baboukas, M.
Lawrence, and D. Poppe for helpful discussions. This work was financially supported by the Max-Planck Society (MPG) and the German Weather Service (DWD/BMVBW).
References
Baboukas, E., Berresheim, H., Kanakidou, M., Lawrence, M., and Lelieveld, J.: Modeling of OH levels during the MINOS cam-paign and comparison with measurements, submitted to Atmos. Chem. Phys., 2003.
Balis, D. S., Zerefos, C. S., Kourtidis, K., Bais, A. F., Hofzuma-haus, A., Kraus, A., Schmitt, R., Blumthaler, M. and Gobbi, G. P.: Measurements and modeling of photolysis rates during the Photochemical Activity and Ultraviolet Radiation (PAUR) II campaign, J. Geophys. Res., 107, 8138, 10.1029/2000JD000136, 2002.
Bardouki, H., Berresheim, H., Sciare, J., Kouvarakis, G., Vrekous-sis, M., Economou, C., and Mihalopoulos, N.: Gaseous (DMS,
MSA, SO2, H2SO4 and DMSO) and particulate (sulfate and
methanesulfonate) sulfur species during the MINOS campaign: 1. Experimental data, submitted to Atmos. Chem. Phys., 2003. Berresheim, H., Elste, T., Plass-D¨ulmer, C., Eisele, F. L. and
Tan-ner, D. J.: Chemical ionization mass spectrometer for long-term
measurements of atmospheric OH and H2SO4, Int. J. Mass
Spec-trom., 202, 91–109, 2000.
Bohn, B. and Zetzsch, C.: Rate constants of HO2+NO covering
atmospheric conditions. 1. HO2formed by OH + H2O2, J. Phys.
Chem., 101, 1488–1493, 1997.
Cantrell, C. A., Zimmer, A., and Tyndall, G. S.: Absorption cross sections for water vapor from 183 to 193 nm, Geophys. Res. Lett., 24, 2195–2198, 1997.
Ehhalt, D. H. and Rohrer, F.: Dependence of the OH concentration on solar UV, J. Geophys. Res., 105, 3565–3571, 2000.
Eisele, F. L. and Tanner, D. J.: Ion-assisted tropospheric OH measurements, J. Geophys. Res., 96, 9295–9308, 1991. Kanakidou, M., Vrekoussis, M., Berresheim, H., Bardouki, H.,
Sciare, J., Kouvarakis, G., Economou, C., Schneider, J.,
Bor-rmann, S., and Mihalopoulos, N.: Gaseous (DMS, MSA, SO2,
H2SO4, and DMSO) and particulate (sulfate and
methanesul-fonate) sulfur species during the MINOS campaign: 2. A mod-elling approach, submitted to Atmos. Chem. Phys., 2003. Kormann, R., Fischer, H., de Reus, M., Lawrence, M., Br¨uhl, C.,
von Kuhlmann, R., Warneke, C., de Gouw, J., Schlager, H., Ziereis, H., Heland, J., Holzinger, R., Williams, J., and Lelieveld, J.: Formaldehyde over the Eastern Mediterranean during MI-NOS: Comparison of airborne in-situ measurements with 3D-model results, Atmos. Chem. Phys. Discuss., 3, 1303–1331, 2003.
Kouvarakis, G., Vrekoussis, M., Mihalopoulos, N., Kourtidis, K., Rappengl¨uck, B., Gerasopoulos, E., and Zerefos, C.: Spatial and
temporal variability of tropospheric ozone (O3) in the boundary
layer above the Aegean Sea (Eastern Mediterranean), J. Geo-phys. Res., 107 (D18), 10.1029/2000JD000081, 2002.
Kraus, A. and Hofzumahaus, A.: Field measurements of
atmo-spheric photolysis frequencies for O3, NO2, HCHO, CH3CHO,
H2O2, and HONO by UV spectroradiometry, J. Atmos. Chem.,
31, 161–180, 1998.
Lelieveld, J., Berresheim, H., Borrmann, S., Crutzen, P. J., Den-tener, F. J., Fischer, H., de Gouw, J., Feichter, J., Flatau, P., He-land, J., Holzinger, R., Korrmann, R., Lawrence, M., Levin, Z., Markowicz, K., Mihalopoulos, N., Minikin, A., Ramanathan, V., de Reus, M., Roelofs, G. J., Scheeren, H. A., Sciare, J., Schlager, H., Schultz, M., Siegmund, P., Steil, B., Stephanou, E., Stier, P., Traub, M., Williams, J. and Ziereis, H.: Global air pollu-tion crossroads over the Mediterranean, Science, 298, 794–799, 2002a.
Lelieveld, J., Peters, W., Dentener, F. J., and Krol, M. C.: Stabil-ity of tropospheric hydroxyl chemistry, J. Geophys. Res., 107, 10.1029/2002JD002272, 2002b.
Matsumi, Y., Comes, F. J., Hancock, G., Hofzumahaus, A., Hynes, A. J., Kawasaki, M., and Ravishankara, A. R.: Quantum yields for production of O(1D) in the ultraviolet photolysis of ozone: Recommendation based on evaluation of laboratory data, J. Geo-phys. Res., 107 (D3), 10.1029/2001JD000510, 2002.
Platt, U., Alicke, B., Dubois, R., Geyer, A., Hofzumahaus, A., Hol-land, F., Martinez, M., Mihelcic, D., Kl¨upfel, T., Lohrmann, B., P¨atz, W., Perner, D., Rohrer, F., Sch¨afer, J., and Stutz, J.: Free radicals and fast photochemistry during BERLIOZ, J. Atmos. Chem., 42, 359–394, 2002.
Poppe, D., Zimmermann, J., Bauer, R., Brauers, T., Br¨uning, D., Callies, J., Dorn, H.-P., Hofzumahaus, A., Johnen, F.-J., Khedim, A., Koch, H., Koppmann, R., London, H., M¨uller, K.-P., Neuroth, R., Plass-D¨ulmer, C., Platt, U., Rohrer, F., R¨oth, E.-P., Rudolph, J., Schmidt, U., Wallasch, M. and Ehhalt, D. H.: Comparison of measured OH concentrations with model calculations, J. Geo-phys. Res., 99, 16 633–16 642, 1994.
Ravishankara, A. R., Dunlea, E. J., Blitz, M. A., Dillon, T. J., Heard, D. E., Pilling, M. J., Strekowski, R. S., Nicovich, J. M., and Wine, P. H.: Redetermination of the rate coefficient for the
re-action of O(1D) with N2, Geophys. Res. Lett., 29, 1745–1748, 2002.
de Reus, M., Fischer, H., Arnold, F., de Gouw, J., Warneke, C., and Williams, J.: On the relationship between acetone and carbon monoxide in different airmasses, Atmos. Chem. Phys. Discuss., 3, 1017–1049, 2003.
Salisbury, G., Williams, J., Holzinger, R., Gros, V., Mihalopou-los, N., Vrekoussis, M., Sarda-Esteve, R., Berresheim, H., von Kuhlmann, R., Lawrence, M., and Lelieveld, J.: Ground-based PTR-MS measurements of reactive organic compounds dur-ing the MINOS campaign in Crete, July-August 2001, Atmos. Chem. Phys. Discuss., 3, 911–948, 2003.
Sander, S. P., Friedl, R. R., Golden, D. M., Kurylo, M. J., Huie, R. E., Orkin, V. L., Moortgat, G. K., Ravishankara, A. R., Kolb, C. E., Molina, M. J. and Finlayson-Pitts, B. J.: Chemical kinetics and photochemical data for use in atmospheric studies, Evalua-tion number 14, JPL Publ. 2–25, 2003.
Spivakovsky, C. M., Logan, J. A., Montzka, S. A., Balkanski, Y. J., Foreman-Fowler, M., Jones, D. B. A., Horowitz, L. W., Fusco, A. C., Brenninkmeijer, C. A. M., Prather, M. J., Wofsy, S. C. and McElroy, M. B.: Three-dimensional climatological distribution
of tropospheric OH: Update and evaluation, J. Geophys. Res., 105, 8931–8980, 2000.
Tanner, D. J., Jefferson, A., and Eisele, F. L.: Selected ion chemical ionization mass spectrometric measurement of OH, J. Geophys. Res., 102, 6415–6425, 1997.
Traub, M., Fischer, H., de Reus, M., Kormann, R., Heland, J., Ziereis, H., Schlager, H., Holzinger, R., Williams, J., Warneke, C., de Gouw, J., and Lelieveld, J.: Chemical characteristics as-signed to trajectory clusters during the MINOS campaign, At-mos. Chem. Phys. Discuss., 3, 107–134, 2003.
Vrekoussis, M., Kanakidou, M., Mihalopoulos, N., Crutzen, P. J.,
Lelieveld, J., Perner, D., and Berresheim, H.: Role of NO3
rad-icals in oxidation processes in the Eastern Mediterranean tropo-sphere during the MINOS campaign, submitted to Atmos. Chem. Phys., 2003.
Xu, X., Williams, J., Plass-Dlmer, C., Berresheim, H., Salisbury, G., Lange, L., and Lelieveld, J.: GC × GC measurements of C7-C11 aromatic and n-alkane hydrocarbons on Crete, in air from East-ern Europe during the MINOS campaign, Atmos. Chem. Phys. Discuss., 3, 1477–1513, 2003.
![Table 2. Experimental and model calculated slopes a of the func- func-tion [OH] = a J(O 1 D) 0.68 for the three time periods of the MINOS campaign as defined in Table 1](https://thumb-eu.123doks.com/thumbv2/123doknet/14543994.535903/9.892.462.828.216.375/table-experimental-calculated-slopes-periods-minos-campaign-defined.webp)
