HAL Id: hal-00300836
https://hal.archives-ouvertes.fr/hal-00300836
Submitted on 6 Jan 2003HAL is a multi-disciplinary open access
archive for the deposit and dissemination of sci-entific research documents, whether they are pub-lished or not. The documents may come from teaching and research institutions in France or abroad, or from public or private research centers.
L’archive ouverte pluridisciplinaire HAL, est destinée au dépôt et à la diffusion de documents scientifiques de niveau recherche, publiés ou non, émanant des établissements d’enseignement et de recherche français ou étrangers, des laboratoires publics ou privés.
LC-MS analysis of aerosol particles from the oxidation
of ?-pinene by ozone and OH-radicals
R. Winterhalter, R. van Dingenen, B. R. Larsen, N. R. Jensen, J. Hjorth
To cite this version:
R. Winterhalter, R. van Dingenen, B. R. Larsen, N. R. Jensen, J. Hjorth. LC-MS analysis of aerosol particles from the oxidation of ?-pinene by ozone and OH-radicals. Atmospheric Chemistry and Physics Discussions, European Geosciences Union, 2003, 3 (1), pp.1-39. �hal-00300836�
ACPD
3, 1–39, 2003 LC-MS analysis of aerosol particles R. Winterhalter et al. Title Page Abstract Introduction Conclusions References Tables Figures J I J I Back CloseFull Screen / Esc
Print Version Interactive Discussion
c
EGU 2003 Atmos. Chem. Phys. Discuss., 3, 1–39, 2003
www.atmos-chem-phys.org/acpd/3/1/ c
European Geosciences Union 2003
Atmospheric Chemistry and Physics Discussions
LC-MS analysis of aerosol particles from
the oxidation of α-pinene by ozone and
OH-radicals
R. Winterhalter1, *, R. Van Dingenen1, B. R. Larsen1, N. R. Jensen1, and J. Hjorth1
1
European Commission, Joint Research Centre, Institute for Environment and Sustainability, 21020 Ispra (VA), Italy
*
Present address: Max-Planck-Institut f ¨ur Chemie, Atmospheric Chemistry Division, Mainz, Germany
Received: 9 October 2002 – Accepted: 9 December 2002 – Published: 6 January 2003 Correspondence to: R. Winterhalter (winterha@mpch-mainz.mpg.de)
ACPD
3, 1–39, 2003 LC-MS analysis of aerosol particles R. Winterhalter et al. Title Page Abstract Introduction Conclusions References Tables Figures J I J I Back CloseFull Screen / Esc
Print Version Interactive Discussion
c
EGU 2003 Abstract
The time resolved chemical composition of aerosol particles, formed by the oxidation of
α-pinene has been investigated by liquid chromatography/mass spectrometry (LC-MS)
using negative and positive ionisation methods (ESI(-) and APCI(+)). The experiments were performed at the EUPHORE facility in Valencia (Spain) under various
experimen-5
tal conditions, including dark ozone reactions, photosmog experiments with low NOx mixing ratios and reaction with OH radicals in the absence of NOx (H2O2-photolysis). Particles were sampled on PTFE filters at different stages of the reaction and extracted with methanol. The predominant products from α-pinene in the particulate phase are cis-pinic acid, cis-pinonic acid and hydroxy-pinonic acid isomers. Another major
com-10
pound with molecular weight 172 was detected, possibly a hydroxy-carboxylic acid. These major compounds account for 50% to 80% of the identified aerosol products, depending on the time of sampling and type of experiment. In addition, more than 20 different products have been detected and structures have been tentatively assigned based on their molecular weight and responses to the different ionisation modes. The
15
different experiments performed showed that the aerosol formation is mainly caused by the ozonolysis reaction. The highest aerosol yields were observed in the dark ozone experiments, for which also the highest ratios of mass of identified products to the formed aerosol mass were found (30% to 50%, assuming a density of 1 g cm−3).
1. Introduction
20
Secondary organic aerosol (SOA) formation from oxidation of biogenic compounds (mainly from monoterpenes like α-pinene) contributes considerably to the total atmo-spheric aerosol burden. Since the aerosol particles influence the radiative transfer of the earth directly by light scattering and absorption or indirectly by serving as conden-sation nuclei for the formation of cloud droplets, it is necessary to know the sources
25
ACPD
3, 1–39, 2003 LC-MS analysis of aerosol particles R. Winterhalter et al. Title Page Abstract Introduction Conclusions References Tables Figures J I J I Back CloseFull Screen / Esc
Print Version Interactive Discussion
c
EGU 2003 climate change.
The estimates of the global annual SOA formation by biogenic compounds are very uncertain, ranging from 13–24 Tg (Griffin et al., 1999b) to 30–270 Tg (Andreae and Crutzen, 1997). In a recent study the present day annual biogenic SOA formation was estimated to be 61–79 Tg yr−1 compared to pre-industrial levels of 17–28 Tg yr−1
5
(Kanakidou et al., 2000). This increased post-industrial level of biogenic SOA formation is due to anthropogenic influences, which cause increased ozone concentrations and as a consequence also increased aerosol formation. The uncertainties of the estimates comprise uncertainties in the amount of globally emitted biogenic compounds as well as uncertainties of the amount of SOA formed upon atmospheric oxidation of these
10
biogenic compounds.
Among the various biogenic compounds, only terpenes are believed to be a signif-icant source of secondary organic aerosol under atmospheric conditions. The most reactive compounds are the monoterpenes and sesquiterpenes. Although the variety of emitted monoterpenes is high, the predominant species are α-pinene, β-pinene and
15
limonene (Guenther et al., 1995). Since these compounds are unsaturated, they are rapidly oxidised in the atmosphere by ozone, OH- and NO3-radicals (Atkinson, 1994).
The reaction of ozone and monoterpenes has been proposed as a potential aerosol source already in 1960 (Went, 1960). Besides the dark ozone reaction also the re-actions with OH and NO3 radicals lead to aerosol formation (Hoffmann et al., 1997;
20
Griffin et al., 1999a; Larsen et al., 2001). The non-volatile oxidation products, like higher organic acids, condense onto existing particles, which can be described by the gas-particle partitioning model (Odum et al., 1996). The oxidation of biogenic com-pounds might also lead to the formation of new particles in rural areas as field studies indicate (M ¨akel ¨a et al., 1997). Several oxidation products of α-pinene and β-pinene
25
have been found in aerosol particles collected over forested areas (Kavouras et al., 1998; Kavouras et al., 1999a; Kavouras et al., 1999b; Pio et al., 2001a; Pio et al., 2001b).
ACPD
3, 1–39, 2003 LC-MS analysis of aerosol particles R. Winterhalter et al. Title Page Abstract Introduction Conclusions References Tables Figures J I J I Back CloseFull Screen / Esc
Print Version Interactive Discussion
c
EGU 2003 far. Laboratory studies using FTIR (Hatakeyama et al., 1989; Hatakeyama et al., 1991),
GC/MS (Hull, 1981; Jay and Stieglitz, 1987; Hakola et al., 1994) report gas-phase prod-ucts like pinonaldehyde and pinonic acid. The particulate phase has been studied by GC/MS after derivatisation of carboxylic acids and the very non-volatile dicarboxylic acid pinic acid was identified (Christoffersen et al., 1998). Further studies found
addi-5
tional acids like hydroxy-pinonic and norpinic acid (Jang and Kamens, 1998; Yu et al., 1999; Glasius et al., 2000; Koch et al., 2000; Larsen et al., 2001).
Despite the considerable improvement of the understanding of the gas-phase oxida-tion of α-pinene, there is still a lack of understanding of the aerosol forming products and mechanism. In this study the evolution of the aerosol chemical composition was
in-10
vestigated in three types of experiments. The dark reaction of α-pinene with ozone and the reaction with OH-radicals in the absence of NOxwas studied as well as photosmog experiments with various initial NOx-concentrations.
2. Experimental
2.1. Experimental set-up
15
The experiments were performed at the EUPHORE facilities in Valencia, Spain. The two 200 m3 reaction chambers are equipped with various analytical instruments for the on-line (FTIR-spectroscopy, gas-chromatography, O3-, NOx-analyser) and off-line analysis (sampling with cartridges) of gaseous compounds and with instruments for the determination of physical parameters (temperature, pressure, relative humidity, light
20
intensity, etc.). Details of the instrumentation can be found elsewhere (Brockmann et al., 1996).
The particle size distribution was measured with a differential mobility analyser (DMA) in order to measure the aerosol volume formed by the reaction of α-pinene with the different oxidants. The terpene concentration was determined by FTIR and
25
Ta-ACPD
3, 1–39, 2003 LC-MS analysis of aerosol particles R. Winterhalter et al. Title Page Abstract Introduction Conclusions References Tables Figures J I J I Back CloseFull Screen / Esc
Print Version Interactive Discussion
c
EGU 2003 ble 1. The photosmog experiments were performed in the presence of ammonium
sul-fate seed aerosol, whereas the ozonolysis experiments were performed without seed aerosol. Most of the experiments were performed under dry conditions, but a few ex-periments have been repeated under humid conditions (relative humidity 45%–49%). 2.2. Sampling method and sample preparation
5
The particles were sampled with Teflon-filters (PTFE), 47 mm in diameter and with a pore-size of 1 µm. An aluminium pipe (50 mm diameter, 1 m length) was used as sam-pling line, with the inlet placed roughly 50 cm above the floor of the reaction chamber, in vicinity of the sampling lines connected to the DMA.
The particles were collected with flow rates of 27–30 l min−1 (Chamber A) and 35–
10
38 l min−1 (Chamber B) using Andersen pumps in combination with a gas meter to determine the volume. Additionally, a differential pressure gauge was used to measure the pressure before and after the filter (usually between 130 and 200 mbar), which is necessary to calculate the corrected sample volume at atmospheric pressure. The volumes of the sampled air ranged from 0.2 m3to 7 m3, depending on the desired time
15
intervals of the filter samples and the available amount of formed aerosol.
Immediately after the collection of the particles, the filters were put into glass vials with 2 ml of solvent (methanol, containing 0.1% NH3), sealed and stored in the refriger-ator at 5◦C. Prior to analyses the samples have been shaken for 24 h. After removal of the filters the volume of the extracts was reduced to 250 µl with a gentle N2-flow at room
20
temperature. Finally 750 µl water containing 1% acetic acid were added to achieve the same methanol/water ratio as in the initial HPLC-eluent mixture (see below).
In order to determine the extraction efficiency, filters with the highest aerosol loading were extracted a second time with methanol and treated as described. Only main products were found in these second extracts accounting for 5–15% of the amounts
25
found in the first extract. Minor products could not be detected in the second extracts because their concentrations were below the detection limit (at S/N=3) of 5 ng ml−1 in the ESI(-)-mode.
ACPD
3, 1–39, 2003 LC-MS analysis of aerosol particles R. Winterhalter et al. Title Page Abstract Introduction Conclusions References Tables Figures J I J I Back CloseFull Screen / Esc
Print Version Interactive Discussion
c
EGU 2003 2.3. LC-MS analysis
The filter extracts were analysed by liquid chromatography-mass spectrometry (LC-MS). Aliquots (50 µl) of extract were loop injected into a ThermoSeparation HPLC cou-pled to a Finnigan Mat LCQ ion-trap mass spectrometer. The HPLC was equipped with a thermostated (20◦C) 15 cm × 2.1 mm C18-coated silica gel (5 µm) column run in
5
the gradient mode (0.3 ml min−1) programmed from 25% to 75% methanol in 17.5 mM acetic acid in 20 min. Acetonitrile, another common eluent for LC-MS analysis of or-ganic acids, could not be used, since prior test of HPLC grade acetonitrile (Sigma-Aldrich) revealed impurities with the same masses as products from α-pinene (Mw 184, 186).
10
For the detection of products two different ionisation techniques were applied. Each sample was analysed twice, using the ESI(-)- and APCI(+)-mode, respectively, as ioni-sation method in order to gather information about functional groups in unknown prod-ucts. In a first run the outlet of the HPLC was split (3:1) to the ESI (pneumatically assisted electrospray ionisation) interface with N2 as sheath gas and He as auxiliary
15
gas. This ionisation method has a high sensitivity for organic acids, forming either the deprotonised molecular ion [M-H]− or the adduct with acetic acid [M-H+60]−. In a sec-ond run, atmospheric pressure chemical ionisation in the positive mode (APCI(+)) was used as ion source, which is applicable for the detection of carbonyls and alcohols. In contrast, the proton affinity of organic acids is too low to form ions in the APCI(+) mode
20
(Glasius et al., 1999).
Available standards are pinic acid (Mw 186), pinonic acid (Mw 184), and pinonalde-hyde (Mw168). For the quantification of unknown acids an average response factor of pinic and pinonic acid was used, for unknown carbonyl compounds the response factor of pinonaldehyde. Molecules, which give a signal with both ionisation methods, were
25
ACPD
3, 1–39, 2003 LC-MS analysis of aerosol particles R. Winterhalter et al. Title Page Abstract Introduction Conclusions References Tables Figures J I J I Back CloseFull Screen / Esc
Print Version Interactive Discussion
c
EGU 2003 3. Results and discussion
3.1. General observations and identified products
In samples taken under conditions with high aerosol volume concentrations, where only short sampling times were necessary to collect sufficient amounts of particles, numerous compounds have been detected. The experiments with the highest aerosol
5
volume are the three ozonolyses of α-pinene (Experiments 0210A, 0410A, and 0510A, see Table 1), where even with relatively small sampling volumes (0.3–0.7 m3) good results were obtained.
In the photosmog experiments the formation of aerosol was much slower than in the ozonolysis experiments. Due to the slow formation of particles and the relatively
10
fast loss rate of particles in the ventilated reaction chamber, the low aerosol volume concentrations made much longer sampling times necessary. In these samples the main products could be detected, but the concentrations of minor products were in most samples below the detection limit.
The duration of sampling is a crucial factor for the obtained mass balances of
de-15
tected products in the aerosol phase. Due to the pressure drop over the filter, particu-late products are prone to evaporation at the lower pressure side of the filter and due to the air flow an equilibrium between gas and liquid (or particulate) phase is not es-tablished. Therefore the evaporative loss of products (negative artefact), especially of semi-volatile compounds, leads to the poor mass balances in these cases. This effect
20
is demonstrated in Fig. 1, where the mass balance (sum of products/(sample volume × aerosol mass concentration)) of each filter sample from α-pinene experiments in both chambers is plotted versus the duration of sampling.
It is evident, that the mass balances obtained from samples of the three ozonolysis experiments are higher than from the photosmog experiments. The difference might
25
originate from the fact that in case of ozonolysis a high amount of secondary organic aerosol (SOA) is formed rapidly in contrast to the much slower and weaker formation in case of the photosmog experiments. The available SOA mass in the ozonolysis
ACPD
3, 1–39, 2003 LC-MS analysis of aerosol particles R. Winterhalter et al. Title Page Abstract Introduction Conclusions References Tables Figures J I J I Back CloseFull Screen / Esc
Print Version Interactive Discussion
c
EGU 2003 experiments allows much shorter sampling times compared to the photosmog
experi-ments with less SOA mass and consequently longer sampling times in order to sample sufficient SOA with the filter.
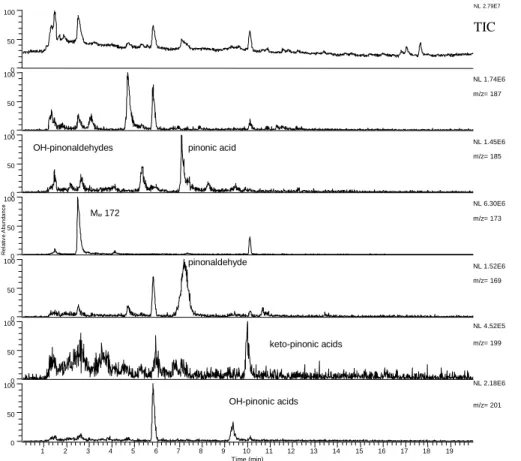
A typical chromatogram of a sample analysed in the ESI(-) mode is shown in Fig. 2, displaying the total ion current (TIC) and extracted ions for the most abundant products
5
detected. In all samples cis-pinic acid is one of the main products, detected as [M-H]− at m/z 185. Due to the steric configuration of the carboxylic groups in cis-pinic acid, the adduct formation with acetic acid [M-H+60]−is suppressed by intramolecular hydrogen bonding (Glasius et al., 1999). The other conformer of pinic acid, trans-pinic acid, is detected as the acetic acid adduct [M-H+60]−, since intramolecular hydrogen bonding
10
is impossible because of the trans configuration of the carboxylic acid groups. The authentic sample of pinic acid contains both cis- and trans-pinic acid, which can be distinguished due to the different detected ions. In none of the samples trans-pinic acid was detected, in accordance with the chemical reaction mechanism and the original configuration of α-pinene (see Sect. 3.5).
15
Another product for which an authentic sample is available is pinonic acid detected as [M-H]− at m/z 183 and as acetic acid adduct [M-H+60]− at m/z 243. As can be seen in Fig. 2, there are also other small peaks at different retention times with m/z 183 and 243. The origin of these peaks remains hidden, but none of these compounds were found in blank samples (filter material, chamber impurities, used solvents) and
20
it is reasonable to conclude that they are either primary reaction products or they are formed by secondary reactions during sample preparation.
At m/z 171 [M-H]− and 231 [M-H+60]− there are four peaks, three minor and one major one at retention time 2.45 min, whose intensity is comparable to the one of pinic acid. A known product with molecular weight 172 is norpinic acid, like pinic acid a
di-25
carboxylic acid which can not be detected in the APCI(+) mode. The TIC and extracted ion chromatogram of the same sample as in Fig. 2, but analysed in the APCI(+) mode is shown in Fig. 3. At m/z 173 [M+H]+ a major peak at the same retention time as for the major peak in the ESI(-) mode was found, indicating that this compound cannot
ACPD
3, 1–39, 2003 LC-MS analysis of aerosol particles R. Winterhalter et al. Title Page Abstract Introduction Conclusions References Tables Figures J I J I Back CloseFull Screen / Esc
Print Version Interactive Discussion
c
EGU 2003 be norpinic acid. A possible structure for this major product is
3-(2-hydroxy-ethyl)-2,2-dimethyl-cyclobutanecarboxylic acid with Mw 172, the carboxylic acid group gives a signal in the ESI(-) and the hydroxy group a signal in the APCI(+) mode). According to the Larsen nomenclature (Larsen et al., 1998) this compound could be named “pinolic acid” in analogy to pinalic acid, but it should be noted that this name is already used in
5
the literature for [3-(1-hydroxy-ethyl)-2,2-dimethyl-cyclobutyl]-acetic acid (named ana-logue to pinonic acid, [3-acetyl-2,2-dimethyl-cyclobutyl]-acetic acid).
The retention times, observed signals in the ESI(-) and/or APCI(+) ionisation mode of
α-pinene oxidation products and possible identifications are given in Table 2. Besides
the major products pinic acid, pinonic acid, OH-pinonic acid, Mw 172, and
pinonalde-10
hyde numerous compounds have been detected. The possible assignments are based on the responses to the different ionisation methods.
Minor acidic products at m/z 169+229 correspond to pinalic acid (two possible iso-mers) and norpinonic acid, but the assignment is impossible without reference com-pounds. Also two intense peaks corresponding to OH-pinonic acid (three isomers) at
15
m/z 199+259 were detected, for keto-pinonic acid (two isomers) at m/z 197+257, the observed peaks are much less intense.
The dominant product among the non-acidic compounds, detected by APCI(+), is pinonaldehyde at m/z 169 [M+H]+ (RT 5.35 min), confirmed by an authentic standard. There were also other compounds detected at this m/z value, the most intense at
20
RT 6.00 min (Fig. 3). Two possible products are 2-hydroxy-3-pinanone, which was identified as a product from the reaction of α-pinene and the OH-radical (Jaoui and Kamens, 2001) and 8-hydroxy-menthen-6-one (5-(1-hydroxy-1-methyl-ethyl)-2-methyl-cyclohex-2-enone), which has been predicted by a theoretical study (Vereecken and Peeters, 2000; Peeters et al., 2001).
25
Minor products are OH-pinonaldehyde (three isomers) at m/z 185 and keto-pinonaldehyde (two isomers) at m/z 183. Other possible products at m/z 185 are the three esters: 2,2-dimethyl-3-(2-oxo-ethyl)-cyclobutanecarboxylic acid methyl ester, formic acid 3-acetyl-2,2-dimethyl-cyclobutyl ester, as tentatively identified by (Yu et al.,
ACPD
3, 1–39, 2003 LC-MS analysis of aerosol particles R. Winterhalter et al. Title Page Abstract Introduction Conclusions References Tables Figures J I J I Back CloseFull Screen / Esc
Print Version Interactive Discussion
c
EGU 2003 1999), and acetic acid 2,2-dimethyl-3-(2-oxo-ethyl)-cyclobutyl ester.
At m/z 187 [M+H]+ several peaks were detected, and one of these compounds (RT 6.00 min) was possibly also observed in the ESI(-) mode, as can be seen at the shoul-der in the pinic acid peak (Fig. 2). Expected products from α-pinene oxidation are the two hydroperoxides (2-hydroperoxy-3-hydroxy-pinane
(2-hydroperoxy-2,6,6-trimethyl-5
bicyclo [3.1.1] heptan-3-ol) and 3-hydroperoxy-2-hydroxy-pinane (3-hydroperoxy-2,6,6-trimethyl-bicyclo [3.1.1] heptan-2-ol), note that two isomers exist of each compound, so in principle four possible products and peroxo-pinalic acid (2,2-dimethyl-3-(2-oxo-ethyl)-cyclobutane-carboperoxoic acid).
In the following sections the yields of particulate products are presented for the
dif-10
ferent experiments. In order to derive the formation yield the measured product mixing ratios had to be corrected for loss processes and extraction efficiency. The correction for the extraction efficiency was done with a mean value of 90% for all products. For correction of aerosol loss the ratio of corrected to measured SOA was used. Finally the yield of particulate products was calculated versus reacted α-pinene, which has been
15
corrected for loss processes by the use of the chemically inert tracer SF6. 3.2. Ozonolysis experiments and ageing of aerosol
Three ozonolysis experiments have been conducted with α-pinene in the dark in order to study the chemical composition of the aerosol in the absence of seed aerosol. After the formation of SOA, when the reaction slowed down, NOx and HCHO were
intro-20
duced into the reaction chamber and the cover of the chamber opened to study the changes of the aerosol composition upon oxidation of the aerosol (ageing).
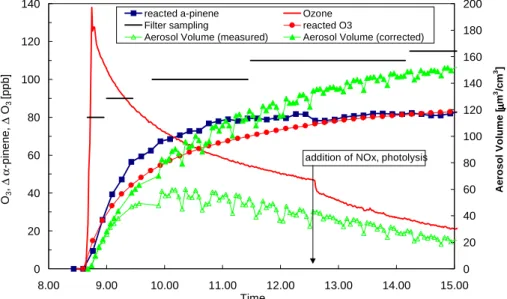
The time profile of ozone and reacted α-pinene of an ozonolysis experiment (0210A) is shown in Fig. 4a together with the measured and corrected aerosol volume and the duration of filter sampling. Also shown is the calculated amount of ozone that
25
has reacted with α-pinene (reacted ozone). Immediately after introduction of ozone the particle formation started and after the conversion of 80 ppb α-pinene roughly 120 µm3cm−3 of SOA had been formed. At this stage NOx and HCHO were added,
ACPD
3, 1–39, 2003 LC-MS analysis of aerosol particles R. Winterhalter et al. Title Page Abstract Introduction Conclusions References Tables Figures J I J I Back CloseFull Screen / Esc
Print Version Interactive Discussion
c
EGU 2003 which can be seen in Fig. 4a by the sudden decrease of ozone (at 12:40) due to the
reaction with NO.
The results of LC-MS analysis are represented in Fig. 4b, the first two samples were taken during the initial aerosol formation (nucleation and coagulation) with short sam-pling times. The third sample was taken when more than 80% of α-pinene had been
5
reacted. The fourth sample was taken after consumption of α-pinene and the fifth sample after ageing of the aerosol by photo-oxidation.
The predominant aerosol products are pinic, pinonic, OH-pinonic acid and an acid with Mw 172. These compounds account for 70% to 80% of the identified aerosol products. The aerosol yield (SOA mass/reacted α-pinene mass) increased from 10%
10
to 24%, as well as the sum of the product yields, which increases from 2 to 7%. The yield of pinic acid increases from 0.5 to 2% and is the range of the results from other studies, reporting 1.4% (Glasius et al., 2000), 3 to 6% (Yu et al., 1999), and 3.2% (Koch et al., 2000). Also the yield of pinonic and OH-pinonic acid are in the range of other studies. No other study reports the formation of a product with Mw 172, except
15
norpinic acid, which was found to be only a minor product in this study. The yields of particulate products from the ozonolysis of α-pinene from other studies are listed in Table 4.
The effect of ageing is difficult to determine, since the observed changes are within the error range of the analytical method. Furthermore, there are still reactive gas phase
20
compounds present competing with the particle bound products for the OH-radical. Therefore it is likely that only a small fraction of particle bound products (presumable only at the surface of the particle, due to the high reactivity of the OH-radical) was actu-ally oxidised. Nevertheless, changes in the yields of pinonaldehyde, OH-pinonaldehyde and keto-pinonaldehyde as well as the corresponding acids were observed. In course
25
of the ageing experiment the aldehydes decrease and the acids increase as a result of the oxidation of the aldehydes. But it cannot be distinguished if the oxidation occurs in the particulate or in the gas-phase or in both phases.
ACPD
3, 1–39, 2003 LC-MS analysis of aerosol particles R. Winterhalter et al. Title Page Abstract Introduction Conclusions References Tables Figures J I J I Back CloseFull Screen / Esc
Print Version Interactive Discussion
c
EGU 2003 3.3. Photosmog experiments
The so-called photosmog experiments were performed under various experimental conditions (Table 1), varying NOxmixing ratios and relative humidity. In all of these pho-tosmog experiments seed aerosol was introduced prior to the experiment. Figure 5a displays the time profile for a photosmog experiment (2709A) under dry conditions with
5
an initial NOxmixing ratio of 11 ppb.
The formed aerosol volume in this kind of experiment is lower than in the dark ozonol-ysis (Fig. 4a), although the amount of reacted α-pinene is comparable in both exper-iments. At the end of the photosmog experiment 80 ppb α-pinene have been reacted and an aersosol volume of 33 µm3cm−3 was formed. In the ozonolysis experiment
10
90 ppb α-pinene was consumed but the aerosol volume is with 150 µm3 cm−3 five times higher.
The product yields in the aerosol phase are shown in Fig. 5b together with the aerosol mass yields. The overall product yield increases from 0.1% to 1.1%. Also in this experiment pinic, pinonic and OH-pinonic acid and the acid with Mw 172 are the
15
main products and account for 80% of the identified aerosol mass. The results of the photosmog experiments with the highest identified product yields are given in Table 5.
Organic nitrates, which are expected to be formed under these conditions, might also contribute to the aerosol phase, but were not detected with the applied method. The functional groups -ONO, OONO, -ONO2, -OONO2and -C(O)OONO2are lacking an
hy-20
drogen atom and are therefore not ionised with the ESI(-) mode. In the APCI(+) mode, ionisation by proton transfer is expected to occur, but no ions were observed at even m/z values. Note that all compounds with only H, C, and O-atoms have odd m/z values: One reason could be that the organic nitrate compound fragments after ionisation into e.g. NO+3 and a neutral oxygenated hydrocarbon, which cannot be detected. Another
25
reason could be that the nitrates are not stable in the used solvents and decompose during sample preparation and/or analysis.
ACPD
3, 1–39, 2003 LC-MS analysis of aerosol particles R. Winterhalter et al. Title Page Abstract Introduction Conclusions References Tables Figures J I J I Back CloseFull Screen / Esc
Print Version Interactive Discussion
c
EGU 2003 3.4. H2O2Photolysis as source of OH-radicals
In order to study solely the reaction with OH-radicals, an experiment with 20 ppm H2O2 as source of OH radicals was performed in the presence of seed aerosol. The aerosol formation is slightly enhanced compared to the photosmog experiment (Fig. 6a). Al-though, no NOx was added before the experiment ozone formation is observed due
5
to the fact that in course of a photolysis experiment the NOx concentration increases caused by wall impurities. Since the ozone formation is much slower than in the pho-tosmog experiments in the presence of NOx, the ozonolysis reaction plays only a mi-nor role, most of the α-pinene had already reacted before sufficient ozone has been formed.
10
The observed product distribution differs from the ozonolysis and photosmog exper-iments with the relative contribution of the main products being lower (roughly 50%). Whereas the relative aerosol composition of the ozonolysis and photosmog are simi-lar, since the main aerosol products arise from the ozone reaction in the photosmog experiment and the contribution of products from the α-pinene/OH reaction is rather
15
small.
Larsen et al. (2001) used also H2O2photolysis as OH-radical source and found only low yields of particulate products (Table 6). It should be noted that they also report an unidentified compound with Mw172. Aerosol mass yields have not been measured in that study.
20
3.5. Summary and reaction mechanism of α-pinene oxidation
The majority of observed aerosol products originate from the reaction of ozone and α-pinene. Most of the compounds can be explained by the Criegee-mechanism (Criegee, 1975) and consecutive reaction of the instable Criegee-intermediates (Wadt and God-dard, 1975; Martinez et al., 1981; Niki et al., 1987) as illustrated in Fig. 7.
25
The three important reaction channels for the two Criegee-intermediates in the gas phase are stabilisation and bimolecular reactions with H2O, the ester channel and the
ACPD
3, 1–39, 2003 LC-MS analysis of aerosol particles R. Winterhalter et al. Title Page Abstract Introduction Conclusions References Tables Figures J I J I Back CloseFull Screen / Esc
Print Version Interactive Discussion
c
EGU 2003 hydroperoxide channel. The latter channel leads to the formation of OH-radicals and
is therefore the major reaction channel for α-pinene ozonolysis as the measured OH-radical yields with 0.85, 0.76 and 0.70 (Atkinson et al., 1992; Chew and Atkinson, 1996; Paulson et al., 1997), respectively, indicate.
There are three possible pathways for rearrangement of H-atoms in the two
Criegee-5
intermediates, leading to three different unsaturated hydroperoxides, which decompose to OH-radicals and alkyl-radicals. The consecutive reactions of these radicals lead to OH-pinonaldehyde (three isomers), keto-pinonaldehyde (two isomers) and norpinon-aldehyde.
The major channel should be for probabilistic reasons hydroperoxide channel HP 3
10
(see Fig. 7), since three H-atoms of the methyl-group are available for the rearrange-ment to the unsaturated hydroperoxide, in contrast to two or one H-atom in case of channel HP 1 and HP 2, respectively. The formation of pinic acid can be explained by two different mechanisms for the acyl-radical, formed in this hydroperoxide chan-nel. The acyl-radical formed from α-pinene is also formed from β-pinene, although in
15
a different way, the consecutive reactions are identical and in both cases pinic acid is formed (Christoffersen et al., 1998; Winterhalter et al., 2000).
After reaction with O2, the formed peroxy-acyl radical can react with HO2 yielding pinalic and pinalic-peroxo acid, the latter forming pinic acid by intramolecular synpro-portionation (Winterhalter et al., 2000). The reaction of the peroxy-acyl radical with
20
NO or peroxy-radicals leads to the acyloxy-radical, which either losses CO2 or an in-tramolecular H-atom abstraction leads to another acyl-radical also yielding pinic acid and peroxo-pinic acid (Jenkin et al., 2000).
Pinonaldehyde is mainly formed by the reaction with OH-radicals, but is also a minor product from the ozonolysis of α-pinene in the presence of H2O. It is reported to be
25
a major or the main product from OH-oxidation with yields ranging from 28% to 87% (Arey et al., 1990; Hatakeyama et al., 1991; Hakola et al., 1994; Vinckier et al., 1998; Wisthaler et al., 2001).
ACPD
3, 1–39, 2003 LC-MS analysis of aerosol particles R. Winterhalter et al. Title Page Abstract Introduction Conclusions References Tables Figures J I J I Back CloseFull Screen / Esc
Print Version Interactive Discussion
c
EGU 2003 Fig. 8) might be formed by the reaction of α-pinene with the OH-radical. It should
be noted that for each β-hydroxy-hydroperoxide theoretically two diastereomers (cis-and trans-configuration of the OH-(cis-and OOH-group) could be formed (cis-and four possible compounds with this Mwexist.
The main course of α-pinene oxidation proceeds via OH-radical addition to the
dou-5
ble bond (88%). For one of the formed OH-radical adducts there is the possibility to isomerise prior to O2 addition forming a new double bond. The branching ratio of iso-merisation to O2addition is 50:50 (Vereecken and Peeters, 2000; Peeters et al., 2001). Further reactions of the ring-opened radical lead to acetone (not shown in Fig. 8) and 8-hydroxy-menthen-6-one. Since this product still contains a double bond it could be
10
also oxidised by OH-radicals to a product with Mw 200 (3-(1-Hydroxy-1-methyl-ethyl)-5,6-dioxo-heptanal).
The formation of the OH-pinonic acids and keto-pinonic acids might be due to further oxidation (see Fig. 9) of the corresponding OH-pinonaldehydes and keto-pinonaldehydes, respectively, which are formed by ozonolysis (Fig. 7). But there has
15
been also reaction mechanisms proposed from the OH-initiated oxidation of α-pinene (Larsen et al., 2001).
The formation of norpinic acid cannot be explained by these reaction mechanisms and might be a result of further oxidation of the dialdehyde (Mw 140), which was ten-tatively identified in prior studies (Jang and Kamens, 1998; Yu et al., 1999). After
ab-20
straction of an aldehydic H-atom by an OH-radical the same reaction pathways leading to the formation of pinic acid (Fig. 7) could yield norpinic acid. There is further evidence that the formation of norpinic acid is due to the OH-radical oxidation, since it was only formed in ozonolysis experiments in the absence of an OH-radical scavenger, but not if cyclohexane as OH-radical scavenger was used (Koch et al., 2000).
25
The origin and identity of the acid with Mw 172 could not be resolved in this study, but it can be excluded that it is norpinic acid. If the suggested structure (a hydroxy-carboxylic acid, see structure 7 in Table 2b) is correct, there is no plausible reaction
ACPD
3, 1–39, 2003 LC-MS analysis of aerosol particles R. Winterhalter et al. Title Page Abstract Introduction Conclusions References Tables Figures J I J I Back CloseFull Screen / Esc
Print Version Interactive Discussion
c
EGU 2003 might be an artefact, it seems very unlikely, that it is an artefact related to the large
teflon chamber. This compound was neither detected in any of the blank filter samples nor in the experiments performed with limonene at the same time period at EUPHORE.
4. Conclusions
The atmospheric oxidation of α-pinene has been studied under various conditions and
5
the chemical evolution of the aerosol particles was determined. The highest aerosol yields were obtained in the dark ozone reaction indicating the importance of the ozonol-ysis with regard to aerosol formation. Also the identified products in the photosmog experiments originate mainly from the ozone initiated oxidation of α-pinene based on known reaction mechanisms.
10
Depending on the amount of formed aerosol during the experiments and depending on how much is left at the time of filter sampling, since the loss rates of aerosol are quite high and the sampling times are long, the quality of the analytical results shows some variation. In all experiments of α-pinene the main products in the aerosol phase (pinic acid, pinonic acid, OH-pinonic acid, Mw 172, and pinonaldehyde) could be identified
15
in each filter taken. Besides these major products a manifold of minor products could be detected and tentatively assigned. In some samples only a few of these minor compounds could be detected, depending on the sampled aerosol mass, and the rest might be either not formed or the amount was below the detection limit. The best results were obtained in the pure ozone reaction experiments, since they yielded high aerosol
20
masses and therefore enough aerosol to analyse, even with the shortest sampling times applied (14 min).
Acknowledgement. The authors thank the co-workers from CEAM for technical support and
assistance during the experiments at EUPHORE. The collaboration by Partners of the OSOA project during the campaign is gratefully acknowledged, especially G. K. Moortgat, A. R ¨ompp, 25
Euro-ACPD
3, 1–39, 2003 LC-MS analysis of aerosol particles R. Winterhalter et al. Title Page Abstract Introduction Conclusions References Tables Figures J I J I Back CloseFull Screen / Esc
Print Version Interactive Discussion
c
EGU 2003
pean Commission Environment and Climate Change programme through contract EU-EVK2-CT 1999-00016 (OSOA). R. W. acknowledges financial support from the EC.
References
Andreae, M. O. and Crutzen, P. J.: Atmospheric aerosols: Biogeochemical sources and role in atmospheric chemistry, Science, 276, 1052–1058, 1997.
5
Arey, J., Atkinson, R., and Aschmann, S. M.: Product study of the gas-phase reactions of monoterpenes with the OH radical in the presence of NOx, J. Geophys. Res., 95, 18539– 18546, 1990.
Atkinson, R.: Gas-phase tropospheric chemistry of organic compounds, J. Phys. Chem. Ref. Data, 2, 1–216, 1994.
10
Atkinson, R., Aschmann, S. M., Arey, J., and Shorees, B.: Formation of OH radicals in the gas phase reactions of O3with a series of terpenes, J. Geophys. Res., 97, 6065–6073, 1992. Brockmann, K. J., Kriesche, V., Etzkom, T., Volkamer, R., and Wirtz, K.: The European
Photore-actor EUPHORE: A technical description, in: Proceedings of the EUROTRAC Symposium ’96, Borell, P. M., Borell, P., Cvitas, T., Kdelly, K. and Seiler, W. (Eds.), 457–461, 1996. 15
Chew, A. A. and Atkinson, R.: OH radical formation yields from the gas-phase reactions of O3 with alkenes and monoterpenes, J. Geophys. Res., 101, 28649–28653, 1996.
Christoffersen, T. S., Hjorth, J., Horie, O., Jensen, N. R., Kotzias, D., Molander, L. L., Neeb, P., Ruppert, L., Winterhalter, R., Virkkula, A., Wirtz, K., and Larsen, B. R.: cis-Pinic acid, a pos-sible precursor for organic aerosol formation from ozonolysis of α-pinene, Atmos. Environ., 20
32, 1657–1661, 1998.
Criegee, R.: Mechanismus der Ozonolyse, Angew. Chem., 87, 765–771, 1975.
Glasius, M., Duane, M., and Larsen, B. R.: Determination of polar terpene oxidation products in aerosols by liquid chromatography-ion trap mass spectrometry, J. Chromatography, A 833, 121–135, 1999.
25
Glasius, M., Lahaniati, M., Calogirou, A., Di Bella, D., Jensen, N. R., Hjorth, J., Kotzias, D., and Larsen, B. R.: Carboxylic acids in secondary aerosols from oxidation of cyclic monoterpenes by ozone, Environ. Sci. Technol., 34, 1001–1010, 2000.
Griffin, R. J., Cocker, D. R. I., Flagan, R. C., and Seinfeld, J. H.: Organic aerosol formation from the oxidation of biogenic hydrocarbons, J. Geophys. Res., 104, 3555–3567, 1999a.
ACPD
3, 1–39, 2003 LC-MS analysis of aerosol particles R. Winterhalter et al. Title Page Abstract Introduction Conclusions References Tables Figures J I J I Back CloseFull Screen / Esc
Print Version Interactive Discussion
c
EGU 2003
Griffin, R. J., Cocker, D. R. I., Seinfeld, J. H., and Dabdub, D.: Estimate of global organic aerosol from oxidation of biogenic hydrocarbons, Geophys. Res. Lett., 26, 2721–2724, 1999b. Guenther, A., Hewitt, N. C., Erickson, D., Fall, R., Geron, C., Graedel, T., Harley, P., Klinger, L.,
Lerdau, M., McKay, W. A., Pierce, T., Scholes, B., Steinbrecher, R., Tallamraju, R., Taylor, J., and Zimmerman, P.: A global model of natural volatile organic compound emissions, J. 5
Geophys. Res., 100, 8873–8892, 1995.
Hakola, H., Arey, J., Aschmann, S. M., and Atkinson, R.: Product formation from the gas phase reactions of OH radicals and O3 with a series of monoterpenes, J. Atmos. Chem., 18, 75– 102, 1994.
Hatakeyama, S., Izumi, K., Fukuyama, T., and Akimoto, H.: Reactions of ozone with α-pinene 10
and β-pinene in air: Yields of gaseous and particulate products, J. Geophys. Res., 94, 13013–13024, 1989.
Hatakeyama, S., Izumi, K., Fukuyama, T., Akimoto, H., and Washida, N.: Reactions of OH with alpha-pinene and beta-pinene in air: Estimate of global CO production from the atmospheric oxidation of terpenes, J. Geophys. Res., 96, 947–958, 1991.
15
Hoffmann, T., Odum, J., Bowman, F., Collins, D., Klockow, D., Flagan, R. C., and Seinfeld, J. H.: Formation of organic aerosols from the oxidation of biogenic hydrocarbons, J. Atmos. Chem., 26, 189–222, 1997.
Hull, L. A., Terpene ozonolysis products, in: Atmospheric biogenic hydrocarbons, Bufalini, J. J. and Arnts, R. R. (Eds.), 2, 161–184, 1981.
20
Jang, M. and Kamens, R. M.: Newly characterized products and composition of secondary aerosols from the reaction of α-pinene with ozone, Atmos. Environ., 33, 459–474, 1998. Jaoui, M. and Kamens, R. M.: Mass balance of gaseous and particulate products analysis from
α-pinene/NOx/air in the presence of natural sunlight, J. Geophys. Res., 106, 12541–12558, 2001.
25
Jay, K. and Stieglitz, L.: Product analysis of the chemical/photochemical conversion of monoter-penes with airborne pollutants (O3/NO2), in: Air pollution and ecosystems, Mathy, P. (Eds.), 542–547, 1987.
Jenkin, M. E., Shallcross, D. E., and Harvey, J. N.: Development and application of a possi-ble mechanism for the generation of cis-pinic acid from the ozonolysis of α- and β-pinene, 30
Atmos. Environ., 34, 2837–2850, 2000.
Kanakidou, M., Tsigaridis, K., Dentener, F. J., and Crutzen, P. J.: Human-activity-enhanced formation of organic aerosols by biogenic hydrocarbon oxidation, J. Geophys. Res., 105,
ACPD
3, 1–39, 2003 LC-MS analysis of aerosol particles R. Winterhalter et al. Title Page Abstract Introduction Conclusions References Tables Figures J I J I Back CloseFull Screen / Esc
Print Version Interactive Discussion
c
EGU 2003
9243–9254, 2000.
Kavouras, I. G., Mihalopoulos, N., and Stephanou, E. G.: Formation of atmospheric particles from organic acids produced by forests, Nature, 395, 683–686, 1998.
Kavouras, I. G., Mihalopoulos, N., and Stephanou, E. G.: Formation and gas/particle partition-ing of monoterpenes photo-oxidation products over forests, Geophys. Res. Lett., 26, 55–58, 5
1999a.
Kavouras, I. G., Mihalopoulos, N., and Stephanou, E. G.: Secondary organic aerosol vs primary organic aerosol emission: In situ evidence for the chemical coupling between monoterpene acidic photooxidation products and new particle formation over forests, Environ. Sci. Tech-nol., 3, 1028–1037, 1999b.
10
Koch, S., Winterhalter, R., Uherek, E., Kolloff, A., Neeb, P., and Moortgat, G. K.: Formation of new particles in the gas-phase ozonolysis of monoterpenes, Atmos. Environ., 34, 4031– 4042, 2000.
Larsen, B. R., Di Bella, D., Glasius, M., Winterhalter, R., Jensen, N. R., and Hjorth, J.: Gas-phase OH oxidation of monoterpenes: Gaseous and particulate products, J. Atmos. Chem., 15
38, 231–276, 2001.
Larsen, B. R., Lahaniati, M., Calogirou, A., and Kotzias, D.: Atmospheric oxidation products of terpenes – a new nomenclature, Chemosphere, 37, 1207–1220, 1998.
M ¨akel ¨a, J. M., Aalto, P., Jokinen, V., Phoja, T., Nissinen, A., Palmroth, S., Markkanen, T., Seitsonen, K., Lihavainen, H., and Kulmala, M.: Observations of ultrafine aerosol particle 20
formation and growth in boreal forest, Geophys. Res. Lett., 24, 1219–1222, 1997.
Martinez, R. I., Herron, J. T., and Huie, R. E.: The mechanism of ozone-alkene reactions in the gas phase. A mass spectrometric study of the reactions of eight linear and branched-chain alkenes., J. Am. Chem. Soc., 103, 3807–3820, 1981.
Niki, H., Maker, P. D., Savage, C. M., Breitenbach, L. P., and Hurley, M. D.: FTIR spectroscopic 25
study of the mechanism for the gas-phase reaction between ozone and tetramethylethylene., J. Phys. Chem., 91, 941–946, 1987.
Odum, J. R., Hoffmann, T., Bowman, F., Collins, D., Flagan, R. C., and Seinfeld, J. H.: Gas/particle partitioning and secondary organic aerosol formation, Environ. Sci. Technol., 30, 2580–2585, 1996.
30
Paulson, S. E., Sen, A. D., Liu, P., Fenske, J. D., and Fox, M. J.: Evidence for formation of OH radicals from the reaction of O3with alkenes in the gas phase, Geophys. Res. Lett., 24, 3193–3196, 1997.
ACPD
3, 1–39, 2003 LC-MS analysis of aerosol particles R. Winterhalter et al. Title Page Abstract Introduction Conclusions References Tables Figures J I J I Back CloseFull Screen / Esc
Print Version Interactive Discussion
c
EGU 2003
Peeters, J., Vereecken, L., and Fantechi, G.: The detailed mechanism of the OH-initiated atmo-spheric oxidation of α-pinene: a theoretical study, Phys. Chem. Chem. Phys., 3, 5489–5504, 2001.
Pio, C. A., Alves, C. A., and Duarte, A. C.: Identification, abundance and origin of atmospheric organic particulate matter in a Portugese rural area, Atmos. Environ., 35, 1365–1375, 2001a. 5
Pio, C. A., Alves, C. A., and Duarte, A. C.: Organic components of aerosols in a forested area of central Greece, Atmos. Environ., 35, 389–401, 2001b.
Vereecken, L. and Peeters, J.: Theoretical study of the formation of acetone in the OH-initiated atmospheric oxidation of α-pinene, J. Phys. Chem. A, 104, 11140–11146, 2000.
Vinckier, C., Compernolle, F., Saleh, A. M., Van Hoof, N., and Van Hees, I.: Product yields of 10
the alpha-pinene reaction with hydroxyl radicals and the implication on the global emission of trace compounds in the atmosphere, Fresenius Environmental Bulletin, 7, 361–368, 1998. Wadt, W. R. and Goddard, W. A.: The electronic structure of the Criegee intermediate.
Ramifi-cations for the mechanism of ozonolysis, J. Am. Chem. Soc., 97, 3004–3021, 1975. Went, F. W.: Blue hazes in the atmosphere, Nature, 187, 641–643, 1960.
15
Winterhalter, R., Neeb, P., Grossmann, D., Kolloff, A., Horie, O., and Moortgat, G. K.: Products and mechanism of the gas phase reaction of ozone with β-pinene, J. Atmos. Chem., 35, 165–197, 2000.
Wisthaler, A., Jensen, N. R., Winterhalter, R., Lindinger, W., and Hjorth, J.: Measurements of acetone and other gas phase product yields from the OH-initiated oxidation of terpenes 20
by proton-transfer-reaction mass spectrometry (PTR-MS), Atmos. Environ., 35, 6181–6191, 2001.
Yu, J., Cocker, D. R. I., Griffin, R. J., Flagan, R. C., and Seinfeld, J. H.: Gas-Phase Ozone Oxidation of Monoterpenes: Gaseous and Particulate Products, J. Atmos. Chem., 34, 207– 258, 1999.
ACPD
3, 1–39, 2003 LC-MS analysis of aerosol particles R. Winterhalter et al. Title Page Abstract Introduction Conclusions References Tables Figures J I J I Back CloseFull Screen / Esc
Print Version Interactive Discussion
c
EGU 2003
Table 1. Experimental conditions for the α-pinene oxidation experiments
Experiment α-pinene [ppb] NOx [ppb] O3 [ppb] Relative humidity Seed aerosol Type of experiment
2609A 50 14 dry yes Photosmog experiment
2709A 100 11 dry yes Photosmog experiment
2809A 100 < 2 dry yes low NOx, HCHO-photolysis
2909A 100 15 46% yes Photosmog experiment
3009A 100 8 46% yes Photosmog experiment
0210A 100 - 130 dry no 1) Ozonolysis 2) Ageing
0310A 100 - - yes Photolysis of 20 ppm H2O2
0410A 100 - 140 dry no 1) Ozonolysis 2) Ageing
0510A 100 - 140 45% no 1) Ozonolysis 2) Ageing
2609B 50 3 dry yes constant NOx
2709B 100 3 dry yes constant NOx
2809B 100 < 2 dry yes low NOx, HCHO-photolysis
2909B 100 3 49% yes constant NOx
3009B 100 5 49% yes constant NOx
ACPD
3, 1–39, 2003 LC-MS analysis of aerosol particles R. Winterhalter et al. Title Page Abstract Introduction Conclusions References Tables Figures J I J I Back CloseFull Screen / Esc
Print Version Interactive Discussion
c
EGU 2003
Table 2. (a) Observed ions and assigned products from LC-MS analysis of α-pinene oxidation
products. Structures and IUPAC names are shown in Table 2b
MW Retention
time (min) ESI(-) APCI(+) possible structures of detected products bold: confirmed by authentic sample
168 6.00 - 169 2-hydroxy-3-pinanone 1, 8-hydroxy-menthen-6-one 2
7.23 - 169 Pinonaldehyde 3 170 5.38 169+229 171
6.00 169+229 171 6.75 169+229 171
Pinalic acid 4, 5, Norpinonic acid 6
172 2.45 171+231 173 Mw 172 ("pinolic acid") 7 4.59 171+231 - 5.51 171+231 - Norpinic acid 8 182 3.38 - 183 5.82 - 183 9.36 - 183 Keto-pinonaldehyde 9, 10 184 5.35 - 185 OH-Pinonaldehyde 11, 12, 13 5.82 - 185 3-Acetyl-5,6-dioxo-heptanal 14 9.50 - 185 Esters 15, 16, 17 7.11 183+243 185 Pinonic acid 18 186 4.75 - 187 β-hydroxy-hydroperoxyde 19, 20 5.75 185 - Pinic acid 21 5.83 - 187 Pinalic-peroxo acid 22 188 5.50 187+247 - ? 6.00 187+247 ? 198 6.10 197+257 199 9.99 - 199 11.00 197+257 - Keto-pinonic acid 23, 24 200 3.53 199+259 - OH-Pinonic acid 26, 27, 28 5.83 - 201 Hydroperoxy-pinonaldehyde 29, Aldehyde 25 9.40 199+259 201 202 5.93 201+261 - Peroxo-pinic acid 30 22
ACPD
3, 1–39, 2003 LC-MS analysis of aerosol particles R. Winterhalter et al. Title Page Abstract Introduction Conclusions References Tables Figures J I J I Back CloseFull Screen / Esc
Print Version Interactive Discussion
c
EGU 2003
Table 2. (b) Structures and IUPAC names of α-pinene oxidation products
1 2 3 4 5 OH O O OH O CHO O O OH COOH O
2-hydroxy-3-pinanone 8-hydroxy-menthen-6-one pinonaldehyde pinalic acid pinalic acid
2-Hydroxy-2,6,6-trimethyl-bicyclo[3.1.1]heptan-3-one 5-(1-Hydroxy-1-methyl-ethyl)-2-methyl-cyclohex-2-enone (3-Acetyl-2,2-dimethyl-cyclobutyl)-acetaldehyde 2,2-Dimethyl-3-(2-oxo-ethyl)-cyclobutane-carboxylic acid (3-Formyl-2,2-dimethyl-cyclobutyl)-acetic acid 6 7 8 9 10 O COOH COOH OH COOH COOH O CHO O O O O
norpinonic acid Mw 172 "pinolic acid" norpinic acid 10-keto-pinonaldehyde 4-keto-pinonaldehyde
3-Acetyl-2,2-dimethyl-cyclobutanecarboxylic acid 3-(2-Hydroxy-ethyl)-2,2- dimethyl-cyclobutane-carboxylic acid
2,2-Dimethyl-cyclobutane-1,3-dicarboxylic acid (3-Acetyl-3-oxo-2,2-dimethyl-cyclobutyl)-acetaldehyde cyclobutyl)-2-oxo-acetaldehyde
(3-Acetyl-2,2-dimethyl-11 12 13 14 15 O OH CHO O CHO HO O CHO OH O O CHO O O O CHO
10-OH-pinonaldehyde 1-OH-pinonaldehyde 4-OH-pinonaldehyde pinalic acid methyl ester
[3-(2-Hydroxy-ethanoyl)-2,2- dimethyl-cyclobutyl]-acetaldehyde (3-Acetyl-3-hydroxy-2,2- dimethyl-cyclobutyl)-acetaldehyde (3-Acetyl-2,2-dimethyl- cyclobutyl)-2-hydroxy-acetaldehyde 3-Acetyl-5,6-dioxo-heptanal 2,2-Dimethyl-3-(2-oxo-ethyl)-cyclobutanecarboxylic acid methyl ester 16 17 18 19 20 O O CHO O O O H O COOH OOH OH OH OOH
pinonic acid ββββ-hydroxy-hydroperoxyde ββββ-hydroxy-hydroperoxyde
Acetic acid
2,2-dimethyl-3-(2-oxo-ethyl)-cyclobutyl ester Formic acid 3-acetyl-2,2-dimethyl-cyclobutyl ester (3-Acetyl-2,2-dimethyl-cyclobutyl)-acetic acid 2-Hydroperoxy-2,6,6-trimethyl-bicyclo[3.1.1]heptan-3-ol 3-Hydroperoxy-2,6,6-trimethyl-bicyclo[3.1.1]heptan-2-ol
21 22 23 24 25 COOH COOH C(O)OOH CHO O COOH O O COOH O O O CHO OH pinic acid pinalic-peroxo acid 7-keto-pinonic acid 4-keto-pinonic acid
3-Carboxymethyl-2,2-dimethyl-cyclobutane-carboxylic acid cyclobutane-carboperoxoic acid2,2-Dimethyl-3-(2-oxo-ethyl)- ethanoyl)-cyclobutyl]-acetic [2,2-Dimethyl-3-(2-oxo-acid
(3-Acetyl-2,2-dimethyl-cyclobutyl)-2-oxo-acetic acid 3-(1-Hydroxy-1-methyl-ethyl)-5,6-dioxo-heptanal
26 27 28 29 30 O COOH OH O COOH HO O COOH OH O CHO OOH C(O)OOH COOH
10-OH-pinonic acid 1-OH-pinonic acid 4-OH-pinonic acid 4-hydroperoxy-pinonaldehyde peroxo-pinic acid [3-(2-Hydroxy-ethanoyl)-2,2-dimethyl-cyclobutyl]-acetic acid (3-Acetyl-3-hydroxy-2,2-dimethyl-cyclobutyl)-acetic acid (3-Acetyl-2,2-dimethyl-cyclobutyl)-2-hydroxy-acetic acid (3-Acetyl-2,2-dimethyl- cyclobutyl)-2-hydroper-oxy-acetaldehyde 3-Hydroperoxycarbonyl- methyl-2,2-dimethyl-cyc-lobutane-carboxylic acid 23
ACPD
3, 1–39, 2003 LC-MS analysis of aerosol particles R. Winterhalter et al. Title Page Abstract Introduction Conclusions References Tables Figures J I J I Back CloseFull Screen / Esc
Print Version Interactive Discussion
c
EGU 2003
Table 3. Molar yields (in %) of particulate products from α-pinene-ozonolysis experiments
0210A 0410A 0510A Average d
[α-pinene]reacted [ppb] 71 56 59 pinic acid 1.79 1.25 1.62 1.55 ± 0.28 pinonic acid 0.89 0.79 0.44 0.71 ± 0.24 OH-pinonic acid a 0.70 0.50 0.34 0.51 ± 0.18 keto-pinonic acid a 0.14 0.19 0.14 0.16 ± 0.03 Mw 170 b 0.25 0.51 0.34 0.37 ± 0.13 norpinic acid 0.08 0.06 0.05 0.06 ± 0.02 Mw 172 0.90 1.24 0.83 0.99 ± 0.22 Mw 186 a 0.20 0.13 0.07 0.13 ± 0.07 Mw 188 a 0.18 0.16 0.15 0.16 ± 0.02 pinonaldehyde 0.35 0.18 0.33 0.29 ± 0.09 OH-pinonaldehyde a 0.13 0.08 0.09 0.10 ± 0.03 keto-pinonaldehyde a 0.13 0.04 0.05 0.07 ± 0.05 Mw 200 0.13 0.03 0.04 0.07 ±0.06
sum of other compounds c 0.23 0.17 0.13 0.18 ± 0.05
carbon mass balance (%) 5.77 5.00 4.32 5.03
sum of yields (%) 6.10 5.33 4.62 5.35 ± 0.74
aerosol mass yield (%) 15.3-19.7 14.6-15.7 13.4-15.6 15.72 ± 2.13
a sum of isomers b norpinonic acid, pinalic acid isomers c yield less than
0.08 (Mw 158, 170, 172) d Error given is one σ
ACPD
3, 1–39, 2003 LC-MS analysis of aerosol particles R. Winterhalter et al. Title Page Abstract Introduction Conclusions References Tables Figures J I J I Back CloseFull Screen / Esc
Print Version Interactive Discussion
c
EGU 2003
Table 4. Comparison of molar yields (in %) of particulate products from α-pinene-ozonolysis
Yu et al.
1999 Glasius et al. 2000 Koch et al. 2000 (3 experiments) This study OH-scavenger 2-butanol cyclohexane cyclohexane -
seed aerosol (NH4)2SO4 - - - [α-pinene]0 [ppb] 50 - 110 1800 5000 100 pinic acid 1.8 - 3.9 1.4 3.2 1.55 ± 0.28 pinonic acid 1.3 - 1.7 1.5 1.2 0.71 ± 0.24 OH-pinonic acid a 1.3 - 2.1 0.86 0.51 ± 0.18 keto-pinonic acid a 0.48 - 0.80 0.16 ± 0.03 Mw 170 b 2.1 - 4.8 0.19 0.37 ± 0.13 norpinic acid 0.05 - 0.09 0.04 0.06 ± 0.02 Mw 172 0.99 ± 0.22 Mw 186 a 0.13 ± 0.07 Mw 188 a 0.16 ± 0.02 pinonaldehyde 0.3 - 0.9 1.9 0.29 ± 0.09 OH-pinonaldehyde a 1.1 - 2.4 0.32 0.10 ± 0.03 keto-pinonaldehyde a 0.07 ± 0.05 Mw 200 0.07 ±0.06
sum of other compounds 0.18 - 0.32 <2.0 0.18 ± 0.05 carbon mass balance (%) 11.3 - 12.9 6.15 5.88 5.03 ± 0.72 sum of yields (%) 11.7 - 13.9 6.21 4.4 5.35 ± 0.74 aerosol mass yield (%) 15.9 - 17.6 - - 15.72 ± 2.13
a sum of isomers b norpinonic acid, pinalic acid isomers
ACPD
3, 1–39, 2003 LC-MS analysis of aerosol particles R. Winterhalter et al. Title Page Abstract Introduction Conclusions References Tables Figures J I J I Back CloseFull Screen / Esc
Print Version Interactive Discussion
c
EGU 2003
Table 5. Molar yields (in %) of particulate products from α-pinene photosmog experiments
2709A 2909A 2709B 2809B Average c
[α-pinene]reacted [ppb] 77 70 74 55 pinic acid 0.24 0.37 0.26 0.23 0.28 ± 0.07 pinonic acid 0.14 0.07 0.20 0.23 0.16 ± 0.07 OH-pinonic acid a 0.09 0.12 0.11 0.08 0.10 ± 0.02 keto-pinonic acid a 0.01 0.01 0.02 0.01 0.013 ± 0.07 Mw 170 b 0.03 0.05 0.06 0.19 0.08 ± 0.07 norpinic acid 0.04 0.12 0.04 0.02 0.06 ± 0.04 Mw 172 0.36 0.21 0.23 0.22 0.26 ± 0.07 Mw 186 a 0.03 0.02 0.04 0.02 0.03 ± 0.01 Mw 188 a 0.07 0.06 0.06 0.09 0.07 ± 0.01 pinonaldehyde 0.04 0.04 0.07 0.13 0.07 ± 0.04 OH-pinonaldehyde a 0.01 - 0.02 0.03 0.02 ± 0.01 keto-pinonaldehyde a 0.01 - - 0.02 0.015 ± 0.007 Mw200 - - - - -
carbon mass balance (%) 1.00 0.98 1.05 1.20 1.07 ± 0.10
sum of yields (%) 1.07 1.07 1.11 1.27 1.14 ± 0.10
aerosol mass yield (%) 3.8 3.5 8.8 10.0
a sum of isomers b norpinonic acid, pinalic acid isomers c Error given is one σ
ACPD
3, 1–39, 2003 LC-MS analysis of aerosol particles R. Winterhalter et al. Title Page Abstract Introduction Conclusions References Tables Figures J I J I Back CloseFull Screen / Esc
Print Version Interactive Discussion
c
EGU 2003
Table 6. Molar yields (in %) of particulate products from OH/α-pinene reaction using H2O2 as
OH-radical source
Larsen et al. 2001 this study
seed aerosol - (NH4)2SO4
[α-pinene]0 [ppb] 1400 - 1600 100
pinic acid 0.03 0.23
pinonic acid 0.44 0.17
OH-pinonic acid 0.14 0.05
norpinonic, pinalic acid (Mw 170) 0.11 0.23
norpinic acid 0.02 0.04 Mw 172 0.07 0.26 Mw 216 0.09 Mw 186 0.03 Mw 188 0.17 pinonaldehyde 0.8 0.09 OH-pinonaldehyde 0.1 0.02 keto-pinonaldehyde 0.07
carbon mass balance (%) 1.78 1.2
sum of yields (%) 1.79 1.39
aerosol mass yield (%) - 7.0
ACPD
3, 1–39, 2003 LC-MS analysis of aerosol particles R. Winterhalter et al. Title Page Abstract Introduction Conclusions References Tables Figures J I J I Back CloseFull Screen / Esc
Print Version Interactive Discussion
c
EGU 2003
Figure 1. Effect of duration of filter sampling on obtained mass balances. Mass balance is the
ratio of identified products [µg], i.e. product concentration × sampled volume, to theoretically
sampled SOA [µg], SOA mass concentration × sampled volume, assuming a density of 1
g/cm3 for the organic particles.
0,000 0,050 0,100 0,150 0,200 0,250 0,300 0,350 0,400 0 20 40 60 80 100 120 140 160 180
duration of sampling [min]
sum products / sampled SOA
ozonolysis photosmog
Fig. 1. Effect of duration of filter sampling on obtained mass balances. Mass balance is the
ratio of identified products [µg], i.e. product concentration × sampled volume, to theoretically sampled SOA [µg], SOA mass concentration × sampled volume, assuming a density of 1 g/cm3 for the organic particles.
ACPD
3, 1–39, 2003 LC-MS analysis of aerosol particles R. Winterhalter et al. Title Page Abstract Introduction Conclusions References Tables Figures J I J I Back CloseFull Screen / Esc
Print Version Interactive Discussion
c
EGU 2003
Figure 2. Total ion chromatogram (TIC) and extracted ion chromatograms of a sample from
α-pinene-ozonolysis analysed in the ESI(-) mode
8 10 12 14 16 18 RetentionTime (min) 0 50 1000 50 1000 50 1000 50 1000 50 1000 50 1000 50 100 NL: 1.47E7 TIC NL: 8.53E6 m/z= 185 NL: 4.42E6 m/z= 183+243 NL: 6.42E6 m/z= 171+231 NL: 7.90E5 m/z= 169+229 NL: 4.50E5 m/z= 197+257 NL: 2.51E6 m/z= 199+259 R e la ti v e A bundanc e pinic acid pinonic acid Mw 172 norpinic acid
pinalic acid, norpinonic acid
keto-pinonic acids
OH-pinonic acids
6
2 4
Fig. 2. Total ion chromatogram (TIC) and extracted ion chromatograms of a sample from
ACPD
3, 1–39, 2003 LC-MS analysis of aerosol particles R. Winterhalter et al. Title Page Abstract Introduction Conclusions References Tables Figures J I J I Back CloseFull Screen / Esc
Print Version Interactive Discussion
c
EGU 2003
Figure 3. TIC and extracted ion chromatogram of a sample from α-pinene-ozonolysis
analysed in the APCI(+) mode.
: 1 2 3 4 5 6 7 8 9 10 11 12 13 14 15 16 17 18 19 Time (min) 0 50 1000 50 1000 50 1000 50 100 R e la ti v e A b und an c e 0 50 1000 50 1000 50 100 NL 2.79E7 TIC NL 1.74E6 m/z= 187 NL 1.45E6 m/z= 185 NL 6.30E6 m/z= 173 NL 1.52E6 m/z= 169 NL 4.52E5 m/z= 199 NL 2.18E6 m/z= 201 pinonic acid Mw 172 pinonaldehyde OH-pinonaldehydes OH-pinonic acids keto-pinonic acids
Fig. 3. TIC and extracted ion chromatogram of a sample from α-pinene-ozonolysis analysed in
ACPD
3, 1–39, 2003 LC-MS analysis of aerosol particles R. Winterhalter et al. Title Page Abstract Introduction Conclusions References Tables Figures J I J I Back CloseFull Screen / Esc
Print Version Interactive Discussion
c
EGU 2003
Figure 4a. Ozonolysis of pinene (Experiment 0210A). Time profile of ozone, reacted
α-pinene and reacted ozone, measured and corrected aerosol volume and duration of filter sampling.
Figure 4b. Molar yields (versus reacted α-pinene) of particulate products.
0 20 40 60 80 100 120 140 8.00 9.00 10.00 11.00 12.00 13.00 14.00 15.00 Time O3 , ∆ α -pinene, ∆ O 3 [ppb] 0 20 40 60 80 100 120 140 160 180 200 Aerosol Volume [ µµµµ m 3/cm 3]
reacted a-pinene Ozone
Filter sampling reacted O3
Aerosol Volume (measured) Aerosol Volume (corrected)
addition of NOx, photolysis
0,00 0,01 0,02 0,03 0,04 0,05 0,06 0,07 0,08 8.48 9.13 10.36 12.49 15.09
yields of particulate products
Mw 200 Mw 188 Mw 186 keto-pinonaldehyde OH-pinonaldehyde pinonaldehyde norpinic acid Mw 170 keto-pinonic acid OH-pinonic acid pinonic acid Mw 172 pinic acid
Fig. 4. (a) Ozonolysis of α-pinene (Experiment 0210A). Time profile of ozone, reacted α-pinene
and reacted ozone, measured and corrected aerosol volume and duration of filter sampling.
ACPD
3, 1–39, 2003 LC-MS analysis of aerosol particles R. Winterhalter et al. Title Page Abstract Introduction Conclusions References Tables Figures J I J I Back CloseFull Screen / Esc
Print Version Interactive Discussion
c
EGU 2003
Figure 4a. Ozonolysis of pinene (Experiment 0210A). Time profile of ozone, reacted
α-pinene and reacted ozone, measured and corrected aerosol volume and duration of filter sampling.
Figure 4b. Molar yields (versus reacted α-pinene) of particulate products.
0 20 40 60 80 100 120 140 8.00 9.00 10.00 11.00 12.00 13.00 14.00 15.00 Time O3 , ∆ α -pinene, ∆ O 3 [ppb] 0 20 40 60 80 100 120 140 160 180 200 Aerosol Volume [ µµµµ m 3/cm 3]
reacted a-pinene Ozone
Filter sampling reacted O3
Aerosol Volume (measured) Aerosol Volume (corrected)
addition of NOx, photolysis
0,00 0,01 0,02 0,03 0,04 0,05 0,06 0,07 0,08 8.48 9.13 10.36 12.49 15.09 time
yields of particulate products
Mw 200 Mw 188 Mw 186 keto-pinonaldehyde OH-pinonaldehyde pinonaldehyde norpinic acid Mw 170 keto-pinonic acid OH-pinonic acid pinonic acid Mw 172 pinic acid
ACPD
3, 1–39, 2003 LC-MS analysis of aerosol particles R. Winterhalter et al. Title Page Abstract Introduction Conclusions References Tables Figures J I J I Back CloseFull Screen / Esc
Print Version Interactive Discussion
c
EGU 2003
Figure 5a. Photosmog experiment with α-pinene (Experiment 2709A). Time profiles of
ozone, reacted ozone, reacted α-pinene and corrected aerosol volume. The duration of filter
sampling is also indicated.
Figure 5b. Molar yields (versus reacted α-pinene) of particulate products.
0 10 20 30 40 50 60 70 80 90 100 10.00 11.00 12.00 13.00 14.00 15.00 16.00 17.00 Time O3 , ∆ α -pinene, ∆ O 3 [ppb] 0 10 20 30 40 50 60 70 80 90 100 Aerosol volume [ µ m 3 cm -3 ]
reacted a-pinene Ozone
Aerosol Volume (corrected) Filter sampling
reacted O3 open chamber cover 0,000 0,002 0,004 0,006 0,008 0,010 0,012 11.31 12.54 14.13 15.06
yields of particulate products
Mw 200 Mw 188 Mw 186 keto-pinonaldehyde OH-pinonaldehyde pinonaldehyde norpinic acid Mw 170 keto-pinonic acid OH-pinonic acid pinonic acid Mw 172 pinic acid
Fig. 5. (a) Photosmog experiment with α-pinene (Experiment 2709A). Time profiles of ozone,
reacted ozone, reacted α-pinene and corrected aerosol volume. The duration of filter sampling is also indicated.
ACPD
3, 1–39, 2003 LC-MS analysis of aerosol particles R. Winterhalter et al. Title Page Abstract Introduction Conclusions References Tables Figures J I J I Back CloseFull Screen / Esc
Print Version Interactive Discussion
c
EGU 2003
Figure 5a. Photosmog experiment with α-pinene (Experiment 2709A). Time profiles of
ozone, reacted ozone, reacted α-pinene and corrected aerosol volume. The duration of filter
sampling is also indicated.
Figure 5b. Molar yields (versus reacted α-pinene) of particulate products.
0 10 20 30 40 50 60 70 80 90 100 10.00 11.00 12.00 13.00 14.00 15.00 16.00 17.00 Time O3 , ∆ α -pinene, ∆ O 3 [ppb] 0 10 20 30 40 50 60 70 80 90 100 Aerosol volume [ µ m 3 cm -3]
reacted a-pinene Ozone
Aerosol Volume (corrected) Filter sampling
reacted O3 open chamber cover 0,000 0,002 0,004 0,006 0,008 0,010 0,012 11.31 12.54 14.13 15.06 time
yields of particulate products
Mw 200 Mw 188 Mw 186 keto-pinonaldehyde OH-pinonaldehyde pinonaldehyde norpinic acid Mw 170 keto-pinonic acid OH-pinonic acid pinonic acid Mw 172 pinic acid
ACPD
3, 1–39, 2003 LC-MS analysis of aerosol particles R. Winterhalter et al. Title Page Abstract Introduction Conclusions References Tables Figures J I J I Back CloseFull Screen / Esc
Print Version Interactive Discussion
c
EGU 2003 Figure 6a. Reaction of α-pinene with OH-radicals, generated by photolysis of H2O2
(Experiment 0310A). Time profiles of ozone (mesaured by FTIR-spectroscopy), reacted α-pinene and reacted ozone, and corrected aerosol volume. The duration of filter sampling is also indicated.
Figure 6b. Molar yields (versus reacted α-pinene) of particulate products.
0 10 20 30 40 50 60 70 80 90 100 10.00 11.00 12.00 13.00 14.00 15.00 16.00 Time O3 , ∆ α -pinene, ∆ O 3 [ppb] 0 10 20 30 40 50 60 70 80 90 100 Aerosol volume [mm 3 cm -3 ]
reacted a-pinene reacted O3
Ozone (FTIR) Aerosol Volume (corrected)
Filter sampling 0,000 0,005 0,010 0,015 11.01 12.48 15.05
yields of particulate products
Mw 200 Mw 188 Mw 186 keto-pinonaldehyde OH-pinonaldehyde pinonaldehyde norpinic acid Mw 170 keto-pinonic acid OH-pinonic acid pinonic acid Mw 172 pinic acid
Fig. 6. (a) Reaction of α-pinene with OH-radicals, generated by photolysis of H2O2
(Experi-ment 0310A). Time profiles of ozone (measured by FTIR-spectroscopy), reacted α-pinene and reacted ozone, and corrected aerosol volume. The duration of filter sampling is also indicated.
![Figure 1. Effect of duration of filter sampling on obtained mass balances. Mass balance is the ratio of identified products [ µ g], i.e](https://thumb-eu.123doks.com/thumbv2/123doknet/14543490.535799/29.918.100.609.132.429/figure-effect-duration-sampling-obtained-balances-identified-products.webp)