HAL Id: hal-01983212
https://hal.archives-ouvertes.fr/hal-01983212
Submitted on 23 Jan 2019
HAL is a multi-disciplinary open access
archive for the deposit and dissemination of
sci-entific research documents, whether they are
pub-lished or not. The documents may come from
teaching and research institutions in France or
abroad, or from public or private research centers.
L’archive ouverte pluridisciplinaire HAL, est
destinée au dépôt et à la diffusion de documents
scientifiques de niveau recherche, publiés ou non,
émanant des établissements d’enseignement et de
recherche français ou étrangers, des laboratoires
publics ou privés.
Peroxide on Adhered Aeromonas hydrophila to Solid
Substrate in Water: Impact of Concentration and
Assessment of the Synergistic Effect
Chrétien Lontsi Djimeli, Antoine Tamsa Arfao, Olive Noah Ewoti, Mireille
Ebiane Nougang, Marlyse Moungang, Geneviève Bricheux, Moïse Nola,
Télesphore Sime-Ngando
To cite this version:
Chrétien Lontsi Djimeli, Antoine Tamsa Arfao, Olive Noah Ewoti, Mireille Ebiane Nougang, Marlyse
Moungang, et al.. Mixture of Sodium Hypochlorite and Hydrogen Peroxide on Adhered Aeromonas
hydrophila to Solid Substrate in Water: Impact of Concentration and Assessment of the Synergistic
Effect. International Journal of Bacteriology, Hindawi Publishing Corporation, 2014, 2014, pp.121367.
�10.1155/2014/121367�. �hal-01983212�
Research Article
Mixture of Sodium Hypochlorite and Hydrogen
Peroxide on Adhered
Aeromonas hydrophila to Solid Substrate
in Water: Impact of Concentration and Assessment of
the Synergistic Effect
Chrétien Lontsi Djimeli,
1Antoine Tamsa Arfao,
1Olive V. Noah Ewoti,
1Mireille Ebiane Nougang,
1Marlyse L. Moungang,
1Geneviève Bricheux,
2Mo
\se Nola,
1and Télesphore Sime-Ngando
21University of Yaound´e I, Laboratory of General Biology, Hydrobiology and Environment Research Unit,
P.O. Box 812, Yaound´e, Cameroon
2Laboratoire “Microorganismes: G´enome & Environnement”, UMR CNRS 6023, Universit´e Blaise Pascal,
Complexe Scientifique des C´ezeaux, 24 avenue des Landais, BP 80026, 63171 Aubi`ere Cedex, France
Correspondence should be addressed to Mo¨ıse Nola; moise.nola@yahoo.com
Received 28 August 2013; Revised 22 December 2013; Accepted 13 January 2014; Published 3 March 2014 Academic Editor: Rodrigo E. Mendes
Copyright © 2014 Chr´etien Lontsi Djimeli et al. This is an open access article distributed under the Creative Commons Attribution License, which permits unrestricted use, distribution, and reproduction in any medium, provided the original work is properly cited. The synergistic effects of the combined treatments of NaOCl and H2O2on the elimination of A. hydrophila adhered to polythene under static and dynamic conditions were evaluated. The concentrations 0.1, 0.2, and 0.3‰ NaOCl and 0.5, 1, and 1.5‰ H2O2were used. The contact periods were 180, 360, 540, and 720 minutes. The abundance of cells adhered reached 2.47 and 2.27 units (log (CFU/cm2)), respectively, under static and dynamic conditions after action of the mixture of disinfectants, whereas it reached 2.41 and 3.39 units (log (CFU/cm2)) after action of NaOCl and H2O2alone, respectively. Increase in the incubation period resulted in a significant decrease in the abundance of cells adhered when the mixture of 0.3‰ NaOCl and 1.5‰ H2O2was used (𝑃 < 0.01). For each cell growth phase, there was a significant difference amongst the mean densities of cells adhered after action of the mixture of disinfectants (𝑃 < 0.05). Although the Freundlich isotherm parameters relatively varied from one experimental condition to another, the𝐾𝑓value registered in the exponential growth phase was relatively higher in static state than in dynamic regime; cells adhered under dynamic condition seem more sensitive to the synergistic action than those adhered under static condition.
1. Introduction
The drinking water distribution network is a source of dis-quiet regarding the contamination of water during delivery and regrowth of microorganisms that survive after
treat-ment [1]. It is often the scene of many physicochemical
and biological reactions resulting from interactions between disinfectants, pipe walls, and the free and fixed biomass
[2]. The presence of natural organic matter provides a food
source for bacteria that can colonize the inner walls of distribution pipes, forming biofilms that protect and support the growth of microorganisms, some of which are associated
to hostile effect on human health [1] and others through their
interactions with disinfectants and pipe walls are sometimes the cause of the deterioration of the organoleptic properties
of the water supply [2,3].
In recent years, World Health Organization recognizes
A. hydrophila as an opportunistic pathogen, implicated as a
pathogenic agent in gastroenteritis, septicemia, cellulitis,
col-itis, meningcol-itis, and respiratory infections [4–6]. To prevent
bacterial regrowth, a residual of a disinfectant is maintained in the water distribution network. Previous work has shown that the bacterium A. hydrophila is widespread in the environ-ment, especially in water intended for human consumption
[7, 8]. Its concentration can sometimes reach 102CFU/mL
at the outlet of treatment plants for drinking water. This
Volume 2014, Article ID 121367, 13 pages http://dx.doi.org/10.1155/2014/121367
concentration may be higher in networks of drinking water distribution due to the growth of A. hydrophila on biofilms
[7,9].
The ingestion of water or contaminated food is the common way of progress in the case of Aeromonas infection
[10]. Numerous studies have been conducted in view of
high-lighting the inactivation of various waterborne pathogens by various disinfectants, including sodium hypochlorite,
hydrogen peroxide, ozone, and chlorine dioxide [11].
The mixture of NaOCl and H2O2in water resulted in a
redox reaction which gave the following equations [12]:
H2O2/H2O: 1,77 v and ClO2−/ClO−: 0,66 v
ClO−+ 2HO−→ ClO2−+ H2O+ 2e− (1)
H2O2+ 2H++ 2e− → 2H2O (2)
(1) and (2): ClO−+ H2O2+ 2HO−+ 2H+
→ ClO2−+ 3H2O (3) ClO−+ H2O2+ 2H2O→ ClO2−+ 3H2O (4) ClO−+ H2O2→ ClO2−+ H2O (5) Na++ ClO−+ H2O2→ Na++ ClO2−+ H2O (6) NaClO+ H2O2→ NaClO2+ H2O (7)
NaClO2is a very unstable compound that gives NaCl +
1O
2(singlet oxygen). It resulted in
NaClO+ H2O2→ NaCl + 1O2+H2O (8)
The reaction between these disinfectants produces singlet
oxygen (1O2), which is a powerful oxidant that rapidly kills
bacterial cells. Singlet oxygen short lifespan (100 nanosec-onds in lipid media and 50 nanosecnanosec-onds in the cytoplasm) can diffuse a short distance and react with certain amino acids leading to structural and functional alteration of the
mem-brane causing lipoperoxidation [13]. Less data are available
on the bacterial behavior or bacterial metabolism when both disinfectants are dissolved in water at the same time. Less information are also available on the cell survival with respect to the both disinfectants concentrations.
Most studies carried out so far provided some informa-tion on the doses of disinfectants and adequate contact dura-tion period to effectively control pathogens of public health importance that are commonly used to develop regulations and strategies treatment. Chemical disinfectants cause lethal
or nonlethal changes in proteins [14], lipids [15], membrane
[16], and DNA [17] of microorganisms. In addition, the
mechanisms of disinfection are also highly dependent on the type of microorganism, cell growth stage, and disinfectant
[18].
Other studies have considered the impact of disinfectants on A. hydrophila adhered to the fragments of polythene immersed in water. It appears that NaOCl is more effective on
A. hydrophila adhered to polythene than H2O2. In addition,
A. hydrophila adhered to polythene under dynamic condition
is more sensitive to each of the two disinfectants than that
adhered under static condition [18]. However, little data on
the combined effect of these disinfectants are available. This study aims to evaluate in microcosm the synergistic effect
of NaOCl and H2O2 on A. hydrophila cells from different
cell growth phases and adhered to fragments of polythene immersed in water.
2. Materials and Methods
2.1. Collection and Identification of A. hydrophila. The
bac-terium A. hydrophila was isolated from well water in Yaound´e (Cameroon) using membrane filtration technique,
on ampicillin-dextrin agar medium [19,20]. Cell subculture
was performed on standard agar medium (Bio-Rad Labora-tories, France). The cells were then identified using standard
biochemical methods [21]. These cells are facultative
anaero-bic, nonsporulated, Gram-negative bacilli, and ferment man-nitol, produce indole, and are mobile. They do not possess urease, lysine decarboxylase (LDC), ornithine decarboxylase (ODC), and arginine dihydrolase (ADH). For the preparation of stocks of bacteria, colonies are inoculated into 100 mL of
nutrient broth (Oxford) for 24 hours at 37∘C. Afterwards,
cells were harvested by centrifugation at 8000 rpm for 10 min
at 10∘C and washed twice with NaCl (8.5 g/L) solution. The
pellet was resuspended in NaCl (8.5 g/L) solution and then
transferred to 300𝜇L tubes. The stocks were then frozen
stored.
2.2. Assessment of Cell Growth Phase. On the basis of previous
studies regarding the different growth phases and biofilm
formation, the cell growth phases were assessed at 37∘C.
The growth of A. hydrophila in nonrenewed peptone liquid medium gives 4 growth phases: a lag growth phase from 0 to 2 hours, an exponential growth phase from 2 to 13 hours, a stationary growth phase from 13 to 22 hours, and a decline
growth phase which begins as from the 22th hour [18].
2.3. Disinfectants and Adsorbent Substrates Used. The
mix-ture of two disinfectants was used: NaOCl, which belongs to
the group of halogen derivatives, and H2O2 which belongs
to the group of oxidants. NaOCl and H2O2 used are,
respectively, Colgate-Palmolive (USA) and Gilbert (France) brand. The ease use of these two disinfectants in drinking water treatment justified their choice for this study. The combination concentrations of each disinfectant used ranged from 0.1‰ to 0.3‰ and from 0.5‰ to 1.5‰, for NaOCl
and H2O2, respectively. These concentrations were evaluated
by simple method of dilution of crude solution obtained directly from the supplier. The choice of these combination concentrations is justified by their synergistic action. To count the surviving bacteria after disinfection treatment, sterile NaCl solution (8.5 g/L) was used as a diluent.
The substrate used is high dense polythene. It differs from radical low dense polythene and linear low dense polythene by the molecular structure of its sparsely branched chains and its relatively high resistance to shocks, high temperatures,
obtained directly from the supplier and used in drinking water distribution.
The high dense polythene is obtained by polymerization of the macromolecules of polyolefin family. This polymer-ization is obtained from gaseous ethylene according to the
following equation [24,25]: C C H H H H n n H2C CH2 ( ) (9)
The polythene used in this study is commercialized by Goodfellow SARL (France).
2.4. Determination of Activity of Disinfectants Alone or in Combinations. The protocol described by Maris [26] with some modifications was applied. The principle of this pro-tocol consists in preparation of the mixtures of NaOCl (A
(B assoc)) and H2O2 (B (A assoc)). For it, nine couples
of disinfectant concentrations (A (B assoc), B (A assoc)) were studied simultaneously for the preparation of mixtures of disinfectants. The disinfectant concentrations used alone ranged from 0.5‰ to 1.5‰ and from 5‰ to 15‰ for NaOCl
(A alone) and H2O2(B alone), respectively. The contaminated
substrates are getting in contact with these disinfectant concentrations for 25 to 30 min. The disinfecting effect was stopped by introducing substrates in 10 mL of sterile saline. Antimicrobial activity was assessed after culture of surviving germs and appreciation of the reduction of the bacterial load. The effect of the association was estimated by calculating the fractional bactericidal concentration (FBC) according to
Maris [26]:
FBC=A(B assoc)
A(alone) +
B(A assoc)
B(alone) , (10)
wherein A (B assoc) and B (A assoc) are the respective
concentrations of NaOCl and H2O2studied in the mixture.
A (alone) and B (alone) are the respective concentrations of the two disinfectants studied alone.
The synergy was then declared for a value of FBC less than or equal to 0.50. The study of this synergy was achieved at each stage of cell growth phase in stationary and dynamic regimes.
2.5. Adhesion Protocol of Cells to Polythene. On the basis of
previous studies, parallelepiped shaped fragments of
poly-thene with 13.28 cm2of total surface area suspended with wire
of 0.1 mm diameter were immersed in triplicate in the two sets
A and B each in four flasks 250 mL Duran A1, A1, and A1
and B1, B1, and B1, A2, A2, and A2and B2, B2, and B2,
A3, A3, and A3and B3, B3, and B3, and A4, A4, and A4
and B4, B4, and B4each containing 99 mL of NaCl solution
(8.5 g/L). Meanwhile, the controls were made and coded A01,
A02, A03, and A04 and B01, B02, B03, and B04 [27]. The whole
was then autoclaved.
Prior to the experiments, stocks frozen vial containing
A. hydrophila cells were thawed at room temperature. Then
100𝜇L of the culture was transferred into test tubes
contain-ing 10 mL of nutrient broth (Oxford) and incubated at 37∘C
for 24 hours. Cells from a specific cell growth phase were then harvested by centrifugation at 8000 rpm for 10 min at
10∘C and washed twice with sterile NaCl solution (8.5 g/L).
The pellets were then resuspended in 50 mL of sterilized NaCl solution (8.5 g/L). After serial dilutions, the initial
concentration of bacteria (data at𝑡 = 0) in each solution was
adjusted to6 × 108CFU/mL by reading the optical density
at 600 nm using a spectrophotometer (DR 2800) followed by
culture on agar [27].
1 mL of the suspension was added to 99 mL of sterilized NaCl solution (8.5 g/L) contained in an Erlenmeyer flask. Triplicate flasks were incubated under dynamic condition for 180, 360, 540, and 720 min at a stirring speed of 60 rev/min, using a stirrer (Rotatest brand). In the same way another triplicate flasks were incubated under static condition for 180, 360, 540, and 720 min. All these incubations were done at
laboratory temperature (25 ± 1∘C).
2.6. Disinfection Experiments. After each incubation
dura-tion, fragments of polythene were drained for 10 seconds in a sterile environment created by the Bunsen burner flame and then introduced into test tubes containing 10 mL of diluted mixture of disinfectant of various concentrations. Fragments removed from flasks A1, A2, A3, A4, B1, B2, B3, and B4 were introduced in mixture disinfectant solutions of 0.1‰ NaOCl
and 0.5‰ H2O2. Fragments removed from flasks A1, A2,
A3, A4, B1, B2, B3, and B4were introduced into mixture
disinfectant solutions of 0.2‰ NaOCl and 1‰ H2O2.
Simi-larly, those removed from flasks A1, A2, A3, A4, B1,
B2, B3, and B4were introduced into mixture solutions of
0.3‰ NaOCl and 1.5‰ H2O2. Fragments of polythene flasks
from A01, A02, A03, and A04 and B01, B02, B03, and B04 were
introduced into 10 mL of sterile NaCl solution (8.5 g/L). The concentration of the disinfectant has not been evaluated after incubation.
After 30 min of incubation at room temperature and under static condition, each fragment was then drained out under sterile condition. Each fragment was then introduced into 10 mL of sterilized NaCl solution (8.5 g/L). The unhook-ing of adherent cells was performed by vortex agitation at increasing speeds for 30 seconds in three consecutive series of 10 mL sterilized NaCl solution (8.5 g/L). This technique
allows for the unhooking of maximum adhered cells [28,29].
The total volume of the suspension containing the unhooked bacterial cells was 30 mL. The isolation and enumeration of unhooked cells were made by culture on ampicillin dextrin agar, by using spread plat method, followed by incubation on
Petri dishes at 37∘C for 24 hours.
2.7. Data Analysis. The variation of the abundance of adhered A. hydrophila in each experimental condition was illustrated
by semilogarithmic diagrams. Standard deviations were not fitted because the curves were too close. Spearman “𝑟” correlation Test was used to assess the degree of correlation between the abundance of adhered cells and other parameters considered. Kruskal-Wallis and Mann-Whitney tests were
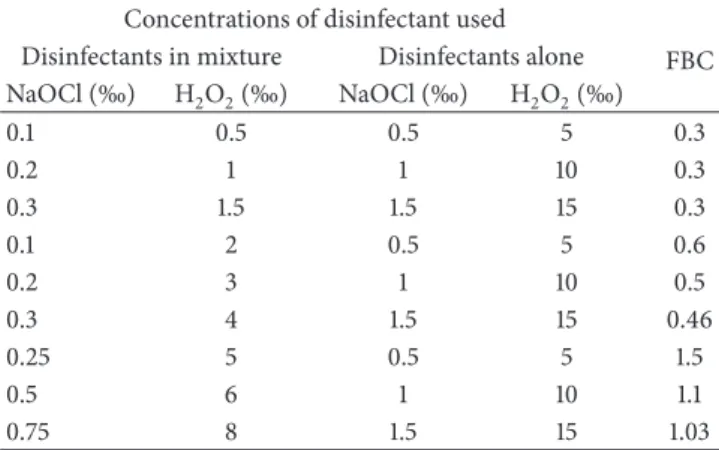
Table 1: Value of fractional bactericidal concentration (FBC) obtained for each couple of disinfectants concentrations.
Concentrations of disinfectant used
FBC Disinfectants in mixture Disinfectants alone
NaOCl (‰) H2O2(‰) NaOCl (‰) H2O2(‰) 0.1 0.5 0.5 5 0.3 0.2 1 1 10 0.3 0.3 1.5 1.5 15 0.3 0.1 2 0.5 5 0.6 0.2 3 1 10 0.5 0.3 4 1.5 15 0.46 0.25 5 0.5 5 1.5 0.5 6 1 10 1.1 0.75 8 1.5 15 1.03
used to compare the mean abundance of cells adhered from one experimental condition to another.
The data from absorption experiments were analyzed using the Freundlich isotherm model. This isotherm was chosen because of the number and the relevance of the information it provides on the real adsorption mechanisms on one hand and its remarkable ability to match doses of adsorption on the other hand. The Freundlich isotherm is
described by the following equation [30,31]:
𝐶𝑠= 𝐾𝑓⋅ 𝐶𝑙/𝑛, (11)
where𝐶𝑠is the quantity of cells adsorbed in the presence of
the mixture of disinfectant solutions,𝐶 is the concentration
of cells adsorbed in the absence of mixture of disinfectant
solutions,𝐾𝑓is the Freundlich coefficient adsorption which
is connected to the adsorption capacity, 𝑙/𝑛 is coefficient
linearity, and 𝑛 is the intensity of adsorption. Here, 𝐶𝑠
is expressed as the number of adherent cells/mixture of
disinfectant concentration and𝐶 is the number of adherent
cells/cm2of polythene. Constructing linear regression log𝐶𝑠
versus log𝐶 results in a line of slope 𝑙/𝑛 which intercepts the
𝑦-axis log 𝐾𝑓.
3. Results
3.1. Fractional Bactericidal Concentration (FBC). The FBC
values were calculated using the formula indicated above.
The different FBC obtained is given inTable 1. To ensure the
synergistic action of the two disinfectants, only disinfectant concentrations giving FBC equal to 0.3 were used for the preparation of mixture of disinfectants.
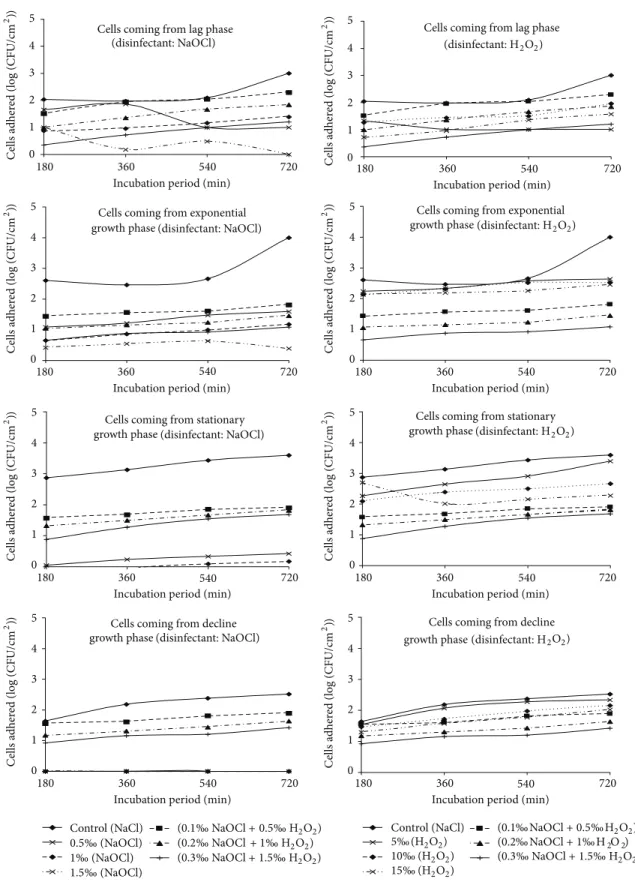
3.2. Abundance of Cells Adhered to Polythene after Action of the Association of Disinfectants in Stationary Regime. The
densities of cells adhered ranged from 0.30 to 2.29 units (log
(CFU/cm2)) after the action of the mixture of NaOCl and
H2O2 under static condition. The maximum abundance of
cells adhered was recorded in the presence of the mixture of
0.1‰ NaOCl and 0.5‰ H2O2and this is after 720 minutes
with cells harvested from the lag growth phase. Adhered cells were always partially decimated by the mixture of NaOCl and H2O2(Figure 1).
With cells coming from the lag phase, the abundance of cells adhered under static condition to the control substrate
varied throughout from 2.02 to 3.19 units (log (CFU/cm2))
and was always superior to those of fragments tested for disinfection. In addition, they increase with the incubation duration. Maximum cell density was recorded after an adhe-sion test of 720 minutes. After the action of the mixture of
NaOCl and H2O2, the densities of cells adhered ranged from
0.30 to 2.29 units (log (CFU/cm2)). The effectiveness of the
mixture of NaOCl and H2O2 decreased with the length of
the adhesion duration test. The maximum cell abundance was recorded in the presence of the mixture of 0.1‰ NaOCl and
0.5‰ H2O2after an adhesion test of 720 minutes. The lowest
density of adhered cells was observed in the presence of the
mixture of 0.3‰ NaOCl and 1.5‰ H2O2 with cells coming
from the adhesion tests of 180 minutes (Figure 1).
The abundance of cells under static condition adhered to the control substrate during the exponential growth phase was lower than that tested for disinfection in the lag growth phase under the same condition. They generally fluctuated
between 2.30 and 2.91 units (log (CFU/cm2)). After
disinfec-tion test, it was noted that the effectiveness of the mixture of
NaOCl and H2O2decreased when the duration of adhesion
test increased. Abundance of cells adhered ranged between
0.70 to 1.81 units (log (CFU/cm2)) (Figure 1). The highest
cell abundance was recorded in presence of the mixture of
0.1‰ NaOCl and 0.5‰ H2O2 after an adhesion test of 720
minutes. The lowest density of adhered cells was observed in
the presence of the mixture of 0.3‰ NaOCl and 1.5‰ H2O2
with cells coming from the adhesion tests of 180 minutes (Figure 1).
The stationary growth phase shows the abundance of cells in static regime adhered to the control substrate which varies
from 1.92 to 2.49 units (log (CFU/cm2)). They remained
higher than those of the fragments tested for disinfection. After disinfection test, abundance of cells adhered ranged
between 0.90 and 1.89 units (log (CFU/cm2)). As the duration
of adhesion test increased, it was noted that the effectiveness
of the mixture of NaOCl and H2O2 decreased. The highest
density of cells adhered to the polythene was recorded in
the presence of the mixture of 0.3‰ NaOCl and 1.5‰ H2O2
after 720 minutes incubation duration. The lowest density of adhered cells was observed in the presence of mixture of
0.3‰ NaOCl and 1.5‰ H2O2 after 180 minutes incubation
duration (Figure 1).
The abundance of cells adhered in static regime to the control substrate during the decline growth phase varied
from 1.95 to 2.48 units (log (CFU/cm2)). Adhered cells
after the action of NaOCl relatively increased (Figure 1). The
maximum density of cells adhered to the polythene was recorded in the presence of the mixture of 0.3‰ NaOCl
and 1.5‰ H2O2after 720 minutes incubation duration. The
minimum density of adhered cells was observed in the
presence of mixture of 0.3‰ NaOCl and 1.5‰ H2O2after 180
Control (NaCl) 0.5‰(NaOCl) 1‰(NaOCl) 1.5‰(NaOCl) (0.1‰NaOCl+ 0.5‰H2O2) (0.2‰NaOCl+ 1‰H2O2) (0.3‰NaOCl+ 1.5‰H2O2) Control (NaCl) 5‰(H2O2) 10‰(H2O2) 15‰(H2O2) (0.1‰NaOCl+ 0.5‰H2O2) (0.2‰NaOCl+ 1‰H2O2) (0.3‰NaOCl+ 1.5‰H2O2)
Cells coming from lag phase
(disinfectant: H2O2)
Cells coming from lag phase (disinfectant: NaOCl)
Cells coming from exponential
(disinfectant: H2O2)
Cells coming from exponential (disinfectant: NaOCl)
Cells coming from stationary
(disinfectant: H2O2)
Cells coming from stationary (disinfectant: NaOCl)
Cells coming from decline
(disinfectant: H2O2)
Cells coming from decline (disinfectant: NaOCl) 0 1 2 3 4 5 180 360 720
Incubation period (min) 0 1 2 3 4 5 180 360 720
Incubation period (min)
0 1 2 3 4 5 180 360 720
Incubation period (min) 0 1 2 3 4 5 180 360 720
Incubation period (min) 0 1 2 3 4 5 180 360 720
Incubation period (min)
C ells adher ed ( log (CFU/cm 2)) C ells adher ed ( log (CFU/cm 2)) C ells adher ed ( log (CFU/cm 2)) C ells adher ed ( log (CFU/cm 2)) C ells adher ed ( log (CFU/cm 2)) C ells adher ed ( log (CFU/cm 2)) C ells adher ed ( log (CFU/cm 2)) C ells adher ed ( log (CFU/cm 2)) 0 1 2 3 4 5 180 360 540 720 540
Incubation period (min)
0 1 2 3 4 5 180 360 720
Incubation period (min)
0 1 2 3 4 5 180 360 720
Incubation period (min)
growth phase growth phase growth phase growth phase
growth phase growth phase
540 540
540 540
540 540
Figure 1: Temporal evolution of cells adhered under static condition after the action of NaOCl and H2O2alone and in the mixture of the two disinfectants at different concentrations.
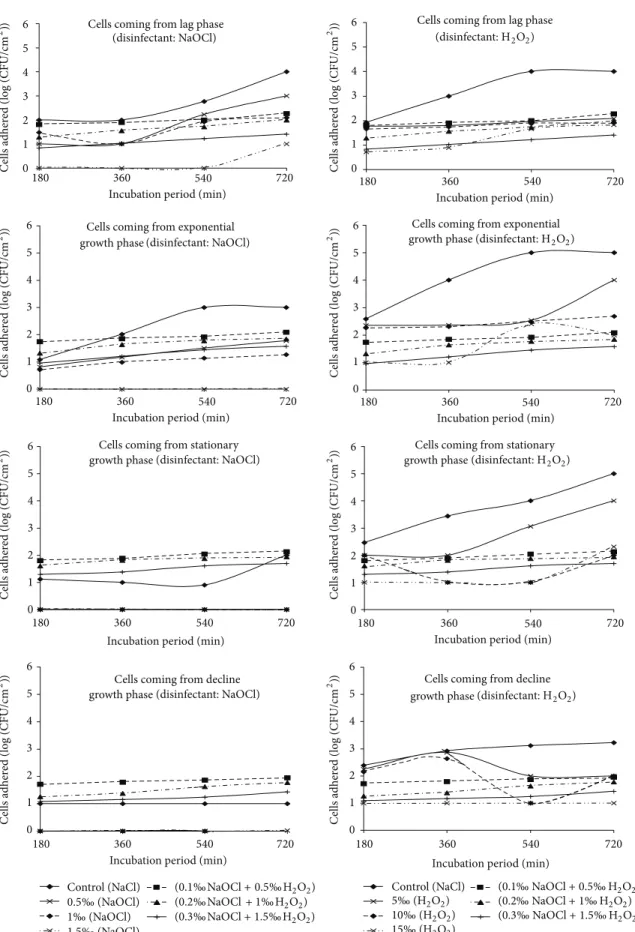
3.3. Abundance of Cells Adhered to Polythene after Action of Association of Disinfectants in Dynamic Regime. The
abun-dances of cells adhered ranged from 0.85 to 2.27 units (log
(CFU/cm2)) after the action of the mixture of NaOCl and
H2O2 under dynamic condition. The maximum abundance
of cells adhered was recorded in the presence of mixture of
0.1‰ NaOCl and 0.5‰ H2O2and this is after 720 minutes
with cells harvested from the lag growth phase.
The density of cells adhered under dynamic condition to the control substrate varied throughout from 2.35 to
3.25 units (log (CFU/cm2)) from the lag phase and was
always superior to those fragments tested for disinfection. In addition, they increase with the incubation duration. The maximum cell abundance was recorded in the presence of the
mixture of 0.1‰ NaOCl and 0.5‰ H2O2 after an adhesion
test of 720 minutes. The lowest density of adhered cells was observed in the presence of the mixture of 0.3‰ NaOCl and
1.5‰ H2O2with cells coming from the adhesion tests of 180
minutes (Figure 2). After action of the mixture of NaOCl and
H2O2, the densities of cells adhered ranged from 0.85 to 2.27
units (log (CFU/cm2)). The effectiveness of the mixture of
NaOCl and H2O2decreased with the length of the adhesion
test duration.
Abundance of cells adhered under dynamic condition to control substrate during the exponential growth phase was lower than that tested for disinfection in the lag growth phase under the same condition. They generally fluctuated between
2.47 and 3.19 units (log (CFU/cm2)). After disinfection test,
it was noted that the effectiveness of the mixture of NaOCl
and H2O2 decreased when the duration of adhesion test
increased. Abundance of cells adhered ranged between 0.95
and 2.09 units (log (CFU/cm2)) (Figure 2). The maximum
cell abundance was recorded in presence of mixture of
0.1‰ NaOCl and 0.5‰ H2O2 after an adhesion test of 720
minutes. The minimum density of adhered cells was observed
in the presence of mixture of 0.3‰ NaOCl and 1.5‰ H2O2
with cells coming from the adhesion tests of 180 minutes (Figure 2).
The abundance of cells adhered in dynamic regime to the control substrate varied from 2.35 to 2.74 units (log
(CFU/cm2)) during the stationary growth phase. It remained
higher than those of fragments tested for disinfection. After disinfection test, abundance of cells adhered ranged between
1.30 and 2.13 units (log (CFU/cm2)). As the duration of
adhesion test increased, it was noted that the effectiveness of
the mixture of NaOCl and H2O2 decreased. The maximum
density of cells adhered to the polythene was recorded in
the presence of the mixture of 0.3‰ NaOCl and 1.5‰ H2O2
after 720 minutes incubation duration, whereas the minimum density was observed in the presence of the mixture of
0.3‰ NaOCl and 1.5‰ H2O2 after 180 minutes incubation
duration (Figure 2).
Density of cells adhered in dynamic condition to the control substrate during the decline growth phase varied
from 2.10 to 2.71 units (log (CFU/cm2)). Cells adhered after
the action of NaOCl were relatively high (Figure 2). The
maximum density of cells adhered to the polythene was recorded in the presence of the mixture of 0.3‰ NaOCl and
1.5‰ H2O2 after 720 minutes incubation duration and the
minimum in the presence of the mixture of 0.3‰ NaOCl and
1.5‰ H2O2after 180 minutes incubation (Figure 2).
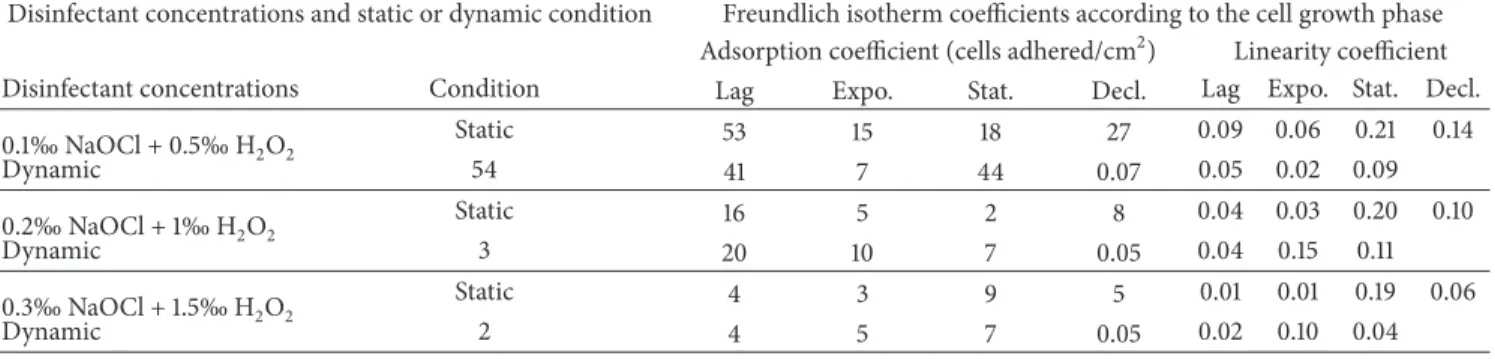
3.4. Freundlich Isotherms of Cells Adsorption. Freundlich
isotherms were constructed by considering only the combi-nation concentrations, the number of cells adhered to the substrate, subjected to the test of disinfection, and obtained without exposure to the mixture of disinfectants for each stage of cell growth and each experimental condition. The
Freundlich isotherms are shown inFigure 3. It can be noted
that, no matter which growth stage cells are, the appearance of the isotherms differs from one incubation condition to
another. The linearity coefficient𝑙/𝑛 which is related to the
adsorption intensity ranged from 0.01 to 0.21 and from 0.02 to 0.15, respectively, under static and dynamic incubation
conditions. The adsorption coefficient𝐾𝑓which is related to
the adsorption capacity ranged between 2 and 53 and between 2 and 54 cells adhered, respectively, under static and dynamic incubation conditions. The adsorption coefficient for the lag growth phase ranged between 4 and 53 and between 2 and 54 cells adhered, respectively, under static and dynamic
conditions (Table 2). The lowest adsorption coefficient after
the mixture of disinfectant treatment was obtained with cell
harvested from the lag growth phase (Table 2).
When considering each experimental condition, the adsorption coefficient of cells harvested from the lag phase was relatively higher after the mixture of disinfectant treat-ment than that of cell harvested from the other cells growth
phases (Table 2). It was also noted that for the whole cell
growth phases and the whole incubation conditions, the adsorption coefficient values were relatively higher with the
mixture of 0.1‰ NaOCl and 0.5‰ H2O2concentration than
those of the two other mixture of disinfectant concentrations (Table 2).
3.5. Correlation Coefficients between the Abundance of Cells Adhered and Incubation Durations and Concentrations of Disinfectants. Spearman “𝑟” correlation coefficients between
the abundances of cells adhered and incubation durations for each concentration of mixture of disinfectant and each
exper-imental condition were assessed and are presented inTable 3.
It is noted that the increase in the incubation durations caused a significant decrease in the efficiency of 0.3‰ NaOCl and
0.3‰ H2O2mixture of disinfectant concentration (𝑃 < 0.01).
This could result in higher abundance of cells adhered as the duration of the cell adhesion process increased.
Spearman “𝑟” correlation coefficients between abundance of cells adhered and concentrations of the mixture dis-infectants for each incubation duration and under each
experimental condition were also assessed (Table 4). Under
static as well as dynamic condition, it was noted that the effectiveness of the mixture of disinfectant concentrations on cells adhered to polythene increased leading to a significant decrease (𝑃 < 0.01) in the abundance of bacteria adhered after disinfection treatment.
The degrees of relationship between the mixture of disinfectant concentrations and abundance of cells adhered
Control (NaCl) 0.5‰(NaOCl) 1‰(NaOCl) 1.5‰(NaOCl) (0.1‰NaOCl+ 0.5‰H2O2) (0.2‰NaOCl+ 1‰H2O2) (0.3‰NaOCl+ 1.5‰H2O2) Control (NaCl) 5‰(H2O2) 10‰(H2O2) 15‰(H2O2) (0.1‰NaOCl+ 0.5‰H2O2) (0.2‰NaOCl+ 1‰H2O2) (0.3‰NaOCl+ 1.5‰H2O2)
Cells coming from lag phase
(disinfectant: H2O2)
Cells coming from lag phase (disinfectant: NaOCl)
Cells coming from exponential
(disinfectant: H2O2)
Cells coming from exponential (disinfectant: NaOCl)
Cells coming from stationary
(disinfectant: H2O2)
Cells coming from stationary (disinfectant: NaOCl)
Cells coming from decline
(disinfectant: H2O2)
Cells coming from decline (disinfectant: NaOCl)
180 360 720
Incubation period (min)
180 360 720
Incubation period (min)
180 360 720
Incubation period (min)
180 360 720
Incubation period (min)
180 360 720
Incubation period (min)
180 360 720
Incubation period (min) 180 Incubation period (min)360 720
0 1 2 3 4 5 6 180 360 720
Incubation period (min) 0 1 2 3 4 5 6 0 1 2 3 4 5 6 0 1 2 3 4 5 6 0 1 2 3 4 5 6 0 1 2 3 4 5 6 0 1 2 3 4 5 6 0 1 2 3 4 5 6 540 540 540 540 540 540 540 540 C ells adher ed ( log (CFU/cm 2)) C ells adher ed ( log (CFU/cm 2)) C ells adher ed ( log (CFU/cm 2)) C ells adher ed ( log (CFU/cm 2)) C ells adher ed ( log (CFU/cm 2)) C ells adher ed ( log (CFU/cm 2)) C ells adher ed ( log (CFU/cm 2)) C ells adher ed ( log (CFU/cm 2)) growth phase growth phase growth phase growth phase growth phase growth phase
Figure 2: Temporal evolution of cells adhered under dynamic condition after the action of NaOCl and H2O2alone and in the mixture of the two disinfectants at different concentrations.
0.1% NaOCl + 0.5‰H2O2(stat.) 0.2% NaOCl + 1‰H2O2(stat.) 0.3% NaOCl + 1.5‰H2O2(stat.) 0 10 20 30 40 50 60 70 150 300 450 600 750 900 0 10 20 30 40 50 60 70 80 90 75 125 175 225 275 325 0 10 20 30 40 50 60 70 80 90 75 125 175 225 275 325 375 0.1% NaOCl + 0.5‰H2O2(dyna.) 0.2% NaOCl + 1‰H2O2(dyna.) 0.3% NaOCl + 1.5‰H2O2(dyna.) 0 20 40 60 80 100 120 140 200 500 800 1100 1400 1700 0 20 40 60 80 100 120 140 160 200 300 400 500 600 0 10 20 30 40 50 60 70 80 90 100 100 250 400 550 B1 B2 C1 C2 D1 D2
Abundance of cells adhered/cm2in the
NaCl solution
Abundance of cells adhered/cm2in the
NaCl solution
Abundance of cells adhered/cm2in the
NaCl solution
Abundance of cells adhered/cm2in the
NaCl solution
Abundance of cells adhered/cm2in the
NaCl solution
Abundance of cells adhered/cm2in the
NaCl solution A b unda nce o f cells adher ed/cm 2in t h e mixt ur e o f disinf ec ta n ts A b unda nce o f cells adher ed/cm 2in t h e mixt ur e o f disinf ec ta n ts A b unda nce o f cells adher ed/cm 2in t h e mixt ur e o f disinf ec ta n ts A b unda nce o f cells adher ed/cm 2in t h e mixt ur e o f disinf ec ta n ts A b unda nce o f cells adher ed/cm 2in t h e mixt ur e o f disinf ec ta n ts A b unda nce o f cells adher ed/cm 2in t h e mixt ur e o f disinf ec ta n ts 0 50 100 150 200 250 100 600 1100 1600 0 20 40 60 80 100 120 140 160 180 200 100 600 1100 1600 2100 A1 A2
Abundance of cells adhered/cm2in the
NaCl solution
Abundance of cells adhered/cm2in the
NaCl solution A b unda nce o f cells adher ed/cm 2 in t h e mixt ur e o f disinf ec ta n ts A b unda nce o f cells adher ed/cm 2in t h e mixt ur e o f disinf ec ta n ts
Figure 3: Freundlich isotherms for cells absorption under static (A1, B1, C1, and D1) and dynamic (A2, B2, C2, and D2) conditions in the presence of the mixture of NaOCl and H2O2(lag growth phase (A1, A2), exponential growth phase (B1, B2), stationary growth phase (C1, C2), and decline growth phase (D1, D2)).
Table 2: Values of adsorption coefficient (𝐾𝑓) (adhered A. hydrophila/mL of mixture of disinfectant) and linearity coefficient (𝑙/𝑛) of
isotherms under static and dynamic conditions, when using different disinfectants concentrations.
Disinfectant concentrations and static or dynamic condition Freundlich isotherm coefficients according to the cell growth phase Adsorption coefficient (cells adhered/cm2) Linearity coefficient Disinfectant concentrations Condition Lag Expo. Stat. Decl. Lag Expo. Stat. Decl. 0.1‰ NaOCl + 0.5‰ H2O2 Static 53 15 18 27 0.09 0.06 0.21 0.14 Dynamic 54 41 7 44 0.07 0.05 0.02 0.09 0.2‰ NaOCl + 1‰ H2O2 Static 16 5 2 8 0.04 0.03 0.20 0.10 Dynamic 3 20 10 7 0.05 0.04 0.15 0.11 0.3‰ NaOCl + 1.5‰ H2O2 Static 4 3 9 5 0.01 0.01 0.19 0.06 Dynamic 2 4 5 7 0.05 0.02 0.10 0.04
Table 3: Spearman “𝑟” correlation coefficients between the abundances of adhered A. hydrophila and incubation durations for each concentration of mixture of disinfectant and each experimental condition.
Experimental condition Mixtures of disinfectant concentrations
0.1‰ NaOCl + 0.5‰ H2O2 0.2‰ NaOCl + 1‰ H2O2 0.3‰ NaOCl + 0.3‰ H2O2
Static 0.800 −0.200 −0.400∗∗
Dynamic 0.400 0.632 −0.949∗∗
∗∗𝑃 < 0.01; ddl = 15.
Table 4: Spearman “𝑟” correlation coefficients between the abun-dance of adhered A. hydrophila and concentration of mixture of dis-infectant for each incubation duration and under each experimental condition.
Experimental condition Incubation durations
180 min 360 min 540 min 720 min Static 1.000∗∗ 1.000∗∗ 1.000∗∗ 1.000∗∗ Dynamic 1.000∗∗ 1.000∗∗ 1.000∗∗ 1.000∗∗
∗∗𝑃 < 0.01; ddl = 15.
harvested from each growth stage were also assessed (Table
5). It resulted that an increase in the mixture of disinfectant
concentration significantly increased (𝑃 < 0.01) the abun-dance of cells adhered to the substrate, with cell harvested from each cell growth phase.
3.6. Comparison of the Mean Abundance of Cells Adhered amongst the Different Stages of Cell Growth. The𝐻 test of
Kruskal-Wallis was performed in order to compare the mean abundance of cells adhered harvested from different cell growth stages and considering each mixture of disinfectants concentrations. It showed that there is an overall significant difference (𝑃 < 0.05) between the mean abundance of cells adhered to polythene for each mixture of disinfectant con-centration at different cell growth stages. The pair two-by-two comparisons of the mean abundances were then performed
using the𝑈 test of Mann-Whitney. It was noted that, at each
cell growth stage, there was a significant difference (𝑃 < 0.05) amongst the mean abundance of cells adhered after the action of various mixture of disinfectant concentrations with cells coming from each cell growth phase. With the mixture of
0.1‰ NaOCl and 0.5‰ H2O2and that of 0.3‰ NaOCl and
1.5‰ H2O2, a nonsignificant difference was observed only
with cells harvested from the stationary cell growth phase
(𝑃 ≥ 0.05) (Table 6).
4. Discussion
The aim of this study was to determine the synergistic effect
of NaOCl and H2O2on A. hydrophila adhered to polythene
immersed in water under static and dynamic conditions. By contrast, most previous studies have indicated only the effect
of NaOCl on one hand and that of H2O2on the other hand
on the adhesion of A. hydrophila to polythene [18, 32,33].
From the 9 pairs of concentration of disinfectants used for the preparation of mixture of disinfectants, three couples
(0.1‰ NaOCl + 0.5‰ H2O2; 0.2‰ NaOCl + 1‰ H2O2; and
0.3‰ NaOCl + 1.5‰ H2O2) were used to evaluate the
syn-ergy as they presented an FBC equal to 0.3. A synsyn-ergy is declared when a value of FBC is less than or equal to 0.50
[26].
The present study showed that the overall abundance of cells adhered to polythene after the action of the mixture of two disinfectants was lower than that obtained after
the action of H2O2 alone. Abundance of cells adhered to
polythene ranged from 0.30 to 2.29 and 0.85 to 2.27 units
(log (CFU/cm2)) after the action of the mixture of NaOCl
and H2O2under static and dynamic conditions, respectively.
Previous studies showed that they sometimes reached 2.41
and 3.39 units (log (CFU/cm2)) after the action of NaOCl
and H2O2, respectively [18]. These results suggest that the
combination of NaOCl and H2O2 leads to a significant
synergy in eliminating cells adhered to polythene. This has
been also suggested in previous studies [34].
Abundance of cells adhered to polythene after the action
of the mixture of NaOCl and H2O2 was relatively higher
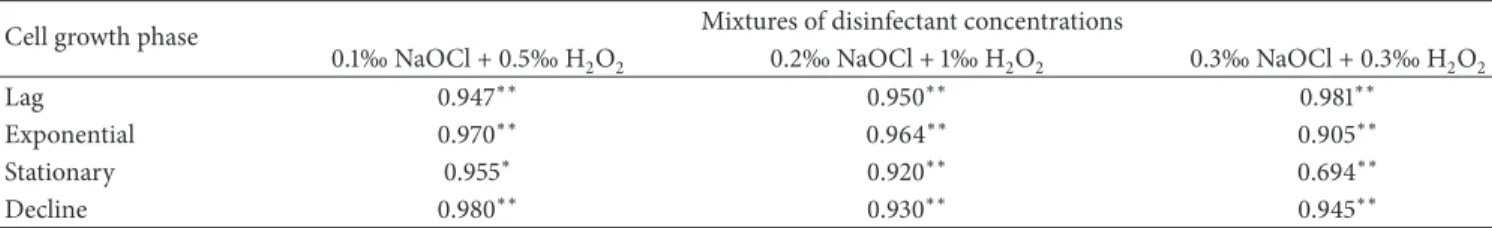
Table 5: Spearman “𝑟” correlation coefficients between the abundance of adhered A. hydrophila and incubation durations for each concentration of the mixture of disinfectant and each cell growth phase.
Cell growth phase Mixtures of disinfectant concentrations
0.1‰ NaOCl + 0.5‰ H2O2 0.2‰ NaOCl + 1‰ H2O2 0.3‰ NaOCl + 0.3‰ H2O2
Lag 0.947∗∗ 0.950∗∗ 0.981∗∗
Exponential 0.970∗∗ 0.964∗∗ 0.905∗∗
Stationary 0.955∗ 0.920∗∗ 0.694∗∗
Decline 0.980∗∗ 0.930∗∗ 0.945∗∗
∗∗𝑃 < 0.01;∗𝑃 < 0.05; ddl = 31.
Table 6: Comparison amongst abundance of A. hydrophila harvested from different cell growth stages in the presence of each mixture of disinfectant concentrations.
Cell growth phase Mixtures of disinfectant concentrations
0.1‰ NaOCl + 0.5‰ H2O2 0.2‰ NaOCl + 1‰ H2O2 0.3‰ NaOCl + 1.5‰ H2O2
Lag 𝑃 = 0.015∗ 𝑃 = 0.000∗ 𝑃 = 0.005∗
Exponential 𝑃 = 0.050∗ 𝑃 = 0.001∗ 𝑃 = 0.038∗
Stationary 𝑃 = 0.161 𝑃 = 0.003∗ 𝑃 = 0.065
Decline 𝑃 = 0.007∗ 𝑃 = 0.000∗ 𝑃 = 0.021∗
∗𝑃 < 0.05; ddl = 92.
The maximum abundance of cells adhered to polythene was recorded under static condition in the presence of the mixture
of 0.1‰ NaOCl and 0.5‰ H2O2and this is after 720 minutes
with cells obtained in the lag growth phase (Figures1and2).
That obtained after the action of NaOCl was recorded during the lag phase under dynamic condition in the presence of 0.5‰ concentrations of NaOCl and this is after an adhesion test of 720 minutes. By cons, the abundance of cells adhered to
polythene after the action of the mixture of NaOCl and H2O2
was considerably lower than those obtained after the action
of H2O2.
The maximum abundance of cells adhered after the
action of H2O2 was recorded during the stationary growth
phase under static condition in the presence of 5‰ H2O2
concentration after the same period of adhesion test. Due to its highly oxidizing capacity-based production of free radicals
that affect the biofilms matrix H2O2was chosen to fight
effec-tively against biofilms formation [35,36]. In addition, H2O2
was chosen as it is highly effective disinfectant in inhibiting biofilms formation at a concentration of 0.05%. It can also destroy mature biofilms at concentrations between 0.08% and
0.2% [37]. The reaction between NaOCl and H2O2produces
singlet oxygen (1O2), which is a powerful oxidant that rapidly
kills bacterial cells. In addition, oxygen singlet short lifespan (100 nanoseconds in lipid media and 50 nanoseconds in the cytoplasm) can diffuse a short distance and react with certain amino acids leading to structural and functional alteration
of the membrane causing lipoperoxidation [13]. NaOCl and
H2O2inhibit the Brownian motion and control the growth of
the microbial population [34].
The adhesion of microorganisms to surfaces is the first step in biofilms formation, which is a form of microbial
life in aquatic environments [38]. The latter is the source
of problems bioburden in various fields such as health,
environment, food industry, and water purification [31, 39,
40]. Adhesion is governed by physicochemical interactions
of the Van Der Waals and Lewis acid-base types. Fluctuating velocities of adhesion of cells observed during different stages of growth in stationary and dynamic regimes could be explained by changes in the physiology of bacterium
at each stage of growth [41,42]. There are three strategies
against biofilms formation: (i) the disinfection time before the biofilms develop, (ii) the disinfection of biofilms using aggressive disinfectants, and (iii) inhibition fixing microbes choosing surface materials that do not promote adherence
[43].
By considering separately each condition, it was noted that the increase in incubation durations resulted in a signifi-cant decrease (𝑃 < 0.01) in the effectiveness of the mixture
of 0.3‰ NaOCl and 1.5‰ H2O2 (Table 3). This resulted in
higher abundance of cells. Indeed, a biofilm can be developed within in a few hours, allowing bacteria therein to become
resistant to external agents causing any contamination [44,
45]. In static as well as dynamic condition, increasing the
effectiveness of the mixture concentration of NaOCl and
H2O2on cells adhered to polythene resulted in a significant
decrease in abundance of cells adhered after disinfection test
(𝑃 < 0.01) (Figures1and2). The treatment of biofilms by
combining antimicrobial agents has a synergistic effect on the
removal of adherent bacterial cells [34]. Furthermore, this
variation of the reaction of cells against the combination of disinfectants may be related to changes in the surface due to
a change in their growth phase [46].
It was also noted that for each incubation period and each cell growth phase, a rise in the concentration of disinfectant mixture increases significantly (𝑃 < 0.01) the abundance of
cells adhered to the substrate (Table 4). Face with
strategy [47, 48]. For each cell growth phase, a significant difference was observed between the mean densities of cells adhered after the action of the different concentrations of the mixture of disinfectants (𝑃 < 0.05). The effectiveness of any method of disinfection depends on biotic factors such as the physiological state and the intrinsic microbial resistance
to lethal agents [49]. The age of the culture also plays an
important role since the adhesion of the bacterium is better during exponential growth phase than stationary growth
phase [50].
It is important to remember that bacteria in a biofilm have very different characteristics from their planktonic
counterparts including the production of exopolymers [51],
a significant increase in antimicrobial resistance and
envi-ronmental stress [52,53]. The matrix of exopolymers which
presents itself as a mechanical barrier, reducing the penetra-tion of environmental compounds through the biofilms, thus protects bacterial cells embedded in biofilm. This explains the fact that the increase in the concentration of the mixture of disinfectants for each stage of growth leads to a significant increase (𝑃 < 0.01) in abundance of cells adhered to the
substrates. The adsorption coefficient (𝐾𝑓) was relatively
higher in the static than in the dynamic regime no matter the cell growth phase or presence of a well-defined concentration of the mixture of disinfectant. Cells adhered to polythene under dynamic condition were more sensitive than that obtained with the two combined disinfectants under static condition. This could be explained by the structure of adhered
bacteria which depends on the hydrodynamic regime [54].
Enzymes produced by A. hydrophila are essentially proteases, esterases, and lyases. Although these enzymes often remain
qualitatively unchanged with bacterial growth phase [55],
they would quantitatively be modified from one cell growth stage to another.
5. Conclusion
This study showed that the combination of NaOCl and
H2O2 has a synergistic effect on cells adhered to polythene.
Abundance of cells adhered to polythene after the action of
the mixture of NaOCl and H2O2 is relatively higher than
that obtained after the action of NaOCl alone. By cons, it is
significantly lower than that obtained after the action of H2O2
alone. Under static as well as dynamic condition, an increase in the effectiveness of the concentrations of the mixture of
NaOCl and H2O2 on cells adhered is noted. For each cell
growth phase, the densities of cells adhered differed from a given concentration of a mixture of disinfectants to another.
Although the adsorption coefficient (𝐾𝑓) obtained from the
Freundlich isotherm is relatively higher in static state than in dynamic regime, cells adhered to polythene in the presence of the mixture of the two disinfectants under dynamic condition seem more sensitive than under static condition.
Conflict of Interests
The authors declare that they have no conflict of interests that could inappropriately influence this work.
References
[1] Comit´e f´ed´eral-provincial-territorial sur l’eau potable (Canada), “Conseils sur les bact´eries pathog`enes d’origine hydrique,” 2012, http://www.hc-sc.gc.ca/ewh-semt/alt formats/pdf/consult/ 2012/bacterial-bacteries/bacterial-bacteries-fra.pdf.
[2] P. Mouchet, A. Montiel, and S. Rigal, “D´egradations physico-chimiques de l’eau dans les r´eseaux de distribution,” TSM. L’Eau, vol. 87, pp. 299–306, 1992.
[3] D. Schoenen, “Role of disinfection in suppressing the spread of pathogens with drinking water: possibilities and limitations,”
Water Research, vol. 36, no. 15, pp. 3874–3888, 2002.
[4] K. Krovacek, A. Faris, S. B. Baloda, T. Lindberg, M. Peterz, and I. Mnsson, “Isolation and virulence profiles of Aeromonas spp. from different municipal drinking water supplies in Sweden,”
Food Microbiology, vol. 9, no. 3, pp. 215–222, 1992.
[5] A. A. Gavriel, J. P. B. Landre, and A. J. Lamb, “Incidence of mesophilic Aeromonas within a public drinking water supply in North-East Scotland,” Journal of Applied Microbiology, vol. 84, no. 3, pp. 383–392, 1998.
[6] J. Michael Janda and S. L. Abbott, “Evolving concepts regarding the genus Aeromonas: an expanding panorama of species, disease presentations, and unanswered questions,” Clinical
Infectious Diseases, vol. 27, no. 2, pp. 332–344, 1998.
[7] C. Chauret, C. Volk, R. Creason, J. Jarosh, J. Robinson, and C. Warnes, “Detection of Aeromonas hydrophila in a drinking-water distribution system: a field and pilot study,” Canadian
Journal of Microbiology, vol. 47, no. 8, pp. 782–786, 2001.
[8] G. E. El-Taweel and A. M. Shaban, “Microbiological quality of drinking water at eight water treatment plants,” International
Journal of Environmental Health Research, vol. 11, no. 4, pp. 285–
290, 2001.
[9] P. Payment, E. Franco, and J. Siemiatycki, “Absence of rela-tionship between health effects due to tap water consumption and drinking water quality parameters,” Water Science and
Technology, vol. 27, no. 3-4, pp. 137–143, 1993.
[10] R. H. W. Schubert, “Aeromonads and their significance as potential pathogens in water,” Journal of Applied Bacteriology, vol. 70, supplement, pp. 131S–135S, 1991.
[11] M. Cho, J. Kim, J. Y. Kim, J. Yoon, and J.-H. Kim, “Mechanisms of Escherichia coli inactivation by several disinfectants,” Water
Research, vol. 44, no. 11, pp. 3410–3418, 2010.
[12] S. Rondinini and A. Vertova, “Electroreduction of halogenated organic compounds,” in Electrochemistry For the Environment, pp. 279–306, 2010.
[13] T. Karu, L. Pyatibrat, and G. Kalendo, “Irradiation with He-Ne laser increases ATP level in cells cultivated in vitro,” Journal of
Photochemistry and Photobiology B, vol. 27, no. 3, pp. 219–223,
1995.
[14] O. J. Sproul, R. M. Pfister, and C. K. Kim, “The mechanism of ozone inactivation of water borne viruses,” Water Science and
Technology, vol. 14, no. 4-5, pp. 303–314, 1982.
[15] P.-C. Maness, S. Smolinski, D. M. Blake, Z. Huang, E. J. Wolfrum, and W. A. Jacoby, “Bactericidal activity of photo-catalytic TiO2reaction: toward an understanding of its killing mechanism,” Applied and Environmental Microbiology, vol. 65, no. 9, pp. 4094–4098, 1999.
[16] S. B. Young and P. Setlow, “Mechanisms of killing of Bacillus
subtilis spores by hypochlorite and chlorine dioxide,” Journal of Applied Microbiology, vol. 95, no. 1, pp. 54–67, 2003.
[17] K. Oguma, H. Katayama, H. Mitani, S. Morita, T. Hirata, and S. Ohgaki, “Determination of pyrimidine dimers in Escherichia
coli and Cryptosporidium parvum during UV light inactivation,
photoreactivation, and dark repair,” Applied and Environmental
Microbiology, vol. 67, no. 10, pp. 4630–4637, 2001.
[18] C. Lontsi Djimeli, M. Nola, A. Tamsa Arfao et al., “Effect of disinfectants on adhered Aeromonas hydrophila to polythene immersed in water under static and dynamic conditions,”
International Journal of Research in BioSciences, vol. 2, pp. 33–
48, 2013.
[19] N. Marchal, J. L. Bourdon, and C. Richard, Culture Media For
Isolation and Biochemical Identification of Bacteria, Doin, Paris,
France, 1991.
[20] APHA, Standard Methods for the Examination of Water and
Wastewater, American Public Health Association, Washington,
DC, USA, 21st edition, 2005.
[21] G. Holt, N. R. Krieg, P. H. A. Sneath, J. T. Staley, and S. T. Williams, Bergey’s Manual of Determinative Bacteriology, Lipponcott Williams and Wilkins, Philadelphia, Pa, USA, 9th edition, 2000.
[22] K. L. Coeyrehourcq, Etude de m´ethodes rapides d’analyse de la
structure mol´eculaire du poly´ethyl`ene [Th`ese de Doctorat], Ecole
des Mines de Paris Sp´ecialit´e Science et G´enie des Mat´eriaux, 2003.
[23] N. Boutaleb, Etude de la formation de biofilms sur les mat´eriaux
couramment utilis´es dans les canalisations d’eaux potables [Th`ese de Doctorat], Universit´e de Bretagne-sud, 2007.
[24] B. D. Ratner, “Plasma deposition of organic thin film-control of film chemistry,” Polymer Preprints, vol. 34, pp. 643–644, 1993. [25] B. D. Ratner, “Surface modification of polymers: chemical,
biological and surface analytical challenges,” Biosensors and
Bioelectronics, vol. 10, no. 9-10, pp. 797–804, 1995.
[26] P. Maris, “Modes of action of disinfectants,” in Disinfectants:
Actions and Applications, H. A. McDaniel, Ed., pp. 47–55, 1995.
[27] O. V. Noah Ewoti, M. Nola, L. M. Moungang, M. E. Nougang, F. Krier, and N. E. Chihib, “Adhesion of Escherichia coli and
Pseudomonas aeruginosa on rock surface in aquatic microcosm:
assessment of the influence of dissolved magnesium sulfate and monosodium phosphate,” Research Journal of Environmental
and Earth Sciences, vol. 3, no. 4, pp. 364–374, 2011.
[28] S. Dukam, P. Pirion, and Y. Levi, “Mod´elisation du d´eveloppe-ment des biomasses bact´eriennes libres et fix´ees en r´eseau de distribution d’eau potable,” in Adh´esion des Microorganismes
aux Surfaces, M. N. Bellon-Fontaine and J. Fourniat, Eds., pp.
149–160, 1995.
[29] O. V. Noah Ewoti, R´etention des bact´eries dans le sol et sur des
fragments de roches en milieu aquatique : influence du type de cellule et de quelques param`etres chimiques de l’environnement [Th`ese], Universit´e de Yaound´e I, 2012.
[30] M. J. Miller, M. M. Critchley, J. Hutson, and H. J. Fallowfield, “The adsorption of cyanobacterial hepatotoxins from water onto soil during batch experiments,” Water Research, vol. 35, no. 6, pp. 1461–1468, 2001.
[31] I.-W. Wang, J. M. Anderson, M. R. Jacobs, and R. E. Marchant, “Adhesion of Staphylococcus epidermidis to biomedical poly-mers: contributions of surface thermodynamics and hemo-dynamic shear conditions,” Journal of Biomedical Materials
Research, vol. 29, no. 4, pp. 485–493, 1995.
[32] V. Singamaneni, G. Madiraju, and H. Sura, “In vitro effectiveness of different endodontic irrigants on the reduction of
Enterococ-cus faecalis in root canals,” Clinical and Experimental Dentistry,
vol. 2, no. 4, pp. 169–172, 2010.
[33] K. Tot´e, T. Horemans, D. Vanden Berghe, L. Maes, and P. Cos, “Inhibitory effect of biocides on the viable masses and matrices of Staphylococcus aureus and Pseudomonas aeruginosa biofilms,” Applied and Environmental Microbiology, vol. 76, no. 10, pp. 3135–3142, 2010.
[34] J.-H. Ha, S.-H. Jeong, and S.-D. Ha, “Synergistic effects of combined disinfection using sanitizers and uv to reduce the levels of Staphylococcus aureus in oyster mushrooms,” Journal
of Applied Biological Chemistry, vol. 54, no. 3, pp. 447–453, 2011.
[35] C. C. C. R. de Carvalho, “Biofilms: recent developments on an old battle,” Recent patents on biotechnology, vol. 1, no. 1, pp. 49– 57, 2007.
[36] C. C. C. R. De Carvalho and M. M. R. Da Fonseca, “Assessment of three-dimensional biofilm structure using an optical micro-scope,” BioTechniques, vol. 42, no. 5, pp. 616–620, 2007. [37] M. N. N. N. Shikongo-Nambabi, B. Kachigunda, and S. N.
Venter, “Evaluation of oxidising disinfectants to control Vibrio biofilms in treated seawater used for fish processing,” Water SA, vol. 36, no. 3, pp. 215–220, 2010.
[38] R. M. Donlan, “Biofilms: microbial life on surfaces,” Emerging
Infectious Diseases, vol. 8, no. 9, pp. 881–890, 2002.
[39] N. Y. Jayasekara, G. M. Heard, J. M. Cox, and G. H. Fleet, “Association of micro-organisms with the inner surfaces of bottles of non-carbonated mineral waters,” Food Microbiology, vol. 16, no. 2, pp. 115–128, 1999.
[40] B. A. Jucker, H. Harms, and A. J. B. Zehnder, “Adhesion of the positively charged bacterium Stenotrophomonas
(Xan-thomonas) maltophilia 70401 to glass and teflon,” Journal of Bacteriology, vol. 178, no. 18, pp. 5472–5479, 1996.
[41] G. A. O’Toole and R. Kolter, “Flagellar and twitching motility are necessary for Pseudomonas aeruginosa biofilm develop-ment,” Molecular Microbiology, vol. 30, no. 2, pp. 295–304, 1998. [42] S. Parot, Electroactifs: formation, caract´erisation et m´ecanismes
[Th`ese], Institut National polytechnique de Toulouse, 2007.
[43] B. Meyer, “Approaches to prevention, removal and killing of biofilms,” International Biodeterioration and Biodegradation, vol. 51, no. 4, pp. 249–253, 2003.
[44] I. B. Beech and C. L. M. Coutinho, “Biofilms on corroding materials,” in Biofilms in Medicine, P. Lens, A. P. Moran, T. Mahony, P. Stoodley, and V. O’Flaherty, Eds., 2003.
[45] I. B. Beech and J. Sunner, “Biocorrosion: towards understanding interactions between biofilms and metals,” Current Opinion in
Biotechnology, vol. 15, no. 3, pp. 181–186, 2004.
[46] R. Briandet, Maˆıtrise de l’hygi`ene des surfaces par la cr´eation des
biofilms-Aspects physico-chimiques [Th`ese de Doctorat], Ecole
Nationale Sup´erieure Agronomique de Rennes, Rennes, France, 1999.
[47] S. Stepanovi´c, I. ´Cirkovi´c, V. Mijaˇc, and M. ˇSvabi´c-Vlahovi´c, “Influence of the incubation temperature, atmosphere and dynamic conditions on biofilm formation by Salmonella spp,”
Food Microbiology, vol. 20, no. 3, pp. 339–343, 2003.
[48] S. Stepanovi´c, I. ´Cirkovi´c, L. Ranin, and M. ˇSvabi´c-Vlahovi´c, “Biofilm formation by Salmonella spp. and Listeria
monocyto-genes on plastic surface,” Letters in Applied Microbiology, vol. 38,
no. 5, pp. 428–432, 2004.
[49] R. Patel, “Biofilms and antimicrobial resistance,” Clinical
Orthopaedics and Related Research, no. 437, pp. 41–47, 2005.
[50] P. M. Stanley, “Factors affecting the irreversible attachment of
Pseudomonas aeruginosa to stainless steel,” Canadian Journal of Microbiology, vol. 29, no. 11, pp. 1493–1499, 1983.
[51] M. R. Parsek and E. P. Greenberg, “Acyl-homoserine lac-tone quorum sensing in Gram-negative bacteria: a signaling mechanism involved in associations with higher organisms,”
Proceedings of the National Academy of Sciences of the United States of America, vol. 97, no. 16, pp. 8789–8793, 2000.
[52] T.-F. C. Mah and G. A. O’Toole, “Mechanisms of biofilm resistance to antimicrobial agents,” Trends in Microbiology, vol. 9, no. 1, pp. 34–39, 2001.
[53] C. Campanac, L. Pineau, A. Payard, G. Baziard-Mouysset, and C. Roques, “Interactions between biocide cationic agents and bacterial biofilms,” Antimicrobial Agents and Chemotherapy, vol. 46, no. 5, pp. 1469–1474, 2002.
[54] M. Klausen, M. Gjermansen, J.-U. Kreft, and T. Tolker-Nielsen, “Dynamics of development and dispersal in sessile microbial communities: examples from Pseudomonas aeruginosa and
Pseudomonas putida model biofilms,” FEMS Microbiology Let-ters, vol. 261, no. 1, pp. 1–11, 2006.
[55] D. B¨uttner and U. Bonas, “Getting across: Bacterial type III effector proteins on their way to the plant cell,” The EMBO
Submit your manuscripts at
http://www.hindawi.com
Hindawi Publishing Corporation
http://www.hindawi.com Volume 2014
Anatomy
Research International
Peptides
Hindawi Publishing Corporation
http://www.hindawi.com Volume 2014
Hindawi Publishing Corporation http://www.hindawi.com
International Journal of
Volume 2014
Zoology
Hindawi Publishing Corporation
http://www.hindawi.com Volume 2014 Molecular Biology International
Hindawi Publishing Corporation http://www.hindawi.com
Genomics
Volume 2014
The Scientific
World Journal
Hindawi Publishing Corporation
http://www.hindawi.com Volume 2014
Hindawi Publishing Corporation
http://www.hindawi.com Volume 2014
Bioinformatics
Advances inMarine Biology
Journal ofHindawi Publishing Corporation
http://www.hindawi.com Volume 2014
Hindawi Publishing Corporation
http://www.hindawi.com Volume 2014
Signal Transduction
Journal ofInternational
Hindawi Publishing Corporation
http://www.hindawi.com Volume 2014
Evolutionary Biology International Journal of Hindawi Publishing Corporation
http://www.hindawi.com Volume 2014
Hindawi Publishing Corporation
http://www.hindawi.com Volume 2014
Biochemistry Research International
Archaea
Hindawi Publishing Corporation
http://www.hindawi.com Volume 2014
Hindawi Publishing Corporation
http://www.hindawi.com Volume 2014
Genetics
Research International
Hindawi Publishing Corporation
http://www.hindawi.com Volume 2014 Advances in
Virology
Hindawi Publishing Corporation http://www.hindawi.com
Nucleic Acids
Journal ofVolume 2014
Stem Cells
International
Hindawi Publishing Corporation
http://www.hindawi.com Volume 2014
Hindawi Publishing Corporation
http://www.hindawi.com Volume 2014
Enzyme
Research
Hindawi Publishing Corporation
http://www.hindawi.com Volume 2014
International Journal of