HAL Id: halshs-00553600
https://halshs.archives-ouvertes.fr/halshs-00553600
Preprint submitted on 7 Jan 2011
HAL is a multi-disciplinary open access archive for the deposit and dissemination of sci-entific research documents, whether they are pub-lished or not. The documents may come from teaching and research institutions in France or abroad, or from public or private research centers.
L’archive ouverte pluridisciplinaire HAL, est destinée au dépôt et à la diffusion de documents scientifiques de niveau recherche, publiés ou non, émanant des établissements d’enseignement et de recherche français ou étrangers, des laboratoires publics ou privés.
Céline Carrere, Jaime Melo De
To cite this version:
Céline Carrere, Jaime Melo De. Notes on Detecting the Effects of Non Tariff Measures. 2011. �halshs-00553600�
1
Document de travail de la série Etudes et Documents E 2009.32
N
N
O
O
T
T
E
E
S
S
O
O
N
N
D
D
E
E
T
T
E
E
C
C
T
T
I
I
N
N
G
G
T
T
H
H
E
E
E
E
F
F
F
F
E
E
C
C
T
T
S
S
O
O
F
F
N
N
O
O
N
N
T
T
A
A
R
R
I
I
F
F
F
F
M
M
E
E
A
A
S
S
U
U
R
R
E
E
S
S
by Céline Carrère CERDI-CNRS and Jaime de MeloUniversity of Geneva and CERDI December 2009
2 Abstract
Alternative approaches to estimating the effects of non-tariff measures (NTMs) on trade flows are discussed and evaluated critically. Recent econometric studies point to three results: (i) NTM restrictiveness measures based on an aggregate of ‘core’ NTMs are more restrictive than existing tariffs and, because of export composition towards agricultural products, in the aggregate, these ‘core’ NTMs limit market-access most for low-income countries; (ii) Proxies for individual NTMs, have a negative effect on the volume of bilateral trade for the detailed product under scrutiny; (iii) harmonization of standards is trade enhancing. Case studies confirm several of these patterns, and also that perceived severity of NTMs varies across products and across destinations for a given product. Across broadly-defined
imports at the section level, NTMs are more restrictive than the corresponding tariffs with two-thirds of the AVE estimates in the 25%-50% range. Technical regulations and non-automatic licensing are the most used single-NTM measures and the restrictiveness of technical regulations increases with income per capita.
3 1. Introduction
In the field of growth, the lack of robustness of cross-section studies is now well-documented. This lack of robustness has contributed to the newer diagnostic-oriented approach to policy reform which is suspicious of ‘best-practices’ where expectations are based on the traditional presumptive approach to reforms (‘we know how markets work and here is the list of reforms to be carried out’).1 This diagnosis in the field of the determinants of growth carries over to international trade policy and to the effects of Non-tariff Measures (NTMs2) on international trade. Whereas, until recently, NTMs were mostly dominated by QRs or VERs both of which were almost always welfare-reducing and hence ‘actionable’, with the proliferation of NTMs, this clear-cut diagnosis no longer holds. As a result, it is recognized that detecting the effects of NTMs in view of taking policy measures to eliminate those that are purely protectionist (in the sense of welfare-reducing) is difficult. The diagnosis is
complicated by the fact that the effect of NTMs on the volume of trade (and on welfare) is also likely to depend on other behind-the-border (BTB) barriers to trade, themselves difficult to measure and to discern from NTMs (an NTM measure can be amplified if it is on a product also facing a significant BTB measure).
This note reviews the methodologies used to detect the effects of NTMs on imports and offers (partial) new evidence, concentrating on measuring tariff equivalent effects which serve as a (partial) basis for any subsequent welfare analysis. Issues related to the welfare effects and to policy implications are taken up in our companion note. Section 2 reviews critically the different modeling approaches to measuring the effects of NTMs. Section 3 reports the results from the growing number of studies relying on the models reviewed in section 2. These studies draw on the global
UNCTAD NTM data base of 2002-04, but also on the rapidly growing data bases on various trade facilitation measures used to measure the importance of BTB. Section 4 completes the paper with additional exploratory tabulations across products and across NTMs. Section 5 concludes.
1 The huge success of this agnostic approach is exemplified in the recent outburst of randomized
control trials for the evaluation of projects and of aid programs. Unfortunately randomized control trials cannot be applied to evaluate the impact of trade policy reforms for lack of natural control groups.
2 Some make a distinction between an NTM and NTB reserving the use of NTBs as a measure of
protection. Previously most NTMs were QRs which explains why the word NTB was often used to encompass all non-tariff measures. It may therefore be preferable to use NTM instead of NTB to underline that the measure may not be necessarily welfare-reducing, but we follow tradition and will, at times use NTB.
4
2. Model-based Approaches to Detecting the Effects of NTMs
The systematic analysis of the effects of NTMS has focused on evaluating their ad-valorem equivalents (i.e. on tariffs that would reduce imports by the same amount as the NTM in question) and on their effects on the volume of trade. Two modeling approaches have been used in the literature. One draws estimates using the gravity model of trade, often focusing on the effects of NTBs on the volume of aggregate bilateral trade. The other, draws on the factor-endowment-based theories of trade focusing on the volume of trade at the product level where import volumes are correlated with factor endowments, country characteristics, tariffs and various proxies of NTBs. We review briefly each approach.
2.1 The Gravity Approach to NTM measurement
We start with the ubiquitous gravity model, most often used to examine the effects of NTBs. While many applications stick to the gravity equation for the volume of
aggregate trade, the interest here is on a comparison of NTM measures at the product level so we formulate directly the disaggregated version (see e.g. Anderson and Van Wincoop, 2004 or Feenstra, 2004). Then, the volume of bilateral trade for good k between i and j is given by:
(
)
lnXijk =ai +bj − 1−
σ
lntijk +ε
ij (1) where Xkij represents the export flows of good k from country i to importer j (valued at cif prices), tkij represents all (gross) bilateral “trade costs”, σ the elasticity of substitution for good-class k, ai and bj are country (exporter and importer) fixed effects that capture all characteristics that are specific to each pair (GDPs, population, etc...) and εijis a normally distributed error term. The associated trade costs function for good k between i and j, tij, is expressed as:(
)
lntijk =ln 1+Tijk +
γ
lnNTMijk +δ
lnDij+∑
θ
nDUMijn+ν
ij (2) i.e. trade costs are stipulated to be a function of the tariff rate on product k imported by country j from i, Tkij, and of an average NTM index of importer j against exporter i, NTMkij, the bilateral distance between the economic center of countries i and j, Dij, and a set of control variables (usually dummy variables having the value of 1 if countries i and j share a common land border, an economic integration agreement, are on the same continent, or share the same primary language).Substituting (2) into (1) yields the model used to predict the effects of NTMs on the volume of bilateral trade. The problems start here. First, the gravity model works better for aggregate trade than for trade at the product-line level. This is important since we are mostly interested in the relative importance of various NTMs by sector of activity or, even better, at the product-level. Such estimates then need to be carried out at the product level where NTMs they differ across categories of products. For example, a technical regulation will imposed on chemical products but not on textiles. This is why the model must be specified at the disaggregated product level.
5
Second, for a given indicator, NTMkij, there is little variation in the data across suppliers to country j for a given product since when an importer specifies an NTM on a product, it is usually the same for all exporters. Thus there is (even) less bilateral variation in NTMs than in tariffs and this makes identification of the effects of NTMs much more difficult. With very little variation in bilateral tariffs, and even less in the indicator of bilateral barriers, estimates will be instable, suffering from
multicollinearity.
Thus, with NTMs mostly defined multilaterally (the same barrier is applied by
country j on its imports whomever the exporter i) and given the limited data available on NTMs, one can only estimate an NTM restrictiveness by importing country, not bilaterally, especially when using the NTMs tabulated from the WITS data base.3 Going a step further, since the initial NTM variable is importer-specific, this dramatically complicates the interpretation of the estimated coefficient for the “bilateral” NTM variable. To take an example, drawn from Anderson et al. (2008) who use this framework, they state that “the coefficient for bilateral NTB variables can be interpreted as -for some given of NTBs multilaterally – the effect on a
particular pairing of countries of being a member of some group m”.4 Moreover, there are further econometric problems in the data as missing values may not reflect the absence of an NTM on that particular tariff line.
In sum, even though it has been often used (see the review of the literature below), the gravity equation is not very informative if one is interested to compare the effects of different types of NTMs on a large panel of countries at a disaggregated product level.
2.2 The Factor-endowment-based Approach to NTM measurement
Since one is interested in the effects of NTMs at the product level, is it natural to use as a benchmark a model that isolates the determinants of the aggregate (rather than bilateral) volume of product trade and then to add on the effects of tariffs and NTMs. This approach initiated by Leamer (1990) has been extended recently by Kee et al. (2009) to the estimation of NTMs. Drawing on an earlier study (Kee et al., 2009) in which they estimate the elasticity of demand for imports at the HS-6 product line level), they estimate the quantity-impact of NTBs for good k as:
(
)
, , , , , , ln k i k iln 1 k i k kr ir k k i kr ir k i k i r r mε
tα
α
Cβ
NTBβ
C NTBκ
− + = + + + + ∑
∑
(3) where , k im is the import value of good k in country i;
3 Even with a large survey (over 10,000 respondents) such as the one designed by ECORYS in their
study of EU/US NTBs, Anderson et al. (2008) explain that due to a small response numbers in each bilateral response cell, a “higher quality measure of the degree of the perceived NTBs faced by an exporter in any representative country i for export to country j was obtained by averaging importer j responses across all exporters”.
4 Anderson et al. (2008) are interested in the effects of NTBs in a two-region world (NAFTA and
European Economic area). They conclude that their estimated coefficient on the NTB dummy delivers the “surcharge faced by EU exporters to NAFTA relative to a baseline NTB that implicitly affects all exporters to j alike” which is not very useful for our purpose.
6
k
α are tariff line dummies that capture any good-specific effect; ,
k i
t is the ad-valorem tariff on good k in country i; ,
k i
ε is the import demand elasticity (obtained extraneously);
r i
C are r country-specific variables (agricultural land on GDP, capital on GDP and labor on GDP for relative factor endowments and GDP for economic size, a dummy for island and the average distance to world markets for geography);
,
k i
NTB is a dummy variables indicating the presence of a NTB for line k imported by i;
,
k i
β the parameter that capture the impact that the NTB imposed on good k in country i has on the corresponding imports.
Equation (3) is estimated at the HS-6 tariff line level. To make NTBs comparable between them and comparable with ad-valorem tariffs, Kee et al. transform the quantity impact into an ad-valorem price-equivalent (AVE) defined as
ln d/
AVE= ∂ p ∂NTB, wherepd is the domestic price. They show that the ad-valorem equivalent (AVE) of the NTB imposed on good k by country i is given by:
, ˆ , , 1 k i k i k i e AVE β ε − = (4)
with βˆk i, obtained from the estimation of (3). AVEs are then computed for each country at the HS-6 level and aggregated up to an aggregate measure.
This method has several advantages over the gravity approach. First, it delivers
directly the sought-after tariff-equivalent of NTBs (see (4)). Second, suppose that one adds indices of trade facilitation as in e.g. Shepherd and Wilson (2008) to the NTB indices. Then one can compare directly the relative effects on imports of removing, tariffs, versus removing NTBs, and one can also compare the effects of removing the aggregate of NTBs and tariffs versus removing BTB measures. Third, insofar as the elasticity of imports is taken extraneously to the estimation, the endogeneity of imports is, at least, partly resolved.
Once one goes beyond the traditional approach relying on coverage and frequency indices, this approach is likely to be more informative than the gravity-based approach which has dominated the evaluation of the effects of NTBs (see table 1 below).
The approach, however, also has several shortcomings. First, idiosyncratic
measurement errors, likely to cancel out at the aggregate level, will be magnified in at the HS-6 product-line level. Second, it is difficult to introduce relevant control
variables (beyond dummy variables) at the disaggregated level. Indeed, at the HS-6 level, there is nothing else than tariffs and trade volumes. Third, the estimate of the price elasticity of demand for imports, which is essential for computing the AVE, will likely change in magnitude with the sample period.5
5 For example, textiles and clothing, subject to a large number of NTMs in the 6200 (quotas ) and 8100
(technical regulations ) categories of NTBs, has witnessed a significant change since 2002-04 when the NTM data were last collected and the price elasticity of demand for imports estimated in Kee et al. (forthcoming).
7
3. Econometric Estimates of the Effects of NTMs
The extensive use of gravity equation in the assessment of specific NTMs is due to its simplicity. Since the sign of the variables that capture the effect of the NTM in the regression is not constrained, it is possible to also capture the trade-enhancing effect of regulations when they act as standards that facilitate trade. In certain cases one can also measure import elasticities with respect to variations in the restrictiveness of the standards themselves when there is some variability across countries or over time (e.g., the level of chemical residues, of aflatoxins, etc.).
Table 1 summarizes the results from some of the studies on NTMs and BTBs (when these are included in an appraisal of NTMs). As indicated by the asterisks, the overwhelming majority of studies are based on the gravity model. The table
distinguishes between studies that aim at capturing the effects of NTMS on all trade flows from those that relate to specific sectors (agriculture, electronics, etc...). Three relatively robust conclusions emerge.
1. NTMs are more restrictive than tariffs and low income countries face more restrictive market access conditions. Kee et al.(2009) and Hoekman and Nicita (2008) find that NTMs generally restrict trade more than tariffs (i.e. the estimated AVEs are higher than the observed tariffs at the product line level).6 Because of the composition of trade towards agricultural products (where the aggregate of trade restrictions are estimated to be the highest), low-income countries face more restrictive market access conditions than other countries. Note however (see discussion in section 2 above) that the NTB restrictiveness index is an aggregate of the 5 ‘core’ NTMs (Technical regulations, Quantity restrictions, Monopolistic
measure, Prices control measures and agricultural domestic support), so that it is not possible to know which of these NTMs is the most restrictive.
2. Subject to the included controls, NTMs restrict bilateral trade volumes. The bulk of the studies in table 1 concern product-specific trade flows. All the studies find that the particular NTM/NTB proxy used has a negative impact on the volume of bilateral trade in the product under scrutiny. While in each case, this correlation may be capturing the effects of omitted variables correlated with the NTM, because all the studies (including several that have not been published) find systematically that NTMs reduce the volume of trade. For example, the studies show that the SPS and TBT measures in agriculture have a significantly negative impact on the EU imports of agricultural products.
6 This pattern would not be robust if the NTB dummy were systematically correlated positively with an
8
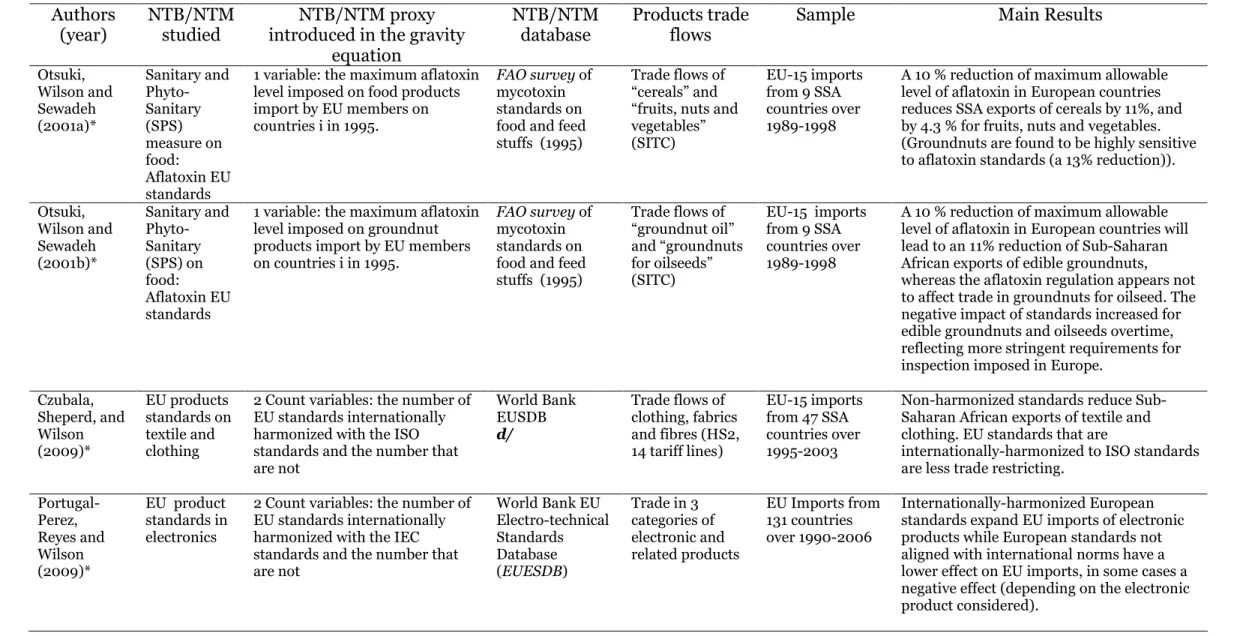
Table 1. Model-based estimates of NTBs Authors
(year)
NTB/NTM studied
NTB/NTM proxy introduced in the gravity
equation
NTB/NTM database
Products trade flows
Sample Main Results
ALLTRADE FLOWS Hoekman and Nicita (2008) ** Non-Tariff Barriers 1 variable: NTB restrictiveness index (OTRI-TTRI) a/
Kee, Nicita and Olarreaga (2009) b/
Total trade flows (aggregated)
104 importers and 115 exporters for the year 2006
AVEs of NTBs are larger than corresponding tariffs at the HS-6 level. Other things equal, a 10% reduction in NTB restrictiveness increases import volume by 1.8%. Moenius (2004)* International and Country-specific standards
3 Count variables: the number of shared standards in year t, industry k between countries I and j, the number of country-specific standards in the
importing (exporting) countries.
PERINORM database = German Deutsches Intitut fur Normung + Agence Francaise de Normalisation + Bristish Standards Intitution Trade in 471 industries 12 (OECD) countries over 1980-1995
Bilaterally shared standards are favorable to bilateral trade volumes. Country-specific standards of the importer reduce imports for agricultural products while they increase trade for manufacturing products (interpretation: standards offer valuable information increasing demand). PRODUCT-SPECIFIC TRADE FLOWS
Disdier and Fontagné (2008)* EU authorization regime for biotech products (GMOs)
2 dummies: one equals to 1 for products exported by j on with the EU imposes in t a moratorium and/or a product-specific measures; one equals to 1 if country i adopts in t a national safeguard measures on products exported by j. Agbios database completed with scrutinity of legislation. Trade flows of Maize, cotton and oilseed rape trade flows (HS6, 7 tariff lines) 19 main exporters towards 39 main importers over 1994-2005
EU GMO measures reduce exports of Argentina, Canada, US and Brazil for the affected products, with effects varying across products and complainants. Importers other than the EU (New Zealand, Switzerland and Norway) have also implemented measures on OGMs that negatively affect their imports. Disdier, Fontagné, and Mimouni (2008)* Sanitary and Phyto-Sanitary (SPS) measures and Technical Barriers to trade (TBT) on
3 variables: a dummy equals to 1 if the importing country notifies at least one barrier; a frequency ratio; an ad-valorem equivalent of SPS and TBT.
UNCTAD for the 2 first variables and
Kee, Nicita and Olarreaga (2009) for the third c/
Trade flows of agricultural and food industry products (HS4, 690 tariff lines) 183 exporters and 154 importers, for 2004
SPS measures and TBTs implemented by OECD countries significantly reduce their imports of agricultural products from developing countries but do not affect trade between OECD members. European imports are more negatively influenced by SPS and TBTs than imports of other OECD countries.
9 agriculture
Table 1. (continued) Model-based estimates of NTBs Authors
(year)
NTB/NTM studied
NTB/NTM proxy introduced in the gravity
equation
NTB/NTM database
Products trade flows
Sample Main Results
Otsuki, Wilson and Sewadeh (2001a)* Sanitary and Phyto-Sanitary (SPS) measure on food: Aflatoxin EU standards
1 variable: the maximum aflatoxin level imposed on food products import by EU members on countries i in 1995.
FAO survey of mycotoxin standards on food and feed stuffs (1995)
Trade flows of “cereals” and “fruits, nuts and vegetables” (SITC) EU-15 imports from 9 SSA countries over 1989-1998
A 10 % reduction of maximum allowable level of aflatoxin in European countries reduces SSA exports of cereals by 11%, and by 4.3 % for fruits, nuts and vegetables. (Groundnuts are found to be highly sensitive to aflatoxin standards (a 13% reduction)).
Otsuki, Wilson and Sewadeh (2001b)* Sanitary and Phyto-Sanitary (SPS) on food: Aflatoxin EU standards
1 variable: the maximum aflatoxin level imposed on groundnut products import by EU members on countries i in 1995.
FAO survey of mycotoxin standards on food and feed stuffs (1995) Trade flows of “groundnut oil” and “groundnuts for oilseeds” (SITC) EU-15 imports from 9 SSA countries over 1989-1998
A 10 % reduction of maximum allowable level of aflatoxin in European countries will lead to an 11% reduction of Sub-Saharan African exports of edible groundnuts, whereas the aflatoxin regulation appears not to affect trade in groundnuts for oilseed. The negative impact of standards increased for edible groundnuts and oilseeds overtime, reflecting more stringent requirements for inspection imposed in Europe.
Czubala, Sheperd, and Wilson (2009)* EU products standards on textile and clothing
2 Count variables: the number of EU standards internationally harmonized with the ISO standards and the number that are not World Bank EUSDB d/ Trade flows of clothing, fabrics and fibres (HS2, 14 tariff lines) EU-15 imports from 47 SSA countries over 1995-2003
Non-harmonized standards reduce Sub-Saharan African exports of textile and clothing. EU standards that are
internationally-harmonized to ISO standards are less trade restricting.
Portugal-Perez, Reyes and Wilson (2009)* EU product standards in electronics
2 Count variables: the number of EU standards internationally harmonized with the IEC standards and the number that are not World Bank EU Electro-technical Standards Database (EUESDB) Trade in 3 categories of electronic and related products EU Imports from 131 countries over 1990-2006 Internationally-harmonized European standards expand EU imports of electronic products while European standards not aligned with international norms have a lower effect on EU imports, in some cases a negative effect (depending on the electronic product considered).
10
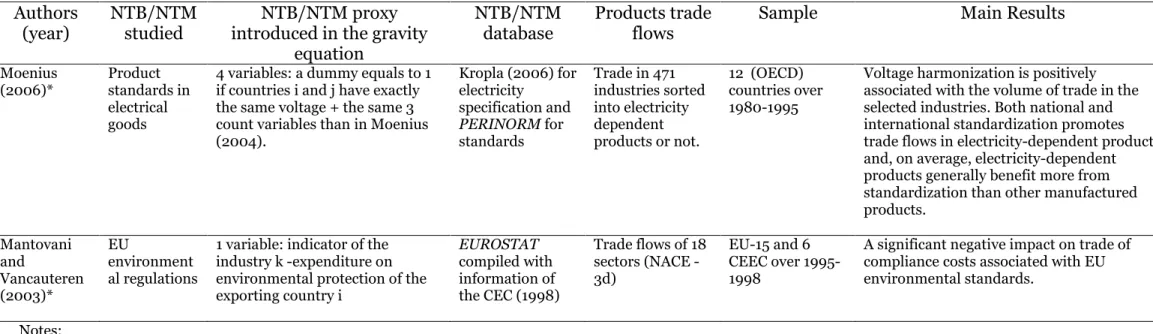
Table 1. (end) Model-based estimates of NTBs Authors
(year)
NTB/NTM studied
NTB/NTM proxy introduced in the gravity
equation
NTB/NTM database
Products trade flows
Sample Main Results
Moenius (2006)* Product standards in electrical goods
4 variables: a dummy equals to 1 if countries i and j have exactly the same voltage + the same 3 count variables than in Moenius (2004). Kropla (2006) for electricity specification and PERINORM for standards Trade in 471 industries sorted into electricity dependent products or not. 12 (OECD) countries over 1980-1995
Voltage harmonization is positively associated with the volume of trade in the selected industries. Both national and international standardization promotes trade flows in electricity-dependent products and, on average, electricity-dependent products generally benefit more from standardization than other manufactured products. Mantovani and Vancauteren (2003)* EU environment al regulations
1 variable: indicator of the industry k -expenditure on environmental protection of the exporting country i EUROSTAT compiled with information of the CEC (1998) Trade flows of 18 sectors (NACE -3d) EU-15 and 6 CEEC over 1995-1998
A significant negative impact on trade of compliance costs associated with EU environmental standards.
Notes:
* Estimates based on a gravity-model.
** Estimates bease on an endowment theory of trade.
a/ difference between the tariff trade restrictiveness index (TTRI), capturing only tariffs, and the overall trade restrictiveness index (OTRI) including the effect of both tariff and NTMs (see Kee, Nicita and Olarreaga, 2009).
b/available at
http://econ.worldbank.org/WBSITE/EXTERNAL/EXTDEC/EXTRESEARCH/0,,contentMDK:21085342~pagePK:64214825~piPK:64214943~theSitePK:469382,0 0.html
c/available at http://team.univ-paris1.fr/teamperso/fontagne/data.htm
d/available at http://go.worldbank.org/6OEYNCYSD0 and http://www.wto.org/english/tratop_e/tbt_e/tbt_e.htm Source: Authors’ compilation from different studies (see references)
11
3. Harmonization of standards increase bilateral trade flows. Bilaterally shared standards and harmonized standards, significantly increase trade or, at least are less trade-restricting than non-harmonized standards. This
intuitively plausible result is drawn from a relatively small (but growing) number of studies and needs further verification to acquire robustness. This said, as pointed out earlier, a major problem for virtually all the product-specific gravity studies is that the NTM variables are always importer-product-specific. This means that country-specific effects necessary to capture time-invariant omitted factors that influence the volume of bilateral trade cannot be included in the estimation, thereby aggravating omitted-variable bias (see discussion in section 2.2). 7
4. The Distribution of NTMs and of their Ad-valorem equivalents We conclude this note by examining patterns of NTMs and their average tariff equivalents. We draw on the estimates of Kee et al. (2009) who report the aggregate ad-valorem equivalent of NTMs to see if any patterns emerge when the NTM equivalents are extended to individual NTMs. We also inspect the patterns of AVEs and tariffs across NTMs.
4.1 The Distribution of NTMs
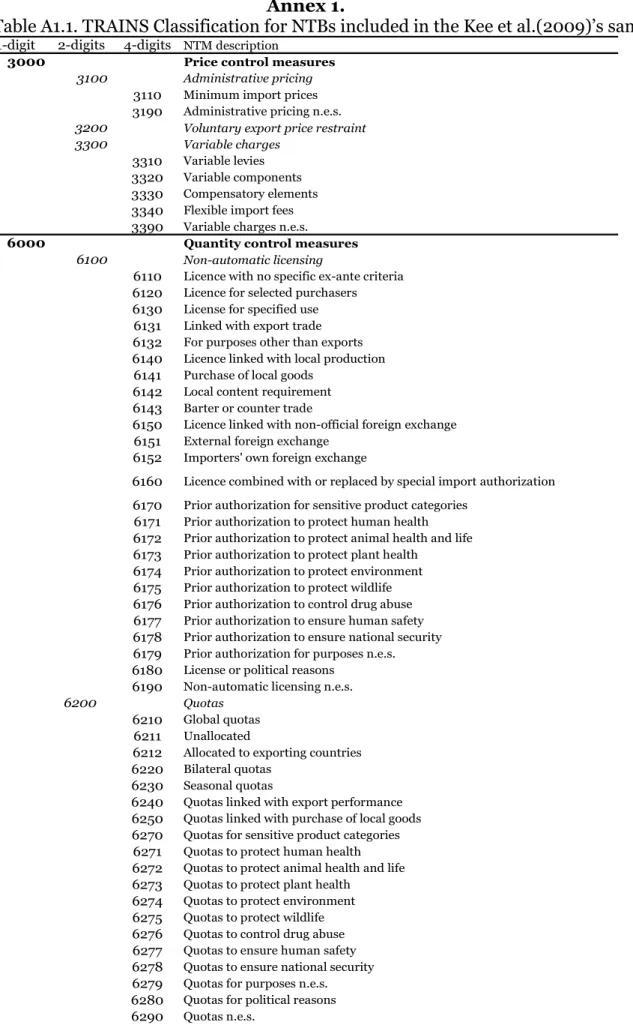
We start with a description of the raw data and the distribution of NTMs at the tariff-line level. According to the TRAINS classification, the NTM dummy used by Kee at al. (2009) includes then 4 types of NTMs at the 1-digit level (3000: Price control measures), 10 types at the 2-digit level (3100:
Administrative pricing) and 153 types at the 4-digit, most disaggregated, level (3110: Minimum import prices. (Table A1.1 in annex 1 gives an exhaustive list detailing the NTMs according to these codes).8 Kee et al. sample covers NTM’s AVE estimates for 91 countries (including 21 HI-OECD countries) and 4,961 HS-6 product categories (see Kee et al.’s table 3 for the list of countries and their corresponding average AVE of core NTB, pages 188-189).
Following the TRAINS-WITS classification of NTMs, we start with a
description of the distribution of these NTMs across HS-6 tariff lines over the sample of 93 countries used by Kee et al. (2009). This distribution of NTMs is given in table 2. Column1 give the frequency distribution when NTBs are defined at the 1-digit NTM code level which corresponds to the ‘core’ definition of the NTB variable used by Kee et al. when they estimate equation(3).
7 See a also in Carrère and De Melo (2009) a detailed summary of case study ’ results which
are informative and useful, partly because they confirm some of the patterns emerging from the larger earlier data set where it is apparent that technical regulations represent the most frequent form of NTMs (see section 4).
8 For comparison purposes, the new database under construction in the joint ITC-UNCTAD
project should give measures for 240 NTMs for 50 countries (of which 20 would be high-income OECD countries) by 2011. See details in Carrère and De Melo (2009).
12
At the 1-digit NTM classification level, the NTM dummy variable recorded at the HS-6 tariff line level then takes the value 1 when a given country imposes on good k at least one of the four following NTMs:
- Prices control measures (TRAINS code 3100, 3200 and 3300); - Quantity restrictions (TRAINS code 6100, 6200 and 6300); - Monopolistic measures (TRAINS code 7100, 7200 and 7900); - Technical regulations (TRAINS code 8100)
Table 2 shows that 74% of the HS-6 tariff lines only have one ‘core’ NTM and 25% of the lines have two NTMs. Moving to a more disaggregated level, the percentage of tariff lines with only one NTM falls, but not by much and at the most disaggregated level of NTM definition, 39% of the tariff lines only have one NTM.
Table 2. Frequency Distribution of the number NTBs per HS-6 product categories (HS-6 products for 93 countries, over 2002-04)
1-digits Freq. Percent Cum. 2-digits Freq. Percent Cum. 4-digits Freq. Percent Cum. 1 91,995 73.76 73.76 1 84,116 67.44 67.44 1 49,176 39.43 39.43 2 31,151 24.98 98.74 2 32,140 25.77 93.21 2 33,418 26.79 66.22 3 1,562 1.25 99.99 3 7,909 6.34 99.55 3 20,801 16.68 82.9 4 15 0.01 100 4 538 0.43 99.98 4 7,331 5.88 88.78 5 20 0.02 100 5 4,152 3.33 92.11 6 4,845 3.88 95.99 7 2,190 1.76 97.75 8 1,288 1.03 98.78 9 810 0.65 99.43 10 291 0.23 99.66 11 41 0.03 99.7 12 196 0.16 99.85 13 146 0.12 99.97 14 35 0.03 100 15 3 0 100 Total 124,723 100 124,723 100 124,723 100
Each row gives the number of lines with NTBs at the defined level (for example at the2-digit level, 6.34% percent of HS-6 tariff lines have 3 NTBs).
Notes: NTB Digits classification corresponds to the use of digits in the NTB data classification. See table A1.1 for definition of 2-digit codes and figure 2 for definition of 4-digit NTB codes. Following is an example of the level of detail at 1, 2 and 4 digit level for the category Price and control measures:
1-digit: 3000 Price control measures 2-digit: 3100 Administrative pricing 4-digit 3110 Minimum import prices
Source: authors’ computations based on Kee et al. (2009) and TRAINS-WITS data
This general lack of multiple NTMs at a disaggregated level justifies extending the global measure of Kee et al. to compute the AVE for each core NTB.
Because for 74% of the AVE estimates (at the country/HS6 product level), there is only one underlying NTB at the 1-digit level (and then, for 26%, the AVE estimates includes the combined impact of at least 2 NTBs)9, then by merging the initial NTBs file from TRAINS-WITS (containing information on the different types of NTBs as described in table A1.1) with Kee et al.’s AVE
13
database10, we can isolate AVEs for each type of NTMs, for at least 74% of cases.11
This said, to come up with a “classification” of the AVEs of different types of NTMs one would need to have simultaneously different types of NTMs for a given product line for the same importing country. This is not possible now, but might be possible with the new data base under construction. Then one could rerun the estimation of Kee et al. (2009) using dummies for each NTM and then one could compare the resulting estimated AVEs for a given
country/product. With the data currently available, this can only be done for 26% of the data where more than one NTM is included.
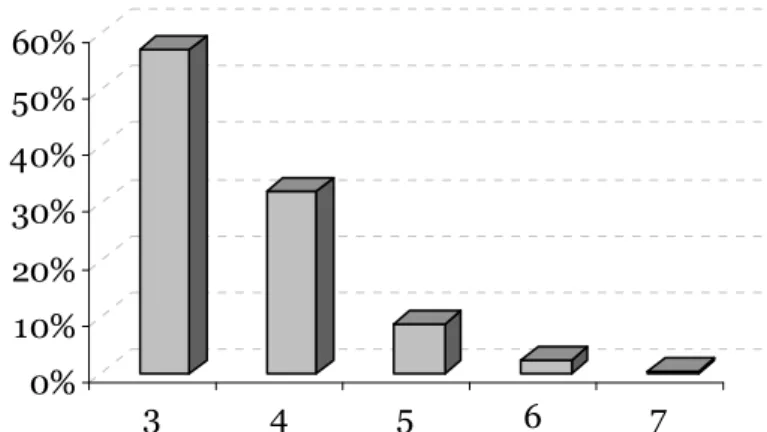
Pending new data, one can exploit the cross-country dimension of the sub-sample of the 70% of observations where the estimated AVE can be linked to the corresponding NTB. Actually, as reported in figure 1, for a given product (defined at the HS6 level), all countries do not impose the same 2-digit NTB. Indeed, over the 4,961 HS-6 product lines, 60% face 3 different 2-digit NTMs across the panel and 32% 4 NTMs. Hence, there is some heterogeneity across countries at the HS-6 level which allows us to look for different patterns of restrictiveness across NTMs at the product level. 12
10 Available at
http://econ.worldbank.org/WBSITE/EXTERNAL/EXTDEC/EXTRESEARCH/0,,contentMDK:21085342~pagePK:64 214825~piPK:64214943~theSitePK:469382,00.html
11 For instance, in Kee et al.’s (2009) sample, estimates for the Brazil evidence an NTBs’s AVE
of 1.08 for the HS6 products “320810” and of 1.02 for the product “821192”. The TRAINS-WITS database indicates the presence of a NTB of type 6300 (Prohibitions) imposes by the Brazil on product “320810”, of type 8100 (Technical regulations) on product “821192”. We therefore attribute the Kee at al.’s AVE estimates to the corresponding NTB. However, in the case for instance of product “291249”, 3 NTBs are imposed by the Brazil (6100, 6300 and 8100). Then, the corresponding AVE of 1.74 can not be decomposed in this case into each components of the “core” NTB dummy.
12This search should be prefaced by two caveats. First, the NTMs include two data bases,
TRAIN-WITS and the EU standard Database which does not report information on the underlying “core” NTMs. Hence we cannot decompose the AVE according to the classification reported in table A1.1. While this represents only 0.06% of the AVE estimates reported in the Kee et al.’s database for non-EU countries but, since 90% of the information from that data base concerns NTMs imposed by the EU, we can only are enable to analyze the underlying NTBs of the 38% of the AVE computed for the EU. Hence, interpretation concerning EU’s NTB is limited. Second, estimates are for the years 2002-2004 with data on “core” NTBs for 1999-2001 depending on the country (see their table 1 page 184-185 for the year per country in the database).
14
Figure 1. Distribution over the 93 countries of the number of different 2-digit NTB on a HS6 product lines
0% 10% 20% 30% 40% 50% 60% 3 4 5 6 7
Note: computation on the 84,116 observations having only one type of NTB 2-digits per lines, see table A1.1.
Source: authors’ computations based on Kee et al. (2009) and TRAINS-WITS data.
4.2. AVE patterns for single-NTM products
We stick with the 2-digit NTM classification level and restrict the sample to HS-6 products with a single NTM (this includes 84,116 observations, see table 3) so that we can interpret the corresponding AVE without ambiguity. The results are shown in table 3 for the 8 NTMs applied in our sample.
Table 3. Frequency Distribution of single-NTM AVEs (HS-6 products, 93 countries, for 2002-04)
AVE Tariff AVE Tariff
3100 50 0.06% 36.7% 16.9% 19.3% 14.4% 3200 0 - - - - -3300 9 0.01% 40.6% 76.7% 15.8% 153.5% 6100 21,255 25.27% 38.1% 10.5% 33.9% 7.7% 6200 5,972 7.10% 42.6% 4.1% 32.2% 3.1% 6300 2,320 2.76% 46.4% 8.7% 20.8% 11.8% 7100 251 0.30% 39.8% 24.6% 39.9% 15.1% 7200 0 - - - - -7900 0 - - - - -8100 54,259 64.50% 43.3% 15.9% 25.6% 7.2% Total 84,116 100%
2-digits Freq. Percent Unweighted average Import-weighted average
Note:
- Computation on the 84,116 observations having only one type of NTB 2-digits per lines, see table A1.1. Definition of NTB codes at the 2-digit level:
3100 Administrative pricing 6200 Quotas
3200 Voluntary export price restraint 6300 Prohibitions
3300 Variable charges 7100 Single channel for imports
6100 Non-automatic licensing 8100 Technical regulations
15
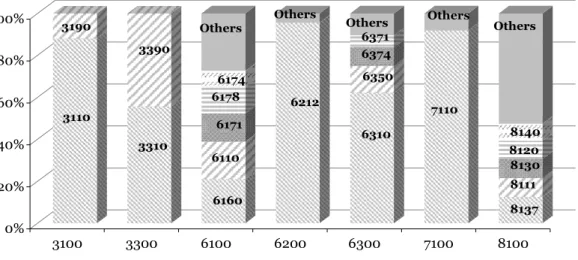
The most frequently used NTM is “Technical regulation” (8100) followed by “Non-automatic licensing” (6100). Countries do not use “voluntary export price restraints” (3200) and use very exceptionally “variable charges” (3300) and “other price control measures”.13 A more detailed description is provided in figure 2 which shows that loss of information by aggregation is confined to “non-automatic licensing” (6100) and “technical regulations” (8100).
Three conclusions emerge from inspecting these AVEs at the NTM level. 1. The distribution of AVEs is narrow with most NTM having an AVE around 40%. This range of estimates at the product-line is narrow and probably underestimates the true variance in estimates. This could be due to our using all estimates including those that are not statistically significant. It would be useful to compare ranges when more stringent criteria are imposed on the estimates. Also, next to prohibitions, the highest AVE estimate is for 8100.14 Interestingly, this ranking corresponds to the subjective answers obtained from the interviews summarized in section 4.
2. Across all NTMs, the restrictiveness of the measure on import volumes is greater than the corresponding tariff on that product line. Except for variables charges (3300), this holds regardless of the choice of weighing scheme.
3. NTMs are associated with smaller import volumes. This is evident from a comparison of unweighted and import-weighted AVEs. This confirms that imports are endogenous to NTMs and tariffs.
4. The cumulative distribution of AVE estimates (see figure 3) suggests that two thirds of the AVE estimates at the product line level are in the 25%-50% range.
13 This is not surprising since the Uruguay Round agreements generally eliminated all VERs
(and the MFA-related quotas in 2005).
14 Note that, as explained by Kee et al. (2009), because of the methodology used to adapt to
the zero-one nature of each NTM, the AVE should be interpreted as the marginal contribution of the corresponding NTM after controlling for the tariff level.
16
Figure 2. Decomposition 2-digit NTMs into corresponding 4-digit NTM components (HS6 products, 93 countries, for 2002-04)
0% 20% 40% 60% 80% 100% 3100 3300 6100 6200 6300 7100 8100 3190 3390 3110 3310 6160 6110 6171 6178 6174 Others Others Others Others 6212 6310 6350 6374 6371 7110 Others 8137 8111 8130 8120 8140 Note:
- Computation on the 84,116 observations having only one type of NTB 2-digits per lines, see table A1.1.
- Definition of corresponding codes:
3110 Minimum import prices 6310 Total prohibition 3190 Administrative pricing n.e.s. 6350 Import diversification
3310 Variable levies 6371 Prohibition to protect human health 3390 Variable charges n.e.s. 6374 Prohibition to protect environment
6110 Licence with no specific ex-ante criteria 7110 States trading administration 6160 Licence combined with or replaced by special
import authorization 8111
Product characteristics req. to protect human health
6171 Prior authorization to protect human health 8120 Marking requirements 6174 Prior authorization to protect environment 8130 Labelling requirements
6178 Prior authorization to ensure national security 8137 Labelling requirements to ensure human safety 6212 Allocated to exporting countries 8140 Packaging requirements
17
Figure 3. Cumulative Distribution of each NTB 2-digits’ AVE (HS6 products, 93 countries, for 2002-04)
40% 50% 60% 7 0% 80% 90% 1 00% 0 0.2 0.4 0.6 0.8 1 1 .2 1 .4 1 .6 1 .8 2 2.2 2.4 NTB "31 0 0" NTB"330 0" NTB "61 0 0" NTB "620 0" NTB "630 0" NTB "7 1 0 0" NTB "81 0 0"
Note: Computation on the 84,116 observations having only one type of NTB 2-digits per lines, see table A1.1.
Source: authors’ computations based on Kee et al. (2009) and TRAINS-WITS data.
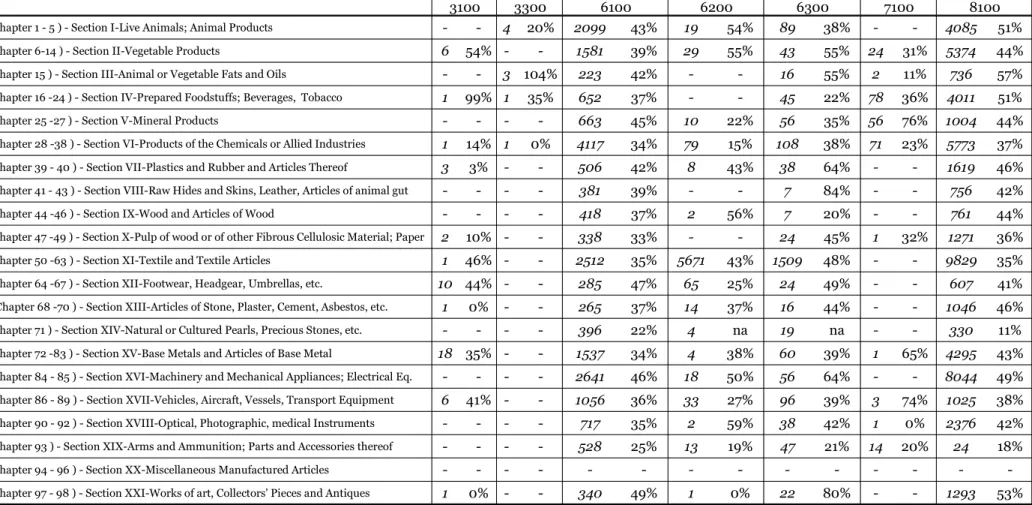
Table 4 disaggregates the distribution of NTBs and corresponding AVEs at the product section level (HS1). Several patterns appear. First, textiles (section 11), a sector that is highly protected world-wide, simultaneously includes the highest number of the 3 types of NTBs: Technical regulation (8100), Quotas (6300) and Prohibitions (6300) with high corresponding AVEs (ranging from 35% to 48%).15
Second, the highest count for “Non-automatic licensing measures” (6100) applies for products of the chemicals or allied industries (section 6). This section is the only one including the 7 types of NTBs on its HS-6 lines.
Third, machinery and mechanical appliances (section 16) face simultaneously some of the highest AVE about (49%) estimates for “technical regulations” (8100), but also of other NTMs (i.e. for 64% for prohibitions (6300), and 46% for non-automatic-licensing (6100).16
15 The data are for 2002-2004 so they still include quotas measures on textile that have now
been abolished.
16 Since the NTMs are not codified continuously and since the same import elasticity applies to
all NTMS, the variations in estimates, which are small, only capture composition effects, i.e. different patterns of NTMs across country-product pairs.
18
Table 4. Frequency and unweighted AVE by 2-digit NTB type by product Section
(Chapter 1 - 5 ) - Section I-Live Animals; Animal Products - - 4 20% 2099 43% 19 54% 89 38% - - 4085 51%
(Chapter 6-14 ) - Section II-Vegetable Products 6 54% - - 1581 39% 29 55% 43 55% 24 31% 5374 44%
(Chapter 15 ) - Section III-Animal or Vegetable Fats and Oils - - 3 104% 223 42% - - 16 55% 2 11% 736 57%
(Chapter 16 -24 ) - Section IV-Prepared Foodstuffs; Beverages, Tobacco 1 99% 1 35% 652 37% - - 45 22% 78 36% 4011 51%
(Chapter 25 -27 ) - Section V-Mineral Products - - - - 663 45% 10 22% 56 35% 56 76% 1004 44%
(Chapter 28 -38 ) - Section VI-Products of the Chemicals or Allied Industries 1 14% 1 0% 4117 34% 79 15% 108 38% 71 23% 5773 37%
(Chapter 39 - 40 ) - Section VII-Plastics and Rubber and Articles Thereof 3 3% - - 506 42% 8 43% 38 64% - - 1619 46%
(Chapter 41 - 43 ) - Section VIII-Raw Hides and Skins, Leather, Articles of animal gut - - - - 381 39% - - 7 84% - - 756 42%
(Chapter 44 -46 ) - Section IX-Wood and Articles of Wood - - - - 418 37% 2 56% 7 20% - - 761 44%
(Chapter 47 -49 ) - Section X-Pulp of wood or of other Fibrous Cellulosic Material; Paper 2 10% - - 338 33% - - 24 45% 1 32% 1271 36%
(Chapter 50 -63 ) - Section XI-Textile and Textile Articles 1 46% - - 2512 35% 5671 43% 1509 48% - - 9829 35%
(Chapter 64 -67 ) - Section XII-Footwear, Headgear, Umbrellas, etc. 10 44% - - 285 47% 65 25% 24 49% - - 607 41%
(Chapter 68 -70 ) - Section XIII-Articles of Stone, Plaster, Cement, Asbestos, etc. 1 0% - - 265 37% 14 37% 16 44% - - 1046 46%
(Chapter 71 ) - Section XIV-Natural or Cultured Pearls, Precious Stones, etc. - - - - 396 22% 4 na 19 na - - 330 11%
(Chapter 72 -83 ) - Section XV-Base Metals and Articles of Base Metal 18 35% - - 1537 34% 4 38% 60 39% 1 65% 4295 43%
(Chapter 84 - 85 ) - Section XVI-Machinery and Mechanical Appliances; Electrical Eq. - - - - 2641 46% 18 50% 56 64% - - 8044 49%
(Chapter 86 - 89 ) - Section XVII-Vehicles, Aircraft, Vessels, Transport Equipment 6 41% - - 1056 36% 33 27% 96 39% 3 74% 1025 38%
(Chapter 90 - 92 ) - Section XVIII-Optical, Photographic, medical Instruments - - - - 717 35% 2 59% 38 42% 1 0% 2376 42%
(Chapter 93 ) - Section XIX-Arms and Ammunition; Parts and Accessories thereof - - - - 528 25% 13 19% 47 21% 14 20% 24 18%
(Chapter 94 - 96 ) - Section XX-Miscellaneous Manufactured Articles - - -
-(Chapter 97 - 98 ) - Section XXI-Works of art, Collectors' Pieces and Antiques 1 0% - - 340 49% 1 0% 22 80% - - 1293 53%
6300 7100 8100
3100 3300 6100 6200
Note: Each cell includes the number of NTBs followed by the corresponding AVE. For example, textiles have 9829 NTBs of type 81 (technical regulation) with an average tariff equivalent (AVE) of 35%.
19
Figures 4. Ad-valorem equivalent of NTMs and per capita income (4a) and NTM count per country (4b)
(Simple average over HS-6 products per country, for 2002-2004)
4a. Non-automatic Licensing (6100)- AVE 4b.Non-automatic Licensing(6100) - Numbers
.1 .2 .3 .4 .5 .6 N T B 's A V E 0 10000 20000 30000 40000 50000
per capita GDP (constant $)
0 1 0 0 0 2 0 0 0 3 0 0 0 4 0 0 0 to ta l n u m b e rs o f N T B s 0 10000 20000 30000 40000 50000
per capita GDP (constant $)
4c. Quotas (6200) - AVE 4d. Quotas (6200) - Numbers
0 .2 .4 .6 N T B 's A V E 0 10000 20000 30000 40000 50000 per capita GDP (constant $)
0 1 0 0 2 0 0 3 0 0 4 0 0 5 0 0 to ta l n u m b e rs o f N T B s 0 10000 20000 30000 40000 50000 per capita GDP (constant $)
4e. Prohibitions (6300) - AVE 4f. Prohibitions (6300) - Numbers
0 .5 1 1 .5 N T B 's A V E 0 10000 20000 30000 40000 per capita GDP (constant $)
0 1 0 0 2 0 0 3 0 0 to ta l n u m b e rs o f N T B s 0 10000 20000 30000 40000
per capita GDP (constant $)
Note: Computation based on 2-digit NTM classification level
lines: fitted values with the corresponding 95% Confidence Interval (gray area). Source: authors’ computations based on Kee et al. (2009) and TRAINS-WITS data.
20
Figures 4 (continued). Ad-valorem equivalent of NTMs and per capita income (Simple average over HS-6 products per country, for 2002-2004)
4g. Single Channel for imports (7100) - AVE 4h. Single Channel for imports (7100) - Numbers .2 .4 .6 .8 1 1 .2 N T B 's A V E 0 10000 20000 30000 40000
per capita GDP (constant $)
01 02 03 04 05 0 to ta l n u m b e rs o f N T B s 0 10000 20000 30000 40000
per capita GDP (constant $)
4i. Technical Regulations (8100) - AVE 4j. Technical regulations (8100) - Numbers
0 .2 .4 .6 .8 1 N T B 's A V E 0 10000 20000 30000 40000
per capita GDP (constant $) -2
0 0 0 0 2 0 0 0 4 0 0 0 6 0 0 0 to ta l n u m b e rs o f N T B s 0 10000 20000 30000 40000
per capita GDP (constant $)
Note: Computation based on 2-digit NTM classification level
lines: fitted values with the corresponding 95% Confidence Interval (gray area). Source: authors’ computations based on Kee et al. (2009) and TRAINS-WITS data.
Finally, figure 4 checks for systematic patterns in the estimates of AVEs for each one of the NTMs according to per capita income level (NTM categories 3100 and 3300 are not displayed because of few measures). The figures on the left-hand side (4a) plot the distribution of average AVEs per country (simple average over all HS-6 lines where that measure is applied) and the figures on the right-hand side (4b) plot the count of NTM measures per country. Where it is statistically significant, we report two fitted lines for both measures as a function of per capita GDP.
21 The following patterns emerge:
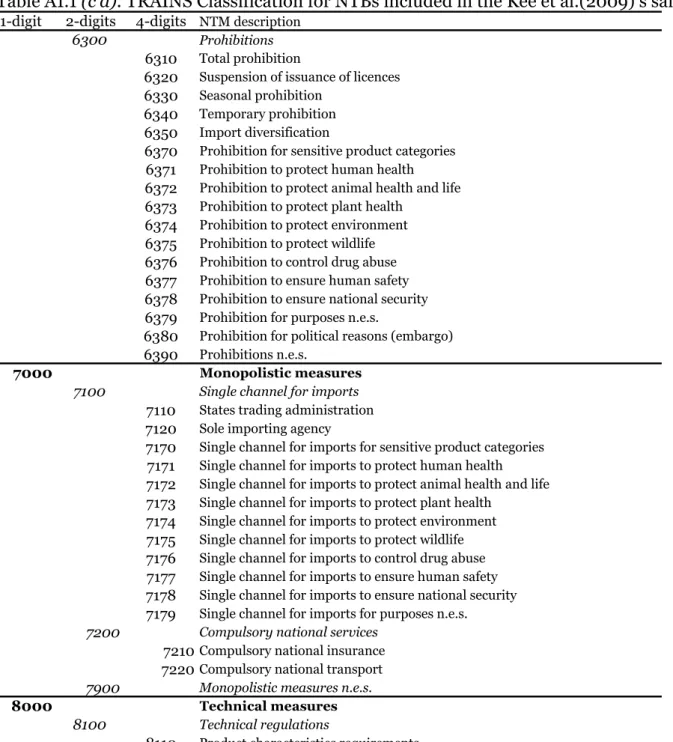
1. With the exception of technical regulations (8100), AVE estimates do not show much variation across NTMs. This reflects the combination of the zero-one measurement of NTMs and the common scaling by the import price elasticity at the product line. More precise data on NTMs would introduce greater dispersion in the patterns of AVEs. On the other hand, there is great variation in the number of NTMs per country across NTM classification. 2 Single-channel for imports (7100) is an LDC NTM (with no statistical trend);
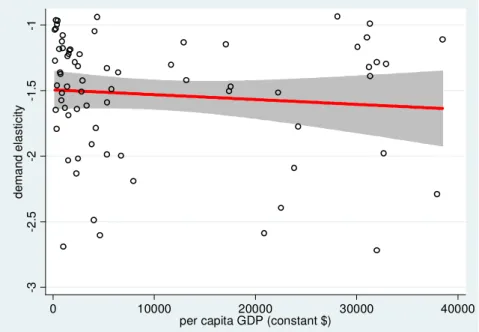
3. The pattern for technical regulations (8100) indicates that the
restrictiveness of these regulations increases with income per capita. As details in Kee et al. (2009, see equation (12) page 12), the AVE is computed from the estimated impact of the NTB on trade divided by the corresponding estimated demand elasticity. Hence, the pattern revealed in figure 4i can be reflect both systematic changes in elasticity estimates across income groups (for example a high import demand elasticity estimate for low-income
countries and a lower – in absolute value - import demand elasticity estimate for high-income countries) and/or, for a given demand elasticity, more
restrictive technical regulations (with a stronger negative impact on trade) in high-income countries. In figure 5 we report the evolution of the import demand elasticity with per capita GDP on the sub-sample of imports facing technical regulation (exactly same sub-sample than figures 4i and 4j). It seems then that the pattern revealed in figure 4i actually reflects more trade restrictive technical regulations in high income countries rather than
difference in import demand elasticities.
Figure 5. Estimated demand elasticity for imports facing technical regulations (8100) (Simple average over HS-6 products per country, for 2002-2004)
-3 -2 .5 -2 -1 .5 -1 d e m a n d e la st ici ty 0 10000 20000 30000 40000
per capita GDP (constant $)
Note: Computation based on the same sub-sample than figures 4i and 4j.
lines: fitted values with the corresponding 95% Confidence Interval (gray area). Source: authors’ computations based on Kee et al. (2009) and TRAINS-WITS data.
22 5. Conclusions
The combination of case studies with econometric estimates provides a better understanding of the complexity and variety of NTMs and of their effects restrictiveness on trade. This paper has surveyed the state of understanding prior to the launch of major joint effort by UNCTAD and ITC to extend systematically the collection of official data along the lines in TRAINS-WITS combined with extensive interviews of exporting companies.
Perceptions gathered through interviews suggest that for developing countries certification requirements are important regardless of destination while customs formalities are perceived as a more important barrier to trade in Africa than in other regions. For exports destined to high-income countries, testing requirements represent an important obstacle for exporters. Not surprisingly, NTMS are also perceived to be particularly costly for agricultural products because of the variety of SPS standards across countries and of high costs of compliance costs related to certification. For many low-income countries, barriers to trade are also high at home, notably with respect to certification as the necessary infrastructure to carry out certification is often lacking. Interviews also suggest that arbitrariness and non-transparency plague exporters to developing countries’ destination, be it with respect to customs procedures or product standards. Rules of Origin are often perceived as a significant barrier when exports are towards the EU, US or Japan.
The growing number of econometric studies appears to be leading to several stylized patterns. The paper suggests three. First, NTMs are more restrictive than tariffs and low income countries face more restrictive market access conditions. Second, subject to the included controls, NTMs restrict bilateral trade volumes. Third, harmonization of standards increase bilateral trade flows.
Across broadly-defined imports at the section level, NTMs are more restrictive than the corresponding tariffs with two-thirds of the AVE estimates in the 25%-50% range. Technical regulations and non-automatic licensing are the most used single-NTM measures and the restrictiveness of technical
23 References
Anderson J., Bergstrand J., Egger P., and J. Francois. 2008. “Non-Tariff Barrier Study Methodology”, ECORYS mimeo.
Anderson J. and E. Van Wincoop. 2004. “Trade Costs”. Journal of Economic Literature 42, 691-751.
Carrère and De Melo.2009. “Non-Tariff Measures: What do we Know, What should be Done?”. World Bank Mimeo.
Czubala W., Shepherd B., and J. Wilson. 2009. “Help or Hindrance? The Impact of Harmonized Standards on African Exports”. Journal of African economies, March, pp. 1-35.
Disdier A-C, Fontagné L. and M. Mimouni. 2008. “The Impact of Regulation on Agricultural Trade : Evidence From the SPS and TBT Agreements”.
American Agricultural Economics Association 90(2), pp. 336-350.
Disdier A-C and L. Fontagné. 2008. “Trade Impact of European Measures on GMOs Condemned by the WTO Panel”. CEPII mimeo.
Feenstra R. 2004. Advanced International Trade: Theory and Evidence, Princeton University Pres, Princeton, NJ.
Hoekman B. and A. Nicita. 2008. “Trade Policy, Trade Costs and Developing Country Trade”. Policy Research Working Paper, N°4797.
Kee, H.L., Nicita, A. and Olarreaga, M. (forthcoming). “Import demand elasticities and trade distortions”, Review of Economics and Statistics. Kee, H. L., Nicita A. and M. Olarreaga (2009), “Estimating Trade Restrictiveness Indices”. Economic Journal 119, 172:199.
Leamer, E. 1990. “Latin America as a target of trade barriers erected by the major developed countries in 1983”, Journal of Development Economics, vol. 32(2) : 337-368
Mantovani A. and M. Vancauteren. 2003. “The Harmonization of Technical Barriers to Trade, Innovation and Export Behavior: Theory with an
Application to EU data”. Mimeo.
Moenius, J. 2004. “Information Versus Product Adaptation: The Role of Standards in Trade”. International Business and Markets Research Center Working Paper, Northwestern University.
Moenius, J. 2006. “Do National Standards Hinder or Promote Trade in Electrical Products?” IEC Centenary Challenge 2006,
24
Otsuki, T., J.S. Wilson, and M. Sewadeh. 2001a. “Saving Two in a Billion: A Case Study to Quantify the Trade Effect of European Food Safety Standards in African Exports.” Working paper, The World Bank, Washington, D.C.
Otsuki, T., J.S. Wilson, and M. Sewadeh. 2001b. “What price precaution? European harmonisation of aflatoxin regulations and African groundnut exports”, European Review of Agriculture Economics, Vol 28 (3) pp.263-284.
Portugal-Perez A., Reyes J-D and J. Wilson. 2009. “Beyond the Information Tecnology Agreement: Harmonization of Standards and Trade in Electronics”. Policy Research Working Paper, N°4916.
Shepherd B. and J.S. Wilson. 2008. “Trade Facilitation in ASEAN Member Countries: Measuring Progress and Assessing Priorities”, WB Policy Research Working Paper 4615
25 A ANNNNEEXXEESSTTOO N NOOTTEESSOONNDDEETTEECCTTIINNGGTTHHEEEEFFFFEECCTTSSOOFFNNOONNTTAARRIIFFFF M MEEAASSUURREESS By Céline Carrère and Jaime de Melo Annex 1.
UNCTAD trains Coding System of NTMs included in the Kee et al.(2009)’s sample
Annex 2.
26 Annex 1.
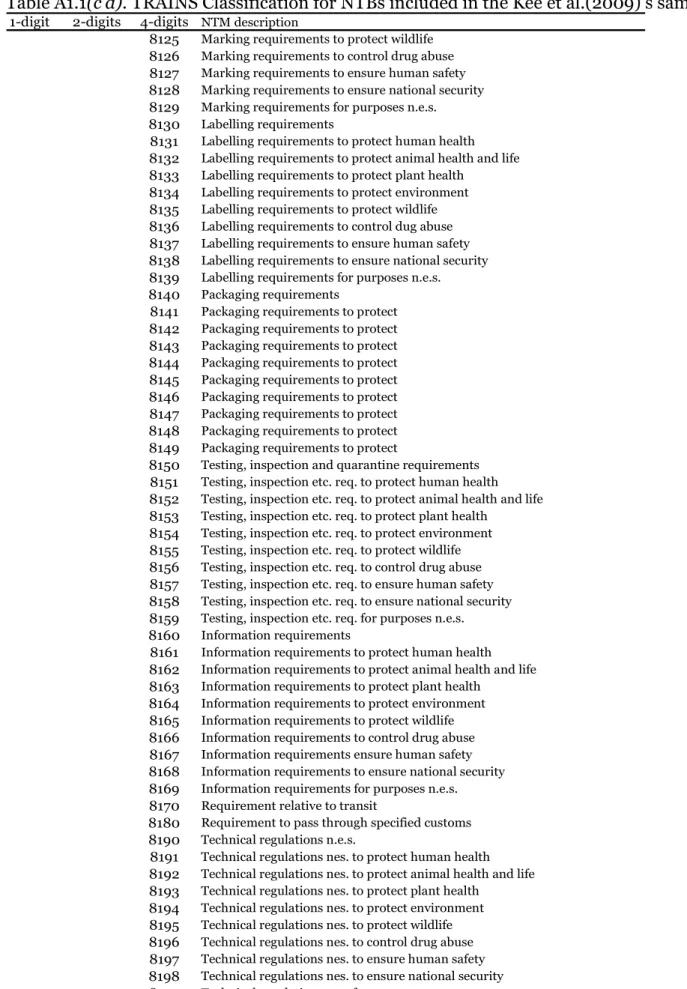
Table A1.1. TRAINS Classification for NTBs included in the Kee et al.(2009)’s sample
1-digit 2-digits 4-digits NTM description
3000 Price control measures
3100 Administrative pricing
3110 Minimum import prices
3190 Administrative pricing n.e.s.
3200 Voluntary export price restraint
3300 Variable charges
3310 Variable levies
3320 Variable components
3330 Compensatory elements
3340 Flexible import fees
3390 Variable charges n.e.s.
6000 Quantity control measures
6100 Non-automatic licensing
6110 Licence with no specific ex-ante criteria
6120 Licence for selected purchasers
6130 License for specified use
6131 Linked with export trade
6132 For purposes other than exports
6140 Licence linked with local production
6141 Purchase of local goods
6142 Local content requirement
6143 Barter or counter trade
6150 Licence linked with non-official foreign exchange
6151 External foreign exchange
6152 Importers' own foreign exchange
6160 Licence combined with or replaced by special import authorization
6170 Prior authorization for sensitive product categories
6171 Prior authorization to protect human health
6172 Prior authorization to protect animal health and life
6173 Prior authorization to protect plant health
6174 Prior authorization to protect environment
6175 Prior authorization to protect wildlife
6176 Prior authorization to control drug abuse
6177 Prior authorization to ensure human safety
6178 Prior authorization to ensure national security
6179 Prior authorization for purposes n.e.s.
6180 License or political reasons
6190 Non-automatic licensing n.e.s.
6200 Quotas
6210 Global quotas
6211 Unallocated
6212 Allocated to exporting countries
6220 Bilateral quotas
6230 Seasonal quotas
6240 Quotas linked with export performance
6250 Quotas linked with purchase of local goods
6270 Quotas for sensitive product categories
6271 Quotas to protect human health
6272 Quotas to protect animal health and life
6273 Quotas to protect plant health
6274 Quotas to protect environment
6275 Quotas to protect wildlife
6276 Quotas to control drug abuse
6277 Quotas to ensure human safety
6278 Quotas to ensure national security
6279 Quotas for purposes n.e.s.
6280 Quotas for political reasons
27
Table A1.1 (c’d). TRAINS Classification for NTBs included in the Kee et al.(2009)’s sample 1-digit 2-digits 4-digits NTM description
6300 Prohibitions
6310 Total prohibition
6320 Suspension of issuance of licences
6330 Seasonal prohibition
6340 Temporary prohibition
6350 Import diversification
6370 Prohibition for sensitive product categories
6371 Prohibition to protect human health
6372 Prohibition to protect animal health and life
6373 Prohibition to protect plant health
6374 Prohibition to protect environment
6375 Prohibition to protect wildlife
6376 Prohibition to control drug abuse
6377 Prohibition to ensure human safety
6378 Prohibition to ensure national security
6379 Prohibition for purposes n.e.s.
6380 Prohibition for political reasons (embargo)
6390 Prohibitions n.e.s.
7000 Monopolistic measures
7100 Single channel for imports
7110 States trading administration
7120 Sole importing agency
7170 Single channel for imports for sensitive product categories
7171 Single channel for imports to protect human health
7172 Single channel for imports to protect animal health and life
7173 Single channel for imports to protect plant health
7174 Single channel for imports to protect environment
7175 Single channel for imports to protect wildlife
7176 Single channel for imports to control drug abuse
7177 Single channel for imports to ensure human safety
7178 Single channel for imports to ensure national security
7179 Single channel for imports for purposes n.e.s.
7200 Compulsory national services
7210Compulsory national insurance
7220Compulsory national transport
7900 Monopolistic measures n.e.s.
8000 Technical measures
8100 Technical regulations
8110 Product characteristics requirements
8111 Product characteristics req. to protect human health
8112 Product characteristics req. to protect animal health and life
8113 Product characteristics req. to protect plant health
8114 Product characteristics req. to protect environment
8115 Product characteristics req. to protect wildlife
8116 Product characteristics req. to control drug abuse
8117 Product characteristics req. to ensure safety
8118 Product characteristics req. to ensure national security
8119 Product characteristics req. for purposes n.e.s.
8120 Marking requirements
8121 Marking requirements to protect human health
8122 Marking requirements to protect animal health and life
8123 Marking requirements to protect plant health
28
Table A1.1(c’d). TRAINS Classification for NTBs included in the Kee et al.(2009)’s sample
1-digit 2-digits 4-digits NTM description
8125 Marking requirements to protect wildlife
8126 Marking requirements to control drug abuse
8127 Marking requirements to ensure human safety
8128 Marking requirements to ensure national security
8129 Marking requirements for purposes n.e.s.
8130 Labelling requirements
8131 Labelling requirements to protect human health
8132 Labelling requirements to protect animal health and life
8133 Labelling requirements to protect plant health
8134 Labelling requirements to protect environment
8135 Labelling requirements to protect wildlife
8136 Labelling requirements to control dug abuse
8137 Labelling requirements to ensure human safety
8138 Labelling requirements to ensure national security
8139 Labelling requirements for purposes n.e.s.
8140 Packaging requirements
8141 Packaging requirements to protect
8142 Packaging requirements to protect
8143 Packaging requirements to protect
8144 Packaging requirements to protect
8145 Packaging requirements to protect
8146 Packaging requirements to protect
8147 Packaging requirements to protect
8148 Packaging requirements to protect
8149 Packaging requirements to protect
8150 Testing, inspection and quarantine requirements
8151 Testing, inspection etc. req. to protect human health
8152 Testing, inspection etc. req. to protect animal health and life
8153 Testing, inspection etc. req. to protect plant health
8154 Testing, inspection etc. req. to protect environment
8155 Testing, inspection etc. req. to protect wildlife
8156 Testing, inspection etc. req. to control drug abuse
8157 Testing, inspection etc. req. to ensure human safety
8158 Testing, inspection etc. req. to ensure national security
8159 Testing, inspection etc. req. for purposes n.e.s.
8160 Information requirements
8161 Information requirements to protect human health
8162 Information requirements to protect animal health and life
8163 Information requirements to protect plant health
8164 Information requirements to protect environment
8165 Information requirements to protect wildlife
8166 Information requirements to control drug abuse
8167 Information requirements ensure human safety
8168 Information requirements to ensure national security
8169 Information requirements for purposes n.e.s.
8170 Requirement relative to transit
8180 Requirement to pass through specified customs
8190 Technical regulations n.e.s.
8191 Technical regulations nes. to protect human health
8192 Technical regulations nes. to protect animal health and life
8193 Technical regulations nes. to protect plant health
8194 Technical regulations nes. to protect environment
8195 Technical regulations nes. to protect wildlife
8196 Technical regulations nes. to control drug abuse
8197 Technical regulations nes. to ensure human safety
8198 Technical regulations nes. to ensure national security
29 Annex 2
Figure A2.1. Distribution of each NTB 2-digits’ AVE over the HS6 products (unweighted and weighted average on the 93 countries, for 2002-04) UnWeighted 0 .5 1 1 .5 2 2 .5 A V E 3100 3300 6100 6200 6300 7100 8100 Import-Weigthed 0 .5 1 1 .5 2 2 .5 A V E 3100 3300 6100 6200 6300 7100 8100
Note: Median AVE in red.