HAL Id: halshs-01385423
https://halshs.archives-ouvertes.fr/halshs-01385423v2
Preprint submitted on 30 Oct 2017HAL is a multi-disciplinary open access archive for the deposit and dissemination of sci-entific research documents, whether they are pub-lished or not. The documents may come from teaching and research institutions in France or abroad, or from public or private research centers.
L’archive ouverte pluridisciplinaire HAL, est destinée au dépôt et à la diffusion de documents scientifiques de niveau recherche, publiés ou non, émanant des établissements d’enseignement et de recherche français ou étrangers, des laboratoires publics ou privés.
The political economy of non-tariff measures
Cristina Herghelegiu
To cite this version:
The political economy
of non-tariff measures
Cristina HERGHELEGIU Paris School of Economics
September 2017
This work has been supported by the French National Research Agency, through the program Investissements d'Avenir, ANR-10-LABX-93-01
G-MonD
Working Paper n°47
The political economy of non-tariff measures
*
Cristina Herghelegiu
†September 10, 2017
Abstract
This paper examines the extent to which non-tariff measures (NTMs) are set for protectionist purposes. Our main focus is on developing countries. Overall re-sults show that NTMs reflect protectionist forces, in particular for those that have been subject to trade concerns at the World Trade Organization (WTO). For the other measures, there is no evidence that protectionism is the driving force be-hind their adoption, suggesting that their determinants may be associated with legitimate goals such as consumer health and safety. Furthermore, transnational lobbying, defined as the participation of national business groups at the Ministe-rial Conferences - the highest authority of the WTO - is positively associated with the probability of adopting NTMs.
JEL codes: F13, F14, D72
Keywords: Non-tariff measures, political economy, international trade, lobbying
*I owe special thanks to Anne-Célia Disdier for her continuous support, encouragement and
guid-ance. I wish to thank Chris Milner, an anonymous referee, as well as John C. Beghin, Marianna Belloc, Renee Bowen, Kristy Buzard, Olivier Cadot, Paola Conconi, Marco Fugazza, Chantal Le Mouël, Marcelo Olarreaga, Sandra Poncet, and Luca Salvatici for useful comments and suggestions. I also appreciate the suggestions of participants at the GSIE Seminar (Paris, June 2015), the ETSG annual conference (Paris, September 2015), the 2nd Workshop MAD (Bordeaux, November 2015), the PEIO Conference (Salt Lake City, January 2016), the CFDS Seminar (Paris, May 2016) and the 16th Doctoral Meetings in International Trade and International Finance (Florence, July 2016). I am especially grateful to Marcel Hanegraaff for generous help with the data. This paper has received funding from the FP7 of the European Commission (EC), under the PRONTO Project (Productivity, Non-Tariff Measures and Openness), grant agreement 613504, and from the European Union’s Seventh Framework Programme FP7/2007-2011 under Grant Agreement n 290693 FOODSECURE. The author alone is responsible for any omissions or deficiencies. Neither the FOODSECURE project and any of its partner organizations, nor any organization of the European Union or European Commission are accountable for the content of papers.
†Contact information: Paris School of Economics - Université Paris 1 Panthéon-Sorbonne, 48
1
Introduction
Over the last decades, multilateral and regional trade negotiations have led to mas-sive liberalization through tariff reductions. As a result, attention has shifted towards non-tariff measures (NTMs), which are more diverse and complex policy instruments. The main objective of early measures (e.g. quotas, antidumping duties) was to replace tariff protection (Baldwin,1984;Anderson and Schmitt,2003). Over the years, global-ization has been associated with greater interdependency among States and new types of NTMs have proliferated in response to public policy objectives (i.e. health and safety of consumers, environmental protection). However, the same NTMs may be used to pursue both legitimate and protectionist goals and the boundary between the differ-ent motivations is very thin. Depending on the reasons that lie behind the adoption and design of NTMs, trade effects may be very different. For instance, if NTMs seek to correct a market failure such as information asymmetry, trade may be enhanced as con-sumer confidence in the foreign product will increase demand for it. When countries employ NTMs to protect domestic producers, they are likely to induce negative trade effects on partners. This paper analyzes the reasons that may prompt a government to implement non-tariff protection in the manufacturing industries.1
Our main focus is on developing countries. Over the recent years, these countries have adopted a growing number of NTMs. On average, slightly more than half of de-veloping countries’ imports (in value) and almost half of their imported products are affected by at least one NTM. Some products, especially in the agri-food sector, are highly regulated, in response to growing concerns regarding health, safety and envi-ronmental quality, whereas some other products are as a matter of course less affected by non-tariff protection (Gourdon,2014).
Different types of measures exist and, owing to the UNCTAD (United Nations Con-ference on Trade and Development) new coding system, NTMs can be classified ac-cording to their intended goal (Cadot, Malouche, and Saez, 2012). Both sanitary and phytosanitary measures (SPS) and technical barriers to trade (TBT), also known as
nical measures, are officially designed to achieve public policy objectives. They con-stitute the bulk of NTMs, applying to a wide range of products. However, these are complex policy tools and, despite their official status, they can also be used for political economy reasons, becoming unnecessary barriers to trade (WTO,2012). Non-technical measures, such as contingent, quantity or price control measures, are trade regulatory instruments. Unlike SPS and TBT measures, their distortionary effect on trade is well documented (Gourdon and Nicita,2013). In other words, if tariffs are committed to in the WTO and difficult to raise, governments have more room for maneuver when it comes to NTMs, being able to respond to pressures from both producer and consumer lobbies.
However, NTMs may also be subject to international scrutiny and discipline to a certain extent. Increasing efforts are made by the WTO to boost the transparency of trade policies worldwide. Under the SPS and TBT Agreements, WTO members are re-quired to notify all the adopted regulations. Nevertheless, there may be little incentive for countries to do so. As this may jeopardize the transparency process, alternative mechanisms have been implemented. For instance, exporters that are negatively af-fected by SPS and TBT measures imposed by their trading partners can raise Specific Trade Concerns (STCs) in the SPS and TBT Committees at the WTO (Bacchetta et al., 2012). Thus, they question whether the implemented SPS and TBT measures adhere to the previously mentioned agreements. According to Horn et al.(2013), by raising STCs, exporters convey a signal suggesting that there are reasons to interrogate the legitimacy of certain measures under the SPS and TBT agreements. These STCs are therefore an interesting source of information as they reveal the restrictive and po-tentially non-legitimate character of certain technical measures. One example is the concern raised in October 2009, by Brazil against South Africa.2 South African imports of beef and pork meat from Brazil had been suspended, because of a foot-and-mouth disease (FMD) outbreak. However, the FMD outbreak had only affected the bovine herd and South Africa’s rejection of Brazilian pork meat could not be scientifically
tified. By raising an STC, Brazil required South Africa to respect the SPS Agreement, so that exports of the affected products could resume soon, as the ban was unjustified and excessive.
As for non-technical measures, they are not the subject of specific trade concerns discussions. The motivations behind their use are easier to understand. However, they can be challenged through the Dispute Settlement Mechanism.
This paper explores the political economy determinants of NTMs in different de-veloping countries. A case study is also conducted for two developed countries (the EU and Japan) for comparison purposes. Relying on a very comprehensive dataset on NTMs, our analysis is run at a highly disaggregated level - the 6-digit level of the Har-monized System (HS) - and includes several types of measures, from both technical and non-technical categories.
Our contributions to the literature are two-fold. First, we take into account the fact that NTMs may be adopted for both protectionist and legitimate purposes. On the one hand, as previously mentioned, non-technical measures have been traditionally used as instruments of commercial policy and their trade restrictive character is well-documented. On the other hand, technical measures, such as SPS and TBT measures, may pursue both public policy and political economy objectives, inducing different ef-fects on trade. Therefore, besides the analysis conducted on all NTMs taken together, regardless their nature, we also distinguish between restrictive and non-restrictive measures. This analysis is intended to shed more light on the reasons leading govern-ments to adopt NTMs. In order to track restrictive measures, we proceed as follows. Non-technical measures are considered as de facto restrictive. Technical measures are considered as restrictive only if they have been raised as concerns in the SPS and/or TBT Committees at the WTO.
Second, we go a step further and examine the relationship between transnational lobbying and the adoption of NTMs at the national level. As national policies increas-ingly fall under the influence of international rules, governments become more and more limited in their power to set trade policy and raise trade barriers. Hence,
be-yond national lobbying, we expect transnational lobbying to play an important role in trade policy decisions. Over the last decade, the WTO has increased its openness towards non-governmental actors (Steffek and Kissling, 2006;Van den Bossche, 2008) and national interest groups have been allowed to attend the Ministerial Conferences (MCs), the highest decision-making body of the WTO. Various interests are represented at these conferences, such as business associations, non-governmental organizations (NGOs), labor unions, and institutions (Hanegraaff, Beyers, and Braun, 2011). We fo-cus on national business groups, as they can easily be attributed to a given industry. The presence of these groups at the MCs can have further implications for national policy decisions through different mechanisms. For instance, the pressure exerted by business groups during these multilateral negotiations may lead to an international consensus regarding NTMs to the advantage of their origin countries. All members have to comply with the WTO’s decisions and transnational lobbying is a way for some organizations to turn the situation in their favor. Also, the influence of business groups may be such that an international consensus is not reached, which might be exactly what they expect, in order to maintain their national NTMs. Although we are not able to thoroughly disentangle the different mechanisms at play, we attempt to indirectly infer which scenario is more plausible (Subsection5.3). Relying on an origi-nal and exhaustive dataset including all business groups that have attended the WTO MCs over time, we proxy transnational lobbying through the participation of national business groups at the MCs.
Our results suggest that, beyond their legitimate purposes, NTMs adopted by de-veloping countries are also driven by political and economic motivations. Products that have experienced reductions in tariffs and sectors confronted with import com-petition and characterized by high levels of employment are the ones with a higher probability of receiving NTM protection. This result is reinforced for restrictive NTMs, but does not hold for non-restrictive measures. Finally, transnational lobbying is also positively and significantly related to the adoption of NTMs at the national level, in particular the restrictive ones.
The paper is organized as follows. Section 2 reviews the literature on the politi-cal economy determinants of NTMs. Section 3describes the data. Section 4presents the empirical strategy, while Section5reports the results and some robustness checks. Section6concludes.
2
Literature review
This paper contributes to the empirical literature on the political economy determi-nants of NTMs. Over the last decades, two major developments have sparked im-portant advances in this field. First, the literature addresses the endogeneity problem between NTM protection and import penetration. Focusing on the United States (US), Trefler (1993) shows that a rise in import penetration leads to greater protection. The magnitude of this effect is 10 times more important than in previous models where pro-tection has been treated as exogenous. Lee and Swagel(2000) extend Trefler’s study to 41 countries. Results show that, even after controlling for industry and country spe-cific factors, governments grant more NTM protection to industries that are weak, in decline, politically important, or threatened by import competition.
Second, different methods have been used to further investigate the political econ-omy determinants of NTMs. A first strand of literature explores the substitution be-tween tariffs and NTMs. Results are mixed.Moore and Zanardi(2011) analyze whether the adoption of anti-dumping measures between 1991 and 2002 has been influenced by reductions in tariffs. Evidence for policy substitution is only found for a few countries that use anti-dumping measures intensively. Beverelli et al. (2014) show that policy substitution between tariffs and TBTs prevails in developed countries, where it is less costly to comply with product standards. These predictions are based on trade re-strictive TBTs, that have been subject to STCs. Orefice(2016) studies whether NTMs become effective barriers to trade as a consequence of reductions in tariffs. To do so, he studies trade restrictive SPS and TBT measures (i.e. linked to STCs). He finds that both SPS and TBT concerns are expressed by the exporting country after tariff cuts in the importing country.
A second strand of literature explores the influence of business groups on trade policy, based on different criteria. Mitra, Thomakos, and Uluba¸soglu (2002) adapt the protection for sale (PFS) model developed byGrossman and Helpman(1994)3to NTMs in Turkey. By considering industries as politically organized if they are members of one of the most important Turkish industrial organizations (the TUSIAD), they find sup-port for the fundamental predictions of the PFS model. Nevertheless, the TUSIAD is a general interest business organization and membership of this organization does not necessarily capture pure trade policy concerns. Belloc(2015) addresses this issue by focusing on protectionist pressures at the European level. She studies the influence of business groups on European trade policy. To do so, she uses consultations organized by the European Union (EU) with the civil society as a proxy for the lobbying power of interest groups. Results show that consultations have a significant and positive impact on NTM protection. Hanegraaff, Braun, De Bièvre, and Beyers (2015) go beyond the previous studies and focus on transnational lobbying. They analyze the factors moti-vating the presence of domestic organized interests at the WTO MCs during the period 1995-2011. Results suggest that organized interests without domestic policy attention or access to basic resources will not easily turn their attention to the international level. This paper investigates further the political economy determinants of NTMs, fo-cusing on developing countries. Compared to the previous studies, we integrate both methods recently used to analyze the political economy of non-tariff protection. First, we consider the potential policy substitution between tariffs and NTMs. Second, we analyze whether the participation of domestic business groups at the WTO MCs is related to the national policy decisions. Thus, we are able to reveal that not only legit-imate, but also political and economic factors trigger the use of NTMs, especially for the restrictive ones.
3The PFS model shows that the level of tariff protection granted by a government maximizes a
combination of the general welfare and the contributions of politically organized groups. Results point to higher protection in industries represented by lobbies and with a lower import elasticity.
3
Data
This section presents the data used in the empirical analysis, their characteristics, the rationale behind their use, as well as some descriptive statistics. Our paper focuses on developing countries, but a case study is also conducted for two developed economies (the EU and Japan).
3.1
NTMs
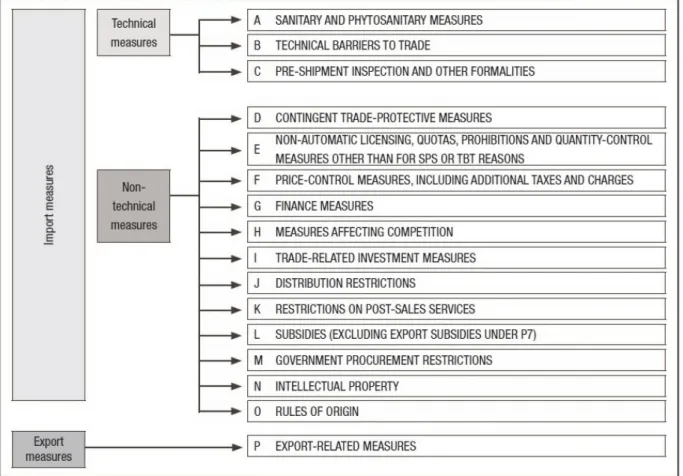
This study relies on the 2014 version of the CEPII NTM-MAP database,4which uses the UNCTAD TRAINS (Trade Analysis Information System) database as source (Gourdon, 2014). The classification of NTMs has a two-tier structure: import-related measures, imposed by the importing country, and export measures, imposed by the exporting country itself. Import measures are further categorized as either technical or non-technical measures. Technical measures refer to SPS measures, TBTs and pre-shipment inspections. Non-technical measures include hard measures (price and quantity con-trols), threat measures (anti-dumping and safeguards) and other measures (trade-related finance and investment measures). A detailed classification is presented in Figure1.
Figure1about here
The CEPII NTM-MAP dataset focuses on the first five chapters5of the above clas-sification. Other measures are not included because of difficulties in data collection. NTMs are aggregated at the 6-digit level of the HS classification and spread over 5,000 different products. Data are available for a single year over the 2010-2012 period, and the database includes 40 developing countries.6 Regarding developed economies, it unfortunately covers only Japan and the EU, with the EU25 Member States considered separately. All in all, the database provides the total number of measures imposed by a
4CEPII NTM-MAP:http://www.cepii.fr/cepii/en/bdd_modele/presentation.asp?id=28. 5Chapter A (Sanitary and Phytosanitary measures); Chapter B (Technical Barriers to Trade); Chapter
C (Pre-shipment inspection and other formalities); Chapter D (Contingent trade-protective measures); Chapter E (Non-automatic licensing, quotas, prohibitions and quantity-control measures other than for SPS or TBT reasons).
country on an HS6 product for each of the five chapters previously mentioned. Due to limited availability of other data needed in the analysis, we restrict our sample to 13 de-veloping countries (see Table1). For our case study concerning developed economies, we rely on the EU and Japan. Even though countries from the EU have been included separately in the initial dataset, we construct an overall measure for the EU as a whole. Since trade policy is set at the European level and all members have to comply with the European decisions, we believe that this approach is more appropriate.
Table1about here
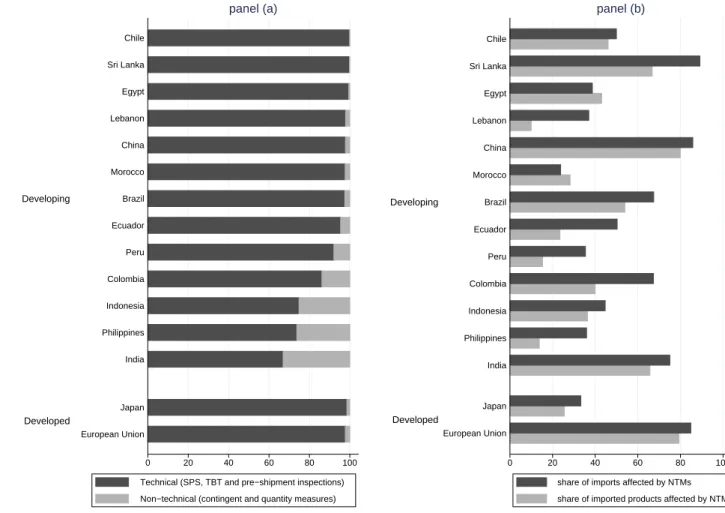
In what follows, we analyze the data more carefully, in order to understand the importance of NTMs for our sample. In developing countries, 40.2% of all products are affected by at least one NTM. As depicted in Figure2, the majority of NTMs consist in technical measures. For 9 out of 13 developing countries, technical measures constitute more than 90% of all NTMs. As for the other 4 countries (Colombia, India, Indonesia, Philippines), technical measures account for more than 60% of all NTMs. India has the lowest share, with around 65% of its NTMs being of a technical nature. Nevertheless, NTMs affect these countries to different extents. Among the countries with very high shares of technical measures (over 90%), only 3 – Sri Lanka, China, Brazil – impose some form of NTMs on more than 60% of their total imports and imported products. Other countries are less affected. On the other hand, India, the country with the lowest share of technical measures, imposes NTMs on more than 65% of its total imports and imported products. When it comes to the EU and Japan, we notice that more than 95% of their measures are technical. Contrary to the EU, where more than 80% of imports (in value) and imported products are subject to NTMs, in Japan NTMs affect less than 30% of total imports and imported products. However, even though the share of imports and imported products is low, the measures imposed may still be very restrictive and seriously limit imports. At this point, we are not able to make any statement about the actual restrictiveness of the measures imposed.
Our analysis also distinguishes between restrictive versus non-restrictive NTMs. An NTM is seen as restrictive if it negatively impacts trade flows, being potentially implemented for other reasons than to protect consumers’ health or safety in the im-porting country. Thus, exim-porting countries negatively affected by certain NTMs can raise STCs in the dedicated commissions at the WTO. Information on SPS and TBT measures that have been subject to STCs is recorded by the WTO in the SPS and TBT Information Management Systems (IMS).7It refers, among other things, to the export-ing country raisexport-ing the concern, the importexport-ing country maintainexport-ing the measure, the products involved (detailed at the 4-digit level of the HS classification), the date when the concern was first raised, and the dates when the concern was subsequently raised or resolved. As there exists no database including all these elements for the period under observation in this study, we constructed a detailed database, putting together all the items of information previously mentioned.
To track restrictive SPS and TBT measures, we merge the NTM and STC datasets, proceeding as follows. First, NTMs are unilateral, applying equally to all exporters, whereas STCs are bilateral. In order to match the two datasets, we consider that if at least one exporter has raised a concern against an importer for a given product, SPS and TBT measures imposed on that product by the importer in question are restrictive. This approach limits the selection problem which may arise from the fact that some countries never raise STCs as they do not have the financial means to do so or as they may be afraid of retaliatory responses. Our measure encompasses these potential “non-raised” STCs against an importer for a given product, conditional on the fact that there is at least one exporter who raises a concern for the product and importer considered.
Second, NTMs are detailed at the 6-digit level of the HS classification, whereas STCs are detailed at the HS4 level. In order to match the two datasets, we associate each STC with all HS6 digit products within an HS4 heading. This may lead to a slight overestimation of the number of restrictive measures in our sample, but it is the only way to proceed in order to maintain a high level of disaggregation of the data. In the
7SPS IMS (http://spsims.wto.org/en/SpecificTradeConcerns/Search) and TBT IMS (http://
case of agri-food products, if a disease affects the bovine herd, all HS6 products will be affected. So, even if the information on STCs is detailed at the 4-digit level of HS, we can rightly assume that all products within an HS4 heading are concerned. The overestimation may potentially be related to the other manufacturing industries. In order to make sure that it does not hinder the validity of our results, we conduct an estimation aggregating the data at the HS 4-digit product level.
Third, in terms of timing, we proceed as follows in order to associate STCs with the corresponding NTMs. According toBeverelli et al.(2016), the majority of STCs are associated with newly implemented measures. For instance, 88.7% of TBT STCs refer to very recent measures (i.e. measures notified either the year before or the year during which an STC was filled). STCs may also refer to NTMs that are still draft regulations, not implemented yet (Fontagné et al., 2015).8 Thus, in our empirical analysis, we as-sume that an NTM implemented in t could lead to STCs for the first time in t-1, t, or t+1.
For each country in our sample, the NTM-MAP dataset provides the stock of mea-sures in a given year over the period 2009-2012 (see Table1). Unfortunately, the year of adoption of NTMs is not available. Thus, to match NTMs and STCs, we rely on the year during which an STC was raised.
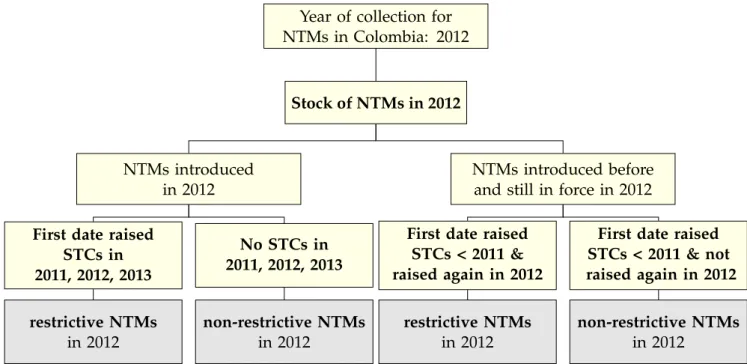
To illustrate our approach, consider the example of Colombia. NTMs data for Colombia have been collected in 2012, meaning that our sample includes all the mea-sures actually adopted in 2012 plus the meamea-sures adopted in previous years and still in force in 2012. Then to associate NTMs with STCs, we proceed as follows (see Figure
3):
• If the STC against a Colombian measure on a given product was raised for the first time in 2011, 2012 or 2013, we assume that the NTM observed in 2012 in the NTM-MAP database is restrictive.
8For instance, in 2011, Turkey raised concern over Brazil’s draft resolution which would define
per-mitted levels of tar, nicotine and carbon monoxide in cigarette smoke and prohibit the use of a com-prehensive list of additives in all tobacco-related products manufactured and sold in Brazil (Brazil – Draft Resolution No. 112, 29 November 2010; maximum levels of tar, nicotine and carbon monoxide permitted on tobacco products and prohibition of additives (G/TBT/N/BRA/407)).
• If the STC was first raised before 2011 and is raised again in 2012, we also consider that the NTM observed in 2012 in the NTM-MAP database is restrictive. Indeed, the concern has not been solved in the meanwhile, and the NTM it is associated with is still considered as restrictive in 2012.
• If the STC was first raised before 2011, but is not raised again in 2012, we suppose that the NTM observed in 2012 in the NTM-MAP database is not restrictive. The concern has been solved in the meanwhile and the measure is no longer restric-tive in 2012.
• Finally, if no STC has ever been raised against a Colombian measure on a given product, we assume that the NTM observed in 2012 in the NTM-MAP database is not restrictive.
Figure3about here
We proceed similarly for all the countries included in our sample. Overall, 107 SPS STCs and 227 TBT STCs were raised for the first time during the 2008-2013 period. Additionally, over the same period, 68 SPS STCs and 156 TBT STCs were subsequently raised.
Furthermore, 27% of all products affected by SPS and/or TBT measures have been subject to SPS and/or TBT trade concerns, underlying the importance of separating restrictive measures from non-restrictive ones. However, the fact of relying on STCs to track restrictive SPS and TBT measures may be problematic because of their endoge-nous nature. For instance, if a product is affected by very high tariffs, there will be no STCs, as there are no imports. In our dataset, 21% of all products are subject to tariffs higher than 15%. A careful analysis of the data shows that among products with tariffs higher than 15% and affected by SPS and/or TBT measures, 25.6% have also been sub-ject to STCs. This share is comparable to the share of STCs for the whole sample (27%), suggesting that the endogeneity issue should be of no concern for the current study.
3.2
Tariffs
To investigate the political economy of NTMs, we also consider tariffs. As previously mentioned, reductions in tariffs may have pushed countries to pursue trade policy goals through NTMs (Bagwell and Staiger, 2001; Anderson and Schmitt, 2003; Eder-ington,2001;Ederington and Bajona,2010). The use of NTMs to partly compensate for reductions in tariffs is known as trade policy substitution. However, tariffs and NTMs are not necessarily substitutes. They may also be complementary instruments (Essaji, 2010). In order to detect potential substitution or complementary effects between tar-iffs and NTMs, we use the variation in tartar-iffs between 2007 and 2010. We also use 2007 tariffs to take into account the initial level of protection. Since we have the stock of measures, the 2007 tariffs may be irrelevant for a measure adopted in 2006 and still in force in 2012. This would also amplify the endogeneity problems related to reverse causality. However, in developing countries, the majority of NTMs have been adopted or modified during the recent years, reducing the extent of this problem. To further validate our results, we proceed to a robustness test, exploiting the variation in tariffs over the period 2004-2010.
Data on tariffs are drawn from MAcMap,9 a database jointly developed by the ITC (International Trade Centre) and the CEPII (Centre d’Etudes Prospectives et d’Informations Internationales). MAcMap contains exhaustive information on bilateral applied tar-iff duties at the 6 digit-level of the HS, taking regional agreements and trade pref-erences into account. As MAcMap provides information for each importer-exporter-product triplet, we aggregate tariffs at the importer-importer-exporter-product level, by computing trade-weighted average tariffs. Trade-trade-weighted average tariffs refer to the average of effec-tively applied tariff rates, weighted by the product import shares, for each partner country. Import data necessary to compute the weighted average tariffs are extracted from BACI.10
9Market Access Maphttp://www.cepii.fr/cepii/en/bdd_modele/presentation.asp?id=12 10BACI provides bilateral values and quantities of imports at a highly disaggregated level (HS6), for
over 200 countries and it is updated every year. The advantage of BACI over other databases, such as COMTRADE, is that it reconciles the declarations of the exporter and the importer.http://www.cepii. fr/cepii/fr/bdd_modele/presentation.asp?id=1.
The MAcMap database was chosen for several reasons. First, since many preferen-tial tariffs are set to zero and cannot be subject to further reductions, it seems reasonable to use effectively applied tariffs, which are more conservative, instead of most-favored nation (MFN) applied tariffs. Second, for several countries used in the analysis, data on MFN applied tariffs are missing for more recent years in other databases, such as TRAINS, and we are not able to precisely infer their values.
3.3
Industrial variables
In order to further explore the political economy of NTMs, we rely on the product and industry characteristics traditionally used in the literature (Trefler, 1993; Belloc, 2015; Gawande and Bandyopadhyay,2000;Maggi and Goldberg,1999).
The industrial variables included in the analysis are the total number of employees, the annual average earnings per employee, the labor share (the share of output des-tined to wages), the import penetration ratio (computed as imports over value added) and the export ratio (the ratio between exports and value added). Industrial data are provided by the United Nations Industrial Development Organization (UNIDO, 2013) and detailed at the 3-digit level of the International Standard Industrial Classifi-cation (ISIC) for each country. Concordance with HS classifiClassifi-cation at the 6-digit level is achieved on the basis of the international system concordance tables. Trade data nec-essary to compute import penetration rates and export ratios are extracted from BACI. As in the case of NTMs, data include the EU Member States separately. We therefore aggregate the number of employees, the output, the earnings, the value added, the imports and the exports at the European level for each 3-digit industry, in order to compute our indicators for the EU as a whole. As NTMs cover the 2010-2012 period and in order to reduce the potential endogeneity problems, we use industrial data cor-responding to 2007, with few exceptions.11 In order to deal with the skewness of the data, we take logs of all independent variables.
11One potential problem may be caused by reverse causality between import penetration and the
presence of NTMs. For instance, high import penetration ratios may lead to a greater probability of adopting NTMs. However, the presence of NTMs may hinder trade, leading to low import penetration ratios. For Egypt, Peru and the Philippines, 2007 data are not available and 2006 data are therefore used.
3.4
Transnational lobbying
Ministerial Conferences are the highest decision-making body of the WTO (Figure4), and they are held every two years. All WTO members are present to discuss different trade-related topics.
Figure4about here
Since 1996, non-governmental actors have been invited to participate in these MCs. Information on all the business groups attending the MCs during the period 1996-2011 has been collected byHanegraaff, Beyers, and Braun (2011), who kindly provided us with the data. The database contains information on each participating business group and the industry it represents, classified according to the 3-digit level of ISIC. For some business groups, information at the 3-digit level was missing. However, information at the 2-digit level was available. For these cases, the missing sectors at the 3-digit level have been replaced with all possible 3-digit sectors within a 2-digit sector.
We restrict our sample to countries for which we have information on NTMs. Of course, not all of them attend the MCs. As we use an exhaustive dataset of MC partici-pants, we consider that if a country is not in the dataset, it means that this country was absent from the Ministerial Conferences.
The number of organizations present at the MCs is presented in Figure5.12 Among developing countries, business groups from India participate the most in the MCs. The other countries are less represented. When it comes to the developed economies, we notice that the EU is extensively represented.13
Figure5about here
12Only national business groups are considered. Transnational business groups are excluded from
the analysis.
13Business groups from the individual Member States also attend the MCs and are included in the
4
Empirical strategy
This section aims to investigate the political economy factors that lead to the adop-tion of NTMs. First, we test whether NTMs are more likely to affect products that have experienced reductions in tariffs and sectors engaged in lobbying activities at the transnational level (equation (1)). This is our baseline estimation. Second, we analyze which driving forces lie behind the adoption of restrictive NTMs compared to the non-restrictive ones (equations (2) and (3)). A pure cross-sectional study is conducted as NTMs are available for a single year between 2010 and 2012.
We start by estimating equation (1) through a linear probability model (LPM), in or-der to maintain a high level of disaggregation of the data (HS6). As non-linear models suffer from the incidental parameter problem caused by the large set of fixed effects, the use of an LPM is the most appropriate solution14. This approach also helps us to go beyond the debate on the coverage and frequency ratios previously used in the litera-ture15. Moreover, the use of an LPM also allows us to directly interpret the coefficients.
NTMski =α0+α1·lobbysi+α2·∆tariffsski+α3·initial tariffsski+
α4·Dsi+δk+γi+eski
(1)
The dependent variable NTMski is defined as a dummy variable set to 1 if country i notifies at least one NTM on product k (6-digit of the HS classification) from industry s (3-digit ISIC codes) (0 otherwise).16 As a sensitivity test, we also replace the dependent variable with the number of measures, instead of using a dummy variable.
Transnational lobbying is introduced as lobbysi. It is a dummy variable set to 1
if at least one business group from a specific industry s in country i has attended at least one of the eight WTO MCs during the period 1996-2011, and 0 otherwise. We also conduct estimations where transnational lobbying is proxied through the number
14However, as a robustness test, we also proceed to a non-linear estimation, using a conditional logit
model.
15Coverage ratios, i.e. the share of imports affected by at least one NTM, suffer from the endogeneity
of the value of imports, whereas frequency ratios, i.e. the share of products affected by at least one NTM, do not take into account the value of imports.
16The CEPII NTM-MAP dataset contains all the NTMs in force. In order to study the probability of
of MCs attended, the frequency of attendance at the MCs, and the number of interest groups that have attended the MCs over time.
The variable ∆tariffsski represents the variation in tariffs for product k in country i between 2007 and 2010. It is defined as ln (1+tariffsski,2010) −ln(1+tariffsski,2007). The variable initial tariffsskiexpresses the initial level of tariffs affecting product k in country i in 2007 and is introduced as ln (1+tariffsski,2007). Dsi is a vector of control variables
at the industry level s for country i, i.e. employment, earnings (per employee), labor share, import penetration and export ratios. All these variables have a logarithmic form. Product (δk) and country (γi) fixed effects are introduced to control for any
prod-uct and country characteristics affecting the probability of NTM adoption.
In the second part of the analysis, we distinguish between the adoption of restric-tive and non-restricrestric-tive NTMs. We consider SPS and TBT measures that have been subject to STCs in the WTO as restrictive, whereas those that have not been raised as concerns are non-restrictive. As for the other types of NTMs (i.e. pre-shipment inspec-tions, contingent-trade protective measures, quantity measures), they are all consid-ered as de facto restrictive.
In order to capture the differential effect of tariff variation on the adoption of re-strictive and non-rere-strictive NTMs, we introduce an interaction term between∆tariffsski and restrictiveski - a dummy set to 1 if the NTM affecting product k (from sector s) in country i is restrictive (0 otherwise). These variables are both aggregated at the HS6 level, which is important for the robustness of our results. Thus, we proceed to the estimation of equation (2), where product k is defined at the HS6 level of aggregation.
NTMsk(hs6),i =β0+β1·lobbysi+
β2·∆tariffssk(hs6),i+β3·∆tariffssk(hs6),i·restrictive NTMsk(hs6),i+
β4·restrictive NTMsk(hs6),i+β5·initial tariffssk(hs6),i+
β6·Dsi+δk(hs6)+γi+esk(hs6),i
(2)
We then seek to understand the differential role of transnational lobbying in the adop-tion of restrictive and non-restrictive measures, by adding an addiadop-tional interacadop-tion
term between lobbysi and restrictiveski. The initial level of aggregation for restrictive
NTMs (6-digit of the HS classification) is much lower than the level of aggregation for transnational lobbying (3-digit of the ISIC Rev. 3 classification). As a consequence, an interaction term between the two variables may lead to biased results. Moreover, the method used to track restrictive NTMs relies on STCs which are originally defined at the HS 4-digit product level. To make sure that we do not introduce a bias in our results due to an overestimation in the number of restrictive measures and/or to the interac-tion term, we increase the level of aggregainterac-tion for our data. Therefore, we estimate the equation (3), where product k is defined at the HS4 level.17 The variables previously defined at the HS6 level, ∆tariffsski and initial tariffsski are aggregated at the HS4 level by doing a simple average. As for NTMs subject to STCs, they have been originally aggregated at the HS4 level and attributed to all HS6 products within an HS4 heading. Therefore, this variable is not subject to changes. The same goes for industrial vari-ables which are defined at the 3-digit level of the ISIC Rev. 3 classification. They do not change within an HS4 heading.
NTMsk(hs4),i =λ0+λ1·lobbysi+λ2·lobbysi·restrictive NTMsk(hs4),i+
λ3·∆tariffssk(hs4),i+λ4·∆tariffssk(hs4),i·restrictive NTMks(hs4),i+
λ6·restrictivesk(hs4),i+λ7·initial tariffssk(hs4),i+
λ8·Dsi+δk(hs4)+γi+esk(hs4),i
(3)
To sum up, through these estimations, we aim to understand whether the same type of motivations drive the use of restrictive and non-restrictive NTMs. Results presented in the following section are robust to heteroskedasticity.
5
Results
This section is organized as follows. Subsection5.1 describes the results from the esti-mation of equations (1) and (2). A case study for the EU and Japan is also conducted, in
17However, if we keep the original level of aggregation for product k, that is the HS6 level, our results
order to understand whether the pattern found for developing countries also applies in the case of these two developed economies. Subsection 5.2presents several robust-ness checks for the baseline equation (1). Finally, Subsection5.3 shows the results for the estimation of equation (3).
5.1
Determinants of NTMs in developing countries
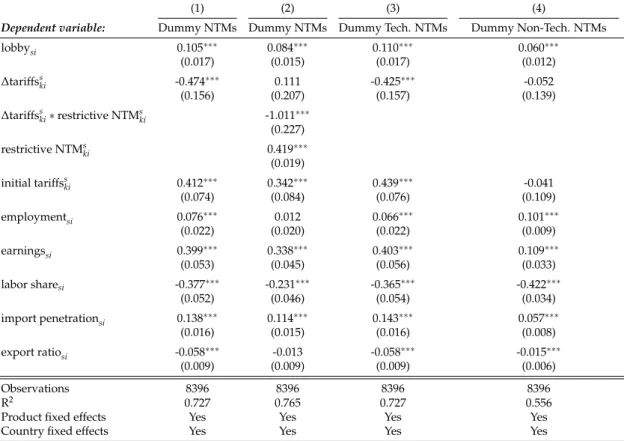
We first investigate the main factors that lead developing countries to adopt NTMs (Table2). The dependent variable is a dummy set to 1 if a country notifies at least one NTM on an HS6 product (0 otherwise). In the first column we provide results for the estimation of equation (1). In the second column, we show results for the estimation of equation (2).
The CEPII NTM-MAP database also allows us to differentiate between technical and non-technical NTMs. Technical measures include SPS and TBT measures and pre-shipment inspections, while non-technical measures include contingent trade protec-tive measures and quantity measures.18 Therefore, we also estimate equation (1) sep-arately for technical and non-technical measures to check whether there are important differences in the factors leading to the implementation of NTMs depending on the type of measures we analyze. Column (3) presents the results for technical measures, whereas column (4) shows the results for non-technical measures.
Table2about here
We first focus on the estimation of equation (1) over all NTMs (column 1). In this estimation, we analyze the relationship between the probability of adopting NTMs and transnational lobbying, defined through the participation of domestic business groups at the MCs. During these conferences, negotiations are mainly conducted by States. One may argue that the role of domestic interest groups in the transnational decision-making process - which may have further implications on national trade policies - is
18We rely on the MAST classification, which includes pre-shipment inspections among technical
mea-sures, along with SPS and TBT measures. Some other classifications include pre-shipment inspections in the group of non-technical measures. When pre-shipment inspections are considered as non-technical measures, the results – available upon request – presented in what follows still hold.
rather limited. Lobbying at the national level would seem a more appropriate solution for domestic business groups. However, domestic business groups keep attending these MCs. Since business groups are willing to pay all the costs associated with the participation in these conferences, their impact may not be insignificant. Moreover, the weakening of the national decision-making process makes interest groups likely also to go lobby at the transnational level (Hanegraaff et al.,2011).
Indeed, as shown by Hanegraaff (2015), advocacy is the primary reason for the participation of interest groups at the 2011 MC in Geneva. Even interest groups for whom advocacy was not the primary goal declared that they practiced it at some point. Moreover, when asked if they thought that they had an impact on the decision-making process, all interest groups from all over the world said that they attended conferences to influence decisions.
The results show that the coefficient on the lobbying variable is positive and highly significant. In other words, if at least one business group representing a given in-dustry attended at least one of the eight MCs held during the time span considered (1996-2011), the probability for the products within that industry to be subject to NTMs increases by 9.8%.
We now turn to the main channel traditionally used in the literature to study the political economy of NTMs, that is the substitution between tariffs and NTMs. The coefficient on tariff variation between 2007 and 2010 is negative and statistically signif-icant, providing evidence that, on average, there is policy substitution. For instance, a 1% reduction in tariffs over the period 2007-2010 is associated with an increase in the probability of adopting NTMs by 0.107%. This suggests that NTMs are mainly used by developing countries to replace tariffs. These results are in line with the predictions of the status quo model by Corden(1974) andLavergne (1983). Governments seek to maintain the status quo: if protection granted through tariffs has decreased, in order to maintain the same level of protection, governments may replace it by NTMs. There-fore, a negative coefficient on tariff variation may reveal protectionist intentions behind the adoption of NTMs. These results are also in line with the conclusions of more
re-cent empirical tests (Moore and Zanardi,2011;Orefice,2016). The initial level of tariffs (2007 tariffs) is not significantly related to the probability of adopting NTMs. Thus, products characterized by high tariffs in 2007 do not appear to experience a signifi-cant lower probability of receiving non-tariff protection later on (during the 2010-2012 period).
The results also suggest that industries characterized by high levels of employment have a higher probability of being granted NTM protection. In industries where the employment level increases by 1%, the probability of adopting NTMs increases by 0.045%. This result supports the adding machine model byCaves(1976), who argues that industries with high levels of employment receive greater protection, as govern-ments may be interested in their political support. The results are also in line with empirical tests (Trefler,1993;Gawande and Bandyopadhyay,2000;Belloc,2015).
According to the social change model (Ball, 1967; Constantopoulos, 1974; Fieleke, 1976), governments may act on social justice grounds, trying to protect low income groups. As a consequence, protection should be higher in industries with low earn-ings per employee and with an important labor share. However, there is no clear con-sensus regarding the expected evolution of these two variables. In our case, policy makers do not seem to grant more protection to weak industries. We find that earn-ings per employee have a positive and significant effect on the probability of adopting NTMs. Similarly, industries with an important labor share tend to be characterized by a smaller probability of being granted NTM protection and the results are statisti-cally significant. Furthermore, we show that the probability of adopting NTMs is more important in industries affected by high import penetration ratios. If import compe-tition increases by 1%, the likelihood for a product to be subject to NTMs increases by 0.026%. These results are in line with the comparative cost hypothesis developed byFeenstra and Bhagwati(1982), who suggest that protection should be higher in in-dustries affected by import competition.Trefler(1993) was the first to show empirically that NTM protection is significantly higher in industries characterized by high levels of import penetration. Other papers find similar results (Maggi and Goldberg,1999;Lee
and Swagel, 2000; Gawande and Bandyopadhyay, 2000;Belloc, 2015). As for exports, Feenstra and Bhagwati (1982) predict that protection should be higher in industries with a low ratio of exports. In our case, export ratios are not significantly related to the probability of adopting NTMs, but the sign is negative.
Of course, the adoption of NTMs for legitimate reasons cannot be ruled out with the previous estimations. Therefore, by estimating equation (2) we seek to understand whether the factors triggering the adoption of non-restrictive measures are different from those motivating the implementation of restrictive ones. Among the restrictive measures we count the SPS and TBT measures that have been subject to STCs, along with all the other measures (i.e. pre-shipment inspections, contingent trade protective measures and quantity measures), which are considered as de facto restrictive. By con-trast, non-restrictive measures are SPS and TBT measures that have not given rise to STCs. Column (2) reports the results. The coefficient on transnational lobbying defined through the participation at the MCs is still positive and significant. Thus, the probabil-ity of adopting an NTM after attending at least one MC increases by 8%. Furthermore, we obtain a positive and significant coefficient on tariff variation and a negative and significant coefficient on the interaction term between tariff variation and the dummy for restrictive measures. In other words, we find evidence for policy substitution in developing countries, but only in the case of restrictive measures. A 1% reduction in tariffs increases the probability of adopting a restrictive NTM by 0.918%. The coeffi-cient on the initial level of tariffs is negative and significant. The higher the initial level of tariffs on a product, the lower the probability to adopt NTMs, since these products are already protected initially. All the other results are qualitatively the same, except for the labor share which becomes statistically insignificant when we control for the restrictiveness of NTMs.
The last two columns of Table 2 present the results from the estimation of equa-tion (1) for technical and non-technical measures, respectively. The coefficient on transna-tional lobbying is positive and significant for both technical and non-technical mea-sures, but it is higher for technical measures. As for tariff variation, the coefficient is
negative and highly significant for technical measures and positive and highly signif-icant for non-technical measures. This suggests that technical measures are used to replace tariff protection, whereas non-technical measures are used as complements to tariff protection. Technical measures might be preferred to substitute tariff protection because they are complex policy measures, more difficult to track. The initial level of tariffs is negative and significant for technical measures, but positive and significant for non-technical measures. Concerning the industrial variables, the results for techni-cal measures and non-technitechni-cal measures are similar and generally in line with those obtained for all types of NTMs considered together.
Case study: the EU and Japan
We now run the same analysis for the EU and Japan, in order to see which forces drive the adoption of NTMs in these two developed economies and whether they are comparable to those at play in the developing countries. The EU is considered as a whole because trade policy is set at the European level. Table 3 presents the results, following the same logic as Table2.
Table3about here
We notice that for the EU and Japan, participation at the MCs is positively and significantly related to the probability of adopting NTMs and the coefficient is com-parable to the one found for developing countries. We also find evidence for policy substitution, but in the case of the EU and Japan, the coefficient is higher. We show that a 1% reduction in tariffs increases the probability of adopting NTMs by 0.474%, compared to 0.107% for the developing countries. All industrial variables have the same sign and statistical significance. The only difference is given by the coefficient on the initial level of tariffs, which is positive and significant. In the case of these two developed economies, the higher the initial level of tariffs, the higher the probability to adopt NTMs. We then proceed to the estimation of equation (2). Transnational lob-bying still correlates positively with the adoption of NTMs. We also show that policy substitution only occurs for the restrictive NTMs. Furthermore, the results suggest that
transnational lobbying defined through the participation at the MCs is positively re-lated to the adoption of both technical and non-technical measures. Policy substitution is found only in the case of technical measures. Tariff variation is not significantly as-sociated with the adoption of non-technical measures. This result differs from the one obtained for developing countries (Table 2). Industrial variables are similar between technical and non-technical measures and in line with those obtained for all NTMs.
Overall, in the EU and Japan both transnational lobbying and tariff variation seem to be correlated with the probability of adopting NTMs. This finding is similar to the one previously highlighted for developing countries.
5.2
Sensitivity analysis
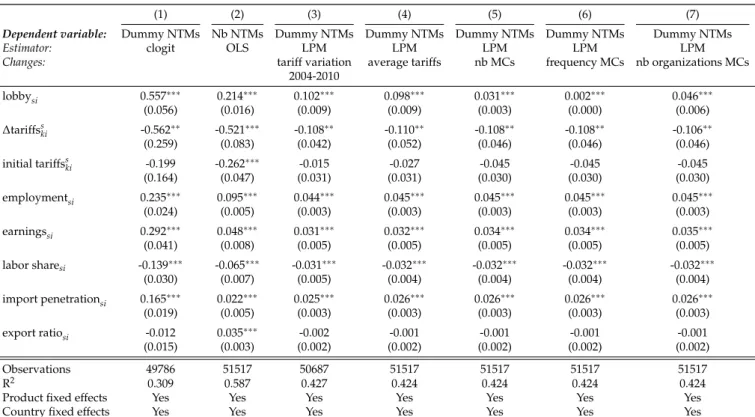
This section includes different robustness checks for the baseline equation (1). Results are presented in Table4.
First, we estimate equation (1), using a conditional logit model instead of an LPM. The coefficients of this estimation, reported in column (1), are odds ratios. The results are qualitatively the same as those obtained through an LPM.
Second, we replace the dependent variable with the number of NTMs affecting an HS6 product; that is, instead of a dummy variable set to 1 if an NTM affects a product, the dependent variable is now defined as the logarithm of 1 plus the number of measures. We rely on an OLS estimation.19 The results are reported in column (2) and are very similar to the baseline ones, where the dependent variable is binary. For instance, the participation of domestic groups at the MCs increases the number of NTMs by 0.2. Furthermore, a 2% reduction in tariffs over the 2007-2010 period leads to the adoption of one additional measure. The coefficient on the initial level of tariffs is negative and significant. The other variables have the same relationship with the number of adopted NTMs, as previously with the probability of implementing NTMs. For instance, governments tend to grant more NTMs to industries with high
19Results also hold if we run a Poisson estimation for the case where the dependent variable is defined
as the number of NTMs. The Poisson estimator allows us to consider the situations where there are no NTMs, without imposing the logarithmic form on the number of NTMs.
import penetration ratios and characterized by a high level of employment. The only difference is the coefficient on export ratio, which is now positive and significant.
Third, we proceed to a sensitivity test using the variation in tariffs between 2004-2010. This helps us limit the endogeneity problems associated with reverse causality. The results are presented in column (3). We notice that results are very much in line with those obtained before. The coefficients have the same sign and statistical signifi-cance.
Fourth, we carry out a robustness check using a simple average for tariffs. As men-tioned in the data section, tariffs have been computed as a weighted average. However, such an approach may lead to endogeneity problems. By contrast, a simple average limits this issue. The results are summarized in column (4). The coefficients are very similar to the ones obtained with the weighted mean approach and their statistical significance is unchanged (see Table2for comparison).
Finally, columns (5), (6), and (7) use alternative definitions for transnational lobby-ing. We consider, respectively, the number of attended MCs for industry-country pairs, the frequency of attendance at the MCs for industry-country pairs, and the number of organizations within industry-country pairs present at the MCs over time. In all these cases, we find a positive and significant relationship between transnational lobbying and the probability of adopting NTMs.
Table4about here
5.3
Further exploring transnational lobbying
In this section, we seek to shed more light on the relationship between transnational lobbying and the adoption of NTMs, depending on the restrictiveness of measures. In the introduction we cite two mechanisms through which transnational lobbying may take effect. On the one hand, we state that the pressure exerted by business groups dur-ing the MCs may lead to an international consensus in terms of NTMs to the advantage of their origin countries. On the other hand, we affirm that the influence of business groups may be such that an international consensus is not reached, which might be
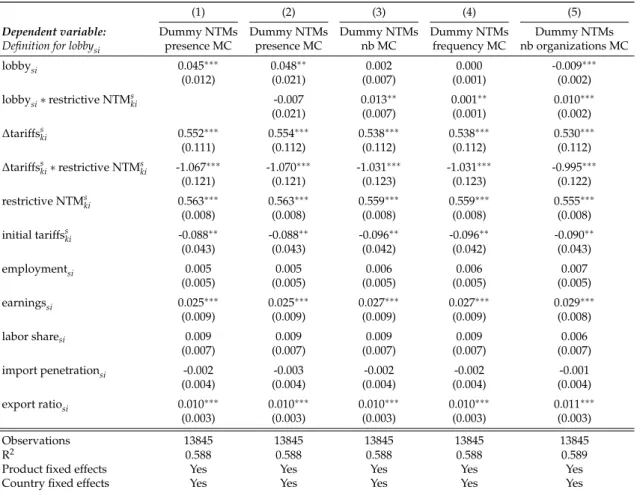
exactly what they expect in order to maintain their national NTMs. Even though it is difficult to thoroughly disentangle the different mechanisms at play, we can indirectly infer which scenario is more plausible to explain the role of transnational lobbying in the adoption of domestic NTMs, relying on the restrictiveness of measures. If the prob-ability to adopt restrictive NTMs (compared to the probprob-ability to adopt non-restrictive NTMs) increases with transnational lobbying, the second mechanism is more likely to occur. Indeed, an international consensus would not lead to the adoption of restrictive NTMs. Therefore, we can conclude that business groups attend the MCs in order to maintain their national status-quo in terms of NTMs. We thus estimate equation (3). Data are aggregated at the HS4 level. The results are presented in Table5.
In column (1), we replicate the estimation conducted in column (2) of Table2at the HS4 level. We show that transnational lobbying proxied through the participation of business groups at the MCs is positively and significantly associated with the adop-tion of NTMs. We also find evidence for policy substituadop-tion in the case of restrictive measures. As for the other variables, two of them become insignificant (employment, import penetration).
Compared to column (1), in columns (2)-(5) we introduce an interaction term be-tween the different definitions of transnational lobbying and a dummy for restrictive measures. In column (2), where transnational lobbying is proxied through the pres-ence at the MCs, the interaction term is not significant. We show that transnational lobbying is positively related to the adoption of NTMs, but there is no evidence that the measures adopted are restrictive. However, when we choose other proxies for transnational lobbying, such as the number of MCs in column (3), the frequency of attendance at the MCs in column (4) or the number of organizations at the MCs in col-umn (5), the coefficient on the interaction term is positive and significant. Put it differ-ently, the higher the number of MCs attended by industry-country pairs, the higher the probability of adopting restrictive measures. The same results hold for the frequency of attendance at the MCs by industry-country pairs and the number of organizations within an industry-country pair present at the MCs. All in all, our results suggest
that the influence exerted by national business groups during the MCs is such that an international consensus is not reached, allowing countries to maintain their national NTMs.
We also show that a decrease in tariffs between 2007 and 2010 is positively corre-lated with the adoption of restrictive NTMs in developing countries. This is not the case for non-restrictive measures. The results are consistent across all columns. As for the industrial variables, they follow the path described in column (1).
Table5about here
6
Conclusion
This paper studies the political economy determinants of NTMs in developing coun-tries. Two channels are considered. First, we explore the substitution between tariffs and NTMs. Second, we analyze the role of transnational lobbying in the adoption of NTMs at the national level.
As far as the first channel is concerned, the results show that NTMs are rather sub-stitutes for tariff protection, even after controlling for product and country fixed effects and other variables at the product and industry level for each country. Overall, the results point to protectionist intentions behind the adoption of NTMs. Beyond their legitimate purposes, NTMs are also driven by political and economic motivations. For instance, sectors confronted with import competition, characterized by high levels of employment tend to receive more NTM protection. These results are reinforced by the analysis conducted on restrictive NTMs. Non-restrictive measures do not seem to be used to substitute tariffs.
The second channel explores the relationship between the participation of national business groups at the transnational level and the adoption of NTMs in their home countries. Since 1996, the WTO has welcomed the participation of non-state actors at MCs, its highest decision-making body. Thus, domestic business groups started attending the conferences, aiming to influence trade policy decisions. According to our
results, attending at least one MC during the period 1996-2011 significantly increases the probability of adopting NTMs.
In this study, we consider business groups. The participation of non-economic or-ganizations such as NGOs, which also attend the MCs, is not explored inviting further research.
References
ANDERSON, S. P.ANDN. SCHMITT(2003): “Nontariff Barriers and Trade Liberalization,” Eco-nomic Inquiry, 41, 80–97.
BACCHETTA, M., J. RICHTERING,ANDR. SANTANA(2012): “How much light do WTO notifi-cations shed on NTMs?” O. Cadot y M. Malouche (comp.), Non-Tariff Measures: A fresh look at trade policy’s new frontier, Washington, DC y Londres, Banco Mundial y Centre for Economic Policy Research.
BAGWELL, K.ANDR. W. STAIGER(2001): “Domestic Policies, National Sovereignty, and Inter-national Economic Institutions,” The Quarterly Journal of Economics, 116, 519–562.
BALDWIN, R. (1984): “Trade policies in developed countries,” in Handbook of International Eco-nomics, ed. by R. W. Jones and P. B. Kenen, Elsevier, vol. 1, chap. 12, 571–619, 1 ed.
BALL, D. S. (1967): “United States Effective Tariffs and Labor’s Share,” Journal of Political Econ-omy, 75.
BELLOC, M. (2015): “Information for sale in the European Union,” Journal of Economic Behavior & Organization, 120, 130–144.
BEVERELLI, C., M. BOFFA, AND A. KECK (2014): “Trade policy substitution: Theory and ev-idence from Specific Trade Concerns,” WTO Staff Working Papers ERSD-2014-18, World Trade Organization (WTO), Economic Research and Statistics Division.
——— (2016): “Trade Policy Substitution: Theory and Evidence,” mimeo.
CADOT, O., M. MALOUCHE,ANDS. SAEZ(2012): Streamlining Non-Tariff Measures: A Toolkit for Policy Makers, Directions in Development, World Bank Publications.
CAVES, R. E. (1976): “Economic Models of Political Choice: Canada’s Tariff Structure,” Cana-dian Journal of Economics, 9, 278–300.
CONSTANTOPOULOS, M. (1974): “Labour protection in Western Europe,” European Economic Review, 5, 313–328.
CORDEN, W. M. (1974): Trade Policy and Economic Welfare, Oxford University Press.
EDERINGTON, J. (2001): “International Coordination of Trade and Domestic Policies,” American Economic Review, 91, 1580–1593.
EDERINGTON, J. AND C. BAJONA (2010): “Domestic Policies, Hidden Protection, and the GATT/WTO,” 2010 Meeting Papers 798, Society for Economic Dynamics.
ESSAJI, A. (2010): “Trade Liberalization, Standards and Protection,” The B.E. Journal of Economic Analysis & Policy, 10, 1–21.
FEENSTRA, R. ANDJ. N. BHAGWATI (1982): “Tariff Seeking and the Efficient Tariff,” in Import Competition and Response, National Bureau of Economic Research, Inc, 245–262.
FIELEKE, N. S. (1976): “The Tariff Structure for Manufacturing Industries in the United States: A Test of Some Traditional Explanations,” Columbia Journal of World Business, 11, 98.
FONTAGNÉ, L., G. OREFICE, R. PIERMARTINI,ANDN. ROCHA(2015): “Product standards and margins of trade: Firm-level evidence,” Journal of International Economics, 97, 29–44.
GAWANDE, K. AND U. BANDYOPADHYAY (2000): “Is Protection for Sale? Evidence on the Grossman-Helpman Theory of Endogenous Protection,” The Review of Economics and Statis-tics, 82, 139–152.
GOURDON, J. (2014): “CEPII NTM-MAP: A Tool for Assessing the Economic Impact of Non-Tariff Measures,” Working Paper 2014-24, CEPII research center.
GOURDON, J.ANDA. NICITA(2013): “A preliminary analysis on newly collected data on non-tariff measures,” Policy Issues in International Trade and Commodities Study Series No. 53, United Nations Conference on Trade and Development (UNCTAD).
GROSSMAN, G. M.ANDE. HELPMAN(1994): “Protection for Sale,” American Economic Review, 84, 833–850.
HANEGRAAFF, M. (2015): “Interest Groups at Transnational Negotiation Conferences: Goals, Strategies, Interactions, and Influence,” Global governance : A Review of Multilateralism and International Organizations, 21, 599–620.
HANEGRAAFF, M., J. BEYERS,ANDC. BRAUN(2011): “Open the door to more of the same? The development of interest group representation at the WTO,” World Trade Review, 10, 447–472. HANEGRAAFF, M., C. BRAUN, D. DE BIÈVRE, AND J. BEYERS (2015): “The Domestic and Global Origins of Transnational Advocacy: Explaining Lobbying Presence during WTO Min-isterial Conferences,” Comparative Political Studies, 48, 1591–1621.
HORN, H., P. C. MAVROIDIS, AND E. N. WIJKSTRÖM (2013): “In the Shadow of the DSU: Addressing Specific Trade Concerns in the WTO SPS and TBT Committees,” Journal of World Trade, 47, 729–759.
LAVERGNE, R. (1983): The political economy of U.S. tariffs: an empirical analysis, Economic theory, econometrics, and mathematical economics, Academic Press.
LEE, J.-W. AND P. SWAGEL (2000): “Trade Barriers And Trade Flows Across Countries And Industries,” The Review of Economics and Statistics, 79, 372–382.
MAGGI, G. AND P. K. GOLDBERG (1999): “Protection for Sale: An Empirical Investigation,” American Economic Review, 89, 1135–1155.
MITRA, D., D. D. THOMAKOS, AND M. A. ULUBA ¸SOGLU (2002): “"Protection For Sale" In A Developing Country: Democracy Vs. Dictatorship,” The Review of Economics and Statistics, 84, 497–508.
MOORE, M. O.ANDM. ZANARDI(2011): “Trade Liberalization and Antidumping: Is There a Substitution Effect?” Review of Development Economics, 15, 601–619.
OREFICE, G. (2016): “Non-Tariff Measures, Specific Trade Concerns and Tariff Reduction,” The World Economy.
STEFFEK, J. ANDC. KISSLING (2006): “Civil society participation in international governance: the UN and the WTO compared,” TranState Working Papers 42, University of Bremen, Col-laborative Research Center 597: Transformations of the State.
TREFLER, D. (1993): “Trade Liberalization and the Theory of Endogenous Protection: An Econometric Study of U.S. Import Policy,” Journal of Political Economy, 101, 138–60.
VAN DEN BOSSCHE, P. (2008): “NGO Involvement in the WTO: A comparative Perspective,” Journal of International Economic Law, 11, 717–749.
WTO (2012): “World Trade Report 2012 – Trade and public policies: A closer look at nontariff measures in the 21st century,” Geneva, World Trade Organization.
Figure 1: Classification of NTMs
Figure 2: Shares of technical & non-technical measures: panel (a)
Share of imports (in value) & imported products affected by at least 1 NTM: panel (b)
0 20 40 60 80 100 Developed Developing European Union Japan India Philippines Indonesia Colombia Peru Ecuador Brazil Morocco China Lebanon Egypt Sri Lanka Chile panel (a)
Technical (SPS, TBT and pre−shipment inspections) Non−technical (contingent and quantity measures)
0 20 40 60 80 100 Developed Developing European Union Japan India Philippines Indonesia Colombia Peru Ecuador Brazil Morocco China Lebanon Egypt Sri Lanka Chile panel (b)
share of imports affected by NTMs share of imported products affected by NTMs
Figure 3: Restrictive vs. non-restrictive NTMs in Colombia
Year of collection for NTMs in Colombia: 2012
Stock of NTMs in 2012
NTMs introduced in 2012
First date raised STCs in 2011, 2012, 2013 restrictive NTMs in 2012 No STCs in 2011, 2012, 2013 non-restrictive NTMs in 2012 NTMs introduced before and still in force in 2012
First date raised STCs < 2011 & raised again in 2012
restrictive NTMs in 2012
First date raised STCs < 2011 & not raised again in 2012 non-restrictive NTMs
in 2012
Source: Author’s computation. Colombia is used as an example. The principle is the same for all countries. If we have the stock of measures in t, in order to track restrictive NTMs, we rely on first date
raised STCs in t-1, t, t+1 and on subsequently raised STCs in t.
Figure 4: Structure of the WTO
Source: WTO organization chart available at:
Figure 5: Business groups having attended the WTO MCs over time by country
0 50 100 150 200
Number of interest groups Developed Developing Japan European Union Philippines India Colombia Brazil
Note: Author’s calculations based onHanegraaff, Beyers, and Braun(2011). If a country is not included, it means 0 participation (exhaustive dataset).
In the case of the European Union, we include business groups from the individual Member States together with business groups representing the European Union as a whole.
Table 1: List of countries
Category Country Name Year
Developing Brazil 2012 Chile 2012 China 2012 Colombia 2012 Ecuador 2012 Egypt 2011 India 2012 Indonesia 2009 Lebanon 2011 Morocco 2011 Peru 2012 Philippines 2010 Sri Lanka 2012 Developed European Union 2011 Japan 2011
Table 2: Determinants of NTMs in developing countries
(1) (2) (3) (4)
Dependent variable: Dummy NTMs Dummy NTMs Dummy Tech. NTMs Dummy Non-Tech. NTMs
lobbysi 0.098∗∗∗ 0.080∗∗∗ 0.109∗∗∗ 0.057∗∗∗ (0.009) (0.007) (0.009) (0.007) ∆tariffss ki -0.107∗∗ 0.286∗∗∗ -0.134∗∗∗ 0.134∗∗∗ (0.045) (0.052) (0.046) (0.029) ∆tariffss ki∗restrictive NTMski -0.918∗∗∗ (0.060) restrictive NTMski 0.641∗∗∗ (0.004) initial tariffsski -0.029 -0.098∗∗∗ -0.059∗∗ 0.116∗∗∗ (0.030) (0.023) (0.029) (0.019) employmentsi 0.045∗∗∗ 0.010∗∗∗ 0.039∗∗∗ 0.014∗∗∗ (0.003) (0.003) (0.003) (0.002) earningssi 0.032∗∗∗ 0.011∗∗∗ 0.035∗∗∗ 0.012∗∗∗ (0.005) (0.004) (0.005) (0.004) labor sharesi -0.032∗∗∗ -0.001 -0.031∗∗∗ 0.003 (0.004) (0.004) (0.004) (0.003) import penetrationsi 0.026∗∗∗ 0.005∗∗ 0.024∗∗∗ 0.006∗∗∗ (0.003) (0.002) (0.003) (0.002) export ratiosi -0.001 0.002 -0.004∗ -0.006∗∗∗ (0.002) (0.002) (0.002) (0.001) Observations 51517 51517 51517 51517 R2 0.424 0.606 0.437 0.409
Product fixed effects Yes Yes Yes Yes
Country fixed effects Yes Yes Yes Yes
Note: k= HS6 product, s = ISIC sector (3-digit level), i = country. The dependent variables are defined as follows. Dummy NTMs is a dummy set to 1 if at least 1 measure affects product k in country i (0 otherwise). Dummy Tech. NTMs is a dummy set to 1 if at least 1 technical measure affects product k in country i (0 otherwise). Dummy Non-Tech. NTMs is a dummy set to 1 if at least 1 non-technical measure affects product k in country i (0 otherwise). Robust standard errors are reported in parentheses with∗,∗∗,∗∗∗denoting significance at 10%, 5% and 1%, respectively.