HAL Id: hal-02066761
https://hal.sorbonne-universite.fr/hal-02066761
Submitted on 13 Mar 2019
HAL is a multi-disciplinary open access
archive for the deposit and dissemination of
sci-entific research documents, whether they are
pub-lished or not. The documents may come from
teaching and research institutions in France or
abroad, or from public or private research centers.
L’archive ouverte pluridisciplinaire HAL, est
destinée au dépôt et à la diffusion de documents
scientifiques de niveau recherche, publiés ou non,
émanant des établissements d’enseignement et de
recherche français ou étrangers, des laboratoires
publics ou privés.
extract rescues GAD67 related developmental and
cognitive defects in Down syndrome mouse models
Benoit Souchet, Arnaud Duchon, Yuchen Gu, Julien Dairou, Claire Chevalier,
Fabrice Daubigney, Valérie Nalesso, Nicole Créau, Yuejin Yu, Nathalie Janel,
et al.
To cite this version:
Benoit Souchet, Arnaud Duchon, Yuchen Gu, Julien Dairou, Claire Chevalier, et al.. Prenatal
treat-ment with EGCG enriched green tea extract rescues GAD67 related developtreat-mental and cognitive
defects in Down syndrome mouse models. Scientific Reports, Nature Publishing Group, 2019, 9,
pp.3914. �10.1038/s41598-019-40328-9�. �hal-02066761�
prenatal treatment with eGCG
enriched green tea extract rescues
GAD67 related developmental
and cognitive defects in Down
syndrome mouse models
Benoit Souchet
1, Arnaud Duchon
2,3,4,5,6, Yuchen Gu
1, Julien Dairou
7, Claire Chevalier
2,3,4,5,6,
Fabrice Daubigney
1, Valérie Nalesso
2,3,4,5,6, Nicole Créau
1, Yuejin Yu
8, Nathalie Janel
1,8,
Yann Herault
2,3,4,5,6& Jean Maurice Delabar
1,9,10Down syndrome is a common genetic disorder caused by trisomy of chromosome 21. Brain development in affected foetuses might be improved through prenatal treatment. One potential target is DYRK1A, a multifunctional kinase encoded by chromosome 21 that, when overexpressed, alters neuronal excitation–inhibition balance and increases GAD67 interneuron density. We used a green tea extract enriched in EGCG to inhibit DYRK1A function only during gestation of transgenic mice overexpressing Dyrk1a (mBACtgDyrk1a). Adult mice treated prenatally displayed reduced levels of inhibitory markers, restored VGAT1/VGLUT1 balance, and rescued density of GAD67 interneurons. Similar results for gabaergic and glutamatergic markers and interneuron density were obtained in Dp(16)1Yey mice, trisomic for 140 chromosome 21 orthologs; thus, prenatal EGCG exhibits efficacy in a more complex DS model. Finally, cognitive and behaviour testing showed that adult Dp(16)1Yey mice treated prenatally had improved novel object recognition memory but do not show improvement with Y maze paradigm. These findings provide empirical support for a prenatal intervention that targets specific neural circuitries.
Typical brains maintain a precise ratio between neuronal excitation and inhibition (E/I) to allow efficient learning. This ratio is established early during neurogenesis. One of the first neurotransmitters to become functional in the developing central nervous system, before functional synapses form, is Υ-aminobutyric acid (GABA)1. Indeed,
in wildtype mice, one in five migrating neurons at embryonic day E 14 is already established as a GABAergic neuron2. GABA is an inhibitory neurotransmitter that regulates E/I balance by binding to GABA
A receptors and
preventing further signalling from the bound neuron3.
E/I balance appears to be altered in the brains of individuals with Down syndrome (DS). Individuals with DS, which results from trisomy for all or part of chromosome 21, exhibit delayed cognitive progress in infancy
1Université Paris-Diderot, Sorbonne Paris Cité, Adaptive Functional Biology, National Centre for Scientific Research
(CNRS), UMR 8251, Paris, France. 2Institut Génétique Biologie Moléculaire Cellulaire, CNRS, French National
Institute of Health and Medical Research (INSERM), UMR 7104, UMR 964, Illkirch, France. 3Institut de Génétique et
de Biologie Moléculaire et Cellulaire, Université de Strasbourg, 1 rue Laurent Fries, 67404, Illkirch, France. 4CNRS,
UMR 7104, Illkirch, France. 5INSERM, U964, Illkirch, France. 6Université de Strasbourg, 1 rue Laurent Fries, 67404,
Illkirch, France. 7CNRS, UMR 8601, Laboratoire de Chimie et Biochimie Pharmacologiques et Toxicologiques,
Université Paris Descartes-Sorbonne Paris Cité, 75270, Paris, France. 8Children’s Guild Foundation Down Syndrome
Research Program, Department of Cancer Genetics, Roswell Park Cancer Institute, Elm and Carlton Streets, Buffalo, NY, 14263, USA. 9INSERM U 1127, CNRS UMR 7225, Sorbonne Universités, UPMC Univ Paris 06 UMR S 1127,
Institut du Cerveau et la Moelle épinière, ICM, Paris, France. 10Brain & Spine Institute (ICM) CNRS UMR7225, Inserm
UMRS 975, Paris, France. Benoit Souchet and Arnaud Duchon contributed equally. Yann Herault and Jean Maurice Delabar jointly supervised this work. Correspondence and requests for materials should be addressed to Y.H. (email:
Herault@igbmc.fr) or J.M.D. (email: jeanmaurice.delabar@icm-institute.org) Received: 12 March 2018
Accepted: 31 January 2019 Published: xx xx xxxx
and childhood, leading to mild to moderate intellectual disability. In contrast to typically-developing brains, it has been hypothesized that the brains of individuals with DS may have too much GABA-related inhibition4. In
DS foetuses the ratio of calretinin positives cells versus calretinin negative cells was found increased in gyrus, entorhinal cortex and hippocampus5. Mouse models of DS also exhibit an imbalanced E/I ratio, with a suppressed
hippocampal long-term potentiation6 and with an increased level of the glutamic acid decarboxylases GAD65
and GAD677. The observed increase in GADs is similar (130%–150%) both in monogenic models overexpressing
only Dyrk1a, a serine-threonine kinase implicated in brain development, and in more complex models trisomic for an additional 30–140 chromosome 21 orthologs. Many different approaches have been developed to correct cognitive impairments of DS mice models targeting E/I balance, oxidative stress or other pathways8.
The E/I imbalance is present and associated with cognitive impairment in mBACtgDyrk1a (transgenic for a mouse BAC containing the full Dyrk1a gene), hYACtgDyrk1a (trisomic for 5 genes), Ts1Rhr (trisomic for 33 genes), Dp(16)1Yey (trisomic for 140 genes), and Ts65Dn (trisomic for 122 genes orthologous to HSA21 genes and 60 genes not orthologous to HSA21). These DS mouse models7 contain Dyrk1a gene in three copies.
Genetic correction of DYRK1A levels in Ts65Dn mice restores a normal phenotype9. Partial rescue is also
obtained with expression of two copies of Dyrk1a in Dp(16)1Yey mice10. In comparison with disomic cells,
Ts65Dn mouse neural progenitor cells show premature neuronal differentiation and enhanced GABAergic differ-entiation. Further, treatment with harmine, a competitive inhibitor of DYRK1A, reverses this effect11.
Epigallocatechin gallate (EGCG), the major catechin in green tea, is a noncompetitive inhibitor of DYRK1A12
with an IC50 of 0.3 µM. Other targets are PRAK (IC50 of 1 µM)13 or metallo proteases (IC50 of 20 µM)14. It
rescues long-term potentiation deficits in CA1-CA3 of Ts65Dn, in neocortex of mBACtgDyrk1a15 and
molec-ular and behavioural alterations observed in DS mouse models16–18. Clinical trials of a dietary supplement
con-taining EGCG among young adults with DS resulted in a partial correction of cognitive deficits17,19. However,
mouse models have shown varying results with EGCG treatment. Treatment of adult mice with EGCG for one month does not rescue levels of inhibitory interneuron marker GAD6718. EGCG treatment corrects mouse escape
latency in the Morris water maze, but not the probe test17. Prenatal EGCG treatment modulated trisomic neural
crest cells deficiencies at embryonic time points and normalized some craniofacial phenotypes, including cranial vault in adult Ts65Dn mice20. Further, EGCG treatment during postnatal days (P) P3–P15 restores neurogenesis
at P15 but not at P45, and does not restore normal performance either in Y maze or Morris water maze tests21.
In contrast, a mouse model transgenic for human DYRK1A treated from gestation to adulthood shows strong correction of molecular (brain-derived neurotrophic factor levels) and cognitive deficits (novel object recognition tests)16. In mouse models, Dyrk1a is overexpressed as early as E11.5 (telencephalon) and E15.5 (brain)22,23. The
prenatal period is critical for GABAergic interneurons; therefore, it was relevant to investigate adults for persis-tence of changes induced by EGCG prenatal treatment.
Results
Prenatal EGCG treatment corrects GAD67 level and GAD67 neuron density in mBACtgDyrk1a
mice.
The decaffeinated green tea extract (MGTE) was evaluated for its in vitro DYRK1A inhibitory activity using a fluorescent peptide substrate of this enzyme and UFLC (Ultra Fast Liquid Chromatography) assay as previously described24: IC50 = 0.35 µM similar to IC50 = 0.3 µM found for purified EGCG (see Supplementary
Methods). We used EGCG-complemented food pellets (MGTE) corresponding to an intermediate dose of 50 mg/kg, which was determined by a previous dose-effect trial18. A first assessment by HPLC experiments
(Supplemental Methods, LOD = 25 nM) on wild type animals established that catechins from MGTE extract were found in embryonic (E14) brains (<25 nM), in milk collected from stomachs of P1 and P7 pups (27–57 nM), and in P1 and P7 plasmas (0.5 to 1 µM) in similar amounts as those reported for pharmacokinetics experiments performed in freely moving rats (3 µM in plasma)25 (Supp. Methods).
mBACtgDyrk1a is a monogenic model expressing three copies of Dyrk1a that exhibits developmental and cognitive defects7. We first performed a set of experiments on mBACtgDyrk1a and wildtype mice from the same
litters. Treatment T1 was given prenatally to gestating mothers and stopped at weaning; treatment T2 was given prenatally to gestating mothers and continued through adulthood; and treatment T3 was given to 2–3-month-old adult mice for one month (Fig. 1A).
Brains of treated animals were collected at 3 months, and sagittal slices were analysed for marker density with stereological techniques. Stratum radiatum of untreated transgenic mice showed increased density of GAD67 neurons in comparison with wildtype animals (p < 0.01) (Fig. 1B and Table 1). Treating adult mice with EGCG (T3) did not affect this finding. However, prenatal EGCG treatment corrected the increase (T1 and T2), and this correction persisted after cessation of treatment at weaning (T1). Two way ANOVA revealed a significant effect of genotype and treatment (genotype: p = 0.0018; treatment p < 0.0001) and a significant interaction between genotype and treatment (p = 0.0031). A Holm–Sidak multiple comparison procedure revealed that GAD67 rel-ative density is significantly rescued both after T1 treatment (ptg = 0.0002) or after T2 treatment (ptg = 0.0005).
After treatment T3 differences were not significant. These results support the hypothesis that overaccumulation of GABAergic neurons in this model takes place during early development.
Quantification of synaptic markers was performed on the second half of brains from the same mice. Transgenic mice overexpressed GAD67 by 1.4-times the levels of wildtype mice (p < 0.0001) (Fig. 1C). T1 treat-ment was sufficient to correct GAD67 overexpression in the hippocampus as revealed by t-test analyses of the protein levels: comparison of wild type (wt) and transgenic, of wt and transgenic after treatment, and of trans-genic and transtrans-genic after treatments T1, T2 and T3 (Sup. Table 1). This correction persisted when treatment continued into adulthood (T2; 93% correction), but was weaker when treatment was delayed until adulthood (T3; 24% correction) (Fig. 1C). A two way ANOVA revealed a significant effect of genotype, treatment and interaction for GAD67 level by T1 and T2 treatments. With T3 we observed only a genotype effect (Table 1). A Holm–Sidak multiple comparison procedure revealed that GAD67 protein level is significantly corrected by
treatment T1(ptg = 0.0001) and by treatment T2 (ptg = 2.6 × 10⁻⁵). Similar results were found for GAD65 with T1,
for GABA transporter and for PSD95 (DLG4) with T1 and T2. For VGAT1 treatment effect was significant for T1 (ptg = 0.03) with higher significancy for T2 (ptg = 0.0007) and T3. Prenatal treatment is necessary for a strong
correction of gabaergic markers. In addition, we observed that transgenic mice had decreased levels of synaptic markers, GLUR2 and NR2A, from the glutamate pathway:treatment T1,T2 and T3 corrected GLUR2 alterations and T2, T3 corrected NR2A alterations. Corrections of excitatory markers were more pronounced after T2 or T3 treatment. A significant treatment effect (T1 and T2) was observed for the ratio VGAT1/VGLUT1 with T1 and T2 (p < 0.0001) Table 1. The same analysis was performed on cortex proteins: treatment T1 induces a significant correction of the level of GABA markers: GAD67, GAD65, VGAT1; a treatment effect was also visible for NR1,
Figure 1. EGCG treatment during brain development of mBACtgDyrk1a mice. (A) Timelines of treatment
of mBACtgDyrk1a transgenic (tg) mice from gestation through adulthood with normal food pellets or pellets (SAFE company) containing 600 mg/kg MGTE (decaffeinated Lifeextension extract containing 45% EGCG) and corresponding to a daily dose of 50 mg/kg EGCG for a 25 g mouse. Food consumption was similar for wt and tg animals. T1 treatment started at gestation and continued through weaning. T2 treatment started at gestation and continued until 90 days. T3 treatment started at P60 and continued until P90. Grey indicates standard food (placebo); green indicates treatment on each timeline. (B) Quantification of GAD67+ neuron fraction of NeuN+ neurons in immunohistochemically stained sections of stratum radiatum of control (n = 5) or treated (n = 4) wildtype (WT) and transgenic (TG) mice: serial sagittal brain cryosections (50 µm) were cut on a cryostat and immunohistochemistry was performed with GAD67 (Millipore MAB5406) and NeuN (Millipore ABN 78) antibodies. NeuN-positive and GAD67-positive neuron densities were assessed with StereoInvestigator (MBF) in stratum radiatum in parasagittal slices (+0.36 mm). n = 5 for wt and tg; n = 4 for treated wt and treated tg. (C) Relative GAD67 levels in hippocampus of control or treated WT and TG mice. Arbitrary units (au) of GAD67 levels were normalised to total protein levels and to controls (n = 10). Two ways ANOVA were performed followed by an Holm–Sidak multiple comparison procedure with ***p < 0.001, ****p < 0.0001.
NR2A, GLUR2 and VGLUT1; a significant treatment effect was observed for the ratio VGAT1/VGLUT1 with the three treatment protocols (Table 2 and Sup. Table 2).
Prenatal EGCG treatment corrects GAD67 levels in Dp(16)1Yey mice.
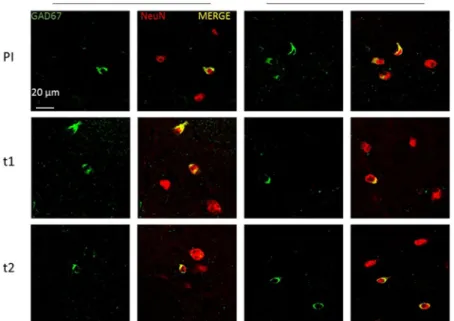
Then, we analysed effects of T1 and T2 treatment in the more genetically complex Dp(16)1Yey model, in which we previously observed that GAD67 neuron density is increased in stratum radiatum similarly to mBACtgDyrk1a mice7. We applied thesame protocol as used for mBACtgDyrk1a experiments to mice divided in four groups: placebo-fed wildtype, placebo-fed Dp(16)1Yey trisomic, EGCG-fed wildtype, and EGCG-fed trisomic mice. Colocalisations of GAD67 and Neun signals were observed in confocal images of stratum radiatum of placebo treated and T1, T2 treated mice (Fig. 2). Sagittal slices were analysed for marker density with stereological techniques. T1-treated mice displayed a correction of increased GAD67 neuron density in stratum radiatum: a significant interaction was observed using a two way ANOVA (Table 2) (Fig. 3A,B); a Holm–Sidak multiple comparison procedure revealed a significant correction of the ratio GAD67/Neun after T1 treatment (pts = 0.0008) and T2 treatment (pts = 0.0027).
GAD67 expression in hippocampus (Fig. 3C) is significantly increased in Dp(16)1Yey (p = 0.0004). Expression data were analysed by t-tests (Sup. Tables 3 and 4) and by two ways ANOVA (Table 3) and revealed a significant interaction and a significant treatment effect for T1 and T2 treatment. A Holm–Sidak multiple comparison pro-cedure revealed a correction of the GAD67 protein level after T1 treatment close to significancy (pts = 0.1) and a
significant correction for T2 treatment (pts = 0.03). A treatment effect was also observed for GAD65 after T1 and
T2 and for VGAT1 (for T2 pts = 0.05). A treatment effect was observed for GLUR2 after T1 (pts = 0.03). (and after
T2 (ptg = 6 × 10⁻⁴). Although there is no genotype effect for VGLUT1 there is a treatment effect after T2 (Table 3
and Sup. Table 3). A very significant treatment effect was observed for the ratio VGAT1/VGLUT1 with T1 and T2 (Table 3). In cortex treatment T2 induced a significant correction of GAD67and GAD65. A significant correction was also observed for VGAT1/VGLUT1 after T2. (Table 4 and Sup. Table 4). Because similar effects were observed in the single gene model (mBACtgDyrk1a) and partial trisomy model (Dp(16)1Yey), we propose that DYRK1A overexpression is the main cause of GABAergic over accumulation in DS models and of alteration of the ratio VGAT1/VGLUT1.
Prenatal EGCG treatment restores NOR memory.
Dp(16)1Yey mice have been shown to be impaired for the Y maze and the novel object tests. Y Maze Spontaneous Alternation is a behavioral test for measuringDensity
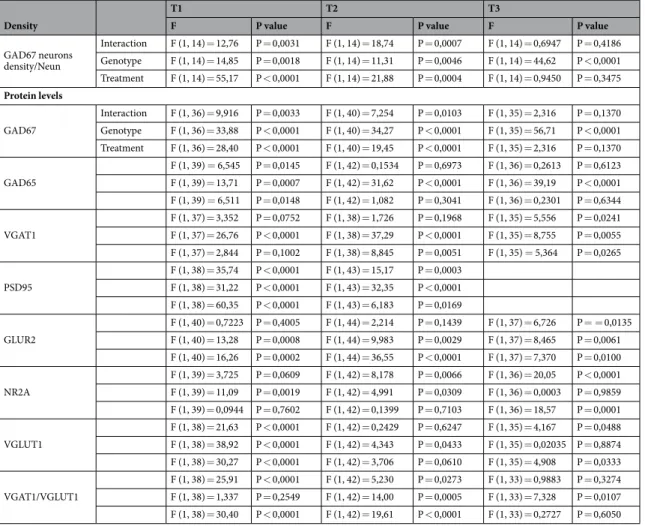
T1 T2 T3
F P value F P value F P value
GAD67 neurons density/Neun Interaction F (1, 14) = 12,76 P = 0,0031 F (1, 14) = 18,74 P = 0,0007 F (1, 14) = 0,6947 P = 0,4186 Genotype F (1, 14) = 14,85 P = 0,0018 F (1, 14) = 11,31 P = 0,0046 F (1, 14) = 44,62 P < 0,0001 Treatment F (1, 14) = 55,17 P < 0,0001 F (1, 14) = 21,88 P = 0,0004 F (1, 14) = 0,9450 P = 0,3475 Protein levels GAD67 Interaction F (1, 36) = 9,916 P = 0,0033 F (1, 40) = 7,254 P = 0,0103 F (1, 35) = 2,316 P = 0,1370 Genotype F (1, 36) = 33,88 P < 0,0001 F (1, 40) = 34,27 P < 0,0001 F (1, 35) = 56,71 P < 0,0001 Treatment F (1, 36) = 28,40 P < 0,0001 F (1, 40) = 19,45 P < 0,0001 F (1, 35) = 2,316 P = 0,1370 GAD65 F (1, 39) = 6,545 P = 0,0145 F (1, 42) = 0,1534 P = 0,6973 F (1, 36) = 0,2613 P = 0,6123 F (1, 39) = 13,71 P = 0,0007 F (1, 42) = 31,62 P < 0,0001 F (1, 36) = 39,19 P < 0,0001 F (1, 39) = 6,511 P = 0,0148 F (1, 42) = 1,082 P = 0,3041 F (1, 36) = 0,2301 P = 0,6344 VGAT1 F (1, 37) = 3,352 P = 0,0752 F (1, 38) = 1,726 P = 0,1968 F (1, 35) = 5,556 P = 0,0241 F (1, 37) = 26,76 P < 0,0001 F (1, 38) = 37,29 P < 0,0001 F (1, 35) = 8,755 P = 0,0055 F (1, 37) = 2,844 P = 0,1002 F (1, 38) = 8,845 P = 0,0051 F (1, 35) = 5,364 P = 0,0265 PSD95 F (1, 38) = 35,74 P < 0,0001 F (1, 43) = 15,17 P = 0,0003 F (1, 38) = 31,22 P < 0,0001 F (1, 43) = 32,35 P < 0,0001 F (1, 38) = 60,35 P < 0,0001 F (1, 43) = 6,183 P = 0,0169 GLUR2 F (1, 40) = 0,7223 P = 0,4005 F (1, 44) = 2,214 P = 0,1439 F (1, 37) = 6,726 P = = 0,0135 F (1, 40) = 13,28 P = 0,0008 F (1, 44) = 9,983 P = 0,0029 F (1, 37) = 8,465 P = 0,0061 F (1, 40) = 16,26 P = 0,0002 F (1, 44) = 36,55 P < 0,0001 F (1, 37) = 7,370 P = 0,0100 NR2A F (1, 39) = 3,725 P = 0,0609 F (1, 42) = 8,178 P = 0,0066 F (1, 36) = 20,05 P < 0,0001 F (1, 39) = 11,09 P = 0,0019 F (1, 42) = 4,991 P = 0,0309 F (1, 36) = 0,0003 P = 0,9859 F (1, 39) = 0,0944 P = 0,7602 F (1, 42) = 0,1399 P = 0,7103 F (1, 36) = 18,57 P = 0,0001 VGLUT1 F (1, 38) = 21,63 P < 0,0001 F (1, 42) = 0,2429 P = 0,6247 F (1, 35) = 4,167 P = 0,0488 F (1, 38) = 38,92 P < 0,0001 F (1, 42) = 4,343 P = 0,0433 F (1, 35) = 0,02035 P = 0,8874 F (1, 38) = 30,27 P < 0,0001 F (1, 42) = 3,706 P = 0,0610 F (1, 35) = 4,908 P = 0,0333 VGAT1/VGLUT1 F (1, 38) = 25,91 P < 0,0001 F (1, 42) = 5,230 P = 0,0273 F (1, 33) = 0,9883 P = 0,3274 F (1, 38) = 1,337 P = 0,2549 F (1, 42) = 14,00 P = 0,0005 F (1, 33) = 7,328 P = 0,0107 F (1, 38) = 30,40 P < 0,0001 F (1, 42) = 19,61 P < 0,0001 F (1, 33) = 0,2727 P = 0,6050
the willingness of rodents to explore new environments. We observed a deficit in percent of alternation for Dp(16)1Yey mice compared to wildtype. However T1 treatment did not induce any rescue (Fig. 4A).
The novel object recognition test, evaluated by differences in exploration times of novel and familiar objects, is based on the innate tendency of rodents to differentially explore novel objects over familiar ones26. In rodents, the
test is sensitive to direct or chemical lesions in the hippocampus27,28. In the medial temporal lobe, the
hippocam-pus and adjacent cortical areas, including entorhinal, perirhinal, and parahippocampal cortexes, are involved in normal memory function. The hippocampus is responsible for long-term object recognition29.
During the familiarisation phase recognition index is not significantly different in Dp(16)1Yey and there is no treatment effect on this phase (Fig. 4B). During the first sessions of object recognition tests in which mice are habituated to the testing arena, activity videotracking, analysed by two ways ANOVA, indicated hyperactivity of placebo-treated Dp(16)1Yey mice (genotype effect p < 0.0001) (Fig. 4C). Treatment had no significant effect on hyperactivity. Object recognition memory performance was then specifically evaluated after a retention phase of 24 h by analysing the time mice spent exploring familiar versus novel objects. Euploid mice, regardless of EGCG treatment, were able to discriminate between novel and familiar objects, indicating normal recognition memory during the 12-min recording time (Fig. 4D). In contrast, vehicle-treated Dp(16)1Yey mice did not show any significant exploratory preference towards novel objects. However, T1-treated Dp(16)1Yey mice clearly dif-ferentiated between two objects: two ways ANOVA revealed significant genotype and treatment effects and a significant interaction; a Holm–Sidak multiple comparison procedure showed a significant effect of treatment on Dp(16)1Yey mice (p = 0.01) indicating that EGCG treatment was able to restore novel object recognition memory more than two months after cessation of treatment.
Discussion
Using stereological measurements we have previously shown alterations of gabaergic interneurons by assessing GAD67+ neurons density in DS mouse models. We documented these variations in stratum radiatum of mBAC-tgDyrk1a, hYACtgDyrk1a and Dp(16)1Yey7; here we compared ratios of GAD67+ cells/Neun+ cells: we found
that increased dosage of DYRK1A is associated with an increase of 30% of this ratio in mBACtgDyrk1a stratum radiatum; in Dp(16)1Yey we observed an increase of 30%. These alterations are not limited to stratum radiatum: stereological experiments performed on colliculus, a region rich in interneurons, revealed an increase of 43% of the ratio GAD67+ cells/Neun+ cells in Dp(16)1Yey (Fig. 2 Supplementary Data).
These observations were in agreement with most of the previously published studies: Ts65Dn mice display an increased number of GABAergic interneurons in the cortex and hippocampus: parvalbumin positive cells are increased in CA1 of Ts65Dn mice at P1530; however this observation is not reproduced in a study performed with
P15 Dp(16)1Yey mice31; in adult Ts65dn an increase in the number of inhibitory neurons in CA1 and CA3, mainly
Protein levels
T1 T2 T3
F P value F P value F P value
GAD67 Interaction F (1, 37) = 3,069 P = 0,0881 F (1, 35) = 1,973 P = 0,1689 F (1, 36) = 0,1422 P = 0,7083 Genotype F (1, 37) = 46,31 P < 0,0001 F (1, 35) = 43,48 P < 0,0001 F (1, 36) = 57,50 P < 0,0001 Treatment F (1, 37) = 9,028 P = 0,0048 F (1, 35) = 0,4603 P = 0,5020 F (1, 36) = 0,2822 P = 0,5985 GAD65 F (1, 40) = 3,202 P = 0,0811 F (1, 41) = 1,956 P = 0,1694 F (1, 37) = 4,310 P = 0,0449 F (1, 40) = 35,79 P < 0,0001 F (1, 41) = 32,78 P < 0,0001 F (1, 37) = 30,60 P < 0,0001 F (1, 40) = 6,152 P = 0,0174 F (1, 41) = 0,3709 P = 0,5459 F (1, 37) = 5,555 P = 0,0238 VGAT1 F (1, 41) = 1,371 P = 0,2489 F (1, 42) = 3,772 P = 0,0594 F (1, 38) = 19,26 P < 0,0001 F (1, 41) = 46,83 P < 0,0001 F (1, 42) = 25,28 P < 0,0001 F (1, 38) = 14,04 P = 0,0006 F (1, 41) = 23,41 P < 0,0001 F (1, 42) = 2,822 P = 0,1010 F (1, 38) = 22,89 P < 0,0001 GLUR2 F (1, 40) = 0,8901 P = 0,3511 F (1, 41) = 0,1540 P = 0,6967 F (1, 37) = 0,4270 P = = 0,5175 F (1, 40) = 0,1568 P = 0,6942 F (1, 41) = 1,520 P = 0,2247 F (1, 37) = 1,577 P = 0,2170 F (1, 40) = 1,852 P = 0,1812 F (1, 41) = 2,040 P = 0,1608 F (1, 37) = 0,5287 P = 0,4717 NR1 F (1, 39) = 5,218e-006 P = 0,9982 F (1, 41) = 0,6596 P = 0,4214 F (1, 37) = 0,07995 P = 0,7789 F (1, 39) = 0,9666 P = 0,3316 F (1, 41) = 6,369 P = 0,0156 F (1, 37) = 1,748 P = 0,1942 F (1, 39) = 6,660 P = 0,0137 F (1, 41) = 10,32 P = 0,0026 F (1, 37) = 0,1150 P = 0,7365 NR2A F (1, 41) = 3,851 P = 0,0565 F (1, 42) = 7,293 P = 0,0099 F (1, 37) = 2,626 P = 0,1136 F (1, 41) = 0,1100 P = 0,7418 F (1, 42) = 0,2296 P = 0,6343 F (1, 37) = 2,558 P = 0,1183 F (1, 41) = 6,238 P = 0,0166 F (1, 42) = 2,058 P = 0,1588 F (1, 37) = 0,7885 P = 0,3803 VGLUT1 F (1, 41) = 3,851 P = 0,0565 F (1, 42) = 8,4074 P = 0,0059 F (1, 38) = 2,099 P = 0,1556 F (1, 41) = 0,1100 P = 0,7418 F (1, 42) = 0,6196 P = 0,9803 F (1, 38) = 3,150 P = 0,0839 F (1, 41) = 6,238 P = 0,0166 F (1, 42) = 3,0801 P = 0,0866 F (1, 38) = 1,129 P = 0,2946 VGAT1/VGLUT1 F (1, 41) = 34,80 P < 0,0001 F (1, 42) = 23,99 P < 0,0001 F (1, 38) = 8,279 P = 0,0065 F (1, 41) = 8,857 P = 0,0048 F (1, 42) = 19,05 P < 0,0001 F (1, 38) = 21,85 P < 0,0001 F (1, 41) = 30,99 P < 0,0001 F (1, 42) = 26,03 P < 0,0001 F (1, 38) = 9,994 P = 0,0030
interneurons expressing calbindin, calretinin, NPY and VIP, was reported whereas parvalbumin cell numbers were not affected32,33; in adult Dp(16)1Yey the number of NPY+ inhibitory interneurons was reported increased
although the density of parvalbumin+ cells was not significantly increased in stratum pyramidale, radiatum and
Figure 2. Representative images of immunohistochemical staining of GAD67 (green) and NeuN (red) in
stratum radiatum of wild type (WT) and trisomic Dp(16)1Yey mice given placebo (Pl), T1 or T2 treatment.
Figure 3. Effects of EGCG treatment on GAD67 neurons during development of Dp16(1)Yey mice. (A)
Representative fluorescent micrographs of immunohistochemically stained GAD67+ neurons in stratum radiatum of wildtype (WT) and Dp16(1)Yey trisomic (TS) adult mice after placebo (Pl), T1, or T2 treatment. White arrows indicate labelled neurons. (B) Quantification of GAD67+ neuron fraction of NeuN+ neurons in sections of stratum radiatum of WT and Dp16(1)Yey adult mice (n = 5). (C) Representative image of slot blots used for protein level quantification: top, GAD67 antibody, bottom, Ponceau staining. (D) Relative GAD67 levels in hippocampus of control or treated WT and TS mice. Two ways ANOVA were performed followed by an Holm–Sidak multiple comparison procedure with *p < 0.05, **p < 0.01.
lacunosum moleculare. Alterations of inhibitory neuropil in hippocampus have also been reported and they include a decrease of excitatory boutons (VGLUT1+) and an increase of inhibitory boutons (VGAT1+)32,34,35.
We have also shown previously that protein levels of inhibitory and excitatory markers are altered in hip-pocampus, cortex and cerebellum of mBACtgDyrk1a, Ts65Dn and Dp(16)1Yey: here we observed an increase of levels of GAD67, GAD65 and VGAT1 and a decrease of levels of GLUR1, GLUR2, NR1 and NR2A in hippocam-pus of mBACtgDyrk1a as compared to wild type animals; in hippocamhippocam-pus of Dp(16)1Yey mice we observed an increase of levels of GAD67, GAD65, VGAT1 and a decrease of levels of GLUR1, NR1 and NR2A. Interestingly in mice with one active copy of Dyrk1a gene (Dyrk1a+/−) we previously observed a decreased level of GAD67 and PSD95 and an increased level of GLUR1, GLUR2, NR1 and NR2A7. These results suggest a link between DYRK1A
dose and level of gabaergic and glutamatergic markers.
In humans few studies have been performed on brain samples from patients with Down syndrome: the first studies were performed on aged individuals: Golgi studies revealed a poverty of granular cells in three Brodman areas of two DS cases36; in another study the number of calbindin+ and parvalbumin+ neurons was found
reduced in elderly persons with DS37. However brains of these patients presented histopathological features of
Alzheimer’s disease, a pathology which has been associated with gabaergic dysfunction. On contrary in hip-pocampus of DS embryos density of calretinin positive cells is increased5, suggesting that further quantitative
studies should be performed on brains from young individuals.
In mice morphological and cellular data seem to suggest that there is an increased density of inhibitory interneurons in stratum radiatum and an increased level of GAD67, GAD65 and VGAT1 protein. However the functional consequences of these alterations are not clearly established: hippocampal long-term potentiation is suppressed in Ts65Dn CA1 and rescued after suppressing inhibition with picrotoxin, a GABA(A) receptor antagonist6; a similar observation was made for theta burst induced LTP38; however LTP was found normal in
CA3 recordings of synaptically connected neurons39. Genetic correction of Dyrk1a gene copy number in Ts65Dn
rescues the density of GABAergic and glutamatergic synapse markers in the molecular layer of the hippocampus and CA1 hippocampal LTP40; however other electrophysiological studies suggest that gabaergic signalling could
be depolarizing rather than hyperpolarizing in adult animals41. Using primary cultures and acute hippocampal
slices it was shown that developmental excitatory-to-inhibitory GABA polarity switch is delayed by 2 days in young Ts65Dn mice42 and that these changes lead to a delay in maturation of nascent neural circuits.
In cortex we have shown in mBACtgDyrk1A and Dp(16)1Yey mice an increased level of Gad67 level suggest-ing that regulatory consequences of an increased level of DYRK1A are the same as in hippocampus; the ratio of Gad67+ neurons/Neun+ neurons was also found increased in colliculus of Dp(16)1Yey mice, reminding our observation in hippocampus; however in this brain region density of Gad67+ neurons is not altered but density of Neun+ neurons is decreased. In layer 4 of somatosensory cortex of Ts65Dn mice spontaneous synaptic inputs are decreased in frequency but the balance between excitatory and inhibitory drive appears similar between the two genotypes43; in cerebellum other data suggest that tonic gabaergic inhibition could be less efficient in
Ts65dn44. These results suggest that developmental impact of trisomy is depending on the brain regions.
Density T1 T2 F P value F P value GAD67 neurons density/Neun Interaction F (1, 15) = 13,05 P = 0,0026 F (1, 15) = 10,20 P = 0,0061 genotype F (1, 15) = 14,71 P = 0,0016 F (1, 15) = 4,737 P = 0,0459 Treatment F (1, 15) = 2,906 P = 0,1088 F (1, 15) = 5,197 P = 0,0377 Protein levels GAD67 Interaction F (1, 36) = 6,463 P = 0,0155 F (1, 39) = 5,009 P = 0,0310 genotype F (1, 36) = 2,524 P = 0,1209 F (1, 39) = 8,170 P = 0,0068 Treatment F (1, 36) = 3,264 P = 0,0792 F (1, 39) = 8,384 P = 0,0062 GAD65 Interaction F (1, 36) = 5,339 P = 0,0267 F (1, 36) = 6,773 P = 0,0134 genotype F (1, 36) = 1,336 P = 0,2554 F (1, 36) = 2,270 P = 0,1406 Treatment F (1, 36) = 3,707 P = 0,0621 F (1, 36) = 6,133 P = 0,0181 VGAT1 Interaction F (1, 35) = 0,6496 P = 0,4257 F (1, 38) = 6,439 P = 0,0154 genotype F (1, 35) = 16,96 P = 0,0002 F (1, 38) = 11,55 P = 0,0016 Treatment F (1, 35) = 11,48 P = 0,0018 F (1, 38) = 17,73 P = 0,0002 GLUR2 Interaction F (1, 38) = 2,348 P = 0,1338 F (1, 38) = 9,081 P = 0,0046 genotype F (1, 38) = 0,8522 P = 0,3618 F (1, 38) = 0,2135 P = 0,6467 Treatment F (1, 38) = 4,214 P = 0,0470 F (1, 38) = 4,355 P = 0,0437 VGLUT1 Interaction F (1, 33) = 5,490 P = 0,0253 F (1, 34) = 10,12 P = 0,0031 genotype F (1, 33) = 0,4361 P = 0,5136 F (1, 34) = 2,353 P = 0,1343 Treatment F (1, 33) = 0,2981 P = 0,5888 F (1, 34) = 24,94 P < 0,0001 VGAT1/VGLUT Interaction F (1, 33) = 31,04 P < 0,0001 F (1, 33) = 42,19 P < 0,0001 genotype F (1, 33) = 27,94 P < 0,0001 F (1, 33) = 33,47 P < 0,0001 Treatment F (1, 33) = 34,99 P < 0,0001 F (1, 33) = 4,400 P = 0,0437
In various experiments targeting DYRK1A, EGCG or green tea extracts have been compared to harmine, a more potent inhibitor of DYRK1A but which is also inducing tremors. We have used an EGCG-enriched green tea extract as previous studies have shown that EGCG can cross the blood brain barrier25,45 and the placental
bar-rier46. Given prenatally this extract (MGTE) was shown to rescue the ratio 4R-tau/3Rtau, controlled by DYRK1A,
in Ts65Dn mouse brains47.
Our results reveal that treatment targeting DYRK1A is sufficient to correct GABAergic pathway alterations when given prenatally to single gene (mBACtgDYRK1A) or trisomic [Dp16(1)Yey] mouse models. In mBACtg-DYRK1A model we observed these corrections in hippocampus and cortex. These corrections are still present 69 days after cessation of treatment. Reducing inhibition levels with various pharmacological approaches has been shown to promote recovery from cognitive impairment in Ts65Dn mice6,48,49.
A link has been shown also between GABA plasticity and cognition in Ts65Dn treated chronically with fluoxetine: treatment normalizes GABA release by synaptosomes from hippocampus and spatial memory50.
Involvement of GABAergic neurotransmission into alterations in novel place and novel object recognition was also shown by treating Ts65Dn mice with a GABAB receptor antagonist51. Rescuing effects of EGCG treatments
on cognition paradigms have been previously shown on TgDyrk1a and Ts65Dn. Here a prenatal treatment does not correct Y maze deficit, a test known to be impaired by alterations of NMDA levels52. This treatment allows to
correct recognition index in a novel object recognition paradigm: T1 and T2 corrects GABAergic markers and the effect of T2 is stronger on glutamatergic markers. These results suggest correction of glutamatergic pathways is necessary for correcting Y maze alterations; on the contrary correction of gabaergic pathways, which is main-tained after cessation of treatment (T1), is sufficient to rescue deficits observed with novel object recognition paradigm.
Comparison with a previous report of postnatal EGCG treatment showing no long-term effect of EGCG treat-ment (subcutaneaous injection of 25 mg/kg at P3–P15)21 suggests that prenatal action is necessary for long-term
effects on GABA pathway. In mice, GABAergic neurons arise in the medial and caudal ganglionic eminences in ventral telencephalon and migrate first tangentially from their progenitor niche to the proper cortical region and then radially through the cortical plate to reach their final laminar location53–55. Accordingly, EGCG likely
acts during the early phases in which DYRK1A expression is important to determine inhibitory neuron destiny. Interestingly we also show that this prenatal treatment is able to rescue level of PSD95, a major regulator of syn-aptic maturation, disruption of which is observed in schizophrenia and autism56.
We have shown previously that EGCG treatment, given at adult stage, rescues latency and thigmotaxy of 4–5 months old Ts65dn mice performing a Morris water maze test17. A similar experiment with purified EGCG was
performed on younger adolescent Ts65Dn mice and could not reproduce either the genotype effect or the treat-ment effect.57 Here we show that prenatal treatment of Dp(16)1Yey mice when prolonged until adulthood induces
a correction both of synaptic markers associated with GABAergic pathways and of markers associated with glu-tamatergic pathways. To get the most efficient rescue it seems therefore necessary to combine actions targeting these two pathways either with a prenatal EGCG treatment (targeting GABA pathway) and a continued EGCG treatment (targeting glutamate pathway) till adult stage or by combining prenatal EGCG treatment with a differ-ent pharmacological approach targeting glutamatergic pathway. As previously proposed, Dyrk1a is not the only overexpressed gene that may cause these phenotypes. Role of overexpression of GIRK2 has been hypothesized to explain GABAB/GABAA ratios evoked by stimulation of stratum lacunosum moleculare58. Olig1 and olig2
dupli-cation have been linked to increased density of parvalbumin positive cells in CA1 of Ts65Dn30. Beneficial effect of
T1 T2 Protein levels GAD67 Interaction F (1, 39) = 3,664 P = 0,0629 F (1, 39) = 1,639 P = 0,2080 genotype F (1, 39) = 1,215 P = 0,2770 F (1, 39) = 4,317 P = 0,0444 Treatment F (1, 39) = 2,334 P = 0,1346 F (1, 39) = 12,70 P = 0,0010 GAD65 Interaction F (1, 36) = 7,208 P = 0,0109 F (1, 39) = 2,314 P = 0,1363 genotype F (1, 36) = 1,156 P = 0,2894 F (1, 39) = 7,347 P = 0,0099 Treatment F (1, 36) = 0,1360 P = 0,7145 F (1, 39) = 5,090 P = 0,0297 VGAT1 Interaction F (1, 39) = 0,6701 P = 0,4180 F (1, 42) = 1,942 P = 0,1708 genotype F (1, 39) = 14,73 P = 0,0004 F (1, 42) = 30,24 P < 0,0001 Treatment F (1, 39) = 0,9720 P = 0,3302 F (1, 42) = 3,062 P = 0,0874 GLUR2 Interaction F (1, 38) = 2,145 P = 0,1512 F (1, 39) = 1,447 P = 0,2362 genotype F (1, 38) = 1,179 P = 0,2845 F (1, 39) = 3,995 P = 0,0526 Treatment F (1, 38) = 7,807 P = 0,0081 F (1, 39) = 49,44 P < 0,0001 VGLUT1 Interaction F (1, 34) = 0,2892 P = 0,5942 F (1, 36) = 1,109 P = 0,2993 genotype F (1, 34) = 2,742 P = 0,1070 F (1, 36) = 6,225 P = 0,0173 Treatment F (1, 34) = 1,710 P = 0,1998 F (1, 36) = 19,12 P = 0,0001 VGAT1/VGLUT Interaction F (1, 32) = 0,8482 P = 0,3639 F (1, 36) = 14,69 P = 0,0005 genotype F (1, 32) = 19,02 P = 0,0001 F (1, 36) = 60,98 P < 0,0001 Treatment F (1, 32) = 1,683 P = 0,2038 F (1, 36) = 38,93 P < 0,0001
increased aerobic exercise points toward an involvement of a BDNF related pathway59. Nevertheless, the cellular,
biochemical, and functional rescues induced by prenatal treatment targeting DYRK1A are promising. Recently, administration of ALGERNON, a potent DYRK1A inhibitor (IC50 = 76.9 nM), to pregnant dams rescued aber-rant cortical formation in DS mouse embryos (Ts1Cje) and prevented the development of abnormal behaviors in DS offspring60. However it has been recently proposed that heterozygous disruption of DYRK1A causes a
dis-tinctive clinical syndrome, MRD7, that is characterized by the presence of mild to severe ID, microcephaly, intra-uterine growth retardation, facial dimorphisms, impaired motor functions and behavioural problems associated to one form of autism61. In prenatal therapy with ALGERNON, treated WT offspring showed trend of impaired
learning behaviors suggesting that prenatal inhibition of DYRK1A should be finely tuned to avoid deleterious effects. In our experiments prenatal EGCG treatment of wild type mice did not induce significant alterations of the levels of synaptic markers or of NOR memory.
Therefore, controlled correction of active DYRK1A levels from prenatal through adult stages with a dietary complement containing a moderately (IC50 = 0.3 μM) potent drug such as EGCG might be the appropriate choice for a treatment to adequately balance risks and benefits.
Materials and Methods
Experimental mice.
Mice carrying the murine BAC containing one copy of Dyrk1A (mBACtgDyrk1a) were maintained on a C57BL/6J background and genotyped as described62. Dp(16)1Yey mice were maintained on aC57Bl/6J background and genotyped as described62. Mice were group housed in standard cages with access to
food and water ad libitum, under a controlled environment (20 ± 1 °C, 60% humidity) with a 12-h light/dark cycle.
All experiments were conducted in accordance with the ethical standards of French and European regulations (European Communities Council Directive, 86/609/EEC). For molecular analyses authorization from the French Ministry of Agriculture was granted to perform research and experiments on animals (authorization number 75–369), and the study was approved by the local ethical committee (Univ Paris-Diderot). For behavioural anal-yses the experimental procedures were approved by the local ethical committee Com’Eth under accreditation number 2012-069 with Y.H. as the principal investigator in this study (accreditation 67-369). Mice were fed standard laboratory diet (CRM,SpecialDietsServices, Dietex, FranceUsine) or food pellets containing 600 mg/
Figure 4. Effects of EGCG treatment on Y maze and novel object recognition memory of Dp16(1)Yey mice.
Y maze tests and Novel object recognition memory tests were performed on control wildtype (WT) (n = 14) and Dp16(1)Yey transgenic (TG) (n = 11) and treated WT (n = 16) and TG (n = 8) mice at the end of T1 treatment (P90). (A) Alternation performance in a Y-maze test. (B) Recognition index between familiarisation phase. (C) Quantification of videotracked distance mice travelled on the first day during habituation to the arena for 30 min. (D) Recognition index for mice exploring novel and familiar objects during the second day of novel object recognition memory tests. Recognition index (RI) was defined as RI = (exploration timenovel objects − exploration timefamiliar objects)/(exploration timenovel objects + exploration timefamiliar objects). Analysis of
exploration time was performed during 12 min; Two ways ANOVA were performed followed by an Holm–Sidak multiple comparison procedure with *p < 0.05.
kg MGTE (decaffeinated LifeExtension extract, containing 95% polyphenols), corresponding to a daily dose of 50 mg/kg EGCG for a 25 g mouse eating 5 g per day. (Safe-diets, Augny, France). HPLC analysis of an MGTE sam-ple revealed a content of 38% EGCG, 9% EGC and 8.5% ECG and minor catechins. Number of mice and suffering were minimized as possible. Mice carrying the murine BAC containing one copy of Dyrk1A (mBACtgDyrk1a) were maintained on a C57BL/6J background and genotyped as described62. Dp(16)1Yey mice were maintained
on a C57Bl/6J background and genotyped as described. After weaning mice were housed by 4 or 5. Food con-sumption was similar for wildtype and transgenic animals. For ECGC treatment, T1 treatment started at mating and continued through weaning (at 21 days). T2 treatment started at mating and continued until 90 days. T3 treatment started at P60 and continued until P90.
Immunohistochemistry.
Serial sagittal brain cryosections (50 µm) were immunohistochemically stained with GAD67 (Millipore MAB5406) and NeuN (Millipore ABN 78) antibodies. Neuronal and interneuronal cell densities were assessed on NeuN, and GAD67-stained sagittal serial sections (inter-section interval of 50 μm) (from Lateral 1,40 to 1,80 mm) with the optical fractionator probe of StereoInvestigator (MicroBrightField). The optical fractionator is a combination of the optical dissector, a three-dimensional probe used for cell counting and the fractionator random systematic sampling63.Preliminary cell count was performed on the regions of interest (ROI) to determine the most suitable surface and number of counting frames resulting in coefficient of errors of Scheaffer and Gurndersen (m = 1) less than 0.05. Once these parameters were defined, cell counting was performed in a random systematic fashion using the optical fractionator with a dissector height of 40 μm and a guard zone of 5 μm. Neuronal and interneuronal density was estimated in Stratum Radiatum of the hippocampus using NeuN- and GAD67-stained serial sections using the following counting frame and grid sizes (counting frame 50 × 50 μm2; grid size 80 × 80 μm2). Both
neu-ronal and interneuneu-ronal cells densities were defined using NeuN and GAD67-stained sections and the morpho-logical criteria described by Gittins and Harrison (2004) were applied to differentiate these two cell populations. To avoid shrinkage related errors only cell/cell ratio of densities were compared. To illustrate cell density, images of Neun and GAD67 staining were captured with a Leica SP8 confocal microscope (Leica) Fig. 1.
Immunoblotting.
Immunoblotting was performed following standard slot blot protocols after testing anti-body specificity by western blotting (Fig. 2 in Supplementary Methods). Antibodies are listed in Supplements. Digitized images of immunoblots were obtained using a LAS-3000 imaging system (Fuji Photo Film Co. Ltd.), and densitometry measurements were collected with an image analyzer (UnScan It software, Silk Scientific Inc.). Normalization was performed relative to total protein levels using Ponceau staining.Behavioural studies.
For all behavioural experiments, Dp(16)1Yey mice were housed in specific pathogen-free conditions with ad libitum access to food and water. Mice were kept on 12-h light/dark cycles (lights on at 7:00 AM), and tests were conducted from 9:00 AM–4:00 PM. Only animals from litters containing a minimum of two male pups were selected for experimental groups. After weaning, male mice were gathered by litters in the same cage. Animals were transferred to the experimental room 30 min before each experimental test. Behavioural experimenters were blinded to genetic status and treatment group of the animals.The Y-maze consisted of three arms (57 cm long × 17 cm wide × 35 cm high) in transparent plexiglass, and assembled at 120° angles. The Y-maze was placed 70 cm above the floor and was surrounded by visual cues (e.g., posters) outside of the maze. The room was illuminated by a desk lamp to maintain an intensity of 10 ± 3 Lux throughout the entire maze. A video camera suspended above the Y-maze was used to record arm entries.
The animal was placed at the center of the maze and allowed to move freely for a 10-min session. The number of arm entries was recorded during the first 5-min period and during the entire test. The number of alternations, which was defined as a successful entry into the three arms on overlapping triplet sets, was then calculated. The percent of successful alternations per possible alternations during the first 5-min period and during the entire test was calculated. The mean and standard error of the mean were calculated for each data group. Differences between groups were analyzed by a two-way ANOVA and a Student’s t-test. Statistical significance was considered at p < 0.05.
The novel object recognition test apparatus consisted of a white circular arena (diameter = 55 cm) placed in a dimly lit testing room (60 lux). On the first day of testing, mice were placed in the empty arena for 30 min for habituation to the apparatus and test room. On the second day of testing, mice were subjected to an acquisition trial, during which they were free to explore two identical objects for 10 min. Mice were individually placed in the presence of an object (marble or die) placed 10 cm away from one of the box corners. Exploration time of the object (when the animal’s snout was directed towards the object at a distance of ≤1 cm) was recorded.
After this acquisition phase, mice returned to their home cage for a 24-h retention interval. To test memory on the third day, one familiar object (i.e., already experienced during the acquisition phase) and one novel object were placed in the apparatus, and mice were free to explore the two objects for 12 min. Familiar objects and novel objects were placed at a distance 10 cm from the boder of the arena (distance between the two objects = ~27 cm), and exploration time of objects was recorded. Recognition index (RI) was defined as RI = (exploration timenovel objects − exploration timefamiliar objects)/(exploration timenovel objects + exploration timefamiliar objects). All mice that did not explore the first object for more than 3 seconds (below 3 seconds mice cannot memorize objects) during the acquisition trial were excluded from analysis. Analysis of exploration time was performed during 12 min. Between trials and subjects, different objects were cleaned with 70% ethanol to reduce olfactory cues. For each mouse, objects are randomly assigned as either familiar or novel to eliminate any effect due to spontaneous preference for an object. Location of the novel object (left or right) was counterbalanced between groups.
During all sessions, mice were monitored using a video tracking system (Ethovision, Wageningen, The Netherlands), which recorded total distance travelled and velocity. Object exploration was manually scored and defined as orientation of the nose to the object at a distance of <1 cm. For the retention phase, percent of time exploring familiar versus novel objects was calculated to assess memory performance.
Statistical analysis.
Differences between two groups were assessed with a two-tailed t-test. Two-Way ANOVA, followed by Holm–Sidak multiple comparison procedure, were used to compare data belonging to three groups or more than three groups. Level of significance was p < 0.05, unless otherwise specified. For results of behavioural experiments Kruskal Wallis analyses were also performed. All graphs were plotted as mean ± SEM. All statistical analyses were performed using GraphPad6 software package.References
1. Represa, A. & Ben-Ari, Y. Trophic actions of GABA on neuronal development. Trends Neurosci 28, 278–283, https://doi. org/10.1016/j.tins.2005.03.010 (2005).
2. Sahara, S., Yanagawa, Y., O’Leary, D. D. & Stevens, C. F. The fraction of cortical GABAergic neurons is constant from near the start of cortical neurogenesis to adulthood. The Journal of neuroscience: the official journal of the Society for Neuroscience 32, 4755–4761, https://doi.org/10.1523/JNEUROSCI.6412-11.2012 (2012).
3. Ko, J., Choii, G. & Um, J. W. The balancing act of GABAergic synapse organizers. Trends Mol Med 21, 256–268, https://doi. org/10.1016/j.molmed.2015.01.004 (2015).
4. Zorrilla de San Martin, J., Delabar, J. M., Bacci, A. & Potier, M. C. GABAergic over-inhibition, a promising hypothesis for cognitive deficits in Down syndrome. Free radical biology & medicine 114, 33–39, https://doi.org/10.1016/j.freeradbiomed.2017.10.002 (2018). 5. Guidi, S. et al. Abnormal Development of the Inferior Temporal Region in Fetuses with down Syndrome. Brain Pathol, https://doi.
org/10.1111/bpa.12605 (2018).
6. Kleschevnikov, A. M. et al. Hippocampal long-term potentiation suppressed by increased inhibition in the Ts65Dn mouse, a genetic model of Down syndrome. The Journal of neuroscience: the official journal of the Society for Neuroscience 24, 8153–8160, https://doi. org/10.1523/JNEUROSCI.1766-04.2004 (2004).
7. Souchet, B. et al. Excitation/inhibition balance and learning are modified by Dyrk1a gene dosage. Neurobiology of disease 69, 65–75, https://doi.org/10.1016/j.nbd.2014.04.016 (2014).
8. Guedj, F., Bianchi, D. W. & Delabar, J. M. Prenatal treatment of Down syndrome: a reality? Curr Opin Obstet Gynecol 26, 92–103, https://doi.org/10.1097/GCO.0000000000000056 (2014).
9. Garcia-Cerro, S. et al. Overexpression of Dyrk1A is implicated in several cognitive, electrophysiological and neuromorphological alterations found in a mouse model of Down syndrome. PloS one 9, e106572, https://doi.org/10.1371/journal.pone.0106572 (2014). 10. Jiang, X. et al. Genetic dissection of the Down syndrome critical region. Human molecular genetics 24, 6540–6551, https://doi.
org/10.1093/hmg/ddv364 (2015).
11. Mazur-Kolecka, B. et al. Effect of DYRK1A activity inhibition on development of neuronal progenitors isolated from Ts65Dn mice.
Journal of neuroscience research 90, 999–1010, https://doi.org/10.1002/jnr.23007 (2012).
12. Adayev, T., Chen-Hwang, M. C., Murakami, N., Wegiel, J. & Hwang, Y. W. Kinetic properties of a MNB/DYRK1A mutant suitable for the elucidation of biochemical pathways. Biochemistry 45, 12011–12019, https://doi.org/10.1021/bi060632j (2006).
13. Bain, J., McLauchlan, H., Elliott, M. & Cohen, P. The specificities of protein kinase inhibitors: an update. The Biochemical journal
371, 199–204, https://doi.org/10.1042/BJ20021535 (2003).
14. Benelli, R., Vene, R., Bisacchi, D., Garbisa, S. & Albini, A. Anti-invasive effects of green tea polyphenol epigallocatechin-3-gallate (EGCG), a natural inhibitor of metallo and serine proteases. Biol Chem 383, 101–105, https://doi.org/10.1515/BC.2002.010 (2002). 15. Thomazeau, A. et al. Prefrontal deficits in a murine model overexpressing the down syndrome candidate gene dyrk1a. The Journal
of neuroscience: the official journal of the Society for Neuroscience 34, 1138–1147, https://doi.org/10.1523/JNEUROSCI.2852-13.2014 (2014).
16. Guedj, F. et al. Green tea polyphenols rescue of brain defects induced by overexpression of DYRK1A. PloS one 4, e4606, https://doi. org/10.1371/journal.pone.0004606 (2009).
17. De la Torre, R. et al. Epigallocatechin-3-gallate, a DYRK1A inhibitor, rescues cognitive deficits in Down syndrome mouse models and in humans. Molecular nutrition & food research 58, 278–288, https://doi.org/10.1002/mnfr.201300325 (2014).
18. Souchet, B. et al. Pharmacological correction of excitation/inhibition imbalance in Down syndrome mouse models. Frontiers in
behavioral neuroscience 9, 267, https://doi.org/10.3389/fnbeh.2015.00267 (2015).
19. de la Torre, R. et al. Safety and efficacy of cognitive training plus epigallocatechin-3-gallate in young adults with Down’s syndrome (TESDAD): a double-blind, randomised, placebo-controlled, phase 2 trial. Lancet neurology 15, 801–810, https://doi.org/10.1016/ S1474-4422(16)30034-5 (2016).
20. McElyea, S. D. et al. Influence of prenatal EGCG treatment and Dyrk1a dosage reduction on craniofacial features associated with Down syndrome. Human molecular genetics, https://doi.org/10.1093/hmg/ddw309 (2016).
21. Stagni, F. et al. Short- and long-term effects of neonatal pharmacotherapy with epigallocatechin-3-gallate on hippocampal development in the Ts65Dn mouse model of Down syndrome. Neuroscience 333, 277–301, https://doi.org/10.1016/j. neuroscience.2016.07.031 (2016).
22. Guedj, F. et al. An Integrated Human/Murine Transcriptome and Pathway Approach To Identify Prenatal Treatments For Down Syndrome. Scientific reports 6, 32353, https://doi.org/10.1038/srep32353 (2016).
23. Najas, S. et al. DYRK1A-mediated Cyclin D1 Degradation in Neural Stem Cells Contributes to the Neurogenic Cortical Defects in Down Syndrome. EBioMedicine 2, 120–134, https://doi.org/10.1016/j.ebiom.2015.01.010 (2015).
24. Bui, L. C. et al. A high-performance liquid chromatography assay for Dyrk1a, a Down syndrome-associated kinase. Anal Biochem
449, 172–178, https://doi.org/10.1016/j.ab.2013.12.024 (2014).
25. Lin, L. C., Wang, M. N., Tseng, T. Y., Sung, J. S. & Tsai, T. H. Pharmacokinetics of (−)-epigallocatechin-3-gallate in conscious and freely moving rats and its brain regional distribution. J Agric Food Chem 55, 1517–1524, https://doi.org/10.1021/jf062816a (2007). 26. Bevins, R. A. & Besheer, J. Object recognition in rats and mice: a one-trial non-matching-to-sample learning task to study
‘recognition memory’. Nat Protoc 1, 1306–1311, https://doi.org/10.1038/nprot.2006.205 (2006).
27. Clark, R. E., Zola, S. M. & Squire, L. R. Impaired recognition memory in rats after damage to the hippocampus. The Journal of
neuroscience: the official journal of the Society for Neuroscience 20, 8853–8860 (2000).
28. Hammond, R. S., Tull, L. E. & Stackman, R. W. On the delay-dependent involvement of the hippocampus in object recognition memory. Neurobiology of learning and memory 82, 26–34, https://doi.org/10.1016/j.nlm.2004.03.005 (2004).
29. Reger, M. L., Hovda, D. A. & Giza, C. C. Ontogeny of Rat Recognition Memory measured by the novel object recognition task. Dev
Psychobiol 51, 672–678, https://doi.org/10.1002/dev.20402 (2009).
30. Chakrabarti, L. et al. Olig1 and Olig2 triplication causes developmental brain defects in Down syndrome. Nature neuroscience 13, 927–934, https://doi.org/10.1038/nn.2600 (2010).
31. Goodliffe, J. W. et al. Absence of Prenatal Forebrain Defects in the Dp(16)1Yey/+Mouse Model of Down Syndrome. The Journal of
neuroscience: the official journal of the Society for Neuroscience 36, 2926–2944, https://doi.org/10.1523/JNEUROSCI.2513-15.2016 (2016).
32. Hernandez-Gonzalez, S. et al. Altered distribution of hippocampal interneurons in the murine Down Syndrome model Ts65Dn.
Neurochemical research 40, 151–164, https://doi.org/10.1007/s11064-014-1479-8 (2015).
33. Raveau, M. et al. Alterations of in vivo CA1 network activity in Dp(16)1Yey Down syndrome model mice. eLife 7, https://doi. org/10.7554/eLife.31543 (2018).
34. Martinez-Cue, C. et al. Reducing GABAA alpha5 receptor-mediated inhibition rescues functional and neuromorphological deficits in a mouse model of down syndrome. The Journal of neuroscience: the official journal of the Society for Neuroscience 33, 3953–3966, https://doi.org/10.1523/JNEUROSCI.1203-12.2013 (2013).
35. Perez-Cremades, D. et al. Alteration of inhibitory circuits in the somatosensory cortex of Ts65Dn mice, a model for Down’s syndrome. J Neural Transm 117, 445–455, https://doi.org/10.1007/s00702-010-0376-9 (2010).
36. Ross, M. H., Galaburda, A. M. & Kemper, T. L. Down’s syndrome: is there a decreased population of neurons? Neurology 34, 909–916 (1984).
37. Kobayashi, K. et al. Cerebral cortical calbindin D28K and parvalbumin neurones in Down’s syndrome. Neuroscience letters 113, 17–22 (1990).
38. Costa, A. C. & Grybko, M. J. Deficits in hippocampal CA1 LTP induced by TBS but not HFS in the Ts65Dn mouse: a model of Down syndrome. Neuroscience letters 382, 317–322, https://doi.org/10.1016/j.neulet.2005.03.031 (2005).
39. Hanson, J. E., Blank, M., Valenzuela, R. A., Garner, C. C. & Madison, D. V. The functional nature of synaptic circuitry is altered in area CA3 of the hippocampus in a mouse model of Down’s syndrome. J Physiol 579, 53–67, https://doi.org/10.1113/ jphysiol.2006.114868 (2007).
40. Garcia-Cerro, S., Rueda, N., Vidal, V., Lantigua, S. & Martinez-Cue, C. Normalizing the gene dosage of Dyrk1A in a mouse model of Down syndrome rescues several Alzheimer’s disease phenotypes. Neurobiology of disease 106, 76–88, https://doi.org/10.1016/j. nbd.2017.06.010 (2017).
41. Deidda, G. et al. Reversing excitatory GABAAR signaling restores synaptic plasticity and memory in a mouse model of Down syndrome. Nature medicine 21, 318–326, https://doi.org/10.1038/nm.3827 (2015).
42. Lysenko, L. V. et al. Developmental excitatory-to-inhibitory GABA polarity switch is delayed in Ts65Dn mice, a genetic model of Down syndrome. Neurobiology of disease 115, 1–8, https://doi.org/10.1016/j.nbd.2018.03.005 (2018).
43. Cramer, N. P., Xu, X., F. Haydar, T. & Galdzicki, Z. Altered intrinsic and network properties of neocortical neurons in the Ts65Dn mouse model of Down syndrome. Physiol Rep 3, https://doi.org/10.14814/phy2.12655 (2015).
44. Szemes, M., Davies, R. L., Garden, C. L. & Usowicz, M. M. Weaker control of the electrical properties of cerebellar granule cells by tonically active GABAA receptors in the Ts65Dn mouse model of Down’s syndrome. Mol Brain 6, 33, https://doi.org/10.1186/1756-6606-6-33 (2013).
45. Suganuma, M. et al. Wide distribution of [3H](−)-epigallocatechin gallate, a cancer preventive tea polyphenol, in mouse tissue.
Carcinogenesis 19, 1771–1776 (1998).
46. Chu, K. O. et al. Uptake and distribution of catechins in fetal organs following in utero exposure in rats. Hum Reprod 22, 280–287, https://doi.org/10.1093/humrep/del353 (2007).
47. Yin, X. et al. Dyrk1A overexpression leads to increase of 3R-tau expression and cognitive deficits in Ts65Dn Down syndrome mice.
Scientific reports 7, 619, https://doi.org/10.1038/s41598-017-00682-y (2017).
48. Fernandez, F. et al. Pharmacotherapy for cognitive impairment in a mouse model of Down syndrome. Nature neuroscience 10, 411–413, https://doi.org/10.1038/nn1860 (2007).
49. Colas, D. et al. Short-term treatment with the GABAA receptor antagonist pentylenetetrazole produces a sustained pro-cognitive benefit in a mouse model of Down’s syndrome. British journal of pharmacology 169, 963–973, https://doi.org/10.1111/bph.12169 (2013).
50. Begenisic, T. et al. Fluoxetine in adulthood normalizes GABA release and rescues hippocampal synaptic plasticity and spatial memory in a mouse model of Down syndrome. Neurobiology of disease 63, 12–19, https://doi.org/10.1016/j.nbd.2013.11.010 (2014). 51. Kleschevnikov, A. M. et al. Deficits in cognition and synaptic plasticity in a mouse model of Down syndrome ameliorated by GABAB receptor antagonists. The Journal of neuroscience: the official journal of the Society for Neuroscience 32, 9217–9227, https:// doi.org/10.1523/JNEUROSCI.1673-12.2012 (2012).
52. Bannerman, D. M. et al. NMDA receptor subunit NR2A is required for rapidly acquired spatial working memory but not incremental spatial reference memory. The Journal of neuroscience: the official journal of the Society for Neuroscience 28, 3623–3630, https://doi.org/10.1523/JNEUROSCI.3639-07.2008 (2008).
53. Anderson, S. A., Eisenstat, D. D., Shi, L. & Rubenstein, J. L. Interneuron migration from basal forebrain to neocortex: dependence on Dlx genes. Science 278, 474–476 (1997).
54. Lavdas, A. A., Grigoriou, M., Pachnis, V. & Parnavelas, J. G. The medial ganglionic eminence gives rise to a population of early neurons in the developing cerebral cortex. The Journal of neuroscience: the official journal of the Society for Neuroscience 19, 7881–7888 (1999).
55. Nery, S., Fishell, G. & Corbin, J. G. The caudal ganglionic eminence is a source of distinct cortical and subcortical cell populations.
Nature neuroscience 5, 1279–1287, https://doi.org/10.1038/nn971 (2002).
56. Coley, A. A. & Gao, W. J. PSD95: A synaptic protein implicated in schizophrenia or autism? Progress in neuro-psychopharmacology
& biological psychiatry 82, 187–194, https://doi.org/10.1016/j.pnpbp.2017.11.016 (2018).
57. Stringer, M. et al. Epigallocatechin-3-gallate (EGCG) consumption in the Ts65Dn model of Down syndrome fails to improve behavioral deficits and is detrimental to skeletal phenotypes. Physiology & behavior 177, 230–241, https://doi.org/10.1016/j. physbeh.2017.05.003 (2017).
58. Best, T. K., Cramer, N. P., Chakrabarti, L., Haydar, T. F. & Galdzicki, Z. Dysfunctional hippocampal inhibition in the Ts65Dn mouse model of Down syndrome. Experimental neurology 233, 749–757, https://doi.org/10.1016/j.expneurol.2011.11.033 (2012). 59. Parrini, M. et al. Aerobic exercise and a BDNF-mimetic therapy rescue learning and memory in a mouse model of Down syndrome.
Scientific reports 7, 16825, https://doi.org/10.1038/s41598-017-17201-8 (2017).
60. Nakano-Kobayashi, A. et al. Prenatal neurogenesis induction therapy normalizes brain structure and function in Down syndrome mice. Proceedings of the National Academy of Sciences of the United States of America 114, 10268–10273, https://doi.org/10.1073/ pnas.1704143114 (2017).
61. Courcet, J. B. et al. The DYRK1A gene is a cause of syndromic intellectual disability with severe microcephaly and epilepsy. Journal
of medical genetics 49, 731–736, https://doi.org/10.1136/jmedgenet-2012-101251 (2012).
62. Guedj, F. et al. DYRK1A: a master regulatory protein controlling brain growth. Neurobiology of disease 46, 190–203, https://doi. org/10.1016/j.nbd.2012.01.007 (2012).
63. Keuker, J. I., Vollmann-Honsdorf, G. K. & Fuchs, E. How to use the optical fractionator: an example based on the estimation of neurons in the hippocampal CA1 and CA3 regions of tree shrews. Brain Res Brain Res Protoc 7, 211–221 (2001).
Acknowledgements
We are grateful to animal caretakers for their services at PHENOMIN-ICS and Institut Jacques Monod animal facility, to members of the research groups involved, and to staff of the IGBMC laboratory for helpful suggestions and discussions. This work was supported by the National Centre for Scientific Research (CNRS), French National Institute of Health and Medical Research (INSERM), University of Strasbourg, “Centre Européen de Recherche en Biologie et en Médecine”, Jerome Lejeune Foundation, European Commission (AnEUploidy project to J.M.D. and Y.H., LSHG-CT-2006-037627), French state funds through the “Agence Nationale de la Recherche” program ANR-009-DSTHER (to J.M.D.), Therapeutics21 ANR-Emergence (to J.M.D. and Y.H.), and Investissements d’Avenir program ANR-10-IDEX-0002-02, ANR-10-LABX-0030-INRT, and ANR-10-INBS-07 PHENOMIN (to Y.H.). Funders had no role in study design, data collection and analysis, decision to publish, or preparation of the manuscript.
Author Contributions
B.S. performed the stereological measurements. B.S. and F.D. performed the molecular quantifications. Y.G. and J.D. performed the HPLC quantifications. C.C., V.N. and A.D. performed the behavioral studies. A.D., Y.Y. and Y.H. designed the behavioral studies. N.C., N.J. and J.M.D. designed and supervised the cell density and molecular quantifications. Y.H. and J.M.D. supervised the writing of the manuscript. All authors have given approval of the final version of the manuscript.
Additional Information
Supplementary information accompanies this paper at https://doi.org/10.1038/s41598-019-40328-9.
Competing Interests: The authors declare no competing interests.
Publisher’s note: Springer Nature remains neutral with regard to jurisdictional claims in published maps and
institutional affiliations.
Open Access This article is licensed under a Creative Commons Attribution 4.0 International
License, which permits use, sharing, adaptation, distribution and reproduction in any medium or format, as long as you give appropriate credit to the original author(s) and the source, provide a link to the Cre-ative Commons license, and indicate if changes were made. The images or other third party material in this article are included in the article’s Creative Commons license, unless indicated otherwise in a credit line to the material. If material is not included in the article’s Creative Commons license and your intended use is not per-mitted by statutory regulation or exceeds the perper-mitted use, you will need to obtain permission directly from the copyright holder. To view a copy of this license, visit http://creativecommons.org/licenses/by/4.0/.