HAL Id: hal-02446242
https://hal.archives-ouvertes.fr/hal-02446242
Preprint submitted on 20 Jan 2020
HAL is a multi-disciplinary open access
archive for the deposit and dissemination of
sci-entific research documents, whether they are
pub-lished or not. The documents may come from
teaching and research institutions in France or
abroad, or from public or private research centers.
L’archive ouverte pluridisciplinaire HAL, est
destinée au dépôt et à la diffusion de documents
scientifiques de niveau recherche, publiés ou non,
émanant des établissements d’enseignement et de
recherche français ou étrangers, des laboratoires
publics ou privés.
Quentin Roveillo, Julien Dervaux, Yuxuan Wang, Florence Rouyer, Drazen
Zanchi, Laurent Seuront, Florence Elias
To cite this version:
Quentin Roveillo, Julien Dervaux, Yuxuan Wang, Florence Rouyer, Drazen Zanchi, et al.. Unexpected
trapping of swimming microalgae in foam. 2020. �hal-02446242�
Unexpected trapping of swimming microalgae in foam
Quentin Roveillo, a Julien Dervaux a, Yuxuan Wang a, Florence
Rouyer b , Drazen Zanchi a, Laurent Seuront c, d, e, Florence Elias a⇤
a Universit´e de Paris, Laboratoire Mati`ere et Syst`emes Complexes, UMR CNRS 7057, F-75205 Paris Cedex 13, France
b Lab Navier, Univ Gustave Ei↵el, ENPC, CNRS, F-77447 Marne-la-Valle, France
c CNRS, Univ. Lille, Univ. Littoral Cte dOpale, UMR 8187, LOG,
Laboratoire dOcanologie et de Gosciences, F 62930 Wimereux, France
d Department of Marine Resource and Energy, Tokyo University of Marine Science and Technology, 4-5-7 Konan, Minato-ku, Tokyo 108-8477, Japan
e Department of Zoology and Entomology, Rhodes University, Grahamstown, 6140, South Africa. (Dated: January 20, 2020)
Massive foam formation in aquatic environments is a seasonal threat that drastically impacts the stability of marine ecosystems. Because liquid foams are known to filter passive solid particles, with large particles remaining trapped by confinement in the network of liquid channels and small particles being freely advected by the gravity-driven flow, we hypothesized that a similar e↵ect could explain the major shifts in phytoplankton populations observed during foaming episodes. The model unicellular motile algae Chlamydomonas reinhardtii (CR) was incorporated in a bio-compatible foam, and the number of cells escaping the foam at the bottom was measured in time. Comparing the escape dynamics of living and dead CR cells, we found that dead cells are totally advected by the liquid flow towards the bottom of the foam, as expected since the CR diameter remains smaller than the typical foam channel diameter. In contrast, living motile CR cells escape the foam at a significantly lower rate: after two hours, up to 60 % of the injected cells may remain blocked in the foam, while 95 % of the initial liquid volume in the foam has been drained out of the foam. Microscopic observation of the swimming CR cells in a chamber mimicking the cross-section of foam internal channels revealed that swimming CR cells accumulate near channels corners. A theoretical analysis based on the probability density measurements in the micro chambers have shown that this trapping at the microscopic scale contributes to explain the macroscopic retention of the microswimmers in the foam.
PACS numbers:
I. INTRODUCTION
The ever-increasing pollution of watercourses, lakes and oceans is one of the most prominent environmental issues of the 21st century [1]. Specifically, there is now a
plethora of identified natural and anthropogenic sources of particulate pollutions [2]. Organic pollutants, inor-ganic fertilizers and metals, mostly originating from land-based anthropogenic activities, often come from nonpoint sources such as agricultural runo↵s, wind-blown debris and dust [3]. Another important source of aquatic pol-lution, though generally more localized, is related to the synthesis of toxic chemical compounds by unicellular al-gae during the so-called harmful algal blooms (HABs). These compounds are detrimental and eventually lethal to a range of organisms, including humans [4]. Further-more, another aquatic pollution of increasing global con-cern is related to the massive and growing release of plas-tic debris in waterbodies, whose size typically ranges from the molecular to the macroscopic scale [5].
A more pernicious source of pollution, though of purely natural origin, is the formation of foams, i.e. persistent
⇤Electronic address: [email protected]
bubble aggregates, that are commonly found on the sur-face of water masses such as rivers, ponds, lakes and oceans. Specifically, foams are the result of air entrain-ment into the water either naturally by breaking of wind waves or through water discharge behind anthropogenic structures. Under certain conditions (i.e. in the pres-ence of both strong turbulent mixing and either natural or anthropogenically-derived surfactants), emerging bub-bles accumulate on the water surface, produce foam, and eventually gather on beaches [6–8]. Some of the most dramatic instances of foam formation and accumulation so far have been related to the occurrence of intense phy-toplankton blooms, in particular the marine haplophyte Phaeocystis globosa [7–9].
Due to the amphiphilic nature of the air-liquid inter-face, these liquid foams have the desirable property to concentrate chemical molecular pollutants such as heavy metals and hydrophobic organic pollutants [6]. The self-purification of a freshwater river by a natural foam has even been reported following a pollution by toxin spills of cyanides and heavy metals [10]. This purification mech-anism by aquatic foams, however, could be extended in remedying particulate pollution over a very wide range of particle sizes, using the filtration properties of foam. Fundamentally, a foam is a dispersion of gas bubbles in an interconnected liquid channel network [11], within which the liquid flows like in the pores of a soft porous
0 1000 2000 3000 4000 5000 6000 0.0 0.2 0.4 0.6 0.8 1.0 Time(s) Fractio n o f escape d algae f(t)= N FN 0 1000 2000 3000 4000 5000 6000 0 5 10 15 20 25 30 35 Time(s) Volum e V (t ) o f liqui d drained (mL ) Electrode pairs Stir bar Infrared spectrophotometer Camera Red light source
Prism Optical enclosure Lid FOAM liquid (volume VF) + algae (number NF) + air bubbles LIQUID no alga initially Gravity Interface Camera Transfer of Algae + Liquid N(t) V(t) Escaped algae Trapped algae VF VF 2 F
Initial volume of liquid in foam
A B
C
Porous glass plate
t*
t*
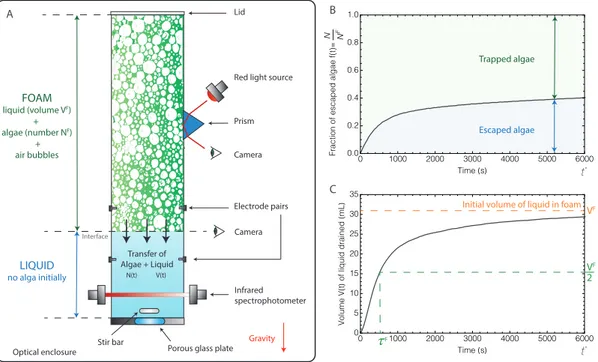
FIG. 1: (A) Experimental setup (see detailed description in section Materials and Methods). At the initial time t = 0, the foam contains a liquid volume VF and a number of CR cells NF ; the volume drained out of the foam is V (t = 0) = 0, and the number of CR cells released from the foam in the underlying liquid is N (t = 0) = 0. At t > 0, the fraction of CR released cells f (t) = N (t)/NF and the volume V (t) drained out of the foam are measured (panels B and C, respectively – see section Materials and Methods for the measurement procedure). The characteristic time ⌧F is the time at which half of the initial foam liquid volume has been drained out of the foam.
medium. Individual foam channels are called Plateau borders. When the liquid phase is loaded with spheri-cal particles of diameter dp (at a volume fraction smaller
than⇠ 40 %), their dynamics depends on the character-istic size dc of the Plateau border cross-section: the
par-ticles are freely advected by the flow of liquid if dp< dc,
while they are blocked in the channel if dp > dc [12, 13].
Aquatic foams could then have the ability to selectively retain micro- to millimeter scale solid particles such as plastic debris or certain species of planktonic cells, in or-der to remove them from the marine environment. This hypothesis is supported by in situ observations showing that the formation of foam in the turbulent surf zone was concomitant with a dramatic decline loss of unicel-lular algae in the water column [14]. While no rationale has been put forward to explain those observations, they suggest that aquatic foam may have the ability to trap particles present in the water column, and as such might be a promising bio-inspired tool to filter and remove un-wanted particles from various waterbodies.
In this context, we assess the potential ability of a liq-uid foam to trap micrometer-scale (⇠ 10 µm) algal cells. We use the microalgae Chlamydomonas reinhardtii (CR), widely used in the literature as a model bi-flagellated unicellular eukaryote [16–23], incorporated in the liquid phase of a foam stabilized with bio-compatible proteins (see Fig. 1). Because of gravity, a freshly formed foam is
an out-of-equilibrium dynamical system, where the liq-uid phase of the foam flows downwards. As such, CR cells are expected to flow downward, eventually reach the underlying liquid underneath the foam, to finally escape from the foam. To assess the generality of the process in-volved, we first investigate the escape dynamics of both living and dead (i.e. non-motile) CR cells. Because mi-croswimmers such as CR typically actively interact with boundaries, we further characterize the potential interac-tions between motile CR cells and the specific geometry of the channels of a liquid foam, i.e. a triangular-like cross-section with a concave curvature [11], using mi-crofluidic chambers specifically designed to mimick the shape of the cross-section of an internal foam channel where we quantify the density probability distribution of motile CR cells. We develop a numerical analysis in or-der to link those observations at the microscopic scale to the macroscopic measurements of the escape cell dy-namics at the scale of the foam. We finally discuss the potential contribution of the coupling between the flow and the swimming of the microalgae, that could explain the observations reported in this article.
II. RESULTS
A. Retention of cells in the foam: motile versus
non-motile
To quantify the trapping of CR cells in a liquid foam, laboratory experiments were performed on controlled sys-tems (Fig. 1A). A foam, stabilized with biocompatible proteins, was prepared in a vertical transparent column (see Materials and Methods), with two control parame-ters: (i) the average bubble edge length h`i, which is a proxy for the bubble size distribution, and (ii) the ini-tial liquid fraction in the foam, 0, defined as the
liq-uid volume divided by the foam volume. CR cells were then homogeneously incorporated in the freshly formed foam, by injecting the foaming solution loaded with the CR cells at the top of the foam. The cell concentration was of the order of 109 cells.l 1, two orders of
magni-tude larger than the phytoplankton biomass in a natural aquatic environment in blooming conditions [14] in order to increase the detection signal while remaining in the case of a diluted suspension; assuming spherical particles of diameter dp = 10 µm, this represents a particle
vol-ume fraction of the order of 10 6 in the suspension. All
experiments were performed in a dark optical enclosure to avoid any phototactic response of CR cells.
Transported by the liquid in the Plateau borders, the cells flowed downwards. The injection of the suspension of CR cells at the top of the foam column was stopped as soon as a detectable amount of CR cells reached the liquid underneath the foam: this set the time t = 0 of the experiment. At t > 0, the liquid freely drained ver-tically under gravity within the foam: the number N (t) of CR cells escaping the foam and the volume V (t) of liquid drained out of the foam were measured (Fig. 1B and 1C). The measurements show that at t = t⇤ = 6000
s, although 95 % of the volume initially contained in the foam has been drained out, only 40 % of the injected mi-croswimmers have reached the underneath liquid, mean-ing that the remainmean-ing 60 % of the injected algae re-mained blocked in the foam.
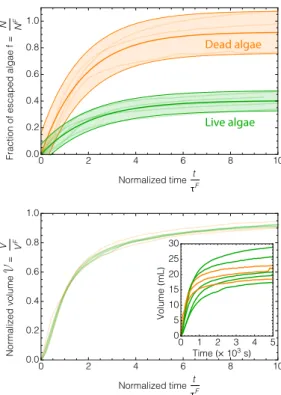
The same experimental conditions was repeated using a suspension of dead, hence non-motile CR cells: Fig. 2 shows that, in this case, around 90 % of the injected cells are advected in the underneath liquid at t = t⇤. Since the typical diameter of the CR cells dp' 10 µm is much
smaller than the diameter of the circle inscribed in the Plateau border (dc ' 160 µm at t = 0), this passive
ad-vection is expected for diluted passive spherical particles [12]. Furthermore, Fig. 2 shows that the status of the CR cells (dead or alive) does not influence the foam draining dynamics.
The motility of the live CR cells is therefore suspected to cause the retention of the cells in the draining foam. The dynamics of swimming of CR microalgae has been described as a run-and-tumble-like motion of individual cells, which consists in an alternance of ballistic motion characterized by a mean swimming velocity v, followed by
Dead algae Live algae 0 2 4 6 8 10 0.0 0.2 0.4 0.6 0.8 1.0 Normalized time t τF N FN 0 2 4 6 8 10 0.0 0.2 0.4 0.6 0.8 1.0 Normalized time t τF V FV Volume (mL ) 0 1 2 3 4 5 0 5 10 15 20 25 30 Time(× 103s) Normalize d volume V = Fractio n o f escape d algae f =
FIG. 2: Time-evolution of the fraction of cells escaping the foam f (top) and of the normalized volumeV drained out of the foam (bottom) as a function of the normalized time t/⌧F. Green line: alive motile cells, orange line: dead cells. The experiments have been reproduced 3 to 6 times for each case. In the top panel, the error bars come from the dispersion of data.
a change of orientation of the trajectory at a random an-gle [17]. At long times, the trajectories of the microswim-mers are then characterized by a random walk, with an e↵ective di↵usion coefficient De↵, whose numerical value
is typically two orders of magnitude larger than the dif-fusion coefficient of small Brownian particles [19, 20]. In the draining foam, the cell motility is limited both by the confinement and by the flow in the liquid channels. The liquid flow profile in a Plateau border strongly depends on the foam physico-chemical parameters. In a foam sta-bilized with proteins, the surface mobility of the air-liquid interfaces is known to be rather small and the interfaces can be considered as immobile [24, 25]: hence, the liquid flow in the Plateau borders is similar to a Poiseuille flow, characterized by a mean velocity hui and a shear rate ' hui/dc. During the free drainage of the foam, hui(t)
decreases as the liquid drains out of the foam, with a characteristic draining time ⌧F (Fig. 1C). We show
be-low that the dynamics of retention/escape of the motile CR cells is characterized by two regimes, at long times t& ⌧F or at short times t. ⌧F.
Dead algae Live algae 0.0 0.2 0.4 0.6 0.8 0.0 0.2 0.4 0.6 0.8 1.0 V N Passiv e adv ection
Retarded advection
Dead algae Live algae Fractio n o f escape d algae N N Passiv e adv ection
Retarded advection
Dead algae Live algae Normalized volume V Passiv e adv ection
Retarded advection
V =VVF
f
=
N FN
α
FIG. 3: Convective and di↵usive regimes : fraction of escaped cells f = N/NF versus normalized drained liquid volume
V = V /VF. Same data as in Fig. 2. The parameter ↵ is indicated as the slope of the function f (V) (dotted line).
B. Advection and di↵usion: two regimes to escape
foam
In a regime of pure advection, the flux of particle through the foam is expected to scale with the liquid flow rate through the foam: dN/dt = c dV /dt, where c = NF/VF is the particle concentration in the bulk
liquid, with NF and VF being respectively the
par-ticle number and the liquid volume initially contained in the foam. This leads to a simple equality between the fraction f (t) = N (t)/NF of cells escaping the foam
and the normalized volume drained out of the foam V(t) = V (t)/VF: f (t) = V(t). Indeed, the pure
ad-vection of the dead algae is emphasized in Fig. 3. The motile cells, in contrast, have a very di↵erent behavior. Two regimes are visible in Fig. 3: a linear regime at short times (V . 0.3 i.e. t . 0.6 ⌧F), and a non-linear regime
at larger times.
At short times, the advection is dominant: f (t) in-creases linearly with the normalized drained volumeV(t). However, the slope ↵' 0.2 is smaller than 1: we call this regime the retarded advection regime.
At long times, when the drained volume is larger than half of the initial volume (V & 0.5), the foam drainage decelerates: the liquid flow velocity inside the foam chan-nels, and subsequently the transport of CR cells by ad-vection, decrease significantly. It is well-known, however, that the transport of CR microswimmers is controlled by convection as well as di↵usion, which arises macroscopi-cally from the run-and-tumble-like motion of individual CR cells [20]. Hence, the long-time dynamics of escape of the motile CR cells from the foam is controlled by the di↵usive motion of the microswimmer [26]: we call this regime the di↵usive regime.
A ↵ f ⇤ B T = 0.75 0(U/v) = ⌧swim/⌧c 1 Of T = ⌧swim/⌧c / U f ⇤
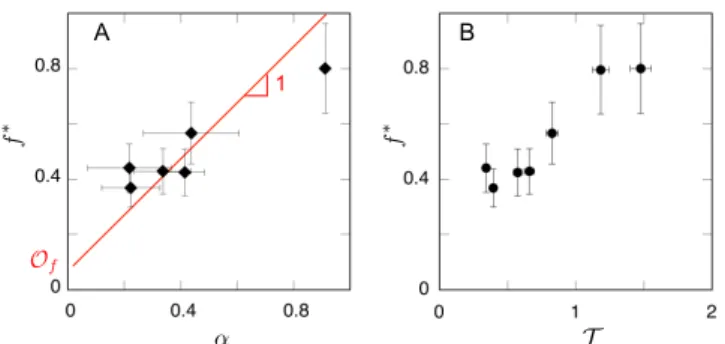
FIG. 4: Fraction f⇤ = f (t⇤) of algae escaped from the foam at t = t⇤ as a function of the initial slope ↵ = (df /dt)/(dV/dt)|t=0 (panel A), and as a function of the
es-cape time numberT (panel B), where T / U is given by
Eq. 3. The red line in panel A corresponds to the relation f⇤' ↵ + Of (see text), whereOf is an o↵set taking into ac-count the fraction of CR cells escaped by di↵usion. The best fit of the data givesOf = 0.08± 0.05.
C. The trapping of cells at long times is controlled
at short times
At short times, the advection of motile cells is signif-icantly retarded in respect to dead algae (Fig. 3). The coefficient ↵ is a proxy of this e↵ect: it is defined as the ratio between the initial rate df /dt of the fraction of cells escaping the foam and the initial rate dV/dt of normal-ized volume drained out of the foam:
df dt = ↵
dV
dt. (1)
Generally speaking, ↵ depends onV and therefore on t as shown on Fig. 3. In the convective regime, however, ↵ is constant: ↵ = 1 for dead CR cells, and ↵6 1 for motile living cells. Neglecting the microswimmer e↵ective dif-fusion, the fraction of cells advected out of the foam at long times t⇤ = 6000 s would be the integral of Eq. 1
between t = 0 and t = t⇤, that is f⇤
adv ' ↵. Fig. 4A
shows that the total fraction of motile CR cells escaping the foam f⇤ = f (t⇤) is very well correlated with ↵, with an o↵set taking into account the fraction of cells escap-ing the foam by di↵usion: hence, the long-time trappescap-ing of the CR motile cells in the foam is determined by the early advective dynamics.
The di↵erent data points in Fig. 4 were experimen-tally obtained by varying the initial mean flow velocity U =hui(t = 0) in the foam channels (see Materials and Methods): the larger the initial flow velocity U , the larger the fraction f⇤of motile CR cells escaped from the foam, as shown in Fig. 4B, where f⇤is plotted as a function of
the parameterT / U defined below in Eq. 3.
We investigate below the potential role played by the microswimmer motility in the plane perpendicular to the direction of the liquid flow.
D. Swimming in a Plateau border
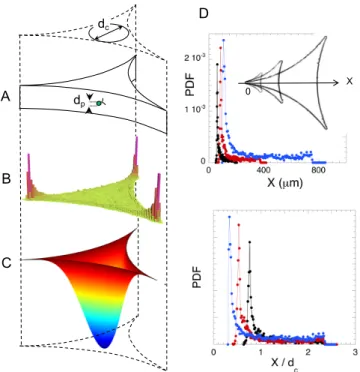
Microswimmers are known to interact with boundaries, through various e↵ects. Ostapenko et.al [22] have re-cently evidenced that, when placed in a confined circular chamber, CR cells are more likely to swim close to the boundary. In a foam channel, however, the cross-section of the confining Plateau borders consists in three con-cave walls. In order to directly observe the microswim-mers inside a foam channel, individual CR cells were placed in microfluidic chambers, having the shape and the typical dimension of the cross-section of a Plateau border (Fig. 5A). The chambers were illuminated with a red light (wavelength > 630 nm) to avoid any photo-tactic e↵ect. The observation provided an evidence for a pronounced peak of the density probability of the mi-croswimmers near the corners of the Plateau border, as shown in Fig. 5B. Three di↵erent lateral sizes of cham-bers were tested, and the pronounced peak of the proba-bility distribution function (PDF) in the corner was sys-tematically observed, at roughly the same distance (13 to 17 µm) from the corner edge (Fig. 5D). Although the PDF is multiplied by a factor of 20 in the corners, the microswimmers have a slight affinity for the edges of the chamber, where the PDF is doubled compared to the value in the center.
E. From microscopic to macroscopic
Aiming to understand the retarded advection of the CR cells out of the foam, we incorporated the PDF measurements of the swimming CR cells in the micro-chambers into a description of the microswimmer ad-vection inside a macroscopic draining foam. We use a simplified model, which assumes (i) the de-coupling of the cell motion in the axis of the Plateau border and in the perpendicular direction, and (ii) that the cell density probability p(~r) in the cross-section of a Plateau border does not depend on the orientation of the Plateau bor-der from the vertical. Unbor-der those assumptions, the cell flux across a single vertical Plateau border was computed by weighting the flow velocity ~u(~r) in the channel (Fig. 5C) by the PDF p(~r) (Fig. 5B). The macroscopic escape rate of CR cells out of the foam was then determined by averaging the particle flux over all the Plateau borders contained in the cross-section of the foam column, assum-ing a random orientation of the Plateau borders from the vertical [27]. Finally, we obtain the ratio ↵ between the initial rate df /dt of the fraction of cells escaping the foam and the initial rate dV/dt of normalized volume drained out of the foam:
↵ = df /dt dV/dt t=0= SPBRSPBu(~r) p(~r) dS R SPBu(~r) dS , (2) where SPB = 1.68 d2c is the cross-section area of a
sin-gle Plateau border and ~u(~r) is computed for a vertical channel.
The values of ↵, computed for the three diameters dc of the microfluidic chambers, are reported in Table
I where the correspondance between the chamber diam-eter dc and the flow mean velocity U was given by the
relation U = d2
c with = (32± 2)103m 1.s 1 [28].
This simplified model gives ↵' 0.76 for the three val-ues of dc. Hence, it successfully captures the initial
slow-down of the advection of motile cells out of the foam, compared to the non-motile case, where ↵ = 1 since the PDF is expected to be uniform within the Plateau border for non-Brownian passive particles. In the foam experi-ments (Fig. 1 to 4), the CR were suspended in a solution made of culture medium and egg white protein to sta-bilize the foam. In microfluidic chambers, we compared experiments performed using suspensions of CR in cul-ture medium, or in a solution of culcul-ture medium and egg white protein: we checked that the presence of the egg white proteins did not a↵ect the density probability of the cells in the chambers since the ↵ computed in both situations is the same, within error bars (see Table I), which excluded the possibility of an interaction between the CR flagella and the proteins.
In order to link the microscopic and the macroscopic approaches, we consider that the microswimmer remains trapped in the Plateau borders if the time ⌧swim = dc/v
to swim to the corner of the channel is larger than the passive advection time ⌧c = `/U outside the channel. We
define the escape time number: T =⌧swim⌧
c
. (3)
Fig. 4 clearly shows a sharp drop of the fraction of escaped motile cells when T decreases below 1, with a macroscopic ↵ being as low as 0.2 whenT ' 0.4. The values of ↵ computed from the microscopic observations, however, do not display a dependence on T , as shown on Table I, although they predict the right trend. Yet, the presented simplified model ignored the interaction between the swimming of the algae and the flow or the environment. Some of those interactions, however, have been documented experimentally [23, 29–31]. We discuss below the possible relevance of those interactions for our study.
III. DISCUSSION AND CONCLUSION
Inspired by the environmental consequences of marine foams, this article shows, in laboratory-controlled ex-periments, that motile microalgae remained significantly trapped in a liquid foam, while non-motile cells were to-tally advected by the drainage of liquid out of the foam. Two regimes were identified in the dynamics of escaping the foam: a di↵usive regime at long time, and a retarded advective regime at short times. The cell trapping dy-namics was determined in this short time regime, in the early stages of the foam drainage. The observation of mi-croswimmers in microfluidic chambers mimicking foam
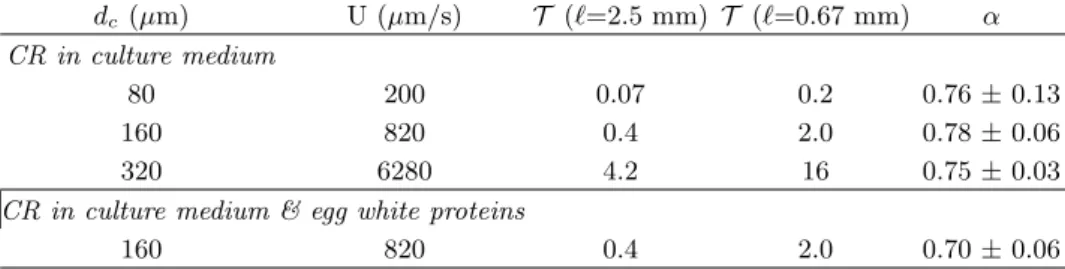
TABLE I: Computed values of ↵ using the PDF of the microswimmers in microfluidics wells (Fig. 5B) and Eq. 2. dc is the diameter of the circle inscribed in the microfluidic chambers; U = d2c is the corresponding mean velocity of the liquid in a freely draining foam; T is the corresponding escape time number defined in Eq. 3, using the two extreme values of h`i in the macroscopic draining foam experiments. The three first lines correspond to experiments performed in microfluidic wells of di↵erent sizes using CR cells in culture medium; the last line corresponds to CR cells in a solution made of culture medium and egg white proteins.
dc(µm) U (µm/s) T (`=2.5 mm) T (`=0.67 mm) ↵
CR in culture medium
80 200 0.07 0.2 0.76± 0.13
160 820 0.4 2.0 0.78± 0.06
320 6280 4.2 16 0.75± 0.03
CR in culture medium & egg white proteins
160 820 0.4 2.0 0.70± 0.06
liquid channel have revealed that, in the absence of flow, the microswimmers strongly accumulate near corners. In a foam, the liquid flow velocity vanishes in the corners of the channels: thus, the accumulation of algae in the corners of the channels leads to a slowdown of the cell ad-vection out of the foam. The macroscopic measurements, however, show that the CR cell retention is enhanced when the escape time number T in the foam decreases, as shown in Fig. 4. This mechanism thus remains to be clarified and we discuss below the possible e↵ects which could be invoked to contribute to this behavior.
Firstly, the confinement parameter = dp/dc is
clas-sically invoked to determine whether solid particles are captured in a foam [11, 12]. The escape time number can be expressed as T ' 5.10 5 2 [28]. In Fig. 4, 0.35 <
T < 1.5 corresponds, however, to 5.10 3 < < 10 2,
which remains very small compared to 1: the increasing retention of the microswimmers thus cannot be explained by an increasing confinement.
Secondly, aerotaxy may drive CR cells to swim close to air-liquid interfaces to search for oxygen. For the range of cell concentration used in our experiments, we estimate that, according to ref. [32], the respiration rate is roughly of 3 nmol O2 min 1 per ml. Thus, the cells consumed
⇠ 0.01 % of the mass of Oxygen contained in the liquid after a time t = ⌧F
' 10 min. Oxygen depletion due to cell intake is therefore not large enough to provoke any aerotaxis e↵ect towards the air-liquid interfaces.
Thirdly, some authors have pointed the increase of the e↵ective viscosity [23]. Although this e↵ect would con-tribute to slow down cell advection, it is not a relevant e↵ect in our experiments, where the suspensions were very diluted. Fig. 2 show that the dynamics of the liq-uid volume drained out of the foam is independent of the motility of the cells, which would not be the case if the liquid e↵ective viscosity would be di↵erent in the case of motile cells.
Finally, the swimming motion of the CR cells is cou-pled to fluid flows via gyrotactic e↵ets, due to bottom heaviness of CR cells. Gyrotaxis can contribute to con-centrate CR cells within a shear flow. The interplay be-tween the gyrotactic torques and hydrodynamic viscous
torques is quantified by the number = 3⌘!/(⇢gh) [29] where h⇠ 0.1 µm is the distance between the center of mass and the geometric center of the cell, and ! is the lo-cal vorticity. In our experiments, !' U/dcand would
typically range from 20 to 70, which is larger that 1, hence gyrotactic e↵ects might be relevant. Those e↵ects depend on the relative orientation of the gravity and the flow: in vertical channels, they lead to the hydro-focusing of CR microswimmers close to the central axis of the channel [30]; in horizontal channels, gyrotactic focusing occurs in the region of maximum flow rate [31]. Since the Plateau borders are randomly oriented in a foam, both e↵ect are likely to occur. The first hydro-focusing e↵ect would, however, lead to an accumulation of the microswimmers in the center of the Plateau border, where the liquid ve-locity is maximum: this would result in accelerating cell advection, which is opposite to the observed e↵ect. In the case of horizontal channels, the cell focusing in the region of highest shear rate would lead to an accumula-tion close to the edges of the Plateau border and result in a retarded advection. This cell accumulation, however, is expected to increase with an increasing shear rate, that is an increasing flow velocity U which is in contradic-tion with our measurements shown in Fig. 4. In short, although gyrotactic e↵ect are expected in our systems, they cannot account for the mechanism of retarded ad-vection experimentally observed.
As a conclusion, the experimental observations re-ported in this article leave open the question of the modelling of the retarded advection of Chlamydomonas rheinardtii microswimmers in a liquid foam. Further the-oretical studies are required to unravel this observation.
Although such a predominance of microswimmers in corners has already been reported for pusher-like sperm cells in square reservoirs [33], it is to our knowledge the first time that this predominance is observed in the case of a puller-like bi-flagellated algae. This observation sug-gests that corner trapping could be universally observed irrespective of specific swimming behaviors. In that spect, the trapping of motile microalgae in a foam re-ported in this article is expected to shed some light in the much broader area of microswimmer retention by
A C B dc dp D X 0
FIG. 5: Swimming in a Plateau border-like chamber. (A) Sketch of the set-up and notations: dc is the diameter of the circle inscribed in the concave chamber; the radius of cur-vature of the chamber walls is r = 3.23 dc, and the chamber height is 20 µm. (B) Probability density for a single cell in the chamber (linear scale), for dc= 160 µm. (C) Vertical velocity field inside a Plateau border with immobile interfaces (numer-ical simulations). (D) Relative probability density function along the X axis, with X = 0 in one of the three corners of the chambers, for dc= 80 µm (•), dc= 160 µm (•) and dc= 320 µm (•). The data are plotted along the X axis in the top panel, and as a function of X/dcin the bottom panel. Insert: images of the wells (from the top) corresponding to the three di↵erent values of dc. See the section Material and Methods for more details.
porous media such as soils [34]. The experimental evi-dence of the selective retention of motile cells in a liquid foam reported in this article also opens promising new remediation tools noticeably against biological pollution of waterbodies by harmful motile protists such as motile dinoglagellates [4].
IV. MATERIAL AND METHODS
A. Algal growth and preparation of solutions
We used the strain CC124 of Chlamydomonas rein-hardtii. The algae were kept on High Salt with Acetate (HSA) medium agar plate. For experiments, algae were propagated in liquid HSA medium on an orbital shaker in an incubator at 25 on a 12h/12h bright/dark light cycle to optimize cell uniformity and motility. Cells were used between 48h and 72h after inoculation in liquid medium
to ensure reproducibility of the response. Experiments with heat-killed cells were performed on cultures kept at 100 C for 5 min. Experiments in the foam at at low cell concentrations were performed by centrifuging the culture at 1000g for 10 min and replacing the HSA su-pernatant by a foaming solution made of HSA solution and a small amount of dehydrated egg white (obtained from IGRECA) added as a biocompatible foaming agent, to obtain a final dehydrated egg-white concentration of 5 g/L. Experiments in microfluidic chambers were per-formed using the cells in the liquid medium without any centrifugation.
B. Sedimentation of microswimmers in the foam
column
The foaming solution was made of HSA solution and a small amount (5 g/L) of dehydrated egg white added as a biocompatible foaming agent. The density of the solution was ⇢' 1160 kg.m 3.
The liquid foam was generated in transparent plexi-glas vertical column (height Z = 30 cm, square cross-section S = 4⇥ 4 cm2), by blowing air at a constant flow
rate in the foaming liquid solution through a glass porous plate. The bubble size distribution of the foam was mea-sured by imaging the bubbles at the column wall, via the reflexion of a collimated light passing through a glass prism as sketched in Fig. 1A [35]. Using image analysis, we obtained the distribution of the length ` of the foam Plateau borders, which is a proxy for the bubble size. Since the bubble size is fixed by the foaming mechanism during the foam formation, the initial distribution of the Plateau border length was assumed to be spatially uni-form in the foam. The average bubble size was monitored by adjusting the gas flow rate through the porous glass plate during the foam formation.
The liquid volume fraction of the foam, , was deter-mined by measuring the relative electrical conductivity of the foam [36] via two pairs of electrodes across the foam and across the bulk solution. Because of the liquid drainage, varies in the foam along the vertical direction. Yet, a homogeneous initial vertical distribution of the liq-uid volume fraction 0 in the foam could be achieved by
injecting liquid solution at the top of the foam at a con-stant flow rate Q ' 3 mL/min. (forced drainage) [37]. Once the initial homogeneous foam was formed, a di-luted suspension of CR cells was injected at the top of the foam column at the same liquid flow rate Q.
The number of CR cells N (t) reaching the liquid un-derneath the foam was measured by recording the opti-cal density of the suspension, using a spectrophotometer (Ocean Optics, see Fig. 1A)
The volume V (t) of liquid drained out of the foam was monitored via the measurement of the height of the liquid-foam interfaces using a video camera.
The initial mean flow velocity U = hui(t = 0) in the Plateau borders, was determined by the measurement of
V (t), setting
U = 1
0S
dV dt t=0.
The value of U in the Plateau borders was controlled by monitoring the average lengthh`i of the Plateau borders in the foam (between 0.7 mm to 2.5 mm), since U ⇠ ⇢g 0h`i2/⌘ in the case of immobile interfaces [11, 37].
In order to avoid any phototactic behaviour of the CR cells, the setup was placed in a dark box and the inter-nal illumination is achieved using a red or infra-red light (optical wavelength > 650 nm). A magnetic stirrer is placed in the underlying liquid to ensure a homogeneous concentration of cells in the liquid.
C. Swimming in microfluidic chambers
Plateau border-like chambers, without inlet or outlet, with internal diameters dc from 80 µm to 320 µm with
a height of 20 µm were designed using soft lithography techniques with PDMS (see Fig. 5A). Just before exper-iment the PDMS device was made hydrophilic by oxyda-tion using air plasma device over 2 minutes. A ⇠ 3 µL drop of solution containing algae was deposited on the the PDMS device and a microscope slide was placed gently on the top. Chambers containing one or two cells were used for experiment. The CR cell position was recorded under an inverted phase contrast microscope during 5 minutes at a rate of 10 fps, using a red illumination (wavelength > 630 nm) to avoid any phototactic e↵ect. Each ex-periment was repeated 15 times. The exex-perimental cell positions were statistically averaged and converted into relative probability density maps. Additional averages were performed over the rotation of the entire map from 2⇡/3 and 4⇡/3 angles, taking into account the angular symmetry of the Plateau border cross-section.
A series of experiments were carried out with cells dis-persed in a solution containing egg white proteins. In this case, the suspension was placed in the chambers without any air plasma treatment: because the PDMS is hydrophobic, it was assumed that the amphiphilic egg
white proteins adsorb on the PDMS interfaces, creating a situation similar to a foam Plateau border, where the proteins are adsorbed at the air-liquid interfaces.
D. Numerical simulation
The flow field u(x, y) shown in Fig. 5C and used in Eq. 2 was numerically computed using the software Comsol Multiphysics in an ideal Plateau Bord section drawn with 3 tangential circles of radius r [38], under uniaxial and stationary conditions. As typical Reynolds number is low for foam drainage, the momentum equation is reduced to Stokes equation: r2u = dP/dz, where P is the
liq-uid pressure including gravity forces and z is the axis of the Plateau border. Partial mobility of the Plateau bor-der interfaces was consibor-dered by balancing the bulk vis-cous stress with the surface visvis-cous stress on the circular boundary: ~n· ~ru = Bo su, where s is the surface
Laplacian, Bo is the Boussinesq number: Bo = ⌘sr/⌘
and ⌘s is the shear surface viscosity. Bo = 1000 in the
present case, since the interfaces covered with protein surfactants are highly immobile. Finally, no-slip condi-tion was imposed at the corners of the Plateau border, at the junctions with the liquid films.
Once the velocity field had been calculated, numerical integration of Eq. 2, taking into account the experimen-tal determination of the PDF p(~r), was performed using the software Mathematica.
We wish to thank many researchers and engineers who helped in all the di↵erent aspects of this work: Marie-Alice Guedeau Boudeville (foam stabilty), Joshua Mc Graw and Hugo Fernandez (microfluidic devices), San-drine Bujaldon (cell culture). We thank Salima Rafa¨ı, Benjamin Bailleul, Olivier Vallon, Eric Lauga, Albane Thery, Christophe Eloy and Arnaud Saint-Jalmes for fruitful discussions. F.E. thanks the pionieer CNRS fund-ing PEPS 2015 ”Particules actives dans les Fluides”. F.E., D.Z. and L.S. thank the support from CNRS MITI 2019 ”Plastiques et micro-plastiques en milieux aqua-tiques”.
[1] Phil, B. R., ”Environmental Issues for the Twenty-First Century and Their Impact on Human Health”. Bentham Science Publishers (2012)
[2] G. Oursel, C. Garnier, I. Pairaud, D. Omanovic, G. Dur-rieu, A. D. Syakti, C. Le Poupon, B. Thouvenin & Y. Lucas, Estuarine Coastal and Shelf Science 138, 14-26 (2014).
[3] Kennish, M.J., ‘Practical handbook of estuarine and ma-rine pollution’. CRC Press, Boca Raton (2017).
[4] E. Berdalet, L. E. Fleming, R. Gowen, K. Davidson, P. Hess, L. C. Backer, S. K. Moore, P. Hoagland & H. Enevoldsen, Mar Biol Assoc U.K. 96, 61–91 (2016).
[5] Haward, M., Nature Communications 9, 667 (2018). [6] K. Schilling & M. Zessner, Water Research 45, 4355–
4366 (2011).
[7] I. R. Jenkinson, L. Seuront, H. Ding & F. Elias, Elem. Sci. Anth. 6, 26 (2018).
[8] C. Lancelot, The Science of the Total Environment 165 83-102 (1995).
[9] M. Batje & H. Michaelis, Marine Biology 93, 21-27 (1986).
[10] A. I. Fisenko, Water, Air, & Soil Pollution 156, 1 (2004) [11] I. Cantat, S. Cohen-Addad, F. Elias, F. Graner, R. H¨ohler, O. Pitois, F. Rouyer & A. Saint-Jalmes ‘Foams’,
Cox S. J. (ed.), Oxford University Press, New York (2013).
[12] B. Ha↵ner, B. Khidas & O. Pitois, J. Colloid Interface Sci. 458, 200–208 (2015).
[13] N. Louvet, R. Hohler & O. Pitois, Phys. Rev. E. 10, 1103 (2010).
[14] L. Seuront, D. Vincent & J. G. Mitchell, J. of Marine Systems 61, 118–133 (2006).
[15] C. Brennen & H. Winet., Ann. Rev. Fluid. Mech. 9, 339– 398 (1977).
[16] E. Lauga, & R. E. Goldstein, Phys. Today 65 (9), 30 (2012).
[17] M. Polin, I. Tuval, K. Drescher, J. P. Gollub & R. E. Goldstein, Science 325, 487–490 (2009).
[18] J. S. Guasto,K. A. Johnson & J. P. Gollub, Phys. Rev. Lett. 105, 168102 (2010).
[19] M. Garcia, S. Berti, P. Peyla & S. Rafai, Phys. Rev. E 83, 035301 (2011).
[20] J. Dervaux, M. Capellazzi Resta & P. Brunet, Nature Physics 13, 306–312 (2016).
[21] V. Kantsler, J. Dunkel, M. Polin, & R. E. Goldstein, PNAS 110, 1187–1192 (2013).
[22] T. Ostapenko, F. J. Schwarzendahl, T. J. B¨oddeker, C. T. Kreis, J. Cammann, M. G. Mazza & O. B¨aumchen, Phys. Rev. Lett. 120, 068002 (2018).
[23] S. Rafai, L. Jibuti & P. Pela, Phys. Rev. Lett. 104, 098102 (2010).
[24] A. Saint-Jalmes, Y. Zhang & D. Langevin, Eur. Phys. J.
E 15, 53 – 60 (2004)
[25] S. A. Koehler, S. Hilgenfeldt, E. R. Weeks & HA Stone, Phys. Re. E 66, 040601R (2002).
[26] See the demonstration in the Supporting Informations, part A.
[27] See the Supporting Informations, part C. [28] See the Supporting Informations, part B.
[29] F. Santamaria, F. De Lillo, M. Cencini & G. Bo↵eta, Phys. Fluids 26, 111901 (2014).
[30] J. O. Kessler, Nature 313, 218–220 (1985).
[31] W. M. Durham, J. O. Kessler & R. Stocker, Science 323, 1067 (2009).
[32] S. Massoz, V. Larosa, B. Horrion, R. F. Matagne, C. Remacle & P. Cardol, Journal of Biotechnology 215, 27– 34 (2015).
[33] R. Nosrati, P. J. Graham, Q. Liu & David Sinton, Sci-entific report 6, 26669 (2016).
[34] J. Abu-Ashour, D. M. Joy, H. Lee, H. R. Whiteley & S. Zelin, Water Air and Soil Pollution 75 141 – 158 (1994). [35] E. Forel, E. Rio, M. Schneider, S. Beguin, D. Weaire, S. Hutzler & W. Drenckhan, Soft Matter 12, 8025–8029 (2016).
[36] K. Feitosa, S. Marze, A. Saint-Jalmes & D. J. Durian, J. Phys.: Condens. Matter 17, 6301–6305 (2005).
[37] A. Saint-Jalmes, Soft Matter 2, 836–849 (2006). [38] F. Rouyer, E. Lorenceau & O. Pitois, Colloids and
Supporting Informations
Quentin Roveillo, Julien Dervaux, Yuxuan Wang, Florence Rouyer, Drazen Zanchi, Laurent Seuront and Florence Elias⇤
(Dated: January 20, 2020)
PACS numbers:
A. ESCAPING THE FOAM BY DIFFUSION AT LONG TIME
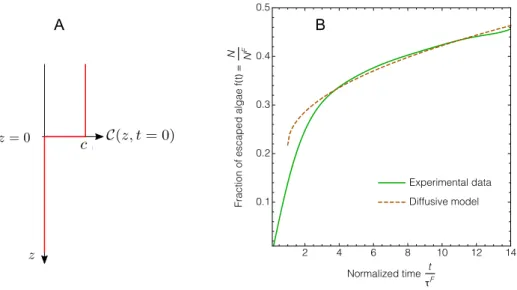
The long time regime of the escape dynamics of the Chlamydomonas reinhardtii (CR) cells out of the foam towards the underneath liquid corresponds to V > 0.5 in the Fig. 3 of the main article. In this regime, the fraction f(t) of escaped cells can be estimated, considering a purely di↵usive dynamics, using the following toy model. We consider that (i) the foam liquid fraction immediately above the liquid-foam interface is ⇤' 0.36 when V & 0.5 [1], and (ii)
the foam and the liquid underneath can be approximated as two homogeneous semi-infinite one-dimensional media. The model is 1D, with the foam located at z < 0, and the bulk liquid at z > 0 (see Fig. 1A). The initial concentration of CR cells in the liquid is:
C(z, t = 0) = ⇢
c if z < 0, 0 if z > 0
where c = NF/VF is the particle concentration in the liquid phase of the foam.
C(z, t) is solution of the di↵usion equation: @C @t De↵ @2 C @z2 = 0
where De↵ is the e↵ective di↵usion coefficient, arising macroscopically from the run-and-tumble-like motion of
indi-vidual CR cells [2–4]. Hence, taking into account the initial condition: C(z, t) = c2 1 erf ✓ z p 4De↵t ◆
where erf is the error function. The particle flux across the interface z = 0 is dN
dt = (z = 0) S j(z = 0, t)
where S is the cross-section area of the foam column, j(z, t) = De↵@C/@z is the particle stream and N is the number
of CR cells di↵using across the interface z = 0. The fraction of CR cells di↵using across the interface f (t) = N (t)/NF
is then, using c = NF/VF and VF = SZ 0: f (t) = ⇤ p De↵t Z 0p⇡ ,
Setting the initial time at t = ⌧F instead of t = 0, and taking into account the number f
adv(⌧F) of CR cells already
advected at t = ⌧F, we obtain: f (t)' fadv(⌧F) + ⇤ Z 0p⇡ q De↵(t ⌧F), (1)
The adjustment of the experimental data using Eq. 1, for t > ⌧F is shown in Fig. 1B, with two fitting parameters:
De↵ and fadv(⌧F). We obtained fadv(⌧F) = 0.22 and De↵ ' 4 ⇥ 10 8m2.s 1. The value of fadv(⌧F) sits within the
2
de l’expérience, on modélise la mousse comme un milieu infini de fraction de liquide homogène égale à la fraction de liquide à l’interface = 0.362.
3.4.1 Résolution de l’équation de diffusion
Nous utilisons l’équation de diffusion pour modéliser le comportement diffusif dû à la nage des algues dans le liquide de la mousse et l’évolution de la concentration en algues :
C(z, t)
t D
2C(z, t)
z2 = 0 (3.17)
Pour une condition initiale C(z, 0) = f(z), on peut calculer C(z, t) à partir de CG(z, t)
la fonction de Green de l’équation de diffusion et f(z).
C(z, t) = + CG(z y, t)f(y)dy
Nous utilisons la fonction de Green de l’équation de diffusion CG(z, t), et f(y) la condition
initiale suivante représentée en figure3.12:
C(z, 0) = C00 si z < 0sinon
Figure 3.12 – En rouge la courbe C(z, t = 0) représente la concentration en algues dans le liquide de la mousse à l’instant initial.
Au final on obtient l’expression :
C(z, t) =C20 1 erf z 4Dt (3.18) Avec : erf(z) = 2 z 0 e X2dX (3.19)
2. Nous cherchons à comprendre la dynamique à t > où la fraction de liquide à l’interface mousse-liquide vaut . 63 c0 C(z, t = 0) 2 4 6 8 10 12 14 0.1 0.2 0.3 0.4 0.5 Normalized time t τF Fractio n o f escape d alga e f( t) = N FN Experimental data Diffusive model A B
FIG. 1: Di↵usive regime at long times. (A) Notations for the di↵usive toy model; (B) fraction of the escaped motile microalgae as a function of the normalized time t/⌧F, and fit of the data at long times (t > ⌧F) using Eq. 1.
interval [0.05 – 0.28] measurable on the Fig. 3 of the main article forV = 0.5. The value of De↵ is fairly close from the
value measured using experiments based on the macroscopic di↵usion of a concentration front of a suspension of CR cells [2, 3], although slightly smaller. This is however not surprising since measurements obtained from the analysis of individual cell trajectories in confined geometry have shown that the values of De↵ may be one order of magnitude
smaller than in non-confined geometry [4]. In our case, where CR cells di↵use from a confined situation within the foam channels towards an un-confined liquid medium, an intermediate value of De↵ is thus expected.
As a conclusion, the evolution of the fraction of CR cells escaping the foam at long time is compatible with an e↵ective di↵usive dynamics of the microswimmers.
B. FLOW DYNAMICS AND LOCAL STRUCTURE OF FOAM
In this section, we link the macroscopic measurements of the CR cell advection in the foam and the microscopic observation of the swimming motion of the motile cells in microfluidic chambers.
a. Determination of the liquid flow velocity in the foam channels. The liquid foam internal structure consists in a network of interconnected liquid channels, called Plateau borders (see Fig. 2.) During the foam free drainage, liquid flows out of the foam within the Plateau borders. The initial mean flow velocity U =hui(t = 0) in the Plateau borders is determined by the measurement of both the volume V (t) of liquid drained out of the foam, and of the initial liquid volume fraction 0= (t = 0) in the foam:
U = 1
0S
dV
dt t=0. (2)
b. Determination of the inscribed channel diameter dc. The liquid fraction is geometrically linked to the average
width dc and lengthh`i of the Plateau borders in a foam [1]:
= 0.171 ✓ r h`i ◆2 + 0.20 ✓ r h`i ◆3 = 1.78 ✓d c h`i ◆2 + 6.71 ✓d c h`i ◆3 , (3)
where r and dc are defined in Fig. 2C. Hence, the initial value of dc is determined from the measurements of 0
r dc
film
A
B
C
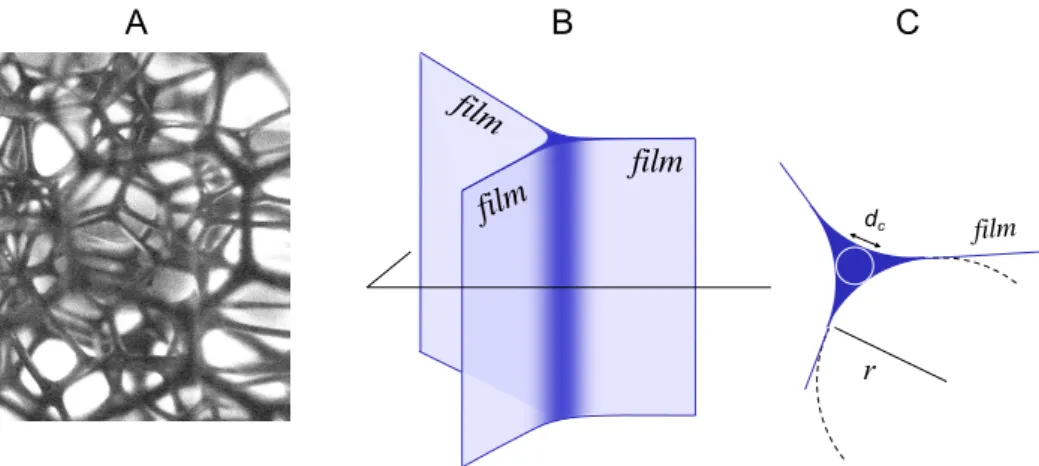
FIG. 2: Local structure of the foam. (A) Image of the internal foam liquid skeleton made of an interconnected network of liquid channels called Plateau borders (in black); (B) structure of a single Plateau border channel, at the intersection between three soap films; (C) Cross-section of a Plateau border, made of three concave edges having a homogeneous curvature r; the diameter dcof the inscribed circle is dc= 0.31r.
c. Liquid flow dynamics within the foam Assuming a Poiseuille flow with immobile interfaces within the Plateau borders, the average flow velocity is given by [1]
U = Cc ⇢g
⌘ 0h`i
2
where Cc' 6.3 10 3is a geometric coefficient. Using Eq. 3 and neglecting the third order term in (dc/h`i), one gets
U = d2
c, (4)
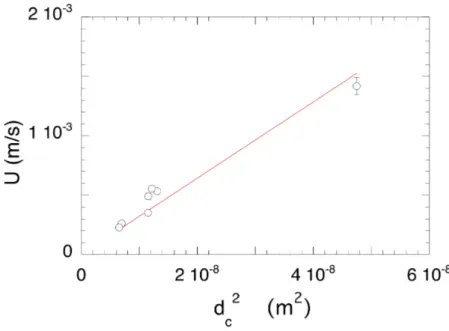
where = 1.78 Cc⇢g/⌘ is determined by the best fit of the data shown in Fig. 3: = (32± 2)103 m 1.s 1. This
value corresponds to a viscosity ⌘' 4 Pa.s, i.e. 4 times larger than the viscosity of water. Although the amount of egg white in the solution is tiny, the formation of aggregates is responsible for the increase of the e↵ective viscosity even at low concentrations [5].
d. From microscopic to macroscopic The experimental determination of the parameter is used in order to infer the flow velocity U that would correspond to the width dcof the microfluidic chambers. In microfluidic chambers, we
emphasize that the microswimmers have a larger probability density in the corners. As a consequence, they would stay trapped in the corners of the foam Plateau borders only if the time to escape the Plateau border by advection is smaller than the time to reach the corners. We define the escape time numberT as the ratio between the typical swimming time ⌧swim= dc/v towards the corner and the typical advection time ⌧c=h`i/U out of the Plateau border
channel. T =⌧swim⌧ c = dc v U h`i. (5)
Using Eq. 3 and neglecting the third order term in (dc/h`i), we obtain:
T ' 0.75p 0
U v, which was used to determineT in Fig. 4B of the article.
Eqs. 4 and 5 give the relation between the escape time number T and the confinement parameter = dp/dc that
is the ratio between the particle diameter and the channel diameter: T ' 0.75p 0
v
1
2.
FIG. 3: Initial average velocity in the foam liquid channels U versus d2
c, respectively determined via the measurements of V (t), 0 andh`i, and using Eqs 2 and 3. The red line represents the best fit of the data by Eq. 4.
C. RETARDED ADVECTION PARAMETER ↵: MACROSCOPIC AND MICROSCOPIC DEFINITIONS
The coefficient ↵, defined in Eq. (2) of the main article as the ratio between the initial rate df /dt of the fraction of cells escaping the foam and the initial rate dV/dt of normalized volume drained out of the foam, is a proxy of the advection dynamics of CR cells at the early stages of the free drainage experiment:
↵ = 1 c
dN/dt
dV /dt t=0 (6)
where c = NF/VF is the cell concentration on the bulk liquid. In this section, we link this definition based on macroscopically-defined variables to the microscopic parameters defined at the scale of a single Plateau border.
The particle flux through a Plateau border section SPB is
= c SPB
Z
SPB
u(~r) p(~r) dS.
Let u(~r) be the velocity field within a single vertical Plateau border channel. If the channel is tilted at an angle ✓ to the vertical, the e↵ective gravity decreases and the flow velocity is u✓= u(~r) cos ✓. The vertical projection of the
flux of particles released from a Plateau border tilted from an angle ✓ is then ✓ = cos2✓. For n Plateau border
randomly orientated, the total flux of particles is dN/dt = nh ✓i, i.e:
dN dt = n 3c SPB Z SPB u(~r)p(~r) dS (7)
The liquid flow rate through a vertical Plateau border is dV
dt = Z
SPB
u(~r) dS For n Plateau borders randomly distributed:
dV dt = n 3 Z SPB u(~r) dS (8)
According to Eq.(6), (7) and (8): ↵ = V F NF c SPB R SPBu(~r) p(~r) dS R SPBu(~r) dS . Hence: ↵ = SPB R SPBu(~r) p(~r) dS R SPBu(~r) dS . (9)
As a conclusion, the parameter ↵, macroscopically defined by Eq. 6, can be measured using the parameters u(~r) and p(~r) defined at the scale of the single Plateau border channel, using Eq. 9.
[1] I. Cantat, S. Cohen-Addad, F. Elias, F. Graner, R. H¨ohler, O. Pitois, F. Rouyer & A. Saint-Jalmes ‘Foams’, Cox S. J. (ed.), Oxford University Press, New York (2013).
[2] J. Dervaux, M. Capellazzi Resta & P. Brunet, Nature Physics 13, 306–312 (2016).
[3] M. Polin, I. Tuval, K. Drescher, J. P. Gollub & R. E. Goldstein, Science 325, 487–490 (2009). [4] S. Rafai, L. Jibuti & P. Pela, Phys. Rev. Lett. 104, 098102 (2010).