HAL Id: halshs-02947084
https://halshs.archives-ouvertes.fr/halshs-02947084
Submitted on 25 Nov 2020HAL is a multi-disciplinary open access archive for the deposit and dissemination of sci-entific research documents, whether they are pub-lished or not. The documents may come from teaching and research institutions in France or abroad, or from public or private research centers.
L’archive ouverte pluridisciplinaire HAL, est destinée au dépôt et à la diffusion de documents scientifiques de niveau recherche, publiés ou non, émanant des établissements d’enseignement et de recherche français ou étrangers, des laboratoires publics ou privés.
The strategy matters: Bounded and unbounded number
line estimation in secondary school children
Stefanie Jung, Stephanie Roesch, Elise Klein, Tanja Dackermann, Juergen
Heller, Korbinian Moeller
To cite this version:
Stefanie Jung, Stephanie Roesch, Elise Klein, Tanja Dackermann, Juergen Heller, et al.. The strategy matters: Bounded and unbounded number line estimation in secondary school children. Cognitive Development, Elsevier, 2020, 53, pp.100839. �10.1016/j.cogdev.2019.100839�. �halshs-02947084�
Title:
The strategy matters:
Bounded and unbounded number line estimation in secondary school children Stefanie Jung1,2, Stephanie Roesch1, Elise Klein1,2, Tanja Dackermann1,
Juergen Heller1, & Korbinian Moeller1,2,3 1Leibniz-Institut für Wissensmedien, Schleichstraße 6, 72076 Tuebingen, Germany 2Eberhard Karls University of Tuebingen, Germany
Schleichstraße 4, 72076 Tuebingen, Germany 3LEAD Graduate School and Research Network,
Eberhard Karls University, Tuebingen
Corresponding author: Dipl. Log. Stefanie Jung
Leibniz-Institut für Wissensmedien
Schleichstraße 6, 72076 Tuebingen, Germany phone: +49 7071 979-370
email: s.jung@iwm-tuebingen.de
Word count: 8086 Ti le Page ( i h A hor De ails)
ACKNOWLEDGEMENTS
Stefanie Jung was supported by the first Leibniz-WissenschaftsCampus Tuebingen Bild ng nd Informa ions m el en as well as by the German Research Foundation (DFG) providing funding to Elise Klein (KL 2788/2-1). Elise Klein was supported by the Margarete von-Wrangell Fellowship (European Social Fund and the Ministry of Science, Research and the Arts Baden-Württemberg). We thank the participating children, their parents and institutions who made this work possible. We also thank all research assistants for their assistance with data collection.
ABSTRACT:
Changes in number line estimation (NLE) performance are frequently used as an indicator for the development of the number magnitude representation. For this purpose, two different task versions have been applied: a traditional bounded and a relatively new unbounded NLE task. Previous studies mainly assessed primary school children or adults showing that these tasks differ in terms of i) estimation accuracy and solution strategies employed as well as ii) with respect to their relation to other basic numerical/arithmetic skills. So far, data from secondary school children are scarce for bounded NLE, and even no data is available for unbounded NLE. Thus, we assessed bounded and unbounded NLE in grade levels 5 to 7 to evaluate a) developmental as well as strategic influences, and b) the relation of bounded and unbounded NLE performance with basic arithmetic skills. Our results show that children employed the use of different solution strategies for bounded (i.e., proportion-judgement) and unbounded (i.e., magnitude-estimation based) NLE. Moreover, only for bounded NLE estimation accuracy increased with age. Furthermore, estimation performance for bounded but not unbounded NLE was strongly associated with basic arithmetic (addition, subtraction, multiplication, and division). Our findings indicate that the differential results for bounded and unbounded NLE obtained in primary school children seem to generalize to older secondary school children. Presented results substantially contribute to the knowledge about the (consecutive) development of skills pertaining to bounded and unbounded number line estimation.
Man crip ( i ho A hor De ail )
1 2 3 4 5 6 7 8 9 10 11 12 13 14 15 16 17 18 19 20 21 22 23 24 25 26 27 28 29 30 31 32 33 34 35 36 37 38 39 40 41 42 43 44 45 46 47 48 49 50 51 52 53 54 55 56 57 58 59 60 61 62
INTRODUCTION:
Number line estimation (NLE) refers to the ability to locate numbers on a physical line according to their magnitude. NLE performance is a widely used indicator of basic numerical skills in studies evaluating the development of numerical skills through childhood. Traditionally, NLE refers to estimation performance on a bounded number line estimation task. In bounded number line estimation, start and endpoint of a specific number range (e.g., 0 to 100) is typically specified by a minimum value indicated at the left end of the number line and a maximum value at the right end of the line. Participants are required to estimate the spatial position of a given number (e.g., Siegler and Opfer, 2003). Compared to that, unbounded NLE performance has been assessed less frequently, but more and more recently (e.g., Cohen & Blanc-Goldhammer, 2011; Link, Huber, Nuerk, & Moeller, 2014; Reinert, Hartmann, Huber, & Moeller, 2019). In the unbounded NLE task, the number line has no labelled endpoint, but a single unit distance (e.g., 0-1) in addition to the start point. Starting from this unit distance, target numbers have to be located upon the given line.
Bounded and unbounded NLE tasks have been used as indicators to draw conclusions from task performance onto the underlying magnitude representation and its development (e.g., for bounded NLE: Berteletti, Lucangeli, Piazza, Dehaene, & Zorzi, 2010; Booth & Siegler, 2006, 2008; Ebersbach, Luwel, & Verschaffel, 2015; Siegler & Booth, 2004; Siegler & Opfer, 2003; Thompson & Opfer, 2010; Young & Booth, 2015; e.g., for unbounded NLE: Cohen & Blanc-Goldhammer, 2011; Link, Huber, et al., 2014). However, the two tasks were found to differ in terms of i) the solution strategies employed (e.g., considering the usage of reference points [cf. Cohen & Blanc-Goldhammer, 2011; Cohen & Sarnecka, 2014; Link, Huber, et al., 2014]) and ii) their association with other basic numerical as well as arithmetic skills (for a meta-analysis see 1 2 3 4 5 6 7 8 9 10 11 12 13 14 15 16 17 18 19 20 21 22 23 24 25 26 27 28 29 30 31 32 33 34 35 36 37 38 39 40 41 42 43 44 45 46 47 48 49 50 51 52 53 54 55 56 57 58 59 60 61 62
Schneider et al., 2018). More importantly, despite numerous studies relating primarily bounded NLE to other basic numerical and arithmetic skills, the vast majority of these studies focused either on young children from kindergarten to the end of primary school (e.g., Link, Nuerk, et al., 2014; Moeller et al., 2009; Schneider et al., 2017; Zhu et al., 2017) or adults (Reinert, Huber, Nuerk, & Moeller, 2017, 2015). So far, the age range in-between (i.e., secondary school children) has largely been neglected for bounded NLE. For unbounded NLE, there is still no empirical data at all from secondary school children. Crucially, consideration of relatively narrow age ranges strongly limits general statements on the development of number representation. In the current study, we aimed at addressing this gap by investigating bounded and unbounded NLE in secondary school children1 (i.e., 5th to 7th graders) to evaluate both a) developmental changes in estimation accuracy and strategy use and b) the relation of bounded and unbounded number line estimation with basic arithmetic.
Estimation accuracy and strategy use
Regarding bounded NLE, there are different views on the developmental changes of NLE performance and its relationship to the underlying representation of number magnitude. Generally, all views are based on the observation that children of different age groups perform differently in the same number range: Younger children (i.e., preschoolers and first-graders) were observed to systematically overestimate the spatial position of small numbers (i.e., placing 9 at about the location where 40 would go on a 0-100 scale; Moeller et al., 2009). In turn, they localised larger numbers in a compressed way towards the upper bound of the scale (e.g., Siegler & Booth, 2004; Siegler & Opfer, 2003). Older children (e.g., second-graders), in contrast,
1 In the German school system, majority of secondary schools begins with the 5th grade. 1 2 3 4 5 6 7 8 9 10 11 12 13 14 15 16 17 18 19 20 21 22 23 24 25 26 27 28 29 30 31 32 33 34 35 36 37 38 39 40 41 42 43 44 45 46 47 48 49 50 51 52 53 54 55 56 57 58 59 60 61 62
did not show such a pattern and were observed to perform more accurately in the same number range (e.g., Siegler & Booth, 2004).
These estimation patterns have been discussed in various theoretical accounts (see Dackermann et al., 2015, for a recent review). Most importantly, two competing accounts can be differentiated: the log-to-linear shift account (e.g., Booth & Siegler, 2006; Siegler & Booth, 2004; Siegler & Opfer, 2003) and the proportion-judgement account (e.g., Barth & Paladino, 2011; Slusser, Santiago, & Barth, 2013).
The log-to-linear shift account proposes a representational change from an initially logarithmic layout, as indicated by overestimation of smaller numbers, to a more linear layout of estimation patterns with increasing age and experience. Accordingly, a logarithmic function was found to fit the observed estimation pattern best in younger children whereas a linear function reflected the observed estimation patterns best in older children and adults (Booth & Siegler, 2006, 2008; Siegler & Booth, 2004; Siegler & Opfer, 2003). The account assumes estimation patterns to directly reflect the underlying magnitude representation (Siegler & Opfer, 2003). However, the interpretation of a direct assessment of the magnitude representation is questioned in alternative accounts that emphasize the importance of other numerical processes in addition to the pure magnitude estimation. Ebersbach, Luwel, Frick, Onghena, and Verschaffel (2008), for instance, mentioned the increasing familiarity of children with numbers (but see Thompson & Opfer, 2010 for results contradicting the assumption that children's familiarity with numbers predicts individual s mental representation of the number line), whereas Moeller et al., 2009 suggested to consider the understanding of the place-value system, which also affects NLE performance. 1 2 3 4 5 6 7 8 9 10 11 12 13 14 15 16 17 18 19 20 21 22 23 24 25 26 27 28 29 30 31 32 33 34 35 36 37 38 39 40 41 42 43 44 45 46 47 48 49 50 51 52 53 54 55 56 57 58 59 60 61 62
The most prominent alternative account, the proportion-judgement account, postulates that potential reference points (i.e., start and end point of the respective scale, but also quartiles and midpoint, also referred to as [subjective] landmarks) are considered for estimation (e.g., Barth & Paladino, 2011; Siegler & Opfer, 2003; Slusser et al., 2013). The use of reference points is supposed to increase with age and to enhance estimation accuracy (e.g., Slusser et al., 2013; see also Schneider et al., 2008, for eye-fixation data,). Evidence for the account comes from children s estimation patterns: while target estimates seem to follow a linear layout, estimation errors for target numbers were more accurate and varied less at and/or around reference points, which results in a typical M-shaped pattern in contour analyses (Ashcraft & Moore, 2012; Cohen & Blanc-Goldhammer, 2011; Link, Huber, et al., 2014). Additionally, use of reference points and thus proportion-judgement strategies were found to be indexed by (one- or two-) cyclic power models (Barth & Paladino, 2011; Hollands & Dyre, 2000). Contrary, fit of cyclic power models was also associated with feedback on the mid-point of the number line (i.e., 50 by a number line length of 100) provided to participants (Opfer, Siegler, & Young, 2011; Opfer, Thompson, & Kim, 2016).
In sum, all accounts share the idea that several different development-related cognitive skills and solution strategies are involved in bounded NLE (cf. Barth & Paladino, 2011; Cohen & Sarnecka, 2014; Ebersbach et al., 2008; Moeller et al., 2009; Siegler & Booth, 2004; Siegler & Opfer, 2003; Slusser et al., 2013). This is reflected by an ongoing debate on the suitability of the bounded NLE task as a valid measure of children s number magnitude representation (e.g., Cohen & Sarnecka, 2014; Slusser & Barth, 2017), because processes of magnitude estimation seem to be masked by other cognitive processes and solution strategies involved in performing the task. 1 2 3 4 5 6 7 8 9 10 11 12 13 14 15 16 17 18 19 20 21 22 23 24 25 26 27 28 29 30 31 32 33 34 35 36 37 38 39 40 41 42 43 44 45 46 47 48 49 50 51 52 53 54 55 56 57 58 59 60 61 62
In contrast, unbounded NLE is argued to reflect a purer measure of number magnitude representation (e.g., Cohen & Blanc-Goldhammer, 2011; Link, Huber, et al., 2014; see also Reinert, Huber, Nuerk, & Moeller, 2015 for eye-tracking evidence supporting this argument) and seems to be less influenced by age as no development-related performance changes have been found (Cohen & Sarnecka, 2014; Link, Huber, et al., 2014). This assumption is based on empirical observations of children of different age levels within primary school and adults. Error variability in unbounded NLE was found to increase linearly with number magnitude (Cohen & Blanc-Goldhammer, 2011; Link, Huber, et al., 2014). This finding was interpreted to reflect the strategic procedure of estimating a multiple of the given unit distance (i.e., dead-reckoning strategy as suggested by Cohen & Blanc-Goldhammer, 2011 or a counting-like strategy as recommended by Schneider et al., 2018), which leads to an accumulation of estimation errors (Reinert et al., 2015). As such, it was argued that unbounded NLE reflects a more direct type of number magnitude estimation (Link, Huber, et al., 2014, Reinert et al., 2019; but see Kim & Opfer, 2017). Cohen & Blanc-Goldhammer (2011) showed first evidence that dead-reckoning strategy, for instance, is indicated by a repetitive scalloped estimation pattern.
Number line estimation and basic arithmetic
Numerous studies have examined associations of bounded and/or unbounded NLE and basic arithmetic. These studies have shown significant correlations, but only for the bounded version of the task (e.g., Link, Huber, et al., 2014; Schneider et al., 2018). Bounded NLE performance significantly predicts mathematical achievement concurrently but also longitudinally (e.g., Booth & Siegler, 2008; Schneider, Grabner, & Paetsch, 2009; but see Simms et al., 2016, for methodological aspects) and correlates with counting, basic arithmetic and algebra as well as with school achievement and grades (Schneider et al., 2018, for a meta-analysis) from 1 2 3 4 5 6 7 8 9 10 11 12 13 14 15 16 17 18 19 20 21 22 23 24 25 26 27 28 29 30 31 32 33 34 35 36 37 38 39 40 41 42 43 44 45 46 47 48 49 50 51 52 53 54 55 56 57 58 59 60 61 62
kindergarten to primary school (Booth & Siegler, 2006). In this vein, Friso-van den Bos et al. (2015) argued that these associations may occur due to a mutual relation between both basic arithmetic and NLE skills in numerical development: With increasing practice in solving mathematical problems in childhood, the representation of number magnitude becomes more accurate, which is in turn reflected in better NLE performance.
Comparing data from both versions of the NLE task, Cohen and Sarnecka (Cohen & Sarnecka, 2014) argued that bounded and unbounded NLE should to be associated with different basic arithmetic skills. The authors found that young children (i.e., preschoolers) underperformed in bounded NLE, but were able to cope with the unbounded version approximately as well as older children. Cohen and Sarnecka (2014) concluded that unbounded NLE may be less demanding, probably because task solution requires less advanced basic arithmetic skills (i.e., addition and multiplication) for using dead-reckoning strategies as compared to bounded NLE (i.e., subtraction and division) for applying proportion judgement strategies.
Contrasting bounded and unbounded NLE performance in a sample of fourth-graders, the study of Link, Nuerk and Moeller (2014) partially confirmed these theoretical assumptions. The authors argued that bounded NLE may require a division of the number line to guide the application of proportion-based strategies by reference points. Subsequently, starting from a reference point, a leftward (reflecting subtraction) or rightward shift on the number line (reflecting addition) might be necessary to locate the respective target number correctly upon the line. This adjustment, however, is not appropriate in unbounded NLE. In this vein, Link and colleagues (2014) did not observe significant correlations between basic arithmetic and unbounded NLE in their sample of fourth-graders (but see Reinert et al., 2015 for different results regarding multiplication). Despite an increasing number of studies directly comparing 1 2 3 4 5 6 7 8 9 10 11 12 13 14 15 16 17 18 19 20 21 22 23 24 25 26 27 28 29 30 31 32 33 34 35 36 37 38 39 40 41 42 43 44 45 46 47 48 49 50 51 52 53 54 55 56 57 58 59 60 61 62
bounded and unbounded NLE, it is not yet clear how both tasks differ in their associations with various basic arithmetic operations.
However, it is important that the results and assumptions described above are again mainly based on observations of children from kindergarten to the end of primary school and of adults, whereas the age group in-between, i.e., secondary school children, has so far largely been neglected. Crucially, the few studies investigating the relationship between NLE and basic arithmetic in typically developing secondary school children mainly assessed NLE of fractions and related estimation performance to either a standardised mathematical school achievement test (Siegler & Pyke, 2013) or to school grades (Schneider et al., 2009). Only few studies focused on whole numbers. Some of these studies included rather small sample sizes (32 sixth graders in Siegler & Opfer, 2003 and 24 sixth graders Thompson & Opfer, 2010) or did not use standard NLE tasks by evaluating NLE on both negative (-10,000-0) and positive numbers (-1,000-1,000) in sixth and seventh graders (Young & Booth, 2015).
On a neuro-functional level, Berteletti et al. (2015) provided first evidence that bounded NLE performance correlates with activation of brain areas associated with number magnitude processing (such as the intraparietal sulcus during single digit subtraction). Nevertheless, empirical data from secondary school children on unbounded NLE are still missing entirely. Moreover, so far, there is no comparison of bounded and unbounded NLE in secondary school children, which also compares the association of bounded and unbounded NLE performance and basic arithmetic in three consecutive age levels.
The current study
The current study focused on bounded and unbounded NLE in secondary school children from grade 5 to 7. In particular, we investigated whether bounded NLE performance changes 1 2 3 4 5 6 7 8 9 10 11 12 13 14 15 16 17 18 19 20 21 22 23 24 25 26 27 28 29 30 31 32 33 34 35 36 37 38 39 40 41 42 43 44 45 46 47 48 49 50 51 52 53 54 55 56 57 58 59 60 61 62
between these age groups and aimed at providing first empirical data on how secondary school children perform in unbounded NLE. For bounded NLE, previous studies assessing number line estimation beyond primary school used number ranges between 0-1,000 and 0-100,000 (Link, Huber, et al., 2014; Siegler & Opfer, 2003; Thompson & Opfer, 2010; Young & Booth for negative numbers, 2015). For unbounded NLE, mainly smaller number ranges up to 20 (Cohen & Blanc-Goldhammer, 2011; Cohen & Sarnecka, 2014), 29 (Link, Nuerk, et al., 2014; Link, Huber, et al., 2014), and 50 (Reinert et al., 2015a; Reinert et al., 2015b, Reinert et al., 2019) were used. Only Kim and Opfer (2017) used number ranges of 0-30/100/1,000 in unbounded NLE. However, Cohen, Blanc-Goldhammer, and Quinlan (2018) pointed to the actual task design used by Kim and Opfer (2017): in unbounded NLE, children and adults typically overestimate target numbers (see also Cohen and Sarnecka, 2014). Hence, the physical number line needs to leave enough room beyond the largest target number so that participants can demonstrate not only this bias but also scalar variance in their estimations. This issue demonstrates that it is impossible to accurately run an unbounded number-line task with large numbers (cf. Kim and Opfer, 2017).
However, in studies directly comparing bounded and unbounded NLE performance either equal number ranges (Reinert, Huber, Nuerk, & Moeller, 2015, Cohen & Blanc-Goldhammer, 2011; Cohen & Sarnecka, 2014) or different number ranges were applied in both tasks (e.g., from 0-100, 0-1,000, and 0-10,000 in bounded NLE and 0-25 in unbounded NLE; Link, Huber, Nuerk, & Moeller, 2014, Reinert et al., 2018, or 0-49 in unbounded NLE; Reinert et al., 2019). Crucially, Link and colleagues (2014) provided evidence that participants performed less accurate in unbounded NLE even though the number range was very small in the unbounded (i.e., 0-25) as compared to the number range in the bounded NLE task (i.e., 0-10,000). Considering above described problems with creating an unbounded number line for large 1 2 3 4 5 6 7 8 9 10 11 12 13 14 15 16 17 18 19 20 21 22 23 24 25 26 27 28 29 30 31 32 33 34 35 36 37 38 39 40 41 42 43 44 45 46 47 48 49 50 51 52 53 54 55 56 57 58 59 60 61 62
target values and to tie on previous results, we used the same number ranges as in Link et al., (2014) study. Importantly, and different from bounded number line estimation, there do not seem to be substantial influences of age in unbounded NLE (e.g., Link et al., 2014). In fact, estimation patterns for all age groups were characterised by estimation errors increasing in size and in variability with increasing magnitude of the respective target numbers.
Furthermore, to address the ongoing debate on which version of the NLE task bounded or unbounded is associated with which basic arithmetic operation, the relation of both bounded and unbounded NLE with the four basic arithmetic operations (i.e. addition, subtraction, multiplication, and division) was examined. Based on the findings from previous studies outlined above, our hypotheses were as follows:
First, we expected to find significant differences between bounded and unbounded NLE (cf. Cohen & Sarnecka, 2014). In particular, mean estimation errors were assumed to be higher in the unbounded task version (Link, Huber, et al., 2014). Second, regarding developmental changes, we expected a decline of estimation errors with age for bounded NLE, but no significant age-related differences in estimation errors for unbounded NLE (Cohen & Blanc-Goldhammer, 2011; Link, Huber, et al., 2014). Third, we expected children to use proportion-judgement strategies in bounded but not in unbounded NLE and thus, only bounded NLE errors to follow a characteristic M-shaped distribution pattern (cf. Ashcraft & Moore, 2012). The use of potential reference points in bounded NLE should be predominantly reflected by cyclic models that best fit the estimation pattern of children. Finally, based on the theoretical considerations of Cohen and Sarnecka (2014) and the findings of Link et al. (2014), we assumed both tasks to be associated with different basic arithmetic skills. In particular, we supposed NLE performance in the bounded task to be associated with subtraction, addition, and division. 1 2 3 4 5 6 7 8 9 10 11 12 13 14 15 16 17 18 19 20 21 22 23 24 25 26 27 28 29 30 31 32 33 34 35 36 37 38 39 40 41 42 43 44 45 46 47 48 49 50 51 52 53 54 55 56 57 58 59 60 61 62
However, we did not formulate a well-directed hypothesis for the association of unbounded NLE performance and basic arithmetic. Results of the present study may help to further clarify these relations. 1 2 3 4 5 6 7 8 9 10 11 12 13 14 15 16 17 18 19 20 21 22 23 24 25 26 27 28 29 30 31 32 33 34 35 36 37 38 39 40 41 42 43 44 45 46 47 48 49 50 51 52 53 54 55 56 57 58 59 60 61 62
METHODS: Participants:
A total of 989 children (463 girls) from 12 German secondary schools participated in this study: children were recruited from 17 5th grade classes (n=342, mean age: 10.58, SD=8.24 months), 21 6th grade classes (n=383, mean age: 11.67, SD=8.48 months) and 15 7th grade classes (n=264, mean age: 12.57, SD=8.19 months). Cross-sectional data was collected at two different survey points (SP1 and SP2). Children were divided into two samples and completed a computerised assessment of either a bounded (Sample 1 assessed at SP1 and SP2: n=700 [SP1: n=389 and SP2: n=311] mean age: 11.53, SD=12.47 months) or unbounded (Sample 2 assessed only at SP2: n=289 mean age: 11.56, SD=12.93 months) NLE task. Each child was examined once. Furthermore, children s basic arithmetic as well as their spelling skills were assessed as control variables.
Data from 195 children who did not complete either the spelling or the arithmetic tasks (n=94) or had more than 33% missing data (n= 101) in the NLE tasks after outlier correction were not considered for further analyses. Finally, complete data of 573 children for the bounded NLE task and 221 children for the unbounded NLE task entered the analyses.
Written informed consent was obtained from parents prior to the study besides children s verbal assent before actual testing. The study was approved by the local ethics committee (LEK 2014/19) as well as by the school authority.
1 2 3 4 5 6 7 8 9 10 11 12 13 14 15 16 17 18 19 20 21 22 23 24 25 26 27 28 29 30 31 32 33 34 35 36 37 38 39 40 41 42 43 44 45 46 47 48 49 50 51 52 53 54 55 56 57 58 59 60 61 62
Tasks and procedure:
Data collection took place during regular classes and lasted about 45 minutes. Arithmetic skills were assessed separately for each basic arithmetic operation (i.e., addition, subtraction, multiplication, division) together with either the bounded or unbounded NLE task. Spelling was examined with respect to most relevant German spelling rules (i.e., capitalization, consonant doubling, lengthening, rule words) and served as control variable. Children completed the arithmetic and spelling tasks in counterbalanced order across participants. All stimuli were presented on a 15.6-inch Lenovo ThinkPad T530 laptop display with a resolution of 1024 x 768 pixels at normal viewing distance and with target items in black against a white background. Task relevant laptop functions (e.g., capitalization, deletion of incorrect entries) were introduced immediately before the assessment, followed by at least one practice trial for each task. Instructions were presented both visually and auditory. This procedure ensured that all children had the same prerequisites to cope with the tasks in the computerised assessment. Basic arithmetic
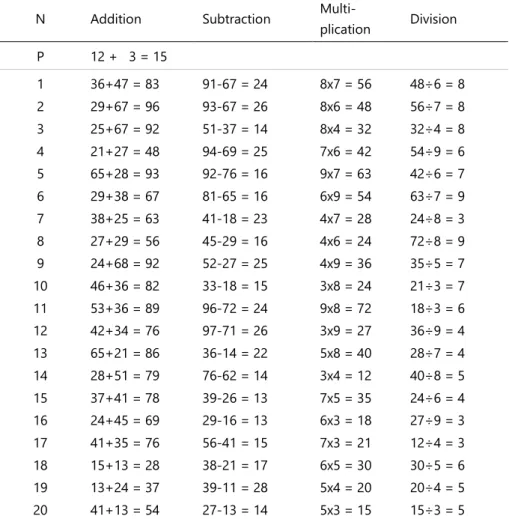
Children s basic arithmetic skills in addition, subtraction, multiplication, and division were assessed following this particular order using a production paradigm. Children were asked to type in the correct result of a presented problem. Overall, 20 problems were presented for each operation. Stimuli were selected as follows: in addition (e.g., 36+47=____) and subtraction (e.g., 91-67=____), problems were controlled for problem size for each operation. In particular, in addition, four problems each had a result of the 6th to the 9th decade, two problems from the 5th decade and one problem each from the 2nd to the 4th decade. Half of the problems required a carry operation. In subtraction, ten problems with a result in the range 10-19 were chosen. The results of the other ten problems fell in the range from 20 to 29. Half of the 1 2 3 4 5 6 7 8 9 10 11 12 13 14 15 16 17 18 19 20 21 22 23 24 25 26 27 28 29 30 31 32 33 34 35 36 37 38 39 40 41 42 43 44 45 46 47 48 49 50 51 52 53 54 55 56 57 58 59 60 61 62
problems required a borrowing operation. In multiplication (e.g., 8*7=____), three problems each were picked from the tables of 3 to 9 as well as two problems from the table of 5. Neither ties nor problems in reversed order were presented. For division (e.g., 56/7=____), multiplication problems were reversed. Table A1.1 in Appendix A1 provides an overview of all arithmetic problems.
Number line estimation
Children completed either a bounded (range 0-10,000) or an unbounded (range 0-29) version of the NLE task. In the bounded and unbounded NLE task, target items were presented on the left end above the lower bound of the number line. The physical length of the number line was 716 pixels. Children were required to mark the correct position of a given number by means of the mouse cursor. Number line and target number remained on the screen until a response was given by a mouse click. Both NLE tasks were preceded by a practice trial (5,000 for the bounded NLE task and 1 for the unbounded NLE task2) to ensure that the children understood the task and to familiarize the children with the use of the computer mouse. In the practice trial no feedback was provided on the children s estimation accuracy. In the bounded version (range 0-10,000), a total of 24 target numbers were presented in randomised order (i.e., 74, 135, 1097, 1203, 2137, 2315, 3408, 3476, 4542, 4712, 4798, 4957, 5103, 5239, 5298, 5372, 6594, 6781, 7685, 7812, 8793, 8946, 9786, and 9851). In the unbounded version (range 0-29), participants had to
2 Please note that the choice of practice items can be discussed: for bounded NLE, there is an ongoing debate on how anchoring and targeted practice on the midpoint of the number line is associated with increased estimation accuracy (Slusser, Santiago, & Barth, 2013; Opfer, Thompson, & Kim, 2016). However, Dackermann and colleagues (2018) did not observe a reliable effect of explicit midpoint instruction. In the present study, children located the number serving as practice item (i.e., 5000) on the number line but did not receive any feedback as to whether their estimate was correct or that the given number represented the mid-point of the number line. For unbounded NLE, we used the smallest unit size in the practice trial to ensure that children understand to use (multiples of) the unit size for their estimation. Again, children did not receive any feedback on their estimate.
1 2 3 4 5 6 7 8 9 10 11 12 13 14 15 16 17 18 19 20 21 22 23 24 25 26 27 28 29 30 31 32 33 34 35 36 37 38 39 40 41 42 43 44 45 46 47 48 49 50 51 52 53 54 55 56 57 58 59 60 61 62
position 24 numbers on a number line, of which only the start and a unit (i.e., the length corresponding to 1) but no end-point were indicated. The set of target numbers to be located ranged from 2 to 25, leaving sufficient distance between the end of the physical line (i.e., 29) and the largest target number (i.e., 25) as children tend to overestimate in this task.
Spelling competencies
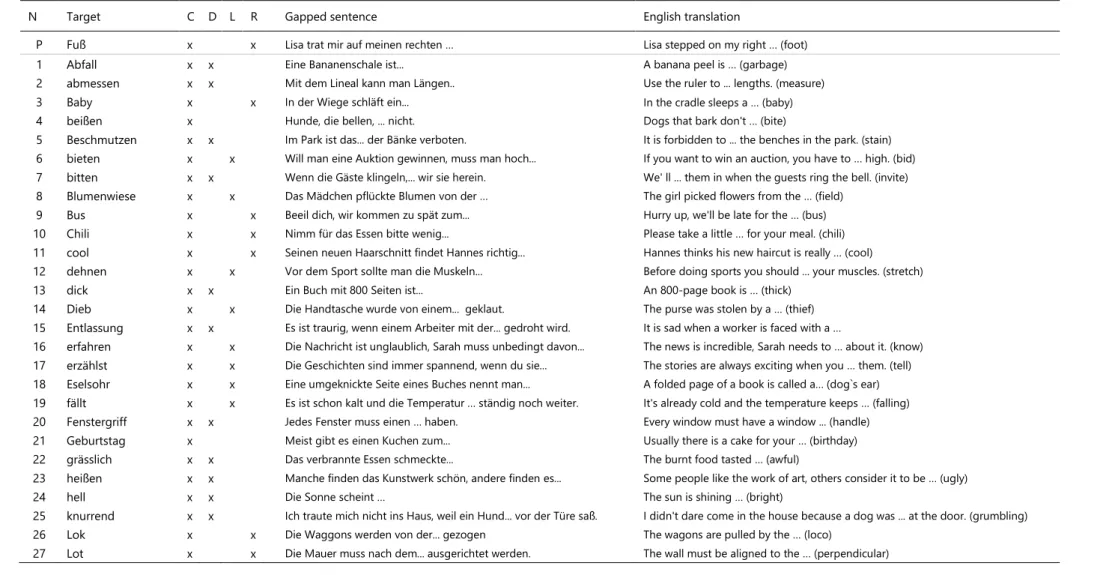
Spelling assessment followed a writing-to-dictation task which required children to complete gapped sentences (e.g., Eine Bananenschale ist [Abfall]; engl. A banana peel is [garbage]). First, each sentence was presented auditorily, followed by a repetition of the target word (depicted in square brackets). Children were instructed to read along the sentences during dictation, wait until the target word was repeated and then type in the respective target word. Overall, 55 test words were administered with respect to the following orthographic rules: capitalization (55 words, e.g., Abfall , [engl. garbage ]), consonant doubling (21 words, e.g., Abfall’, [engl. garbage ]), lengthening (14 words, e.g., Dieb , [engl., thief ]) and rule words (i.e., words for which the spelling cannot be derived by the phoneme structure; 14 words, e.g., Lok , [engl. loco ]. In this example, the short vowel is not followed by a double consonant, as one would assume from the German pronunciation). Table A1.2 in Appendix A1 presents the entire test material for the spelling assessment. Individual spelling was assessed automatically as either correct (scored 1) or incorrect (scored 0) with respect to each orthographic rule in each test word (e.g., Abfall’ [engl. garbage ] was assessed concerning (inner sentence) capitalization and consonant doubling; correct spelling of ´Abfall´ leads to a word score of max. 2) resulting in a maximum overall sum score of 104.
Data Analysis:
Estimation accuracy and strategy use 1 2 3 4 5 6 7 8 9 10 11 12 13 14 15 16 17 18 19 20 21 22 23 24 25 26 27 28 29 30 31 32 33 34 35 36 37 38 39 40 41 42 43 44 45 46 47 48 49 50 51 52 53 54 55 56 57 58 59 60 61 62
First, to increase comparability of the results, we standardised children s estimation errors by the length of the respective number line in both tasks. Therefore, children s general estimation accuracy was analyzed using the percent absolute error as dependent variable (PAE= Estimate Target number|/ Scale ∗100; cf. Siegler and Booth, 2004). PAE is the standard dependent variable in the literature when evaluating NLE performance across different number ranges, age groups, versions of number line estimation tasks, etc. (e.g., Booth & Siegler, 2008; Link et., 2014; Siegler & Booth, 2004; Slusser et al., 2012; Slusser & Barth, 2017; Young & Booth, 2015). Consider the following example for the bounded NLE task with the target number 74. When the child locates the number at the position of 234, he or she is 160 units off. The PAE in this example amounts to 1.6% (PAE = |234 74|/10,000 * 100). As PAE does not allow to indicate the pattern of over- and underestimation, we also calculated the mean percent relative estimation error [REE = (Estimate Target number)/Scale * 100], which would be +1.6% indicating slight overestimation. For the REE, a value of zero means an accurate estimate. A negative value reflects underestimation, whereas a positive value indicates overestimation. Furthermore, contour analyses (cf. Ashcraft & Moore, 2012) were conducted separately for each grade to contrast children s estimation errors around and in between potential reference points (e.g. start, end, quartile, and mid points) as an index of the use of proportion-judgement strategies (cf. Ashcraft & Moore, 2012) in bounded NLE. Estimates of the following numbers were pooled to reflect the usage of potential reference points beginning from start (74 and 135) via midpoint (4957 and 5103) to the end point (9851 and 9786). Numbers around the first (2315 and 3408) and third quartile (6781 and 7685) in-between these reference points were combined (cf. Lai Zax & Barth, 2018; for other pooling approaches) In unbounded NLE, use of reference points was not expected as the absence of an end point of the scale prevents the possibility of a reference. Nevertheless, for better comparability of the results, estimates of 1 2 3 4 5 6 7 8 9 10 11 12 13 14 15 16 17 18 19 20 21 22 23 24 25 26 27 28 29 30 31 32 33 34 35 36 37 38 39 40 41 42 43 44 45 46 47 48 49 50 51 52 53 54 55 56 57 58 59 60 61 62
target numbers around the start (2 and 3), first quartile (7 and 8) mid (13 and 14), third quartile (19 and 20) and end point (24 and 25) of the number line scale were combined as well. Data points of the contour analysis were then compared using an analysis of variance (ANOVA). Additionally, we conducted model fittings on children`s individual estimates to validate number line estimation strategies derived from contour analyses. Data were modeled with Matlab 9.4.0 (MATLAB and Statistics Toolbox Release R2018a, The MathWorks, Inc., Natick, Massachusetts, United States) using the trust region algorithm for non-linear model fitting.
Number line estimation and basic arithmetic
Association of number line estimation performance and basic arithmetic operations was assessed by means of partial correlations. With respect to correlation analyses, the Shapiro Wilk test (Shapiro & Wilk, 1965) was conducted in order to assess normal distribution. As distribution of basic arithmetic and spelling data deviated significantly from normal distribution, Spearman correlation coefficients were calculated. In particular, semi-partial rank correlation coefficients of non-parametric data ("Spearman s rho ) using the R package ppcor (Kim, 2015) were calculated to examine the correlation of general accuracy in number line estimation and in the four basic arithmetic operations (i.e., addition, subtraction, multiplication, division), controlling for age and spelling ability. In order to validate results, cross-validation methods were applied. For this purpose, existing samples were randomly divided into two data sets each. As cross-validation revealed reliable outcomes in line with results for the overall sample, only latter results are presented below. Cross-validation results are reported in Table A2 in Appendix A2. Bonferroni-Holm procedure (Holm, 1979) was applied in order to (adequately) correct for multiple testing.
1 2 3 4 5 6 7 8 9 10 11 12 13 14 15 16 17 18 19 20 21 22 23 24 25 26 27 28 29 30 31 32 33 34 35 36 37 38 39 40 41 42 43 44 45 46 47 48 49 50 51 52 53 54 55 56 57 58 59 60 61 62
RESULTS:
In total, complete data sets of 573 children for the bounded NLE task, in particular, 198 fifth graders (94 female, mean age: 10.48, SD = 7.32 months), 231 sixth-graders (105 female, mean age: 11.69, SD = 8.64 months) and 144 seventh-graders (74 female, mean age: 12.54, SD = 8.28) entered analyses. For unbounded NLE, 221 data sets were analyzed, this means, data of 86 fifth graders (41 female, mean age: 10.62, SD = 8.05 months), 81 sixth-graders (37 female, mean age: 11.72 SD = 8.28 months) and 54 seventh-graders (22 female, mean age: 12.75, SD = 9.30 months). Table 1 provides descriptive information regarding all variables used in the study.
Table 1:
A) Demographics bounded sample
B) Demographics unbounded sample
Note: In the spelling assessment, children could achieve a maximum overall score of 104 points; in arithmetic
assessment, children could achieve a maximum score of 20 points for each operation (i.e., addition, subtraction, multiplication, division).
Items Fifth grade Sixth grade Seventh grade
(n) Mean SD Mean SD Mean SD
Spelling (sum score) 104 83.44 11.71 85.55 11.84 91.59 8.65
Addition 20 18.24 2.79 17.94 3.03 18.59 2.64
Subtraction 20 14.98 4.85 14.11 5.43 15.93 4.39
Multiplication 20 17.47 3.38 17.21 3.84 18.08 2.30
Division 20 17.90 2.97 17.75 3.16 18.52 1.82
NLE task mean PAE 24 5.94 1.66 5.49 1.28 5.17 1.42
Items Fifth grade Sixth grade Seventh grade
(n) Mean SD Mean SD Mean SD
Spelling (sum score) 104 83.46 11.95 87.25 11.44 90.74 9.23
Addition 20 18.49 2.28 18.14 2.73 19.24 1.70
Subtraction 20 15.22 4.73 14.35 4.90 16.43 4.18
Multiplication 20 17.37 3.34 18.20 2.18 18.18 2.37
Division 20 17.90 3.46 18.54 2.48 18.28 2.51
NLE task mean PAE 24 9.77 4.16 9.76 4.39 8.97 3.36
1 2 3 4 5 6 7 8 9 10 11 12 13 14 15 16 17 18 19 20 21 22 23 24 25 26 27 28 29 30 31 32 33 34 35 36 37 38 39 40 41 42 43 44 45 46 47 48 49 50 51 52 53 54 55 56 57 58 59 60 61 62
Children of the two samples did not differ significantly according to their sum scores in terms of spelling (5th grade: t(158.82) = -0.018, p = 0.99, 6th grade: t(144.31) = -1.13, p = 0.26 , 7th grade: t(90.12) = 0.59, p = 0.59) and basic arithmetic (5th grade: t(160.86) = -0.26, p = 0.79, 6th grade: t(197.5) = -1.71, p = 0.09, 7th grade: t(100.4) = -0.72, p = 0.47) as assessed with Welch two sample t-tests. Moreover, at SP2 bounded and unbounded NLE performance was assessed within the same school classes. Thus, school- and classroom related influences (e.g., school location, class size, teaching style, average math performance) were equal for both groups. A 2 (condition: bounded vs. unbounded NLET) x 3 (5th vs. 6th vs. 7th grade) analysis of variance (ANOVA) on PAEs revealed a significant main effect for condition [F(1,788) = 412.21, p < .001,
2
p = 0.35], such that average PAE was significantly lower for bounded NLE (M = 5.57, SD = 1.49) than for unbounded NLE (M = 9.57, SD = 4.07). The main effect for grade [F(2,788) = 7.95, p < .001, 2
p = 0.02] indicated a significant influence of grade levels on NLE performance. Furthermore, there was no interaction between condition and group [F(2,788) = 0.605, p > 0.05,
2
p < 0.01]. Post hoc comparisons for grade using Tukey HSD test applying an adjusted p-level for multiple comparisons showed a marginally significant [p = .056] difference between mean PAE of children in the 5th (M=5.95, SD=1.66) and 7th grade (M=5.17, SD=1.42,) in the bounded condition. In the unbounded condition, no significant differences in mean PAEs were observed between grade levels [all p > .284; 5-graders (M=9.77, SD=4.16), 6-graders (M=9.76, SD=4.39), and 7-graders (M=8.97, SD=3.36)].
Number line estimation accuracy and strategy use
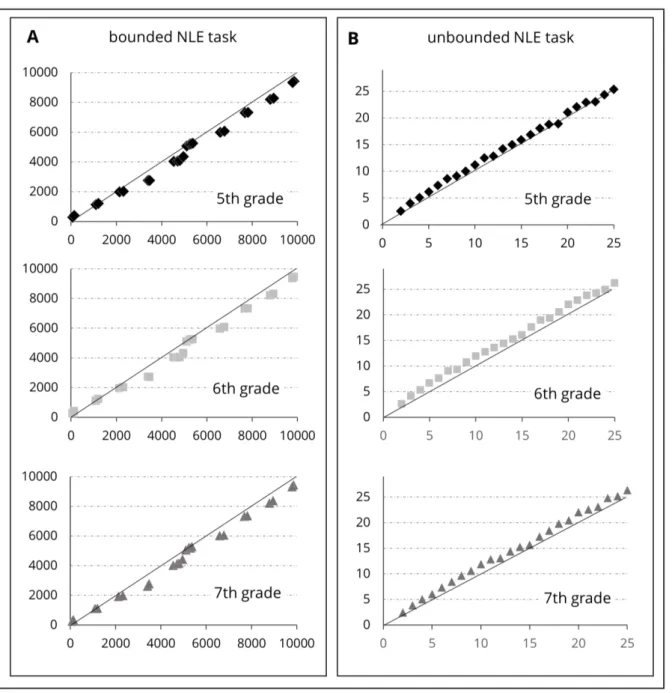
Figure 1 reflects children s number line estimation patterns for both the bounded (Panel A) and the unbounded NLE task (Panel B) separated for grade levels.
1 2 3 4 5 6 7 8 9 10 11 12 13 14 15 16 17 18 19 20 21 22 23 24 25 26 27 28 29 30 31 32 33 34 35 36 37 38 39 40 41 42 43 44 45 46 47 48 49 50 51 52 53 54 55 56 57 58 59 60 61 62
Figure 1: Mean estimation pattern for bounded (A) and unbounded (B) number line estimation: The figure shows target values (x-axis) and mean estimates (y-axis) for all three age levels, with x=y in the diagonal. 1 2 3 4 5 6 7 8 9 10 11 12 13 14 15 16 17 18 19 20 21 22 23 24 25 26 27 28 29 30 31 32 33 34 35 36 37 38 39 40 41 42 43 44 45 46 47 48 49 50 51 52 53 54 55 56 57 58 59 60 61 62
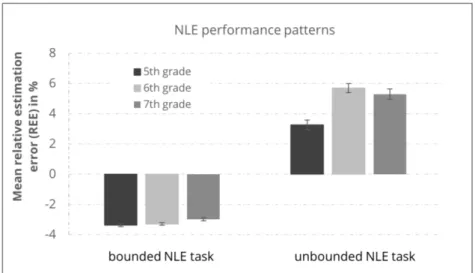
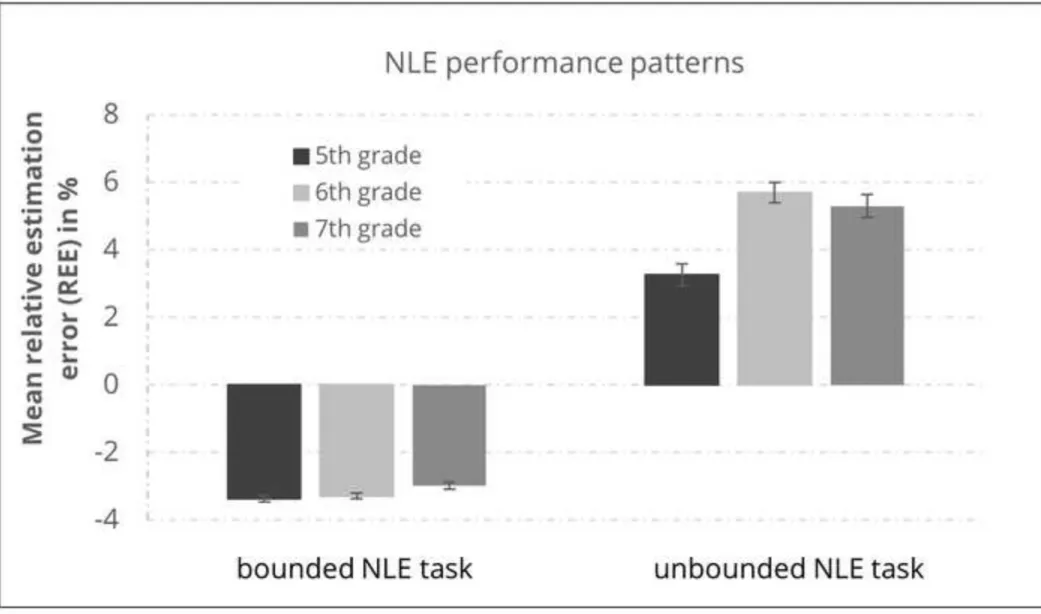
Crucially, Figure 1 reveals that estimation patterns differ between bounded and unbounded NLE: Figure 2 depicts the mean REE score for both bounded and unbounded NLE. Most importantly, children underestimated target numbers in the bounded NLE task, whereas they overestimated target numbers in the unbounded NLE task.
Figure 2: Mean relative estimation errors (REE) for bounded and unbounded number line estimation performance.
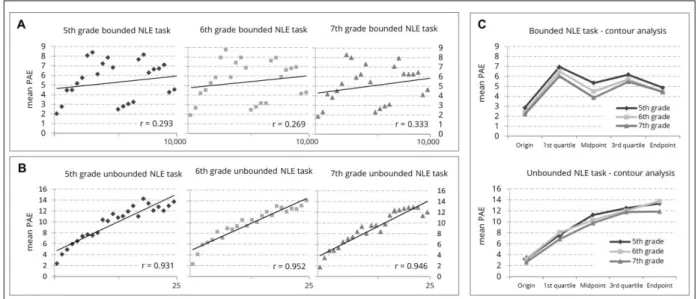
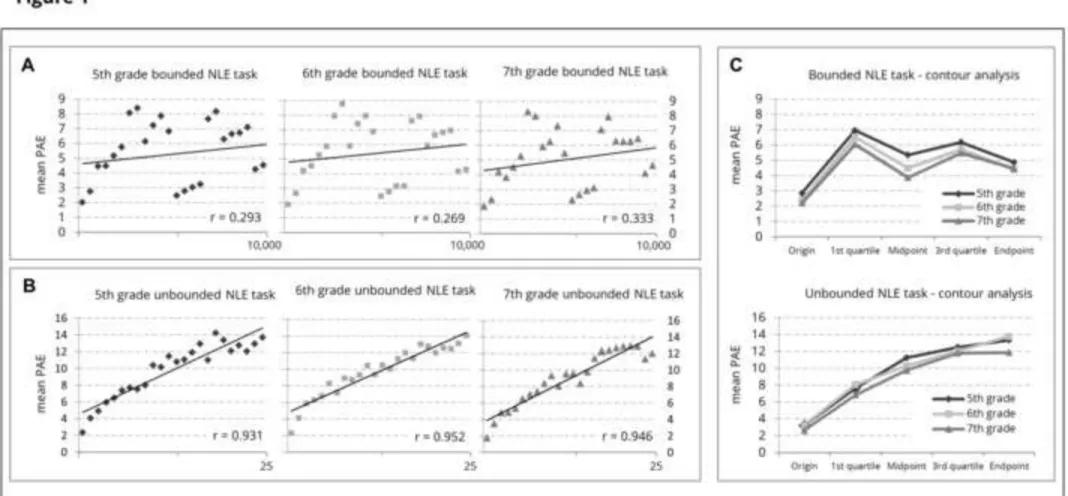
Regarding children s performance in the bounded NLE task Figure 3 revealed estimation errors to vary for different target numbers. In contrast, children s estimation errors increased linearly in the unbounded NLE task. Summarizing estimation errors at/around reference points, contour analyses revealed an M-shaped pattern of error distribution (see Figure 3A) which has been argued to be characteristic for proportion-judgement strategies (cf. Cohen and Blanc-Goldhammer, 2011). Correlating PAEs and size of target number revealed no significant correlations for all grade levels (all r < 0.333, all p > 0.11).
1 2 3 4 5 6 7 8 9 10 11 12 13 14 15 16 17 18 19 20 21 22 23 24 25 26 27 28 29 30 31 32 33 34 35 36 37 38 39 40 41 42 43 44 45 46 47 48 49 50 51 52 53 54 55 56 57 58 59 60 61 62
Figure 3: Mean percentage absolute errors (PAE) for bounded and unbounded number line estimation performance. The left panel depicts mean PAE and target numbers in the (A) bounded and (B) unbounded NLE
task separately for all grade levels. The right panel (C) shows contour analyses summarizing percent absolute errors (PAE) at specific reference points (cf. Ashcraft and Moore, 2012) for all grade levels (i.e., grade 5-7) again for bounded (top) and unbounded (bottom) NLE.
Bonferroni-Holm corrected t-tests were conducted to compare PAEs at specific reference points (start-, mid- and endpoint) and in the intervals between them (first and third quartile). Results substantiated the descriptive pattern of the contour analyses by indicating significantly reduced PAEs at reference points as compared to the intervals in-between for all grades [5th grade: t(192) > -7.23, p < .001, Cohen's d = 0.23 1.14; 6th grade: t(227) > -21.53, p < .001, Cohen's d = 0.40 1.43, and 7th grade: t(142) > -14.79, p < .001, Cohen's d = 0.37 1.23]. In unbounded NLE, in contrast, linearly increasing PAEs across all age groups were observed: PAEs increased monotonically with target number (see Figure 3B) resulting in significant correlations between PAEs and size of target number (from r = 0.931 to r = 0.952, all p < 0.05). This pattern was also found in contour analyses (Figure 3C). Bonferroni-Holm corrected t-tests revealed significant differences between both the start- and midpoint and the quartile [5th grade: t(85) > -12.09, p < .001, Cohen's d = 0.58 1.30; 6th grade: t(80) > -12.09, p < .001, Cohen's d = 0.25 1.50, and 7th grade: t(53) > - 10.14, p < .001, Cohen's d = 0.31 1.38], but not for the third quartile and the endpoint [5th grade: t(85) > -1.64, p > 0.05, Cohen's d = 0.18; and 7th grade: 1 2 3 4 5 6 7 8 9 10 11 12 13 14 15 16 17 18 19 20 21 22 23 24 25 26 27 28 29 30 31 32 33 34 35 36 37 38 39 40 41 42 43 44 45 46 47 48 49 50 51 52 53 54 55 56 57 58 59 60 61 62
t(53) > -2.25, p(adj.) > 0.05, Cohen's d = 0.01), except for the 6th grade (t(80) > 2.5432, p < .001, Cohen's d = 0.28].
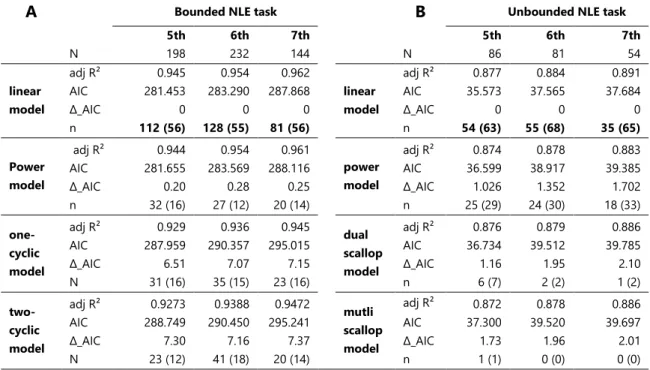
Additionally, we fitted children s number line estimates with different mathematical models. Table 2 shows absolute and relative frequencies (in parenthesis) of best fitting models for bounded and unbounded NLE separated for the three different grade levels.
In bounded NLE, linear models provided best fit for all grade levels (for 56% of fifth, 55% of sixth, and 56% of seventh graders). Only about 30% of all children s estimates were best determined by models indicating proportion-judgement strategies (i.e., one-cyclic or two-cyclic models), and thus the use of reference points. This finding may contradict evidence for proportion-judgement from the contour analyses.
In unbounded NLE, over 90% of children s estimates were accounted best by linear (for 63% of the fifth, 68% of the sixth, and 65% of the seventh graders) or power models (for 29% of the fifth, 30% of the sixth, and 33% of the seventh graders) for all grade levels. Model fitting did not indicate model fits in favor of dead-reckoning in unbounded number line estimation. Crucially, and in particular for unbounded NLE, mean adjusted R2 resp. the AIC values were almost identical. As such, a unique derivation of the best fitting model seems not feasible. 1 2 3 4 5 6 7 8 9 10 11 12 13 14 15 16 17 18 19 20 21 22 23 24 25 26 27 28 29 30 31 32 33 34 35 36 37 38 39 40 41 42 43 44 45 46 47 48 49 50 51 52 53 54 55 56 57 58 59 60 61 62
Table 2: Model fittings for bounded and unbounded number line estimation
Note: Absolute and relative frequency (percentages) of best fitting models for bounded (A) and
unbounded (B) number line estimation separated for grade levels. The best fitting models are indicated in bold script.
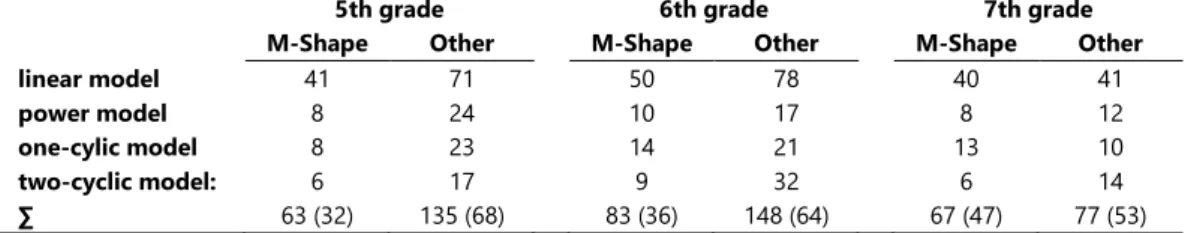
Regarding the partially contradictory results of contour analyses and model fittings for bounded NLE, closer visual examination of children s individual estimation pattern was more revealing. Table 3 provides results of individual contour analysis for each child separated for the best fitting models as well as for grade level. The table differentiates between the M-shape pattern of number estimates and other patterns (i.e., N-shape, inverse N-shape, V-shape, etc.). At first glance, more than one third of fifths and sixth graders showed an M-shape estimation pattern on the individual level. This number increased in the seventh grade up to almost fifty percent indicating an increasing use of reference points with age. Yet, these findings cannot be clearly derived from the results of individual model fittings: successful use of reference points (i.e., proportion-judgement) and thus minimal estimation errors can be also accounted by linear models (e.g., Link, Huber, et al., 2014). Contrary, unsuccessful use of reference points (i.e., a V-shape or N-shape pattern) can be accounted by one- or two-cyclic models.
A Bounded NLE task B Unbounded NLE task 5th 6th 7th 5th 6th 7th N 198 232 144 N 86 81 54 linear model adj R² 0.945 0.954 0.962 linear model adj R² 0.877 0.884 0.891 AIC 281.453 283.290 287.868 AIC 35.573 37.565 37.684 _AIC 0 0 0 _AIC 0 0 0 n 112 (56) 128 (55) 81 (56) n 54 (63) 55 (68) 35 (65) Power model adj R² 0.944 0.954 0.961 power model adj R² 0.874 0.878 0.883 AIC 281.655 283.569 288.116 AIC 36.599 38.917 39.385 _AIC 0.20 0.28 0.25 _AIC 1.026 1.352 1.702 n 32 (16) 27 (12) 20 (14) n 25 (29) 24 (30) 18 (33) one-cyclic model adj R² 0.929 0.936 0.945 dual scallop model adj R² 0.876 0.879 0.886 AIC 287.959 290.357 295.015 AIC 36.734 39.512 39.785 _AIC 6.51 7.07 7.15 _AIC 1.16 1.95 2.10 N 31 (16) 35 (15) 23 (16) n 6 (7) 2 (2) 1 (2) two-cyclic model adj R² 0.9273 0.9388 0.9472 mutli scallop model adj R² 0.872 0.878 0.886 AIC 288.749 290.450 295.241 AIC 37.300 39.520 39.697 _AIC 7.30 7.16 7.37 _AIC 1.73 1.96 2.01 N 23 (12) 41 (18) 20 (14) n 1 (1) 0 (0) 0 (0) 1 2 3 4 5 6 7 8 9 10 11 12 13 14 15 16 17 18 19 20 21 22 23 24 25 26 27 28 29 30 31 32 33 34 35 36 37 38 39 40 41 42 43 44 45 46 47 48 49 50 51 52 53 54 55 56 57 58 59 60 61 62
Table 3: Individual contour analyses and model fittings for bounded NLE
5th grade 6th grade 7th grade M-Shape Other M-Shape Other M-Shape Other
linear model 41 71 50 78 40 41
power model 8 24 10 17 8 12
one-cylic model 8 23 14 21 13 10 two-cyclic model: 6 17 9 32 6 14 ∑ 63 (32) 135 (68) 83 (36) 148 (64) 67 (47) 77 (53)
Note: Absolute and relative frequency (percentages) for the use of proportion-judgement
strategy (i.e., M-Shape estimation pattern) or other strategies derived from contour analysis in bounded number line estimation.
Number line estimation and basic arithmetic
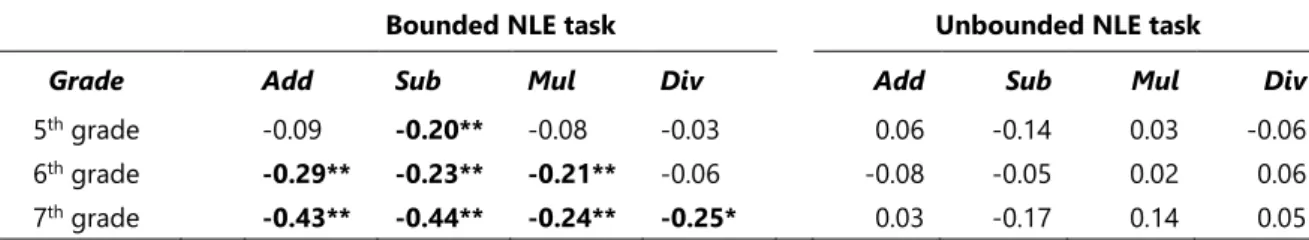
First, we analyzed to what extent spelling and arithmetic skills were associated to control for influences of general cognitive abilities in subsequent analyses. Partial correlations controlling for age revealed relatively high correlations between basic arithmetic skills and overall spelling skills for both samples assessed with the bounded (n=573, r=.51, p<.001) and unbounded (n=221, r = .43, p<.001) NLE task. These correlations indicated a strong association between spelling and arithmetic performance. As spelling and arithmetic skills have been found to rely on common general cognitive abilities (e.g., working memory, verbal memory, and reasoning skills, e.g., Knievel, Daseking, & Petermann, 2010; Passolunghi, Mammarella, & Altoè, 2008), we used overall spelling skills as a proxy to control for influences of general cognitive ability. Subsequently, partial correlations were calculated controlling for age and spelling skills. Table 4 shows the results of the partial correlation between number line estimation performance and basic arithmetic separately for grade levels. For bounded NLE, strength of correlations increased with age. In grade 5, NLE performance correlated significantly with subtraction (i.e., lower error rate in subtraction problems was associated with less estimation errors in NLE), but not with addition, multiplication, or division. In grade 6, significant correlations were found for addition, subtraction and multiplication, but not for division. In grade 7, bounded NLE 1 2 3 4 5 6 7 8 9 10 11 12 13 14 15 16 17 18 19 20 21 22 23 24 25 26 27 28 29 30 31 32 33 34 35 36 37 38 39 40 41 42 43 44 45 46 47 48 49 50 51 52 53 54 55 56 57 58 59 60 61 62
performance was found to be significantly associated with all basic arithmetic operations, but highest with addition and subtraction. For unbounded NLE, no significant correlation was found between task performance and basic arithmetic.
Table 4: Partial correlations (one-tailed) between PAEs of bounded (left panel) and unbounded NLE and basic arithmetic
Note: Overall partial correlations were calculated for all grade levels. Add=Addition, Sub=Subtraction,
Mul=Multiplication, Div=Division. * p<.05, ** p<.001.
Bounded NLE task Unbounded NLE task
Grade Add Sub Mul Div Add Sub Mul Div
5th grade -0.09 -0.20** -0.08 -0.03 0.06 -0.14 0.03 -0.06 6th grade -0.29** -0.23** -0.21** -0.06 -0.08 -0.05 0.02 0.06 7th grade -0.43** -0.44** -0.24** -0.25* 0.03 -0.17 0.14 0.05 1 2 3 4 5 6 7 8 9 10 11 12 13 14 15 16 17 18 19 20 21 22 23 24 25 26 27 28 29 30 31 32 33 34 35 36 37 38 39 40 41 42 43 44 45 46 47 48 49 50 51 52 53 54 55 56 57 58 59 60 61 62
DISCUSSION:
In the following, we discuss results on number line estimation accuracy and strategy use and the association of NLE and basic arithmetic separately with regard to the relevant literature. Estimation accuracy and strategy use
Results of the current study substantiated that secondary school children performed differently in bounded and unbounded NLE: PAEs were almost twice as high in unbounded than in bounded NLE. These findings are consistent with previous results on primary school children (i.e., grade 3 and 4) and adults (e.g., Link, Huber, et al., 2014, Reinert et al., 2019; for a production version of the task). Importantly, this result cannot be explained by the different number ranges used in the present study for unbounded and bounded NLE. Although one may assume that all children were familiar with both intervals, the larger number interval should nevertheless be more error prone due to the problem size effect (Zbrodoff & Logan, 2005, for a review). However, mean estimation errors in bounded NLE were significantly lower. More likely, the difference in estimation accuracy arises from different solutions strategies applied. In bounded NLE, application of proportion-based strategies simplifies task solution; the presence of a start and an end point facilitated the derivation of the center of the number line and also decomposition into sections. This procedure reduces the number of mistakes made by the children. Thus, estimation errors were reduced. Unbounded NLE does not offer this solution strategy as the end point is missing.
Contour analysis in the present study substantiated this assumption. In line with Ashcraft and Moore (2012) as well as with Link et al. (2014), a characteristic M-shaped pattern of estimation errors (i.e., smaller and less variable estimation errors for target numbers at or around reference points) was observed in contour analyses for bounded NLE. This suggested that children used 1 2 3 4 5 6 7 8 9 10 11 12 13 14 15 16 17 18 19 20 21 22 23 24 25 26 27 28 29 30 31 32 33 34 35 36 37 38 39 40 41 42 43 44 45 46 47 48 49 50 51 52 53 54 55 56 57 58 59 60 61 62
proportion-based strategies to solve the task. By contrast, we observed an almost linearly increasing error pattern for unbounded NLE, which has been previously assumed to be related to a magnitude estimation-based strategy in unbounded NLE (Cohen & Blanc-Goldhammer, 2011; Link, Huber, et al., 2014). However, a closer look at the potential reference in the unbounded NLE tasks disclosed that the children may not have been able to express their entire estimation bias (with overestimating target numbers by about 50%, cf. Cohen & Sarnecka, 2014) because of the length of the physical number line (i.e., 716 pixels corresponding to 29 units). This might explain the lack of significant further increase in estimation error for target numbers in the 3rd quartile and at around the end point (i.e., target numbers larger than 20). However, we are confident that this does not affect general conclusions made about solution strategies in unbounded NLE. Nevertheless, future studies should be aware of the necessity to provide a sufficiently long physical number line (depending on the number ranged used) to be able to assess the respective (over)estimation bias. However, these findings were only partially corroborated by model fitting results. Model fittings for bounded NLE indicated best fit of linear models for the majority of children s estimates. As recently discussed by Link and colleagues (2014), a very accurate estimation pattern can hardly be differentiated by model fittings. Contrarily, model fitting results for unbounded NLE were unambiguous. They did not provide any evidence for specific strategy use (i.e., proportion-judgement) in unbounded number line estimation.
Furthermore, as with primary school children (e.g., Barth & Paladino, 2011; Cohen & Blanc-Goldhammer, 2011; Link, Huber, et al., 2014; Slusser & Barth, 2017), estimation accuracy in the present study was found to improve with age for bounded NLE. In contrast, for unbounded NLE no significant differences in estimation accuracy was observed across grade levels. 1 2 3 4 5 6 7 8 9 10 11 12 13 14 15 16 17 18 19 20 21 22 23 24 25 26 27 28 29 30 31 32 33 34 35 36 37 38 39 40 41 42 43 44 45 46 47 48 49 50 51 52 53 54 55 56 57 58 59 60 61 62
However, we observed age-related increases from 5th to 7th grade for both basic arithmetic and spelling performance which were considered as control variables. Considering the observation that estimation performance does not change in unbounded NLE across the different age groups, the question arises to what extent unbounded NLE performance is influenced by general age-related developmental processes.
Number line estimation and basic arithmetic
Results substantiated an association of NLE performance for bounded but not unbounded NLE and basic arithmetic (cf. Cohen & Sarnecka, 2014; Link et al., 2014). Correlation coefficients were comparable to those reported in other studies (ranging from r = 0.29 0.86) relating various mathematical competencies (i.e., problem solving, calculation; see Schneider et al., 2018, for an overview). In particular, we observed subtraction skills to be associated with bounded NLE performance consistently for all grades. In grade 6, correlations with addition and multiplication were of equal strength as with subtraction. In grade 7, all four arithmetic operations were significantly associated with bounded NLE.
We suggest that children who are well versed in solving subtraction tasks may be more likely to successfully use proportion-judgement strategies. The following factors might contribute to this finding: First, addition and subtraction are taught as the first arithmetic operations in school (e.g., Bildungsplan Sekundarstufe I, Ministerium für Kultus, Jugend und Sport, Baden Württemberg, 2016). However, subtraction is regarded to be more demanding as compared to addition (e.g., because of borrowing, Artemenko et al., 2018), and children were found to use calculation (i.e., instead of fact retrieval in simple addition and multiplication problems) to solve subtraction problems even in 2-digit numbers (e.g., Ischebeck et al., 2006). Thus, subtraction might be more sensitive to reflect differences in magnitude estimation skills as it also relies on 1 2 3 4 5 6 7 8 9 10 11 12 13 14 15 16 17 18 19 20 21 22 23 24 25 26 27 28 29 30 31 32 33 34 35 36 37 38 39 40 41 42 43 44 45 46 47 48 49 50 51 52 53 54 55 56 57 58 59 60 61 62
magnitude manipulations to a higher degree. Second, according to the proportion-judgement account, a leftward (reflecting subtraction) or rightward shift (reflecting addition) starting from a reference point might be necessary to locate the number correctly upon the line (cf. Cohen and Sarnecka, 2014). A closer descriptive look at the results of the contour analysis (Figure 3) and mean PAEs at the quartiles supports this assumption: starting from the mid-point, a leftward shift (from mid-point to the first quartile reflecting subtraction) resulted in higher estimation errors than a shift to the right (from mid-point to the third quartile reflecting addition). Third, further evidence may be derived from neuro-functional level: Berteletti and colleagues (2015) demonstrated that activation of brain areas associated with number magnitude processing (as required in subtraction) were correlated with NLE performance. Furthermore, Ischebeck et al. (2006) provided neuro-functional evidence that a training of subtraction problems in young adults encouraged the application of efficient procedural solution strategies. This result suggests that children with high subtraction skills are more likely to apply sufficient solution strategies (i.e., proportion-judgement) at least in bounded NLE. An explanation for significant associations between bounded NLE and multiplication as well as division occurring not before grade 6 and 7, respectively, might be that, according to German math curricula, multiplication and division are increasingly used with the introduction of fractions in grade 6 (e.g., Bildungsplan Sekundarstufe I, Ministerium für Kultus, Jugend und Sport, Baden Württemberg, 2016). Although all four basic arithmetic operations have already been acquired in primary school (i.e., before grade 5; Huber, Moeller, & Nuerk, 2012), the increasing significance of multiplication and division (i.e., fractions) from grade 6 onwards might enable children to apply proportion-judgement strategies more proficiently, leading to better performance in bounded NLE. Visual inspection of contours on individual levels confirmed the increasing use of reference points with age. This in turn can influence NLE 1 2 3 4 5 6 7 8 9 10 11 12 13 14 15 16 17 18 19 20 21 22 23 24 25 26 27 28 29 30 31 32 33 34 35 36 37 38 39 40 41 42 43 44 45 46 47 48 49 50 51 52 53 54 55 56 57 58 59 60 61 62
performance as presented by Siegler and colleagues (2011) in another domain of mathematics (i.e., fractions) showing that segmentation strategies involving dividing up the number line with subjective landmarks leads to more accurate fraction number line estimates.
Moreover, correlation coefficients became stronger for subtraction, addition, multiplication and finally division from grade 5 to 7, suggesting an increasing importance of basic arithmetic for bounded NLE. These findings substantiate the assumption of Friso-van den Bos et al. (2015) who argued that associations between arithmetic skills and NLE are predominantly driven by developmental processes.
For the association of unbounded NLE performance and basic arithmetic, we did not find significant relations with any basic arithmetic operation in secondary school children (Link et al., 2014; for similar results). Building on the results of Cohen and Blanc-Goldhammer (2011) and Reinert et al. (2015), we would have expected at least a weak correlation of unbounded NLE with addition and multiplication, respectively. Even though, and unlike Reinert et al. (2015), we did neither focus on analyzing different unit distances (0-1, 0-5, etc.) nor specifically selected multiples of these as target numbers. However, the lack of associations between unbounded NLE and basic arithmetic seems plausible considering the assumption that unbounded NLE may be solved by iterative counting like strategies (Reinert et al., 2015; Schneider et al., 2018). Counting as a highly automated process may not depend on basic numerical and arithmetical skills. In this vein, unbounded NLE seems to reflect purer numerical estimation, which may be superimposed less by underlying arithmetic processes (i.e., addition, subtraction, division) of other solution strategies as is proportion-judgement (see also Cohen & Blanc-Goldhammer, 2011; Link, Huber, et al., 2014; Reinert et al., 2015). In sum, the present data provide additional evidence from secondary school children that unbounded number line 1 2 3 4 5 6 7 8 9 10 11 12 13 14 15 16 17 18 19 20 21 22 23 24 25 26 27 28 29 30 31 32 33 34 35 36 37 38 39 40 41 42 43 44 45 46 47 48 49 50 51 52 53 54 55 56 57 58 59 60 61 62
estimation may indeed be solved primarily based on processing and estimating number magnitude.
When interpreting these results, there are some constraints that need to be considered. First, in the present study different number ranges were used in bounded (0-10,000) and unbounded (0-29) number line estimation to tie on results of previous studies (e.g., Link, Huber, et al., 2014; Siegler & Opfer, 2003; Thompson & Opfer, 2010). As introduced above, there are sensible reasons for using larger number ranges for bounded NLE and to use small number ranges in unbounded NLE (e.g., Cohen et al., 2018). However, to enhance comparability of results, standardised measures considering the length of the respective number lines were used (see also Link, Huber, et al., 2014; for a methodological discussion on the application of different number ranges). This approach seems warranted as we did not draw any conclusions on differences in task difficulty between differently large number ranges.
Second, the study was cross-sectional, so we did not monitor intra-individual development in bounded and unbounded NLE. However, conclusions on numerical development with age seem warranted as for both spelling and basic arithmetic tasks our data documented increasing performance with increasing age. Nevertheless, it would be desirable to pursue intra-individual developmental changes in estimation accuracy in secondary school children more systematically in future studies.
Third, as we assessed performance in bounded and unbounded NLE inter-individually, direct comparisons of both NLE tasks within one child were not possible. Nevertheless, both samples seem well comparable as bounded and unbounded NLE was assessed within the same school classes (at least at SP2), and thus, class-room related influences (e.g., class size, teaching style, average math performance of the school class) were equally distributed across both groups. 1 2 3 4 5 6 7 8 9 10 11 12 13 14 15 16 17 18 19 20 21 22 23 24 25 26 27 28 29 30 31 32 33 34 35 36 37 38 39 40 41 42 43 44 45 46 47 48 49 50 51 52 53 54 55 56 57 58 59 60 61 62
Moreover, and this is particularly important, the two groups solving either bounded or unbounded NLE neither differed significantly in mean basic arithmetic skills nor in spelling performance. We therefore assume that both groups are well comparable and sufficient to draw comparable conclusions on bounded and unbounded NLE performance. However, individual comparisons would be desirable for future studies. Finally, it is not clear yet whether and how the presentation medium (i.e., computerised assessment in the current study) moderates NLE (Schneider et al., 2018), and potentially leads to inconsistent results (e.g., increased error variability) as compared to earlier paper-pencil studies. Future mode effect studies on NLE comparing computerised and paper-pencil testing could provide further insights. 1 2 3 4 5 6 7 8 9 10 11 12 13 14 15 16 17 18 19 20 21 22 23 24 25 26 27 28 29 30 31 32 33 34 35 36 37 38 39 40 41 42 43 44 45 46 47 48 49 50 51 52 53 54 55 56 57 58 59 60 61 62