Radiochimica Acta 47, 9 - 1 2 (1989)
© R. Oldenbourg Verlag, München 1989 - 0 0 3 3 - 8 2 3 0 / 8 9 $ 3.00+0.00
Evaluation of the Radial Distribution of Gadolinium Isotopes in Nuclear Fuel Pins by Secondary
Ion Mass Spectrometry (SIMS)
By HANS-URS ZWICKY, ERNST T. AERNE, GERHARD BART, FERDINAND PETRIK and HUGO A. THOMI, Paul-Scherrer-lnstitute (PSI) (formerly EIR), CH-5303 Wuerenlingen, Switzerland
Dedicated to Prof. Hans Rudolf von Gunten on the occasion of his 60tfl birthday
(Received July 4, 1988; revised August 30, 1988)
Secondary ion mass spectrometry /Isotopie distribution ¡Nuclear fuel/Irradiated /Gadolinium
Abstract
Secondary Ion Mass Spectrometry (SIMS) is a suitable technique to evaluate the relative isotopie Gd distribution across fuel pellets. It is faster and provides greater lateral resolution than microdril-ling techniques. Measurements on polished fuel cross sections with G d203 contents of 3 and 7 wt%, an i n i t i a l2 3 5U enrichment of about 3.5 % and burnup values between 2 and 6 G W d / t M were performed. In spite of cracked and porous surfaces, repeated measurements on the same sample lay within a span of less than 15% (relative), provided that the residual isotopie abundances were greater than ca. 1%.
The major disadvantage of the SIMS technique is the limita-tion concerning quantitative analysis. In this work, SIMS data have been normalized by radiochemical and mass spectrometric analysis of adjacent samples.
Introduction
Utilisation of "burnable absorbers" in nuclear light water reactors (LWR's) is a method for implementing near term improvements such as 18 month fuel cycles and maxi-mized average fuel burnup. Among the "burnable poisons",
G d203 is a leading candidate. It has been used in boiling
water reactors (BWR's) for some years. When the two
iso-topes l s sG d and 1 S 7Gd with thermal neutron capture
cross sections of 61000 and 254000 barn [1] are burnt
out, the residual poisoning is negligible. As G d203 can
readily be mixed with U 02, it can be implemented at the
most appropriate locations in the fuel assemblies without negative effects on heat transfer or water/fuel ratio for example. Additionally, it does not adversely affect spent fuel storage and reprocessing. Because uncertainties in the burnup calculation of Gd rods are still too large and since experience on the effect of Gd presence on high burnup behaviour is limited, it has not been possible to fully
exploit its possibilities. The GAP programme1 is devoted
to the acquisition of experimental results required to complement the available data base for pressurized water reactors (PWR's). Determination of burnup values on fuel samples by dissolution, chemical separation and mass spectrometric isotopie dilution analysis is a classical method used in destructive post-irradiation examination. It provides basic values for fuel rod performance and behaviour. To evaluate the radial isotopie distributions
of Gd, the same method could be applied to samples produced by microdrilling. This technique is very time consuming and the lateral resolution is limited by the diameter of the drill. An alternative technique for the measurement of local isotopie compositions is Secondary Ion Mass Spectrometry (SIMS). This method is faster and provides greater lateral resolution. In order to quantify the SIMS data, it is necessary to use average isotopie abundance values evaluated by dissolution and mass spectrometry for their normalization.
Alternatively, isotopie calibration standards with a chemical composition comparable to the fuel samples may be used.
Experimental
In the hotlaboratory of the Paul-Scherrer-Institute (PSI)
a modified A-DIDA-SIMS2 apparatus has been installed
for the analysis of highly radioactive samples [2]. The instrument is equipped with a quadrupole mass analyzer. An HP 9836 desk computer together with an HP 6942 multiprogrammer controls the spectrometer settings and is used for data processing.
For the analysis of polished cross sections of irradiated
fuel, an 02 primary ion beam of 12 keV energy was
ap-plied. The beam current used was about 50 nA with a spot size of around 10 Mm. Surface scans were performed by moving the specimen across the primary beam in steps of 0 . 2 5 - 0 . 5 0 mm in the x- and ^-directions, resulting in about 200 - 8 0 0 point areas analyzed per fuel sample. In order to smooth out inhomogeneities in isotopie composi-tion caused by self-shielding in the gadolinia grains, the primary beam was scanned over an area of about 100 χ
1 0 0 M m2.
Evaluation of radial isotopie Gd distributions was
effected using GdO+ peaks, because the count rates for
the oxide ions were about 2 - 3 times higher than for the
1 "International Experimental Programme on GAdolinia Fuel Evolution in PWR's (GAP)", programme conducted by BELGONUCLEAIRE (BN), Brussels, Belgium, and CENTRE D'ETUDE DE L'ENERGIE NUCLEAIRE/STUD IE CENTRUM VOOR KERNENERGIE (CEN/SCK), Brussels, Belgium 2 ΑΤΟΜΙΚΑ Technische Physik GmbH, Postfach 4 5 0 1 3 5 ,
10 HANS-URS ZWICKY, ERNST T. A E R N E , G E R H A R D BART, F E R D I N A N D P E T R I K a n d HUGO A. THOMI
metallic ions. The interference risk of fission product ions is also thus reduced. Absolute secondary ion count rates can vary considerably, and some of the influencing factors are:
— extraction field variations due to sample movement — primary beam current variations
— variation of the primary beam incident angle and secondary ion take off angle due to sample cracks and pores
— true concentration variations within and between fuel and gadolinia grains
— and variation of secondary ion yield due to varying properties of the sample matrix.
As a first step in data evaluation, all the raw gadolinium count rates were divided point for point by the count
rate for 1 6 0Gd. With a thermal neutron capture cross
sec-tion of 0.77 barn, it can be assumed that the original 1 6 0Gd content is not significantly changed during fuel irradiation at low burnup. This step eliminates most geo-metrical and chemical effects.
These normalized count rates were then transformed into local isotopie compositions by comparing the average SIMS values with radiochemical^ determined isotopie compositions of adjacent samples.
Fuel samples with an initial 2 3 SU enrichment of about
3.5% and G d203 concentrations of about 3 and 7 wt%
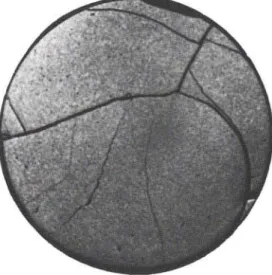
have been analyzed. The burnup values were between 2 and 6 GWd / tM. A photomacrograph of a typical sample is shown in Fig. 1.
Fig. 1. Photomacrograph of a typical cut and polished fuel cross section.
Fig. 2 shows 1 5 5Gd count rates normalized to 1 6 0Gd
from three measurements of the sample shown in Fig. 1. Datapoints along the same diameter were extracted from surface scans performed with different step widths. Shape and maximum value of all three measurements are similar. The difference between the lowest and highest value in the peak region of the curves, corresponding to values at the pin centre, is about 0.025 or less than 15% of the ap-proximate mean value of 0.2. Average values calculated
0.4-1 V re 0.3-α 0.2-tí 0.2-Ν
i
0,1-o o-l step widths: — 0.5 mm — 0 . 3 mm —0.25 mmFig. 2. Comparison of three different scans f o r radial 1 5 SG d dis-tribution. (Countrates normalized to " ° G d countrates.)
for the whole specimen surface from the same three measurements show ranges of less than 10% for the Gd
isotopes 154,155,156, 158 and 160. 1 5 7Gd is burnt out
to about 0.1 % of the original content. This illustrates that SIMS measurements are reproducible, even if the sample surface is partly cracked and porous.
Results and discussion
In Fig. 3 three-dimensional presentations of the radial l î sG d distribution are shown together with the relative
axial 1 3 7Cs distribution evaluated by
gamma-spectro-metry [3]. The 1 3 7Cs distribution is a measure of the local
fuel burnup. The three-dimensional pictures show
quali-tatively, how the width and height of the l s sG d
distribu-tion vary in funcdistribu-tion of the local fuel burnup.
For quantitative informations, this type of data presen-tation is not suitable. Quantitative information from the whole sample cross section can be displayed in contour plots. In Figs. 4 and 5 the same data as in Fig. 3 are used
to show the l s s Gd distribution in the two samples A and
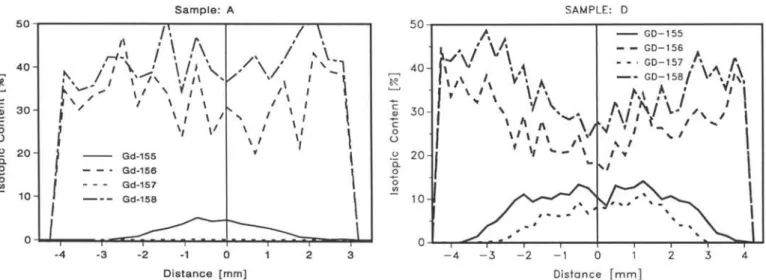
D with the highest and lowest burnup values. This type of data presentation gives information about asymmetrical burnup and the width of single nuclide distribution. If informations on more than one nuclide are to be com-pared, it is easier to extract a part of the data, e.g. along a diameter, and to plot them in line graphs as in Figs. 6 and 7. These figures show the distribution of the Gd iso-topes 1 5 5 - 1 5 8 in samples A and D along the diameters indicated in Figs. 4 and 5. The plots show how the two
isotopes l s sG d and 1 5 7Gd are converted into 1 S 6Gd and
1 S 8Gd, respectively. The conversion is caused by thermal neutron capture and starts at the periphery of the pin. The lower isotopie contents in the central part of sample D compared to the original natural isotopie abundances of
14.80% (l s sG d ) and 15.65% (1 S 7G d ) are due to resonance
reactions with fast neutrons.
Acknowledgements
GAP programme management and committee members,
e s p e c i a l l y DIDIER HAAS a n d PATRICK BLANPAIN o f B e l g o n u c l e a i r e a n d RICHARD W. STRATTON o f P S I c o n
-tributed to the success of this work with their advice and encouragement.
Sample preparation was performed by the PSI hotcell group, in particular ALBERT ERNE. We are obliged to
Evaluation of the Radial Distribution of Gadolinium Isotopes in Nuclear Fuel Pins by Secondary Ion Mass Spectrometry 11 ζ o cu I— ΙΛ rv κι Τ C/1 o > I— <
Fig. 3. Axial 1 3 ,C s distribution in a fuel pin and radial 1 5 sG d dis-tribution at different burnup levels [3].
Fig. 4. Contour plot o f1 5 5G d distribution in sample A. One con-tour interval corresponds t o a difference in isotopie abundance of
1 %. The arrow indicates the direction of the radial plot in Figure 6.
of 1 %. The arrow indicates the direction of the radial plot in Figure 7.
12 HANS-URS ZWICKY, ERNST T. AERNE, G E R H A R D BART, F E R D I N A N D PETRiKand HUGO A. THOMI Sample: A SAMPLE: D 50 4 0
-Λ
/ \ ΛI \ >\
Κ
/ ' ^
J \l>\
κ » / χ * / 1 Ν ' V / » T T —'
Λ . / \ / ό. I
f Λ / A / V/\ 40-KV
v
*,
F » / \ V \ A 1 /» Λ ~ \ / K / V V \' V - - \ / » M w G D - 1 5 5 G D - 1 5 6 - 2 - 1 0 1 Distance [mm]Fig. 6. Radial distribution of Gd isotopes 155 - 158 in sample Α Fig. 7. Radial distribution of Gd isotopes 155 - 158 in sample D
along the diameter indicated in Figure 4. along the diameter indicated in Figure 5.
References
1. SEELMANN-EGGEBERT, W., PFENNIG, G., MUENZEL, H., KLEWE-NEBENIUS, H.: Chart of the Nuclides, 5th ed., Kern-forschungszentrum Karlsruhe GmbH, 1981.
2. B A R T , G., AERNE, E. T., FLUECKIGER, U., SPRUNGER, E.: Modification of a Secondary Ion Mass Spectrometer to allow the examination of highly radioactive specimens. Nucl. Instr. and Meth. 180, 109 (1981).
3. BLANPAIN, P., BOULANGER, D.: Unpublished Work, Belgo-nucléaire (BN), Brussels, Belgium.
![Fig. 3. Axial 1 3 , C s distribution in a fuel pin and radial 1 5 s G d dis- dis-tribution at different burnup levels [3]](https://thumb-eu.123doks.com/thumbv2/123doknet/14886578.647184/3.892.213.688.136.712/fig-axial-distribution-radial-tribution-different-burnup-levels.webp)