Received: 18 July 2003 Revised: 5 November 2003 Accepted: 1 December 2003 Published online: 13 January 2004 © Springer-Verlag 2004
Abstract The aim was to propose a
strategy for finding reasonable
com-promises between image noise and
dose as a function of patient weight.
Weighted CT dose index (CTDI
w)
was measured on a multidetector-row
CT unit using CTDI test objects of
16, 24 and 32 cm in diameter at 80,
100, 120 and 140 kV. These test
ob-jects were then scanned in helical
mode using a wide range of tube
cur-rents and voltages with a
reconstruct-ed slice thickness of 5 mm. For each
set of acquisition parameter image
noise was measured and the Rose
model observer was used to test two
strategies for proposing a reasonable
compromise between dose and
low-contrast detection performance:
(1) the use of a unique noise level for
all test object diameters, and (2) the
use of a unique dose efficacy level
defined as the noise reduction per unit
dose. Published data were used to
define four weight classes and an
ac-quisition protocol was proposed for
each class. The protocols have been
applied in clinical routine for more
than one year. CTDI
volvalues of 6.7,
9.4, 15.9 and 24.5 mGy were
pro-posed for the following weight
class-es: 2.5–5, 5–15, 15–30 and 30–50 kg
with image noise levels in the range
of 10–15 HU. The proposed method
allows patient dose and image noise
to be controlled in such a way that
dose reduction does not impair the
detection of low-contrast lesions. The
proposed values correspond to
high-quality images and can be reduced
if only high-contrast organs are
as-sessed.
Keywords Pediatric CT ·
Dose reduction · Dosimetry ·
Image quality · Optimization
Francis R. Verdun
D. Lepori
Pascal Monnin
Jean-François Valley
Pierre Schnyder
F. Gudinchet
Management of patient dose and image noise
in routine pediatric CT abdominal examinations
Introduction
CT examinations represent about 2–6% of all
radiologi-cal examinations performed on adults, but contribute
27–40% of the effective dose delivered in radiology [1,
2, 3, 4]. In this context, several strategies have been
adopted by manufacturers to reduce patient dose [5 , 6,
7, 8], and the many papers devoted to CT dose
assess-ment have increased radiologists’ awareness of the high
dose level associated with CT examinations [9, 10, 11,
12]. The use of pediatric CT is increasing quite rapidly,
probably more rapidly than for adult CT, even if not used
as a first-line imaging modality in many cases. It is an
important diagnostic tool that certainly improves health
care. However, the technical parameters chosen for an
examination must be such that radiation risks are
main-tained as low as reasonably achievable for the diagnostic
intent. For a given set of machine parameters (voltage,
tube current–time product, pitch, etc.), it has been shown
that effective doses for a small infant are larger than for
an adult [13, 14, 15]. As a result, pediatric CT
acquisi-tion protocols need to be carefully controlled.
Several approaches have been used to propose image
acquisition parameters that give a reasonable
compro-mise between image quality and patient dose, some
based on the assessment of clinical data [15, 16, 17, 18]
and others on simulated data [19, 20, 21]. However,
while these studies show that it is possible to reduce the
F. R. Verdun (✉
) · P. Monnin · J.-F. ValleyUniversity Institute for Applied Radiophysics,
Grand-Pré 1, 1007 Lausanne, Switzerland e-mail: francis.verdun@hospvd.ch Tel.: +41-21-6233434
Fax: +41-21-6233435
D. Lepori · P. Schnyder · F. Gudinchet Department of Diagnostic
and Interventional Radiology, University Hospital Center (CHUV), 1011 Lausanne, Switzerland
dose for pediatric CT, there is still a need to define
ob-jectively levels of image quality adequacy.
The goal of this paper is to propose a general method
for setting dose levels for abdominal pediatric CT
acqui-sitions using CTDI test objects. We consider the CT unit
from a dose point of view, and also in terms of the
ade-quacy of the acquisition parameters for detecting
low-contrast lesions using a mathematical model observer.
Materials and methods
Dose characterization of the unit
The Multi-detector row CT (MDCT) used for this study was a four-row LightSpeed QX/I (GE Medical Systems, Milwaukee, Wis). Acquisitions were performed with a detector collimation of 2.5 mm, acquiring four slices per 360° tube rotation. For each tube voltage (kV), the normalized weighted CTDI, nCTDIw, (mGy mAs−1), was measured using the standard PMMA CTDI test objects of 16 and 32 cm in diameter [22]. Measurements of nCTDIwwere also made in air at the center of rotation of the gantry and in a PMMA CTDI test object of 24 cm in diameter designed for this study. Doses delivered during helical acquisitions were expressed in term of volume CTDI: CTDIvol=CTDIw/pitch, where pitch is defined as the table distance traveled in one rotation of the X-ray source divided by the total collimated width of the X-ray beam [22, 23]. A subscript was added to the standard notation to indicate the test object diameter in which the measurement was expressed (e.g., a CTDIvol measured in a CTDI test object of 16 cm diameter is quoted as CTDIvol,16).
Image noise characterization
The three CTDI test objects were imaged in helical mode with a pitch of 0.75, detector collimation of 2.5 mm (i.e., 4×2.5 mm), re-constructed slice thickness of 5 mm, and at tube voltages of 80, 100, 120 and 140 kV for a wide range of tube currents (i.e., 40–400 mA in steps of 40 mA) using a 360° tube rotation time of 0.8 s. The detector collimation and reconstructed slice thickness chosen correspond to the acquisition conditions used for routine pediatric abdominal examinations in our center. For each acquisi-tion, the reconstructed field of view was set equal to 4 cm larger than the diameter of the imaged CTDI test object. To assess image noise, the standard deviation of CT numbers was measured in a 300-pixel region of interest (ROI) at five locations of the test ob-ject (one measurement at the center and four measurements at 1 cm from the periphery of the test object) and an average stan-dard deviation, σ, was calculated. Measurements were performed on one image for each combination of test object and CTDIvol val-ues using the software available on the CT unit.
Compromise between noise and image noise
One possible way to set reasonable dose levels is to choose an im-age noise level and keep it constant whatever the abdominal diam-eter of the patient. Another possibility is to look at the rate at which noise decreases as dose increases, as a function of the ab-dominal diameter of the patient. From the statistics properties of quantum noise (i.e., image noise inversely proportional to the square root of dose) it appears that at some point as dose increases we start to lose in the strides we make in noise reduction. Thus, there is a dose level above which noise reduction with dose in-crease is no longer justified. To determine the adequacy of the
im-age acquisition protocol, minimum imim-age quality requirements were set by specifying the size and contrast of the structure to be detected. Only acquisition protocols allowing the detection of a low-contrast structure (i.e., having a contrast with background equal to 10 HU whatever the tube voltage used) smaller than or equal to 10 mm were accepted. This choice leads to comparable low-contrast detection requirements as the ones tested, for exam-ple, when using standard CT test objects such as the Catphan 500 (The Phantom Laboratory, Cambridge, NY) and thus assures a good level of image quality. To establish whether the acquisition protocols fulfilled the low-contrast detection constraint proposed, the Rose model observer was applied on each combination of test object and CTDIvolvalues. This model is described by the follow-ing relationship: , where CNR is the contrast-to-noise ratio (i.e., 10 HU divided by averaged standard deviation, σ) and N the number of pixels of the low-contrast structure to be detected. For structure diameter d and pixel size dimension ∆, N is given by; [24] (see Table 2). A SNR value of 5.0 was systematically adopted when using this model observer since it corresponds to a situation where detection is performed with a high confidence level.
Link between experimental results and clinical applications To relate the experimental results to clinical applications, patient weights were converted to equivalent diameter of the abdominal section using the relationship proposed by Huda et al. [19] illus-trated in Fig. 1. To reduce the number of acquisition protocols, the pediatric population was split into four weight classes: 2.5–5, 5–20, 20–35, and 35–50 kg, giving the following equivalent diam-eters: 14, 16, 20, and 24 cm.
Clinical application
The resulting protocols were applied in routine use for one year (507 standard abdominal examinations). For ethical reasons,
ac-Fig. 1 Equivalent abdominal diameter as a function of patient
quisition protocols while varying dose levels were not tested. The use of the model observer was considered sufficient to assure that image noise were sufficiently low to provide images of good diag-nostic quality. All cases were reviewed and evaluated with consen-sus by three senior radiologists (FG, DL, PS). The adequacy of image quality was determined by asking the radiologists to assess the perceived level of mottle in the CT images and to assign each examination to one of two categories:
– Inadequate for diagnosis – Diagnostically adequate
Results
For each tube voltage, a linear relationship could be
es-tablished between the
nCTDI
wand the test object
diame-ter with a regression coefficient higher than 0.990 (see
Table 1). The measured CTDI
volwith the test objects of
16 and 32 cm in diameter were systematically in good
agreement with the values indicated by the unit
(differ-ences within ±10%).
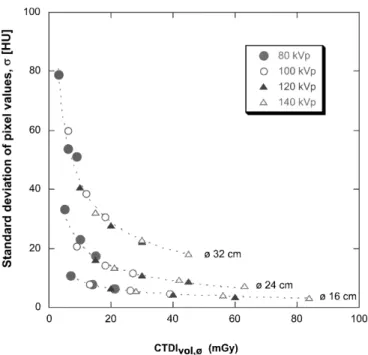
For each image acquisition condition, the mean CT
number measured in each of the four ROIs was within
the averaged standard deviation,
σ
. The relationship
be-tween the averaged standard deviation values,
σ
, and the
volume CTDI, CTDI
vol,∅, for the three test objects are
presented in Fig. 2. These data shows that a low noise
level can hardly be obtained when imaging large test
ob-jects. Figure 3 shows the derivatives, E
f, with respect to
dose, of the data presented in Fig. 2. The parameter E
frepresents the noise reduction per mGy as a function of
the CTDI
voland is a mean to evaluated the dose efficacy
in reducing image noise. This graph shows that in the
low dose range a small increase in dose allows a drastic
noise reduction, whereas in the high dose range dose
ef-ficacy becomes very low.
The diameter of a structure with a contrast of 10 HU
with background which can be detected with a high
con-fidence level according to the Rose model used in this
study was then calculated. The results obtained for each
test object are shown in Fig. 4. For each test object the
dose efficacy levels (data presented in Fig. 3) of 0.25,
0.5 and 1.0 have been added on the graph. As expected,
large differences in dose are needed to maintain the
low-contrast detection performance as the test object
diame-ter is varied from 16 cm to 32 cm.
Table 1 Fit parameters of the relationships between the nCTDIw parameter and the diameter of the CTDI test object used to per-form the measurements:
Tube voltage a (mGy mAs−1cm−1) b (mGy mAs−1) Regression
(kV) coefficient
80 −0.00223 0.103 0.998
100 −0.00365 0.182 0.999
120 −0.00555 0.282 0.999
140 −0.00789 0.401 0.999
Fig. 2 Averaged standard deviation (i.e., image noise) variations
as a function of CTDIvol in test objects of 16, 24 and 32 cm diameter
Fig. 3 Dose efficacy, Ef, as a function of CTDIvol,∅for 16, 24 and 32 cm diameter test objects. As expected there exists a range of CTDIvol,∅values where a modest increase in dose drastically re-duces image noise. It can also be shown also that in the high CTDIvol,∅range, the dose efficacy becomes very low. The hatch-marked region represents the position along the noise versus dose curve where a reasonable compromise between image quality and patient dose is expected
First option: use of a fixed image noise level
Using the data from Fig. 4 it is possible to choose an
im-age quality level in term of low-contrast detection and to
keep it constant, whatever the size of the CTDI test
ob-ject. For example, the detection of a 10-mm structure
re-quires a CTDI
vol,16of 0.4 mGy, a CTDI
vol,24of 4.9 mGy,
and a CTDI
vol,32of 25.5 mGy in 16-, 24- and
32-cm-diameter test objects, respectively. This represents a
fac-tor of almost 64 in dose between the 16- and
32-cm-di-ameter test objects. If the size of the structure to be
de-tected is decreased by a factor of 2 (i.e., d=5 mm), the
dose is increased by factors in the range of 3.1–4.0
(CTDI
vol,16of 1.6 mGy, CTDI
vol,24of 16.3 mGy and
CTDI
vol,32of 79.5 mGy). Thus, significant increases in
dose are required with increasing diameter if a constant
low-contrast detection performance requirement is
ap-plied to all test object diameters. Consequently, this
strategy seems inadequate when dealing with large
varia-tions in test object or patient diameter.
Second option: use of a fixed dose efficacy
An alternative method for finding a reasonable
compro-mise between patient dose and image noise is to choose a
dose efficacy level, E
f, and to estimate the CTDI
volthat
corresponds to that level. From Figs. 3 and 4 it appears
that an E
fvalue in the range of 0.25–1.0 HU mGy
−1of-fers a good compromise between low-contrast detection
and dose. The standard deviation and size of the smallest
lesion detectable in this range of dose efficacy are
sum-marized in Table 2. From these data it can be seen that
a 10-mm low-contrast structure can be detected in all
of the test objects with a dose efficacy value of 0.5 HU
mGy
−1. This value was chosen to define the acquisition
protocols to be used in routine clinical practice.
Clinical use
Using the diameter of children as a function of age and
making interpolation of the CTDI
vol,∅and image noise,
σ
, with a dose efficacy of 0.5, the following CTDI
vol,∅values to be applied in clinical routine were found:
– 2.5–5 kg
→
equivalent
∅
of 14 cm
→
CTDI
vol,14=
7.1 mGy (
σ
=8.6 HU)
– 5–20 kg
→
equivalent
∅
of 16 cm
→
CTDI
vol,16=
9.4 mGy (
σ
=9.4 HU)
– 20 and 35 kg
→
equivalent
∅
of 20 cm
→
CTDI
vol,20=
14.0 mGy (
σ
=11.5 HU)
– 35 and 50 kg
→
equivalent
∅
of 24 cm
→
CTDI
vol,24=
18.6 mGy (
σ
=15.0 HU)
From the data in Table 1, these CTDI
vol,∅values can be
converted into a CTDI
volmeasured in a standard CTDI
test object (16 or 32 cm) For each weight class,
Fig. 4 Diameter of the smallest structure, d (having a contrast
with a background of 10 HU), detectable according to the Rose criteria as a function of CTDIvolfor the three test objects involved in the study. The diameter, d, of the structure detectable with a high confidence level is also indicated for each test object at dose efficacy levels: Ef=1.0, 0.5 and 0.25
Table 2 Smallest diameters, d,
of a structure having a contrast with background of 10 HU, de-tectable according to the Rose criteria as a function of the dose efficacy Ef
Ef Test object CTDIvol,∅ σ(HU) ∆(mm) d (mm)
(HU mGy−1) ∅(cm) (mGy)
1.0 16 5.9 11.8 0.391 2.6 1.0 24 11.7 19.8 0.547 6.1 1.0 32 17.5 31.2 0.703 12.4 0.5 16 9.4 9.4 0.391 2.1 0.5 24 18.5 15.0 0.547 4.6 0.5 32 27.8 24.0 0.703 9.5 0.25 16 14.8 7.5 0.391 1.7 0.25 24 29.4 11.2 0.547 3.5 0.25 32 44.2 18.2 0.703 7.2
CTDI
vol,16considered to give acceptable compromises
between dose and image noise are given in Table 3
to-gether with tube voltage and tube current possible
com-binations. From the data in Table 4 it can be observed
that the CTDI
volfor routine examinations using the
pro-posed protocols is one half to one third of some of the
values reported in the literature [25, 26] but are in good
agreement with values proposed by Greess et al. [27].
None of the three radiologists involved in this study
considered that the amount of quantum mottle present in
the images necessitated an increase in patient dose. On
the contrary, images were considered of very good
quali-ty. Thus, dose levels especially for small children can be
further reduced especially when the detection of
low-contrast lesions is not of primary importance. Of the 507
examinations performed, only seven were considered
in-adequate for diagnosis. All of the rejected images had
image artifacts due to metallic implants. The remaining
500 examinations were considered adequate for
diagno-sis.
Discussion
According to the results published recently by Cohnen et
al. [28], an excellent correlation exists between effective
dose and CTDI measurements. Thus results presented in
Fig. 2 clearly demonstrate that a low level of image
noise cannot be kept constant in a wide range of patient
weight (or abdominal section diameter) without
increas-ing significantly patient dose. The use of the low-
con-trast detection constraint chosen in this paper led to
CTDI
volvalues ranging from 0.4 mGy for a 16 cm object
to 25.5 mGy for a 32 cm object. If a CTDI
volof
25.5 mGy for adults seems realistic when compared to
the reference dose level of 35 mGy proposed for
abdom-inal examinations by the CEC guidelines [29], a CTDI
volof 0.4 mGy for children appears unrealistic and could
lead to the use of the unit in a region where it is no
lon-ger quantum noise limited. For our CT unit this would
require a tube voltage of 80 kV, a tube current of 18 mA,
a 360° tube rotation time of 0.5 s and a pitch of 1.5. The
reduction of the size of the structure to be detected by a
factor of two (i.e., d=5 mm) would require CTDI
volval-ues of 1.6 and 79.5 mGy for 16- and a 32-cm test
ob-jects, respectively. While the CTDI
volobtained for the
16-cm object seems more realistic in term of machine
parameters (80 kV, 72 mA, 0.5 s and a pitch of 1.5), the
parameters obtained for the 32-cm object are certainly
inadequate. For our CT unit it would require a tube
volt-age of 140 kV, a tube current of 500 mA, a 360° tube
ro-tation time of 0.8 s and a pitch of 0.75, delivering an
ef-fective dose of about 40 mSv for a scan length of 30 cm
[29]. This clearly demonstrates that in order to maintain
a reasonable patient dose, we must accept working with
various noise levels, resulting in a situation where
low-contrast detection will depend on patient size.
If we accept that images of large patients cannot offer
the same level of low-contrast detection as images of
thin patients, the problem remains on how to propose
ac-ceptable compromises. In this study, the dose efficacy
concept was introduced and used at a level of
0.5 HU mGy
−1on the basis of results obtained from the
Rose model observer. It appears that for the unit and
slice thickness investigated this dose efficacy leads to an
image noise level of about 10 HU for children weighing
Table 3 CT acquisition parameters for routine abdominal CT as a function of patient’s weight
Parameter 2.5–5 kg 5–15 kg 15–30 kg 30–50 kg
360° gantry rotation time (s) 0.8 0.8 0.8 0.8
Pitch 0.75 0.75 0.75 0.75
Detector collimation (mm) 2.5 2.5 2.5 2.5
Reconstructed slice thickness (mm) 5 5 5 5
Proposed CTDIvol,ø(mGy) CTDIw,ø14=7.1 CTDIw,ø16=9.4 CTDIw,ø20=14.0 CTDIw,24=18.6
Corresponding CTDIvol,16(mGy) 6.7 9.4 15.9 24.5
Calculated (kV/mA) 120/32 120/45 120/78 120/120
Proposed (kV/mA) 80/90 100/70 120/80 120/120
Table 4 Comparison of the
CTDIvolvalues obtained in this study with data available in the literature
Proposed CTDIvolvalues 2.5–5 kg 5–15 kg 15–30 kg 30–50 kg
CTDIvol(mGy) (this study) 6.7 9.4 15.9 24.5
Ref CTDIw(mGy) [15]a 17 20–23 23–28 34–41
Ref CTDIw(mGy) [25] 20 20–25 25–30 –
Age classes <2 years 2–6 years 6–14 years 14–18 years
Ref CTDIw(mGy) [27] 5.6 12 14 23.5
a The
effCTDIw,16was calculated using a nCTDIw,16of 0.277 mGy mAs−1(value measured at 140 kV on our unit), a pitch factor of 0.75 and a 360° gantry rotation time of 0.8 s.
up to 30 kg and an image noise level of 15 HU for
chil-dren in the weight class 30–50 kg. According to data
published by Starck et al. [30], this corresponds to
imag-es of very good quality, since imagimag-es with a standard
de-viation of 10 HU were considered of high quality
where-as images with a standard deviation of 30 HU were
con-sidered very noisy. Thus, the dose levels proposed in this
paper can be reduced when image quality requirements
are not particularly high.
Manufacturers are developing strategies in order to
adapt tube current to the anatomy of the patient. These
strategies are generally based on the assessment of the
dose received by the detectors and allow the control of
the amount of quantum noise present in the images. On
some units the user is asked to enter the image noise
lev-el (e.g., the standard deviation value) he wants to work
with. This paper provides some hints for choosing these
levels. At the same time, manufacturers are proposing
the display of the CTDI
volcorresponding to the
acquisi-tion protocol chosen by the user. This quantity integrates
the pitch information and corresponds to the averaged
dose received in the slice. It is thus directly linked with
the amount of quantum noise present in an image.
How-ever, one has to be sure that the CDTI
volindicated by the
unit is expressed in the CTDI test object of 16 cm in
di-ameter when dealing with pediatric acquisition,
other-wise large dose underestimation would be made.
Having defined CTDI
volfor each weight class, the
tube currents were calculated from the
nCTDI
wmeasured
at 120 kV (see Table 3). Since no major beam hardening
effect is expected when dealing with small abdominal
di-ameters, a tube voltage of 80 kV was chosen for the first
weight class (i.e., 2.5–5 kg) and a tube voltage of 100 kV
was chosen for the second weight class (i.e., 5–15 kg).
This allows a slight increase of the contrast-to-noise
ratio of the acquisition and might allow us to further
reduce patient dose without reducing the detection of
le-sions [21].
To conclude, we have shown that the CTDI test
ob-jects can be used to find reasonable compromises
be-tween image noise and dose as a function of patient
weight, and that it is possible to work well below some
of the CTDI
volproposed in the literature while keeping
an acceptable image noise level. The “automatic
expo-sure systems” developed by manufacturers will be of
great help to control patient exposure especially when
dealing with the premature or neonate population where
dose efficacy is very high.
References
1. Shrimpton PC, Jones DG, Hillier MC, Wall BF, Le Heron JC, Faulkner K (1991) Survey of CT practice in the UK. Part 2: dosimetric aspects, NRPB R249. NRPB, Chilton, UK
2. Brix G, Nagel HD, Stamm G, Veit R, Lechel U, Griebel J, Galanski M (2003) Radiation exposure in multi-slice versus single-multi-slice spiral CT: results of a nationwide survey. Eur Radiol 13(8):1979–1991
3. Golding SJ, Shrimpton PC (2002) Radiation dose in CT: are we meeting the challenge? Br J Radiol 75:1–4 4. Kaul A, Bauer B, Bernhardt J,
Nosske D, Veit R (1998) Effective doses to members of the public from the diagnostic application of ionizing radiation in Germany. Eur Radiol 7(7):1127–1132
5. Giacomuzzi SM, Erckert B, Schopf T, Freund MC, Springer P, Dessl A, Jaschke W (1996) The smart-scan procedure of spiral computed tomogra-phy. A new method for dose reduction. Rofo Fortschr Geb Rontgenstr Neuen Bildgeb Verfahr 165(1):10–16
6. Kalender WA, Wolf H, Suess C, Gies M, Greess H, Bautz WA (1999) Dose reduction in CT by on-line tube current control: principles and validation on phantoms and cadavers. Eur Radiol 9(2):323–328
7. Greess H, Wolf H, Baum U, Lell M, Pirkl M, Kalender W, Bautz WA (2000) Dose reduction in computed tomography by attenuation-based on-line modulation of tube current: evaluation of six anatomical regions. Eur Radiol 10(2):391–394
8. Toth TL, Bromberg NB, Pan TS, Rabe J, Woloschek SJ, Li J, Seidenschnur GE (2000) A dose reduction X-ray beam positioning system for high-speed multislice CT scanners. Med Phys 27(12):2659–2668 9. Kearney SE, Jones P, Meakin K,
Garvey CJ (1997) CT scanning of the paranasal sinuses: the effect of reducing mAs. Br J Radiol 70:1071–1074
10. Cohnen M, Fischer H, Hamacher J, Lins E, Kotter R, Modder U (2000) CT of the head by use of reduced current and kilovoltage: relationship between image quality and dose reduction. Am J Neuroradiol 21(9):1654–1660 11. Ravenel JG, Scalzetti EM, Huda W,
Garrisi W (2001) Radiation exposure and image quality in chest CT examinations. Am J Roentgenol 177:279–284
12. Kalra MK, Prasad S, Saini S, Blake MA, Varghese J, Halpern EF, Rhea JT, Thrall JH (2002) Clinical comparison of standard-dose and 50% reduced-dose abdominal CT: effect on image quality. Am J Roentgenol
179:1101–1106
13. Huda W, Atherton JV, Ware DE, Cumming WA (1997) An approach for the estimation of effective radiation dose at CT in pediatric patients. Radiology 203:417–422
14. Chapple CL, Willis S, Frame J (2002) Effective dose in pediatric computed tomography. Phys Med Biol 47:107–115
15. Paterson A, Frush DP, Donnelly LF (2001) Helical CT of the body: are settings adjusted for pediatric patients? AJR Am J Roentgenol 176:297–301 16. Donnelly LF, Emery KH, Brody AS,
Laor T, Gylys-Morin VM, Anton CG, Thomas SR, Frush DP (2001) Mini-mizing radiation dose for pediatric body, application of single-detector helical CT: strategies at a large children’s hospital. AJR Am J Roentgenol 176:303–306
17. Wormanns D, Diederich S, Lenzen H, Lange P, Link TM, Ludwig K, Papke K, Hagedorn C, Heindel W (2001) Abdominal spiral CT in children: which radiation exposure is required? Eur Radiol 11(11):2262–2266 18. Christoph Suess C, Chen X (2002)
Dose optimization in pediatric CT: current technology and future innova-tions. Pediatr Radiol 32:729–734 19. Huda W, Scalzetti EM, Levin G (2000)
Technique factors and image quality as function of patient weight at abdominal CT. Radiology 217:430–435
20. Huda W (2002) Dose and image quality in CT. Pediatr Radiol 32:709–713
21. Boone JM, Geraghty EM, Seibert JA, Wootton-Gorges SL (2003) Dose reduction in pediatric CT: a rational approach. Radiology 228(2):352–360
22. International Electrotechnical Committee (1999) Medical diagnostic X-ray equipment—particular require-ments for the safety of X-ray equip-ment for CT; Standard IEC # 60601-2-44
23. International Electrotechnical Committee (2001) Medical diagnostic X-ray equipment—particular require-ments for the safety of X-ray equip-ment for CT; Standard IEC # 60601-2-44 amendment 1
24. Boone JM, Nelson TR, Lindfors KK, Seibert JA (2001) Dedicated breast CT: radiation dose and image quality evaluation. Radiology 221:657–667 25. Shrimpton PC, Wall BF (2000)
Reference doses for pediatric computed tomography. Radiat Protect Dosim 90(1–2):249–252
26. Frush DP, Soden B, Frush KS, Lowry C (2002) Improved pediatric multidetector body CT using a size-based color-coded format. Am J Roentgenol 178:721–726
27. Greess H, Nömayr A, Wolf H, Baum U, Lell M, Böwing B, Kalender W, Bautz WA (2002) Dose reduction in CT examination of children by an attenuation-based on-line modulation of tube current (CARE Dose). Eur Radiol 12:1571–1576
28. Cohnen M, Poll LJ, Puettmann C, Ewen K, Saleh A, Modder U (2003) Effective doses in standard protocoles for multi-slice CT scanning. Eur Radiol 13(5):1148–1153 29. Commission of the European
Communities (2000) European guidelines on quality criteria for com-puted tomography, Luxembourg EUR 16262 EN
30. Starck G, Lönn L, Cederblad Å, Forsell-Aronsson E, Sjöström L, Alpsten M (2002) A method to obtain the same levels of CT image noise for patients of various sizes, to minimize radiation dose. Br J Radiol 75:140–150