HAL Id: halshs-00727610
https://halshs.archives-ouvertes.fr/halshs-00727610
Submitted on 3 Jan 2014
HAL is a multi-disciplinary open access archive for the deposit and dissemination of sci-entific research documents, whether they are pub-lished or not. The documents may come from teaching and research institutions in France or abroad, or from public or private research centers.
L’archive ouverte pluridisciplinaire HAL, est destinée au dépôt et à la diffusion de documents scientifiques de niveau recherche, publiés ou non, émanant des établissements d’enseignement et de recherche français ou étrangers, des laboratoires publics ou privés.
The knowledge-base evolution in biotechnology: a social
network analysis
Jackie Krafft, Francesco Quatraro, Pier-Paolo Saviotti
To cite this version:
Jackie Krafft, Francesco Quatraro, Pier-Paolo Saviotti. The knowledge-base evolution in biotech-nology: a social network analysis. Economics of Innovation and New Technology, Taylor & Francis (Routledge), 2011, 20 (5), pp.445-475. �halshs-00727610�
The Knowledge Base Evolution in Biotechnology:
A Social Network Analysis.
Jackie Kraffta, Francesco Quatrarob, Pier Paolo Saviottic a
University of Nice Sophia Antipolis, CNRS GREDEG; b University of Nice Sophia Antipolis, CNRS GREDEG, and BRICK, Collegio Carlo Alberto; c INRA GAEL, and
University of Nice Sophia Antipolis, CNRS GREDEG
Abstract: This paper applies the methodological tools typical of social network analysis (SNA) within an evolutionary framework, to investigate the knowledge base dynamics of the biotechnology sector. Knowledge is here considered a collective good represented as a co-relational and a retrieval-interpretative structure. The internal structure of knowledge is described as a network the nodes of which are small units within traces of knowledge, such as patent documents, connected by links determined by their joint utilisation. We used measures referring to the network, like density, and to its nodes, like degree, closeness and betweenness centrality, to provide a synthetic description of the structure of the knowledge base and of its evolution over time. Eventually, we compared such measures with more established properties of the knowledge base calculated on the basis of co-occurrences of technological classes within patent documents. Empirical results show the existence of interesting and meaningful relationships across the different measures, providing support for the use of SNA to study the evolution of the knowledge bases of industrial sectors and their lifecycles.
Keywords: Knowledge Base, Social Network Analysis, Variety, Coherence, Industry lifecycles; exploration/exploitation
JEL Classification Codes: O33
(Received 8th December 2009, Accepted 6th December 2010)
* Corresponding author: Jackie Krafft, Email: [email protected]
2
1. Introduction
1The economic systems of advanced capitalistic societies have been facing a gradual process of transition towards the so-called knowledge-based economy. In this context the creation and utilisation of knowledge become the key factors affecting the competitiveness of firms, regions and countries (Freeman and Soete, 1997). The novelty of the knowledge based economy has often been exaggerated in two senses: (i) knowledge has always been used in every production process and in every human activity; (ii) however restricted may be the meaning that we wish to attach to knowledge, the so called knowledge based economy started to be developed in the second half of the XIXth century. What differentiates a modern knowledge based economy from a more traditional one is the process by means of which the knowledge used in production processes is generated. Starting from the mid XIXth century institutions specialized in the production and diffusion of knowledge were created. Examples of these institutions are the German, or von Humboldt, University system and industrial research and development. The process of knowledge production in these institutions differed from the more traditional one in which knowledge had always been created as a joint product of activities having a different objective, such as the production of a material output. A modern knowledge based economy is thus characterized by the growing percentage of knowledge used in production processes which comes from specialized institutions2.
In view of this, the study of the mechanisms of knowledge production has received renewed attention in the last decade, while a considerable effort is today dedicated to characterise the knowledge base of different sectors in the economy and to detect its impact on firm performance and on industrial organization (Breschi, Lissoni, and Malerba, 2003; Krafft, 2004; Nesta and Saviotti, 2005; Corrocher et al., 2007).
The paper develops an approach to technological knowledge as a collective good within an evolutionary framework. Knowledge is characterized by a high degree of cumulativeness and recombination across a number of different subunits. Knowledge is thus viewed as a retrieval-interpretative and a co-relational structure. The sectors’ knowledge base, as well as their internal structure, may be represented as networks the nodes of which are the technological classes cited in patent documents, while the link between two nodes represents the co-occurrence of the technological classes in the same patent. Some recent theories of knowledge have stressed the recombinant aspect of knowledge (Fleming, Sorenson, 2001; Olsson, 2000). Although we share the view that a very large fraction of discoveries and innovations can be created by the recombination
1 This work is part of a research project funded by Agence Nationale de la Recherche (contract
number: ANR JCJC06_141306, “Knowledge Intensive Sectors: Models and Evidence”), the Provence Alpes Côte d’Azur (PACA) Region, and the University of Nice (BQR). The authors acknowledge the
funding of Collegio Carlo Alberto through the BRICK research centre, as well as the support of CNRS through the GREDEG research centre.
2 In spite of this clearly established trend knowledge produced according to more traditional methods is still used alongside the one produced in specialized institutions. Thus, the operational definition of knowledge that we propose in this paper cannot establish a demarcation between scientific and non scientific knowledge but needs to be generally applicable to all the types of knowledge which can be combined in human activities.
3
of existing ideas, we think that not all the examples of genuine novelty can be originated by recombining existing knowledge. The network based representation of knowledge we propose in this paper can accommodate both views: genuine novelty will be represented by the emergence of completely new nodes while the recombination of existing ideas can be represented by the creation of new links between existing nodes This paper aims at applying the methodological tools of SNA to the analysis of the structure of knowledge bases and of their evolution over time, so as to identify their usefulness in the identification of the emergence of discontinuities in the technology lifecycles. We will also see that SNA tools capture the transition of technological activities from exploration to exploitation strategies characterized by organized search rather than random screening. To this purpose we will compare the results obtained by applying SNA with those of previous research.
We will focus on the dynamics of knowledge bases within one specific knowledge-intensive sector along the 1980s and 1990s, i.e. biotechnology, and on its relationship with its lifecycle. The analysis is conducted by using information contained in patent applications submitted to the European Patent Office (EPO), which are drawn by the Espacenet database. In doing this we do not neglect the essential distinction between knowledge and information. At a conceptual level, patents are more likely to be considered as representations of the inventors knowledge than stricto sensu knowledge themselves. However, we follow previous empirical studies that highlight the usefulness of patents as measures of production of new knowledge, beside R&D intensity, or other measures of innovation output (Acs et al., 2002; Griliches, 1990). We use the EPO data to map the frequency of co-occurrences of technological classes within patents and to calculate a number of indexes, i.e. information entropy, knowledge coherence and cognitive distance, on the one hand, and network density, degree, closeness and betweenness, on the other hand.
Our results show the existence of interesting and meaningful similarities between the two sets of empirical indicators with reference both to the relative levels of the variables and their evolution over time. Such similarities allow us to link the evolution of SNA measures to the different phases of lifecycles the industry underwent in the period of observation.
The rest of the paper is organized as follows. In Section 2 we set out the theoretical (2.1) and the empirical (2.2) backgrounds and then elaborate the working hypotheses (2.3). In Section 3 we describe the dataset and the methodology. Section 4 provides the empirical results of the analysis. Section 5 outlines the conclusions.
2. Theoretical framework
2.1. A general representation of knowledge
In spite of the recognized importance of knowledge as a potential determinant of growth, economics has not yet developed an adequate representation of knowledge
4
comparable to that of physical capital. Past attempts to measure and to model knowledge have included the use of patents and publications either as indicators of knowledge production or as inputs to a knowledge production function (Griliches, 1979 and 1990; Narin, 1994). While these attempts were important and they contributed to improve our understanding of the economics of knowledge, they relied on traces and not on actual measurements of knowledge itself. To proceed beyond this stage we need an adequate conceptual definition and representation of knowledge itself. In the past such a task has been attempted by philosophers and epistemologists. The emergence of knowledge based society changes the boundaries of economic phenomena and forces economics to include fundamental considerations about knowledge.
The representation of knowledge which is required in economics must allow us to treat in a comparative way the various types of knowledge which are created and used in different institutions, ranging from public research organizations to private firms. By establishing a continuity amongst these different types of knowledge economics would then pursue the opposite approach with respect to epistemologists attempting to find the demarcation between science and other forms of knowledge. Moreover, improving our economic understanding of knowledge certainly requires going beyond the traditional representation of knowledge as an homogenous stock.
The representation we require can be based on a number of properties of knowledge. These properties can be the following ones (Saviotti, 2004, 2007):
(i) Knowledge is a co-relational structure
(ii) Knowledge is a retrieval or interpretative structure
According to (i) knowledge establishes co-relations, or connections, between variables or concepts. According to (ii) knowledge allows us to recover types of knowledge similar to those we already knew endowing us with an absorptive capacity for them (Cohen and Levinthal, 1990).
From these two properties we can deduce that knowledge can be represented as a network the nodes of which are variables, connected by links determined by the joint utilisation of different variables. New knowledge stems from the creative recombination of heterogeneous bits of knowledge, which are fragmented and dispersed among economic agents. The set of the elements (nodes) and their interactions (links) making up the network can be defined as the structure of the knowledge base, which is characterized by a specific architecture at each point in time. This is in turn both an effect and a determinant of the interactions among agents involved in the collective process of knowledge creation (Krafft and Quatraro, 2011). Agents are hardly aware of the architecture of the knowledge network, and there is by no means any agent able to command all the relevant knowledge on the topology of the technology space. The combination of the different bits of knowledge yields results, i.e. the architecture of the
network, which “if they were brought about deliberately, would require a knowledge on
the part of the directing mind which no single man can possess” (Hayek, 1937: p.52). A network has a number of properties. For example, the emergence of new concepts and variables, leading to the creation of new nodes, is likely to affect network density
5
unless the rate of creation of new links is equal to the rate of creation of new nodes. In general we can expect these two rates to differ systematically during the different phases of the life cycle of a given knowledge type (Saviotti, 2009). Knowledge establishes connections between variables, provided these variables exist. Thus, we expect the creation of new nodes to precede the creation of at least a part of their link: new and still poorly connected nodes will emerge during the early phases of a discontinuity and the rate of creation of links will pick up later during the normalisation or maturation phase. Network density could then be expected to fall at the emergence of a discontinuity and to rise during the subsequent maturation of knowledge. If we consider the network of knowledge in its entirety, given the above described dynamics of the creation of nodes and of links, we can never expect it to be completely connected. New variables are likely to be created in different regions of knowledge space, corresponding to different disciplines, before all the possible connections are established. In other words, the rates of creation of new nodes in the network of knowledge cannot be expected to coincide at all times with the rate of creation of links. As a consequence network density becomes a relevant variable to characterize the dynamics of knowledge.
The structure of knowledge network may therefore be regarded as an emergent property stemming from qualified interactions among innovating agents. As such, its architecture is likely to change in the course of time. We can expect the evolution of the network of knowledge to occur in a number of ways, from an initial discontinuity to the recomposition of a new network: (i) new concepts and variables, which will be represented as new nodes, emerge; (ii) some old concepts and variables become extinct; (iii) new connections are established between new or old concepts and variables, giving rise to corresponding new links; (iv) the relative weight of old and new nodes and links changes in the course of time.
2.2. Previous research
In what follows we will briefly recall the findings of previous research and we will focus on a different type of approach to the evolution of knowledge based on SNA. In an earlier paper (Grebel, Krafft, Saviotti, 2006) we had linked the emergence of a discontinuity to the onset of a phase of random search, which would have been followed by one of organised search as the new knowledge stated maturing. Likewise we could expect the emergence of a discontinuity to shift the type of search activities towards exploration while the subsequent period would shift search activities towards exploitation. This is a further clarification of the famous distinction exploration versus exploitation by March (1991).
We can view these concepts as corresponding to a life cycle, beginning with the emergence of a new type of knowledge (birth) and continuing with the gradual maturation of the same knowledge until this became part of a scientific or technological routine. In a previous paper (Krafft, Quatraro, Saviotti, 2009) we pointed out that these concepts are extremely powerful focusing devices for the study of the dynamics of knowledge, but that they also require important analytical refinements. Using some measures of knowledge properties such as variety, coherence and cognitive distance, we
6
showed that these properties can provide us with a more accurate representation of the dynamics of knowledge, also more realistic than the simple use of concepts such as paradigm, exploitation and exploration, random or organised search.
The possibility to represent knowledge as a network provides an adequate conceptual foundation for the study of processes of knowledge generation and utilization in firms and industries. To identify all the variables and the connections present in the knowledge base of a firm at the lowest possible level of aggregation would be a prohibitively expensive task. An approximate version can then consist of identifying relatively 'small' units of knowledge and their connections. We identify these 'small' units within the traces of knowledge which have been used so far, such as patents and publications.
At the level of the firm the knowledge base (KB) can be defined as the collective knowledge that firms can use to achieve their productive objectives. The collective character comes from the interactions between individuals, research units and departments of the same firm or research organization. Such interactions are specific to each organization and can be expected to lead to a different knowledge time path even in the case in which the initial competencies of all the persons employed were the same. When we want to study the knowledge base of an industrial sector or of a field of science such collective character of course includes inter organizational interactions. The KB of a firm can be mapped by identifying the units of knowledge composing it and by their connections or links. These units can be either technological classes or themes. Connections are determined by the joint utilization of the units in particular texts, be they patents, papers or something else. For example, if we use technological classes the connections are given by the co-occurrence of different classes in the patents used, and the frequency of co-occurrence can be interpreted as a measure of the strength of the link. In this way we can construct visual maps of the KB of a firm and follow the evolution of such KB in the course of time. These maps of the KB can be considered a representation of the brain of the firm.
In order for these maps not to be purely descriptive devices we need to identify some general properties of the knowledge base which can be measured and used both in empirical studies and in modelling. The three properties of the KB which were used in previous research are its variety, related or unrelated, its coherence, and its cognitive
distance.
The variety of a KB measures the extent of its diversification, with related variety
measuring it at a lower level of aggregation and unrelated variety at a higher level of aggregation (Frenken et al, 2007). Technological variety can be measured by using the information entropy index. It was introduced by Shannon (1948) to measure the information content of messages, and can be used as a distribution function in a number of circumstances (Theil, 1967, Frenken 2006). The use of information entropy to measure variety is based on the rise in the information content of systems as the number of their distinguishable components increases: a system with a large number of distinguishable components requires more information to be described than a system with a smaller number of distinguishable components.
7
The information entropy index has interesting features, like its decomposability into a between-group and within-group component, and the extension to multidimensional cases. According to the latter, one may calculate the variety of the actual combinations of technological classes in a given context (say a firm or a sector). The former property allows for the operationalization of the distinction between related and unrelated variety. One could say that related variety (within-group entropy) measures diversification at a local level, or within a technological class, while unrelated variety (between-group entropy) measures diversification at a more global level in a knowledge space. The important implication of this distinction is that while a growth in unrelated variety implies a rise in cognitive distance, a growth in related variety is compatible with a more incremental development and even a fall in cognitive distance.
The coherence of a KB measures the extent to which different types of knowledge can
be combined. This is of a fundamental importance since the types of knowledge required by firms to create new products or services are not necessarily found within a discipline, but need to be combined to produce the desired output. The ability of firms to combine these different types of knowledge is not constant but can be expected to vary systematically during particular phases of the evolution of knowledge. For example, we can expect the ability of firms to combine different types of knowledge to fall as a completely new type of knowledge emerges at a discontinuity and to rise again as the new type of knowledge starts maturing. The coherence of the knowledge base can be calculated by modifying a procedure developed by Teece et al (1994) to measure the coherence in the output of a firm. The basic principle underlying the calculations is that the higher the frequency with which different technologies are used together by a firm the more coherent is its knowledge base. The calculation proceeds by first calculating the frequency of co-occurrence of each pair of technologies in the KB and then by averaging them over the whole firm, or sector in the present case (see Nesta Saviotti, 2005, 2006 and Krafft, Quatraro, Saviotti, 2009).
Cognitive distance measures the extent of discontinuity involved in the emergence of a
new type of knowledge. It is the inverse of an index of similarity. This measure is of fundamental importance to be able to distinguish the effect of the emergence of a discontinuity from that of the subsequent period of normal or incremental development. There are many ways to calculate cognitive distances but we used the complement of the index of similarity proposed by Jaffe (1989).
Even in a knowledge based economy firms are not predominantly knowledge producers but use knowledge in order to achieve new products and services with which they compete. We can find out whether knowledge production is determinant of firm performance by measuring a number of properties of their KB and by using these measures as independent variables in econometric studies in which some measure of firm performance is the dependent variable. Studies of this type have shown that the coherence and the differentiation of the KB of pharmaceutical firms affect both their technological (Nesta, Saviotti, 2005) and their stock market performance (Nesta, Saviotti, 2006). The role played by knowledge creation and utilization in firm performance varies according to sectors but it is not unique to any sector (Nesta, 2008). In Grebel et al. (2006), the hypothesis was that any discontinuity in knowledge would be systematically associated with the transition from random to organised search. In
8
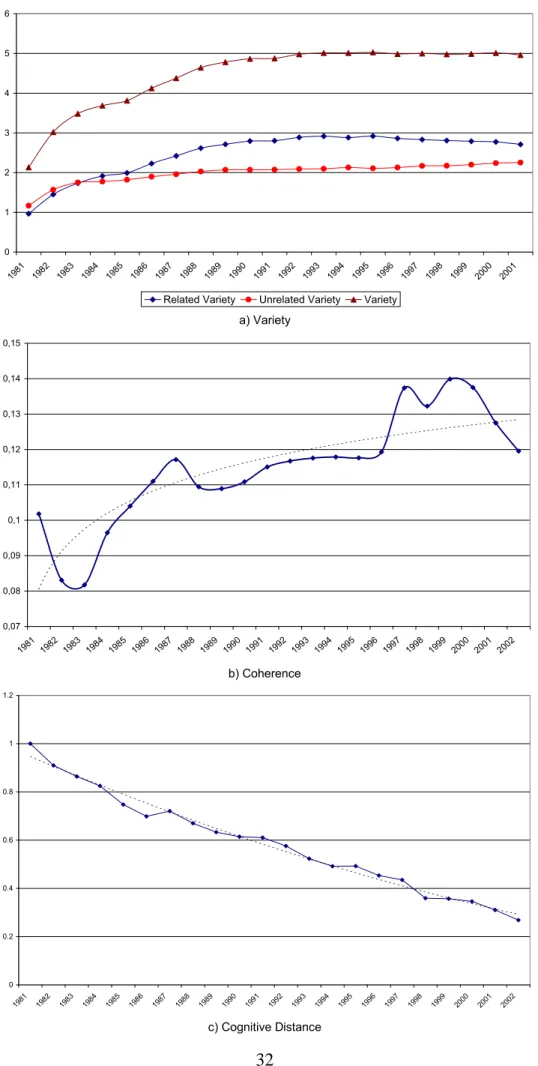
Krafft, Quatraro, Saviotti, (2009), it has been pointed out that, although the existence of such a transition could broadly be confirmed, its interpretation required the greater subtlety which could be obtained by the use of the above properties of knowledge. In this perspective, we found that that the technological variety of biotechnology rises during the period 1981-2003 (Fig. 1a). Unrelated variety dominates between 1981 and 1983 and related variety becomes dominant between 1983 and 2003. Moreover, the rate of growth of variety falls for most of the period of observation until it becomes constant from the early 1990s, with the possible exception of the mid 1980s. In 1985 the rate of growth of variety starts rising in correspondence with the overtaking of unrelated variety by related variety. In our case while in the early 1980s the unrelated variety was higher than the related, the situation was reversed starting from 1985. This would suggest that, while in the very early phases of the emergence of modern biotechnology most of the new knowledge was coming from outside the knowledge base previously used, starting from 1985 internal (to the sector) sources of knowledge differentiation became more prominent. However, it must be observed that starting from the mid 1990s a trend began to the convergence of related and unrelated variety. This trend is likely to be caused by the emergence of a second generation of biotechnology linked to bioinformatics, a new type of competence coming from a discipline different from biology.
INSERT FIGURE 1 ABOUT HERE
Coherence starts with a very low value in 1981 and rises, although with some fluctuations, during the whole period of observation (Fig 1b). In this case as well as in all the other measures of properties of the knowledge base we can distinguish within the overall changes a trend and superimposed deviations. The deviations are probably due to a combination of real events affecting the dynamics of knowledge and of noise due to the quality of the data. Thus, we cannot expect all the deviations to be easily interpretable. Both variety and coherence show an overall positive trend accompanied by superimposed deviations. In particular, there are two periods of fast rise in knowledge coherence, beginning in 1982 and in 1995 respectively. The first of these deviations from the trend seems to be closely related to the ratio of related to unrelated variety. When unrelated variety is greater than the related one, in the period 1981-1982, the coherence index falls. It then begins to increase in 1983 when related variety overtakes unrelated variety. The subsequent rise in 1997 cannot be explained in the same way. However, it can be observed that the two rises in knowledge coherence seem to coincide with the onset of the absorption of two different generations of biotechnology, based on recombinant DNA and on genomics respectively, by incumbent firms (Saviotti, Catherine, 2008). The transition between the two generations led to a discontinuity in the pattern of inter-firm alliances: within each generation the number of alliances followed a lifecycle, increasing first, reaching a maximum and then declining. The competencies required in the two generations differed as bioinformatics acquired a key role in the sequencing of genomes.
Taking this into account we can interpret the overall rising trend in knowledge coherence as due to the growing relative similarity, or low cognitive distance, of the new types of knowledge which incumbent firms needed to learn. The deviations with
9
respect to the trend could be explained by the emergence of new generations of biotechnology and/or by the ratio of intra to inter group variety. As a new generation of biotechnology emerges the overall trend is not reversed but deviations can occur due to the however limited cognitive distance that the new generation introduces. This line of explanation is not incompatible with the one based on the ratio of related to unrelated variety. We can assume changes in related variety to involve a more limited change in coherence than those in unrelated variety because the former can be obtained by recombination and differentiation of the same concepts while the latter are more likely to involve the introduction of completely new concepts. In other words, a rise in related variety is likely to involve a lower extent of knowledge discontinuity than an equivalent rise in unrelated variety and to lead to lower fall in coherence. Conversely we can expect changes of generation within one technology (e.g. biotechnology) to raise the ratio related/unrelated while the emergence of a completely new technology can be expected to lower the same ratio. However, in some cases the situation can be more complex. In this context the transition between the two generations of biotechnology involved two contrasting trends: the second generation shared the same basic biological concepts with the first generation but required the use of competencies and concepts in bioinformatics which were new to biologists and which came from another discipline. We can expect the first trend to raise both related variety and coherence and the second to reduce both of them. What we observe is then the result of a trade-off between the two trends described above. This interpretation is compatible with (i) the tendency to the convergence of related and unrelated variety beginning in the mid 1990s and (ii) the slow down in the rate of growth of coherence between 1988 and 1996 followed by a rise in coherence beginning in 1997, which could be due to the maturation of the second generation of biotechnology.
Cognitive distance falls during the whole period of observation (Fig 1c). These results can be interpreted as the consequence of the knowledge discontinuity which occurred in the early 1970s with the emergence of what is called 3rd generation biotechnology, linked mostly to the first industrial applications of molecular biology. We expect this knowledge discontinuity (i) to have raised the technological variety of biotechnology using firms (then mostly pharmaceutical and agrochemical) by adding to their KBs new technological classes, (i) to have initially reduced the coherence of the same firms since the new technological classes were initially poorly connected to the pre-existing ones, (iii) to have initially raised the cognitive distance by adding new technological classes which were very dissimilar from those previously used by incumbent firms. We expect these phenomena to have occurred immediately after the onset of the knowledge discontinuity, a period corresponding to random search or to exploration, but for which unfortunately we have no data. The evolution that we can trace in Fig 1 corresponds to the beginning of the maturation of biotechnological knowledge. The process of diversification of the KB proceeds but it shifts away from the more radical innovations corresponding to unrelated variety to the more incremental and local ones corresponding to related variety. Contrary to what would have occurred if variety had remained mostly unrelated, coherence can now start rising and cognitive distance can now start falling as the process of knowledge diversification occurs by the more incremental and local changes corresponding to related variety. These findings confirm that the emergence of a knowledge discontinuity starts a life cycle in which initially unrelated variety and cognitive distance rise and coherence falls. In the subsequent part
10
of the life cycle unrelated variety rises to become dominant, coherence rises and cognitive distance falls.
It is important to point out that without the distinction between related and unrelated knowledge variety the simultaneous occurrence of rising overall variety, rising coherence and falling cognitive distance would have been very difficult to explain. The distinction between related and unrelated variety turns out to be as fruitful in the study of structural change in knowledge as it is in the study of structural change in economic systems (see Frenken et al, 2007; Saviotti, Frenken 2008). This is a further example of the greater subtlety that we can achieve by means of our measures of properties of knowledge.
2.3. Knowledge networks
In this section we adopt a more explicit network approach to the representation of the KB. We consider knowledge as an integrated system, in which both the constituting elements and the connections amongst them deserve to be investigated. The representation of the KB as a network enables us to better appreciate the dynamics of the emergence of new knowledge types by monitoring the changes in nodes and links. If we allow the nodes to represent technological classes and the links to represent the interactions of technological classes within the same patent, the dynamics of network density provides useful evidence about the relationship between the growth of technological classes and the growth of the corresponding links.
As we said above, it is reasonable to expect the increase in technological classes not to be followed immediately by a proportionate increase in the links among them. This leads us to expect network density to fall over time when the growth rate of the variety of technological classes is higher than the growth rate of the variety of connections. The rate of creation of nodes at the onset of a discontinuity can be expected to be higher than the rate of creation of links. However, this trend cannot persist indefinitely. New nodes cannot continue to be isolated or poorly connected since the production of artefacts requires the joint utilisation of several types of knowledge, which are then by definition complementary. The full exploitation of the new knowledge types requires an increase in the number of links per node. This increase can be expected when the rate of creation of new nodes slows down, possibly even to zero, but we cannot exclude that it can happen even if the number of technological classes, and thus of new nodes, keeps increasing.
In fact, this is a situation that could not be easily based on simple dichotomies such as exploration/exploitation or random/organised search, but that our quantitative approach to the properties of knowledge allows us to articulate better. New nodes can represent types of knowledge radically or slightly different from the existing ones. The latter situation would occur, for example, when the new types of knowledge are obtained by specialisation of pre-existing ones with which they would share the basic concepts. These two situations can be distinguished by their cognitive distance: the emergence of radically different nodes would correspond to a high cognitive distance while that of slightly different nodes would correspond to a low cognitive distance. We can also expect the construction of links between radically different nodes to require a greater
11
effort and a longer time than the construction of links between slightly different nodes. In this respect the distinction between related and unrelated variety is extremely useful: when related variety dominates we can expect the number of links to grow at a rate comparable to or even higher than that of the number of nodes while the number of links would always grow at a lower rate than the number of nodes when unrelated variety dominates. Different types of nodes can generate different cognitive distances depending on whether they are slightly or radically different from pre-existing nodes. In addition to network density, the toolbox of SNA contains also interesting measures to characterize the relative weight of nodes, and hence of technological classes, and the
related changes over time. Such measures are referred to as ‘centrality measures’. Out
of these, the degree, the closeness and the betweenness are the most commonly used. The concept of centrality refers to the relative importance, or weight, of a node within a network. Different measures of centrality are available depending on whether one wishes to measure it at the local or at the global level within the network. Degree centrality is the most local of these measures as it is based on the relative number of links of a node with its neighbours. Closeness builds upon the geodesic distance of a node from all the other nodes in the network. Should a node be directly connected with every other node, its closeness centrality would be very high. It is straightforward that high average levels of closeness are likely to correspond to high average levels of degree. Betweenness measures the relative importance of a node over the whole network. It builds upon a triadic relationship, according to which a node is central as long as it represents a kind of unavoidable stop in the paths connecting any other pair of nodes in the network.
Empirical observations of the knowledge base of firms show that at any time the distribution of nodes around links is very uneven (Saviotti, 2009). Some types of knowledge are relatively more important than others. There is no a priori reason to expect sectoral knowledge bases to behave differently. When a discontinuity emerges we can expect a fall in network density but the evolution of the structure of the network is more difficult to predict. Some old nodes, including important ones, are going to disappear and new nodes are going to emerge, some of which will become important. We have already described this as an example of structural change in knowledge. However, it is more difficult to say whether the number of important nodes is going to rise or to fall since it depends among other things on variety of the knowledge base. When more new nodes emerge than old ones disappear the number of important nodes is likely to grow. We can see this problem as the analogue of industrial concentration: in most cases the distribution of the centrality of nodes will resemble an oligopoly, with few nodes having many links and being very central and with the majority of nodes having a low centrality. The evolution of both centrality and of average centrality measures is difficult to predict since it depends on the combination of a number of factors including the growth in the number of nodes, the growth in the number of links, the rate of growth of variety, the ratio related/unrelated variety, cognitive distance etc. In this paper we map and measure the KB of sectors rather than of firms. In this case the KB we map depends on inter-individual and inter-organizational interactions both at the intra- and at the inter-firm level. Since the sector is a population of broadly comparable firms to have a complete representation of it we would need to measure both the means and the distribution of the properties of the KB within the population. For reasons of
12
space in the present paper we describe only the patterns of evolution reflecting the behaviour of the average or representative firm.
On the basis of the previous considerations we can now formulate the following three propositions:
P1: The emergence of a discontinuity in a type of knowledge suitable to become the future knowledge base of a sector leads to the sequence of the two periods of random search first occurring in the exploration phase, and of organized search later in the exploitation phase.
P2: During the random search period we expect overall knowledge variety to rise and to be dominated by unrelated variety, coherence to fall and cognitive distance to rise. As the maturation of the new technology subsequently begins we expect variety to keep rising or falling but to be dominated by related variety, coherence to rise and cognitive distance to fall.
P3: At the onset of a knowledge discontinuity we expect the rate of creation of new nodes to exceed the rate of creation of new links and the density of the network of knowledge to fall. As the maturation of the new technology subsequently begins we expect the rate of creation of new links to start exceeding the rate of creation of new nodes and the density of the network of knowledge to start rising (Saviotti, 2009).
For the time being, it is very difficult to make any predictions about the time path of the various centrality measures or about the evolution of the structure of knowledge. We will come back to this point in the discussion of our results.
Before concluding this section let us remark that a knowledge discontinuity has very important implications for the management of a firm which uses this knowledge. The more dissimilar the new knowledge is with respect to the firm's previous KB, the lower the absorptive capacity of the firm for it will be with its present human resources. In order to internalize the new knowledge the firm would need to hire completely new human resources familiar with the new knowledge and probably to lay off a large part of its existing human resources which has now become redundant. Needless to say, this is neither an easy operation nor one which can be carried out at great speed. Furthermore, the larger the incumbent firm the more difficult this transformation of its knowledge base and of its human resources is likely to be. This would at least partly explain the emergence of dedicated biotechnology firms (DBFs) and the formation of innovation networks with large diversified firms.
Summing up, in biotechnology the research leading to the creation of a new discipline (molecular biology) began in the 1930s and the critical events which catalysed the first industrial applications only occurred in the early to mid 1970s (1972 recombinant DNA, 1975 monoclonal antibodies). In order to adequately study the evolution of knowledge in biotechnology our data would have needed to cover most of the 1970s. Given this limitation we have to infer what is likely to have happened before the beginning of our period of observation. In the case of biotechnology, based on the very low initial value of both variety and coherence and on the fact that coherence was still falling at the
13
beginning of the period of observation, we expect unrelated variety to have been greater than related variety during all of the 1970s and until 1983. Thus, the 1970s would have been the period when the discontinuity in biotechnological knowledge constituted by the adoption of molecular biology would have first manifested itself and the 1980s the period during which the new knowledge started to be adequately integrated into the knowledge base of biotechnology using firms. We can interpret this transition as being related to the one from exploration to exploitation. In the following section we draw new results on the basis of the SNA methodology and compare them to the trends obtained so far in terms of variety, coherence and cognitive distance.
3. Data and Methodology
3.1. Measurement of the knowledge base
The information concerning patent applications required to test the working hypotheses formulated in Section 2 has been obtained from the Espacenet data base provided by the European Patent Office3. The initial dataset consisted of 2,659,301 items, including both EU and Worldwide applications, over the period 1978 – 2005. The analysis thus focuses on the subset of patent applications concerning the biotechnology sector, which has been identified by merging the classifications set up by the OECD and by the French
Observatoire des Sciences et des Techniques. We adopted these classifications to
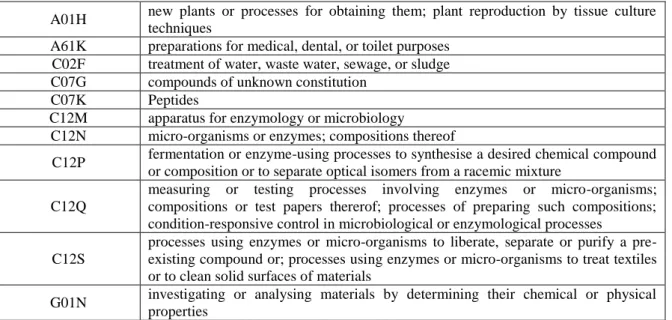
establish some tentative boundaries for the biotechnology sector, although we acknowledge that in some cases these classifications leave some important classes out. Our search strategy is based on queries reporting the IPC classes that define biotechnology. Taking into account these elements, it resulted that the sector includes 11 IPC classes, reported in Table 14.
INSERT TABLE 1
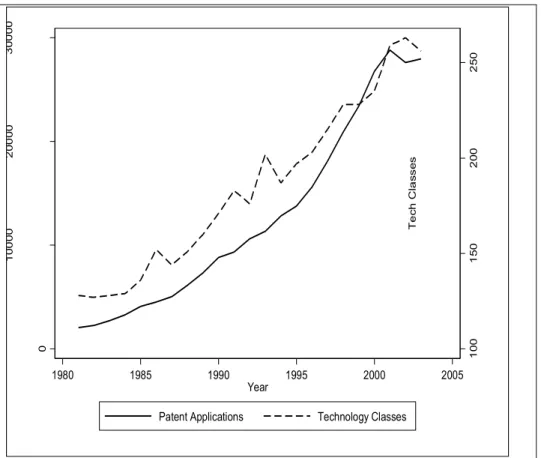
The total number of patent applications in the biotechnology sector amounts to 321449. Figure 2 represents the dynamics of patent applications, by considering the 5-year cumulated number, and the related number of observed technological classes. It is clear that the number of patent applications (on the left y-axis) increased over the entire period at an increasing rate, showing no discontinuities in the series. The evidence
3 We consider thus patent applications as the best indicator of firms knowledge bases, though the usual caveats mentioned in the literature may apply. We use these data to map the frequency of co-occurrences of technological classes within patents and to calculate a number of indexes, i.e. information entropy used to measure related and unrelated variety, knowledge coherence and cognitive distance.
4 Though the use of IPC classes to define sectors’ boundaries may present some drawbacks, as
they are function-oriented (Corrocher et al., 2007), the merging of two classifications allows our study to be much more inclusive than many other studies, and reduce the risk of neglecting important classes. It is worth noting that these classes include quite different technologies and processes, which might be placed at different stages of an ideal filière of the knowledge production process. This is a potential source of misunderstandings or misinterpretation of our results, due to the fact that one could claim that classes in certain stages of such filière are more likely to be central than classes impinging upon other stages. However, given the interactive nature of the knowledge creation process, this may help more the discussion of empirical results than the ex-ante formulation of expectations.
14
concerning technological classes is slightly different (on the right y-axis). The rate of growth indeed appears to be slower than in the case of patent applications. Moreover, the pattern of evolution over time presents almost regular discontinuities in 1986, 1991, 1994 and 1999.
INSERT FIGURE 2 ABOUT HERE
The number of technological classes may be considered an approximate measure of diversity. It is to be observed that the informational entropy function which we used to measure technological variety measures in fact a combination of variety and balance since it is affected by both the total number of classes and by the extent of their diffusion. On the other hand, the informational entropy function cannot take into account disparity (Stirling, 2007). Disparity is the most difficult component of diversity to measure since it refers to the extent of intrinsic difference between two entities. One could argue that to measure disparity is impossible since it would amount to provide a quantitative estimate of qualitative change. In general we would expect radical innovations to have a greater disparity than incremental innovations. However, we do not have a criterion to compare the disparity of two different radical innovations. The distinction between related and unrelated variety helps us in this respect since it defines two sets knowledge with different disparity, higher for unrelated variety and lower for related variety.
The slower rate of change of the number of technological classes relative to that of patents can be interpreted as a sign of the growing maturation of biotechnological knowledge. This finding corresponds well to the declining rate of growth of technological variety occurring in the second half of the 1990s. The observed discontinuities are likely to be linked to changes in the internal structure of the knowledge base. Changes of this type occurred during our period of observation. In the rest of the paper we combine two different approaches to study the knowledge base of the biotechnology sector. On the one hand, we take into account the results obtained by measuring properties of knowledge such as variety, coherence and cognitive distance. The measurement of these properties was implicitly based on knowledge being represented as a network but it did not explicitly use SNA. On the other hand, we explicitly mobilize SNA in the field of economics of knowledge. The emphasis of this method rests on the architecture of networks and on the characterization of each node with respect to the other ones. Plenty of applications can be found in the economic literature, above all in the study of interactions among different kind of agents within industrial and technological districts (Morrison, 2008; Giuliani, 2007). To our best knowledge, there are no attempts to apply this methodology to the investigation of the recombinant dynamics underlying knowledge generation and utilization5.
In this context, we can think of nodes as technological classes, whereby a link between two nodes represent the co-occurrence of technological classes within the same patent.
5
It is fair to note that a similar approach has been attempted at the firm level by Yayavaram
15
The network of relationships among the nodes provides an image of the internal structure of the knowledge base of the sector under scrutiny, i.e. biotechnology. Given a dataset of patent applications, one may represent the evolution of the knowledge base by deriving a network for each observed year, and calculating the relevant indexes accordingly. This allows us to characterize technological classes according to their relative position in the structure of the knowledge base, and to investigate the pattern of change over time. We will present the main concepts and indicators typical of SNA in Section 3.2, along with a proposed interpretation in terms of knowledge-related dynamics.
The usefulness of SNA for the investigation of the dynamics of knowledge bases can be better appreciated by directly comparing the two approaches, and emphasizing differences and similarities between the two sets of indicators. We accomplish this task in Section 4, in which we present the results of our calculations.
3.2. Social Network Analysis6
A network may be defined as a graph made of nodes that are tied each other by one or more types of interdependency. Relationships among nodes are expressed by arcs, which in turn may be directed or undirected. Two nodes that are connected by a line are said to be adjacent to one another. Adjacency is therefore the graphical expression of the fact that two nodes are directly related or connected to one another. The points to which a particular point is adjacent are termed its neighbourhood.
Points may be directly connected by a line, or they may be indirectly connected through
a sequence of lines. It may be thought as a ‘walk’ in which each point and each line are
distinct. This is called path. The length of path is measured by the number of lines that constitute it. The distance between two points is the shortest path (the geodesic) that connects them.
One of the most widely used measures to describe a network is the density. It describes the general level of linkage among the points in a graph. The density of a network is therefore defined as the total number of actual lines, expressed as a proportion of the maximum possible number of lines:
2 / ) 1 ( n n l (1)
A network is complete when all the nodes are adjacent, and the measure of density attempts to summarize the overall distribution of lines in order to assess how far the network is from completion. Density depends upon two other important parameters of the network, i.e. the inclusiveness and the sum of the degree of its points. Inclusiveness can be defined as the share of network nodes that are not isolated, i.e. the share of nodes that are connected to at least another node. For example, in a network of 20 nodes with
16
5 isolated nodes the inclusiveness is 0.75. The more inclusive the graph, the more dense the network will be.
However some nodes will be more connected than other ones. The degree of a node is an important measure of centrality that refers to the total number of other points in its neighbourhood. Formally one can represent the degree by the following equation:
v V s vs x v D )( (2)This measure is obviously biased by the network size. Therefore it is useful to use a standardized measure, which consists in dividing the degree measure by its maximum value as follows: 1 ) ( ) ( n v D v ND (3)
The higher the degree of the connected points in the network, the higher will be the density. For this reason the calculation of density needs to take into account both measures. It should compare the actual number lines present in the graph with the total number of lines that the graph would show if it were complete.
While the density describes the network as a whole, the measures of centrality refer to the relevance of the nodes belonging to the network. A point is locally central if it has a large number of connections with other points in its immediate environments, i.e. other points in its neighbourhood. Global centrality refers instead to the prominence of the node with respect to the overall structure of the network. Measures of global and of local centrality have a different meaning.
Measures of global centrality are expressed in terms of the distance among various points. Two of these measures, i.e. closeness and betweenness, are particularly important. The simplest notion of closeness is that calculated from the ‘sum distance’, the sum of geodesic distances to all other points in the graph (Sabidussi, 1966). After having calculated the matrix of distances among the nodes of the network, the sum distance is the row of column marginal value. A point with a low sum distance is close to a large number of other points, and so closeness can be seen as the reciprocal of the sum distance. Formally it can be expressed as follows:
v V t dGvt v C ) , ( 1 ) ( (4)Where the denominator represents the sum of the geodesic distance of the vertex v to all other points.
The betweenness measures the extent to which a particular point lies ‘between’ the other points in the graph: a point with a relatively low degree may play an important intermediary role and so be very central to the network (Freeman, 1979). The
17
betweenness of a node measures how much it can play the part of a broker or
gatekeeper in the network. Freeman’s approach is built upon the concept of local
dependency. A point is dependent upon another if the paths which connect it to the other points pass through this point. Formally, let G be a graph with n vertices, then the betweenness is calculated as follows:
t s V t v s st stv v B
() ) ( (5)Where is the number of shortest geodesic paths from s to t, and st st(v) is the number of shortest geodesic paths from s to t passing through a vertex v.
The centrality measures discussed above, allow us to characterize each single network node. However, for the purposes of this paper it is worth calculating the sector averages for all of the three indexes. In this direction, one must consider that each node corresponds to a technological class observed with a specific relative frequency, which must be taken into account when averaging out the centrality measures. We can then propose weighted average centrality measures as follows. Let Z(v) be one of the three centrality measures referred to the generic node v, the weighted average centrality at time t is:
v v v P P v Z v Z() () (6)Where Pv is the number of patents in which the technology v is observed.
4. Empirical results
4.1. The implementation of SNA: networks and knowledge structure
In order to calculate the density and the centrality indexes described in Section 3.2 we have rearranged the dataset so as to make it suitable for processing by means of Pajek software. After having chosen patent life to last for five years, we have split the dataset in order to obtain a network for each observed year, the nodes of which are technological classes and links represent the co-occurrence of technological classes within the same patent documents. Since we are investigating the relationships occurring among ‘actors’ belonging to the same set or class, we have derived ‘mode
one’ networks. Moreover, it must be noted that in a given year two technology classes
may occur together in more than one patent application. This would imply the presence of multiple links between two nodes. While this represents useful information, the calculation of density and centrality measures requires multiple lines to be removed, so as to obtain unbiased results. However, the graphical analysis presented in the following section will help appreciating multiple links as a proxy of the strength of relationships
18
among nodes, by making the thickness of edges proportional to observed frequency of technology couples.
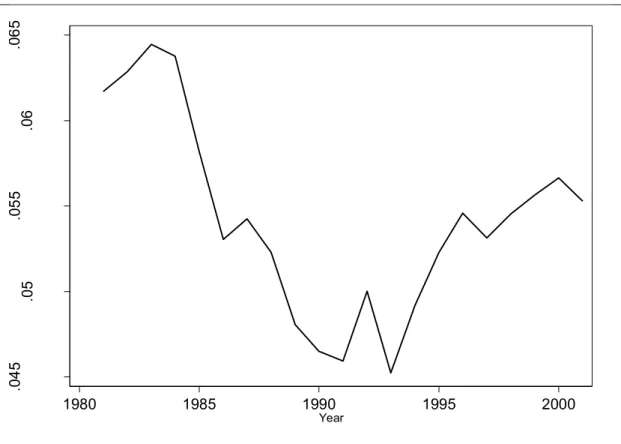
Let us start analyzing the structure of knowledge base by looking at the dynamics of network density, which is reported in Figure 3. The range of variation of the index is between 0.045 and 0.064, while the average is about 0.054. Density falls from 1983 to 1991 and then it starts growing until 2001. However, these two periods are not characterized by a smooth dynamics. On the contrary, a number of discontinuities can be observed, both in the decreasing and in the increasing periods. Let us first concentrate on the main trend and then try to explain the discontinuities. We can notice in Fig 1a that the knowledge property which shows the best correlation with density is total technological variety which rises between 1981 and 1991 and remains constant afterwards. Thus, density falls when technological variety rises and starts rising when technological variety becomes constant. The main trend of density in the period studied corresponds to our predictions concerning the rates of growth of the number of nodes and of the number of links. We expect the number of nodes to grow faster than the number of links immediately after the discontinuity and the number of links to start growing faster as the new type of knowledge moves towards maturity. The inversion from negative to positive of the slope of the density curve occurs when the rate of growth of total technological variety becomes zero and when the number of technological classes per patent starts declining. In this case the relative rates of growth of related and of unrelated variety do not seem to be the main factor determining the evolution of density. At best the ratio related variety/unrelated variety (RTV/UTV) could have determined the early discontinuity occurring in 1986, when RTV first overtook UTV, and the later slow down in the rate of growth of density occurring in 1992 when the ratio RTV/UTV started declining.
INSERT FIGURE 3 ABOUT HERE
Let us now proceed to analyse the results obtained with the SNA approach. Here we have two types of information: first, we have somewhat more aggregate measures of centrality, such as degree, closeness and betweenness; second, we have a finer representation of the structural change occurring in knowledge by means of the network of technological classes at different times. In the latter we can see the emergence of new technological classes, the decline or extinction of older ones, the change in the pattern of links and the consequent change in the distribution of links around nodes. These measures and representations help us interpreting the evolution of biotechnology knowledge. Furthermore, they need to be related to the above mentioned properties of knowledge which they should extend and complement.
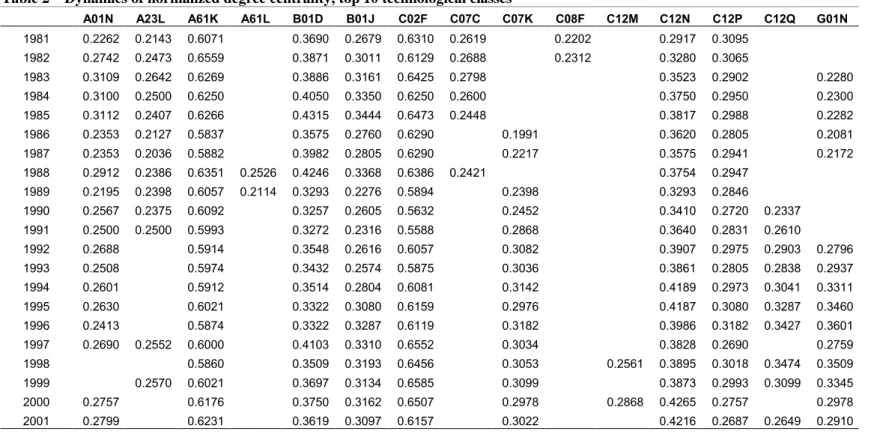
We start by describing the pattern of change in centrality measures. To this purpose we have first calculated degree centrality, betweenness and closeness for all technological classes. Then we sorted them at each year according to the observed values for each of the indexes. Finally, at each year we kept only the top ten classes, for each variable. In so doing, we built three matrices that are reported in tables 2, 3 and 4, which can be read both horizontally and vertically. In columns one can appreciate the dynamics of technological classes over time, identifying whether they have been central all over the period or only in some years. By looking at the rows one can appreciate the change in
19
the structure of knowledge base, with respect to the composition of the group of most central technological changes.
Let us look at the data concerning the normalized degree centrality in table 2. According to this index, the classes showing the highest degree are A61K and C02F. While the former is a market oriented class, the latter is related to environment-friendly technologies for the treatment of waste water. The dynamic evidence for the two classes is very similar and characterized by a limited fluctuation over time. The case of the C12N class is interesting in that its degree centrality has increased of about the 70% over the whole time period, and can therefore be described as the technology characterized by the best dynamics. This class involves the study of micro-organisms, carrier bound enzymes and genetic engineering. Thus the gradual rise of its centrality, above all in the 1990s, is the signal of the increasing recombination of such class of technologies with the rest of the technologies that make up the structure of the knowledge base.
INSERT TABLE 2 ABOUT HERE
From the systemic viewpoint, one may note that there are six classes that appear in our top 10 at each observed year. These may be defined as the core of the knowledge base, within which we have noted genetic engineering has gained increased relevance with respect to more established technologies. Moreover we have some classes that mainly appear in the first decade, like A23L and C07C, and some classes that mainly occur in the 1990s, like C07K, C12Q and G01N. The first two refer to the treatment and preservation of food and to organic chemistry compounds (mainly hydrocarbons). The second group refers to peptides, to the composition and the preparation of testing processes involving enzymes or micro-organisms, and to physics testing technologies useful to investigate the micro-structure of materials.
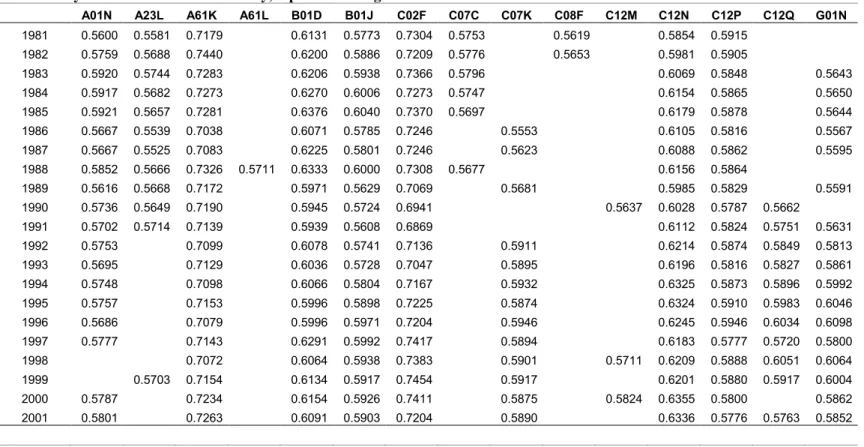
Table 3 reports the data concerning the closeness centrality. This measure is the inverse of geodesic distance, and it may be thought as the average distance of a node from all the others. The maximum value of closeness for a node is reached when it is directly connected with the rest of the network. Thus, it seems reasonable to expect that the degree and the closeness of a node are strictly related each other. Indeed the picture is almost the same as in the previous table. The classes showing the highest closeness are again A61K and C02F, though their dynamics is characterized by limited fluctuations. The only class showing a clear-cut increasing trend over time is the C12N, the closeness of which grows of about 8% in twenty years (thus this evidence is less pronounced than in the case of degree).
INSERT TABLE 3 ABOUT HERE
The systemic layout also resembles the one provided by the degree index. Still one can note the persistence of the six classes described before as the core of the structure of the knowledge base. The same also applies to the pattern of emergence and disappearance of classes over time. This evidence thus supports the idea that the structure of the knowledge base of the biotechnology sector has been characterized by the existence of a strong core, a sort of building block, which is constituted by the most important classes
20
of the period. While the existence of a core confirms the uneven distribution of technological classes in the knowledge base of the sector the composition of the core changes in the course of time with some older classes becoming extinct or losing importance and with some new ones emerging and becoming important components of the knowledge network. Classes linked to food preservation and to organic chemistry are examples of the former, classes linked to molecular biology or to physical measurements are examples of the latter.
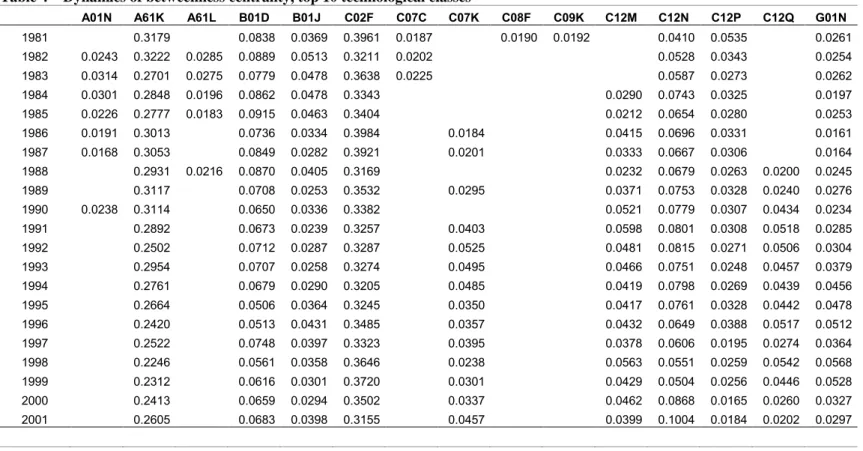
Table 4 shows indeed the results for the calculation of betweenness centrality. The emerging picture is slightly different in this case, as compared to closeness and degree. Now one can distinguish one dominating class, i.e. the C02F, the dynamics of which is pretty stable over time. The A61K class, although showing high values, is characterized by a decreasing trend over time. Two results deserve special attention. Firstly, the betweenness centrality of the C12N class grows by 150% in twenty years. This means that this class has become more and more relevant not only with respect to its direct links to other classes, but also as a ‘gatekeeper’ that allows for indirect recombination among technologies within the knowledge base.
INSERT TABLE 4 ABOUT HERE
Secondly, the systemic properties of the knowledge structure are differently characterized by this index. Indeed one may note that the core classes are now seven instead of six. The additional core class is the G01N, which is the physics class related to the investigation of micro-materials. Moreover the A23L is no longer listed in the top 10 of central classes, while C12M (related to the investigation of enzymes and micro-organisms) appears already in 1983 and remains until 2001. We can then conclude that betweenness emphasizes more the global influence of technological classes over the network of knowledge while degree and closeness focus more on their local influence. The analysis of the dynamics of centrality measures characterizing technological classes has revealed two important aspects. First of all, even in a period of pronounced structural change and of knowledge discontinuities the knowledge base of biotechnology is characterized by an apparently stable structure, in which one may identify a limited number of core technologies, around which there is a dynamics of emerging and disappearing classes. However, it is worth stressing that changes in the relative centrality of technological classes occur also within the core itself. Thus, the structure of the core is affected by qualitative change over time. Moreover, the closeness and the degree centrality show very similar patterns, while the betweenness centrality seem to provide a somewhat different evidence in terms of dynamics of centrality and of systemic features. Thus, change occurs but it is not instantaneous. This reflects the difficulty and costs inherent in transforming the knowledge base of whole sectors.
Such aspects may be better grasped by looking at the average centrality measures, calculated according to equation (6). Figure 4 a, b and c report the dynamics of weighted average degree, closeness and betweenness respectively, and the distribution of technological classes (represented by the scattered points) around the average values (i.e. the continuous lines). Even in this case it seems clear that degree and closeness are
21
characterized by very similar patterns. An evident cyclical fluctuation may indeed be noted in the first decade in both cases, followed by a relatively more stable dynamics in the second half of the 1990s. The dynamics of average betweenness is instead characterize by definitely less pronounced fluctuations, and by a decreasing trend over the whole period.
INSERT FIGURE 4 ABOUT HERE
An important point worth noting is that the centrality measures have a bimodal distribution, shown by the separate sets of points at the top and bottom of Figs 4. The part of the distribution at the bottom of the figure contains a very large number of points while the part at the top contains fewer and more scattered points. This confirms the extreme skewness of the distribution of links around nodes and seems to correspond to the description of this distribution as an oligopoly with few highly connected and many poorly connected technological classes. It is to be noticed also that the distribution is even more skewed for betweenness than for degree and closeness. Thus, an even smaller proportion of technological classes is globally, as opposed to locally, important in the network of knowledge.
4.2. Graphical analysis of networks: the web of knowledge
In addition to the more aggregate measures of density and of centrality SNA allows us to explore the fine structure of knowledge and the changes it undergoes in the course of time by showing the changes in the types and weight of nodes and of links. This is the most direct way in which we can estimate the extent of structural change which is occurring in the knowledge base of the biotechnology sector.
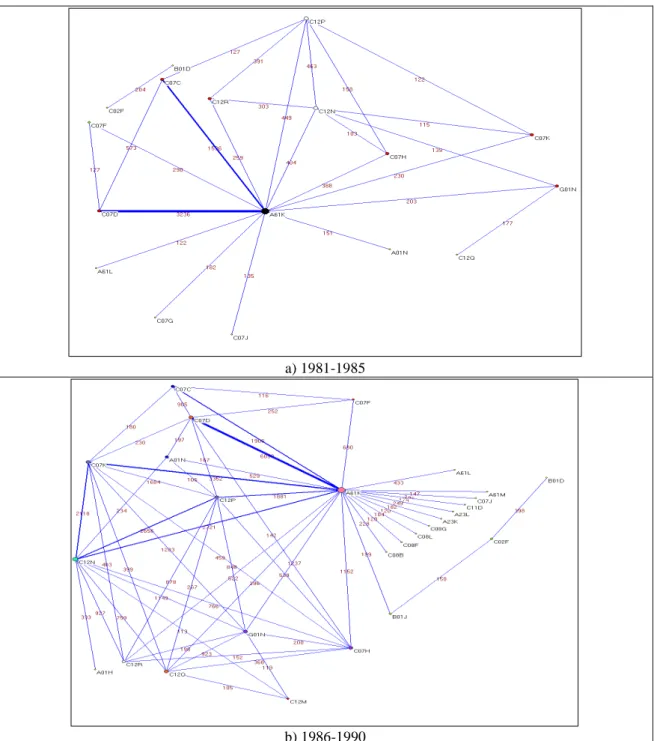
The first half of the 1980s is characterized by a relatively simple network structure. It can be easily seen in Figure 6 that the core node in the network corresponds to the class A61K, i.e. to a very generic and market oriented class referring to medical preparations and cosmetics. The two important links of A61K are those with the classes C07C
“Organic Chemistry” (1576 co-occurrences) and C07D “Heterocyclic compounds”
(3236 co-occurrences). Also the direct arc connecting these two classes shows a pretty high frequency (573). Although at smaller magnitudes, other relevant nodes are C12P, C12N and C12R, which are combined both each others and with A61K. This structure reflects the nature of the knowledge base which was predominantly used at the beginning of our period of observation. It is to be pointed out that although DBFs have played an extremely important role in the development of biotechnology, and especially in the early period (see Grabowski, Vernon, 1994), the knowledge base we detect is likely to be affected much more by the KBs of the large incumbent firm which have many more patents. Thus, it is natural for the sectoral KB of the early 1980s to contain mostly classes related to organic chemistry or to market related classes which are known to have constituted the KB of large pharmaceutical and agrochemical firms before that time.