HAL Id: halshs-00624473
https://halshs.archives-ouvertes.fr/halshs-00624473
Submitted on 18 Sep 2011HAL is a multi-disciplinary open access archive for the deposit and dissemination of sci-entific research documents, whether they are pub-lished or not. The documents may come from teaching and research institutions in France or abroad, or from public or private research centers.
L’archive ouverte pluridisciplinaire HAL, est destinée au dépôt et à la diffusion de documents scientifiques de niveau recherche, publiés ou non, émanant des établissements d’enseignement et de recherche français ou étrangers, des laboratoires publics ou privés.
Animating the cities...Dynamic exploration of
harmonized urban databases (United-States, France
1800-2000)
Anne Bretagnolle, Liliane Lizzi, Hélène Mathian, Adrien van Hamme
To cite this version:
Anne Bretagnolle, Liliane Lizzi, Hélène Mathian, Adrien van Hamme. Animating the cities...Dynamic exploration of harmonized urban databases (United-States, France 1800-2000). 25th International Cartographic Conference, Jan 2011, Paris, Palais des Congrès, France. �halshs-00624473�
Animating the cities…Dynamic exploration of harmonized urban databases (United-States, France 1800-2000)
Anne Bretagnolle*, Liliane Lizzi**, Hélène Mathian**, Adrien Van Hamme*** (* University Paris 1, UMR Géographie-cités ; ** UMR Géographie-cités ; ***CREN
Poitou-Charentes)
Proceedings of the 25th International Cartographic Conference (Paris, Palais des Congrès, 3-8 July 2011)
Introduction
The project consists in a generic visual tool for mapping and analyzing the evolution of a system of cities on a long-term period (2 centuries), in different countries. The project started in 2008 in the framework of a national grant1. The first step aimed to build a dynamic urban database over two centuries, in its conceptual form as well as in its fill in. The conception of the visual tool for exploring the database represents the last part of this project and has been developed in 2010 (Van Hamme and al. 2010). Three main objectives were challenged: Designing a generic tool, that could be possibly used in the future for several countries under study (United States, France, South Africa, and possibly China and India); Allowing a dynamic exploration of the different databases, which raises a range of difficulties as they are spatio-temporal and multi-level (cities themselves and systems of cities); Giving an interactive application, that could be used by a large range of Internet users, from pupils to researchers or urban planners. The resulting interface combines time, location and attributes, according to the triad model (Peuquet, 1994). Attributes are characteristics of cities, such as population, surfaces, density, socio-economic indicators and will include also inter-urban accessibility. The application integrates interactivity in order to propose an exploratory and animated cartography of urban dynamics, according to an evolutive conception of the urban system (Pumain 1997). The aim is to stimulate the desire of exploration of a variety of trajectories (Dykes &al. 2004, Andrienko &al. 2005). This paper focuses on the two first implementations, United States and France.
1/ Background and Objectives: getting to see evolving cities on the long term period
Managing spatio-temporal databases
Urban databases are particularly complicated when approached on the long term period. Cities perimeters evolve frequently, especially since the first revolution of transportation, which is the depart point of our study. Usually, when official urban statistics integrate historical data, they define them for the whole period according to their final delineation. For our part, we assume that urban delineation is an active component of the city evolution that needs to be taken into account. If the delineations are too restrictive and don’t take into account the emergence of suburbs, at the end of the 19th century, and the raise of suburban rings, in the second half of the 20th century, the results of the statistical computations of socio-economic indicators may suffer from bias (such as an under-estimation of larger cities).
1
Action Nationale de la Recherche Corpus et Outils de la Recherche en SHS (2008-2011). The project is called « Harmonie-cités : construction de bases de données harmonisées sur les populations, les activités et les réseaux des villes » (http://www.parisgeo.cnrs.fr/index.php?page=programmeDescription&id=3&langue=en).
The originality of our approach lays on the evolving definition of the city that underlies the geospatial database as well as on the way the system of cities is shown in a dynamic and multilevel perspective. Indeed, the project consists in constructing harmonized urban databases, i.e. using time definitions of cities. For the United States, we started from a theoretical approach of an “evolving city model”, and we used the “one hour time-budget”, dedicated in different world region or time period to travel every day to work place, in order to construct spatial delineations of the cities at each period (Bretagnolle and al. 2008). In this time budget, we fit the municipalities of the 19th century, the urban agglomeration with their suburbs of the first half of the 20th century, and the functional urban area with their suburban rings of the second half of the 20th century (Figure 1). Historical transportation networks were used to estimate the average euclidian distance that can be covered in the one-hour time budget, at each census data point (from 1790 to 2000, every ten years). Inside the resulting radius, all the building blocks were aggregated (municipalities or counties, depending on the period) and this aggregation form the “city” in our database.
Figure 1: From the evolution of the concept of city to the database model
For France, we used the historical database that was constructed by D. Pumain and B. Riandey at the Institut National d’Etudes Démographiques (Pumain and Riandey 1986), the harmonised database of functional areas (Julien 2003, Paulus 2004) and the database model built by the Harmonie-cités team for the 1831-2006 period (Bretagnolle 2009).
Different types of indicators are under the scope of the project Harmonie-cités and will be represented as attributes of cities on the future website: population and surface, economic
activities, social categories, and accessibility on transportation networks. Currently, the website has been designed for the first thematic focus (population, density, surface).
2/ Approach and methods: adopting a multi-level perspective
Our purpose is to use the power of new technologies to conceive a visual tool integrating our conception of how cities are evolving in their main components. Our level of observation is the one of the city, as a whole. Cities are conceived as elements of an urban system, which mean that their evolution is constrained by their position in the system, either global in the urban hierarchy, either local in their spatial regional or national context. The application has thus to integrate this multilevel contextualisation of the cities.
Different points of view for visualizing cities
For the conception of the tool, attention was given to allow a dynamic and interactive exploration of cities at different scale levels. This is linked to one of the most important properties of cities : they are not only a concentration of people, enterprises and services, but they also are part of systems of cities through the multiplicity of relationships that they draw with other cities, at regional scale, national scale, macro-regional scale, and for some of them today, at the world scale. As in cartography where any database is accurate for one specific cartographic scale, the accuracy of one urban database is associated to one specific geographic level. In our case, the spatio-temporal reference level is the one of system of cities. This is not easy to report in the sense that people are generally used to focus on cities and not system of cities. The links that underlay the interactions inside the system are difficult to catch : flows data are rare, and generally the representations are just based on the design of transportation or information networks (air plane, railroad, Internet connections…). An ambitious goal of the project is to get the level “system of cities” more accessible to the user, enabling him to discover some relations between (the list is not exhaustive) :
• Accessibility of cities at regional or national scales and their economic dynamic (see the railroad “hub” of Chicago at the 19th century, or Paris at the same period)
• Regional locations and economic innovation cycles (the Rust Belt in the United States, the Sun Belt in France or in the United States)
• Social dynamics and city sizes (concentration of “creative classes” and white collars in large metropolises for instance).
The visualizing tool should allow this simultaneous exploration of the multi-level dynamics, going from cities to urban system through different significant levels of contexts that make sense for the exploration of the city dynamics.
The city level that we consider here consists first in aggregation of elementary local administrative units used by National Statistical Boards to collect census data (the building blocks being generally areas, districts, “arrondissements”, “quartiers”, municipalities etc.). Of course, this doesn’t give an overall view of the dynamics “inside” the city, but it gives a synthetic representation of the huge transformation of urban spatial extent, city by city, since two centuries. For example, when following the evolution of Paris’s building blocks, we start with one commune in 1831 and finish with more than one thousand communes in 2006. Depending on the cities, the building blocks consist in municipalities (US 1790-2000), counties or sub-counties (US 1940-2000), communes (France, 1831-2006).
In addition to this way of considering city evolution, another important point is to allow a simultaneous representation of the city with some attributes (Figure 2) and a view of the city as a part of a larger urban system. Then, the challenge is to represent dynamically the
co-evolution of the delineation and the characteristics of the resident population and activities constituting the city, as a good proxy for social and economic specialisation of the city, which is seen here as a whole, an element of a higher system.
Figure 2: A city trajectory with its attributes (Toulouse, France)
Sources : Paulus 2003
Different contextual levels can be considered, for systems of cities. Indeed, one city is generally involved in different kind of systems (regional, national, macro-regional…), which are interlocked. Even the notion of national system of cities is questionable: if cities are known to have more relationship with other cities inside national frontiers than with cities abroad, these national relations don’t involve all the cities but only some of them, either the largest, either the closest inside regional contexts, either the ones which belong to the same economic specialisations (Bretagnolle and al., 2009). In order to respect this variety of approaches, we have decided not to impose a unique definition of systems of cities but to give the user the possibility of choosing different perspectives. The system level can be :
• Regional (for example cities belonging to some administrative regions, in France, or to federal states, in United States)
• National (all the French or US cities at one date)
• Defined by the experts of the projects (for example in US at the 19th
century, when strong interdependences between city only occur only inside regional part of the country, like the North-Eastern coast, the South-Eastern one, the Californian one, etc.)
• Semantic (for example choosing cities larger than a selected threshold, or belonging to the top ten, or other) or defined by the user himself (Figure 3).
Figure 3: Systems of cities defined by “experts” at the same period, according to the railroad interdependencies.
Left: National context (France, 1870), Right: Regional context (Laker country, US, 1870)
Using a multilevel approach allows to combine not only the vision of the object but also its location and relative evolution inside a larger system of cities, coupled with its representation as an evolving aggregation of building blocks. This combination is provided by the use of attributes that are not computed only for one city but also for the urban system level, as illustrated for the example of Toulouse (Figure 4). In that case, one can observe two different stages. First, a relative decline (until the half of the 20th century), mainly due to the low industry activities and the low accessibility on national transportation networks. Then, a relative growth, partly linked to the coming of aeronautic industry and to the local amenities regarding the sun-belt context.
Figure 4: A relative view of a city trajectory (Toulouse, France)
1831 1921 2006
Relative decline (low accessibility, no industry…)
Relative growth (aeronautic industry, « sun belt » amenities)
3/ Results: a generic, dynamic and interactive tool
We wanted the visualizing tool to be an interface with the spatio-temporal database, reflecting the way we conceptualized the city and the forces underlying their evolution and their co-evolution patterns, under logics operating either at the level of the whole urban system either at the level of a more local urban systems. We present in this part the different conceptual choices that have been done relating time and dynamic trends, not only from a cartographical animation point of view but also from a semiological one.
Conceptualizing a generic structure
We have put a strong emphasis on the construction of a generic structure, as the application is currently illustrated by two urban systems but some other projects are developed by researchers of the laboratory (South Africa, India, China…). Concerning the database formats, we had to face the diversity of the projects : some urban databases have been constructed several years ago, by a diversity of researchers, and the database models are not the same. Consequently, we have chosen to go from urban databases to homogeneous cartographic databases, which constitute the inputs of the application and feed directly the cartographic module.
The input is in a very standard format. It gives for each city, at each date, its characteristics and its geometry (generally a shape, but sometimes only a point because of a lack of data, for example in US database until 1940). The objects are also associated to a generic type of city : definition evolves throughout the two centuries, depending on the perimeter contained in the one-hour time budget. For example, New York or Paris’s trajectory varies from municipality to agglomeration of municipalities then to functional area.
Dynamic: at the heart of the interface
The interface combines in a dynamic way three windows which offer to the user a multidimensional view of the spatio-temporal database. The windows are dynamically joined, two by two, and synchronized with the time line (Figure 5).
The whole period is represented by the range of the timeline, and the time unit is the year. The continuous representation of the period (time line) should give the impression of continuity, and events are marked by red dots on the timeline. By this way, the time for animation is proportional to the real time. Cursor moves on the timeline and representations change only when passing over red dots: We chose not to interpolate the geometries between two recordings in order to give the closest representation of the database. Another reason for this choice is that interpolation was not possible for the former periods as we don’t have the shapes of the cities but only their centre location (US, before 1940).
Tools for animation are the classical ones (play, stop, pause...) and a cursor is used for localising the current year. It is also possible for the user to act on the time and to select the dates to be visualized. In that case, each user leads the exploration of the period, date to date with its own perception of the order, and the time becomes the user’s time.
The multi-level approach
The three windows allow to visualize a view of the selected contextual urban system, from local to global (Figure 5, upper window), a view of the spatial evolution of a selected city (low left window) and the quantitative evolution of a selected indicator for the city and its context (low right window). Consequently, the interface combines the dynamic of an urban system as well as the focus on the dynamic of a selected city, revealed through its spatial extension and its thematic dimensions, in relation with its national or regional context. As described above, some contexts are predefined (given by experts as significant regional
contexts) but the user may also choose one specific using the “zoom”. The combination of the three linked windows gives an original powerful lighting of the spatio-temporal database.
Figure 5 : the interface of the project (Orléans, France)
At the level of the city, representing the succession of the perimeters of the selected city for such a long period (more than 20 census dates in US, more than 30 in France) is challenging. The solution adopted (Figure 6, example of Orléans, in France) has the advantage of showing very clearly and quite simply the dramatic spatial extension of cities. Each date is characterized by a particular shade inside a variation of scale colour, and the oldness of an area of the city is given by the resulting colour of the overlaying shades. The central areas are in dark red at the end of the simulation, whereas the recent suburban rings appear in light rose. The legend summaries the way the figure can be understood, detailing 30 different colours with referred dates being just impossible to do.
Figure 6: step by step animation of Toulouse spatial growth (1954-2006, selected dates)
Interactivity: thinking stimulation and self-discovery
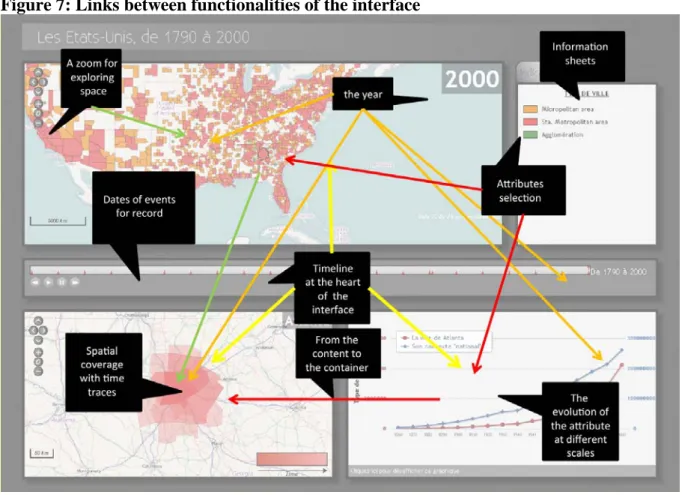
The interface has not been conceived as an animated “atlas”, a series of urban images to be looked at passively. On the contrary, the architecture of the application invites the user to a self-discovery, allowing him to process by try and error. One can have a static approach by choosing one date or a dynamic one by choosing animation. The upper and largest window is dedicated to a systemic view, and even if one may zoom on the map, this window suggests that urban dynamic has to be explored at a national or regional scale because cities interact and co-evolve. The user may also select a city and follow in the bottom left window its spatial extension at the building block level. A third window completes this dynamic exploration with some representation of statistical measures. Thus it is possible to connect the evolution of the selected city with its spatial extension and to follow its position (Figure 7, red curve) relatively to the urban system, either national or local (blue curve), depending on the spatial coverage selected in the upper window.
Figure 7: Links between functionalities of the interface
The multiplicity of links between sub-windows are an invitation for the user to explore himself the dynamics of cities and the strong interdependences that exist between the trajectory of a city and the one of a regional or national system. One can discover progressively the potentialities of the website. At a very rough level, meaning without pointing on a precise spatial context or a precise date, it is the evolution of the whole system of cities that appears. For example, the U.S. interface allows the visualisation of the progressive space filling by cities, during the pioneer front of the 19th century (Figure 8).
Figure 8: Step by step animation of the evolution of urban patterns in U.S. (selected dates, 1810-1910)
It also enlightens the remarkable persistency of the urban hierarchy through time (Figure 9), old Eastern cities as Boston or New York remaining constantly in the top 10 of the cities, even after the booming of the Western then Southern cities. At a more detailed level, the user may choose some spatial and temporal contexts that enlighten some specificity of the selected cities. For example, considering only the rust-belt region in order to analyse the economic or demographic trajectory of a city like Detroit, or considering the years 1950-1980 in order to follow the trajectories of sun-belt cities during the TIC innovation cycle.
Figure 9: Step by step animation of the urban populations in US (selected dates, 1930-2000)
Different levels of difficulties
The public that could be interested in this product is large, from teachers and pupils at schools to researchers and urban planners. We have planned an easy downloading of the main attributes tables, maps and graphs, and of the information sheets that are associated to the indicators. Thee difficulty levels will be available, easy (for pupils for example), average (one-page format) and “to go further” (the papers published by the researchers who have conceived the databases and the statistical exploitations).
4/ Perspectives and conclusion
The aim of the project was to conceive a thinking stimulation tool and not a simple animated atlas of urban maps. Even if we are still in an experimental phase of the conception, the visualisation tool is now ready to be tested and improved taking into account suggestions of users (validation phase). The website has already been tested with teachers and pupils at the “Salon de la Géomatique” of the International Festival of Saint-Dié (October 2010), and other tests will be necessary in the future. The application concerning South Africa should also be conceived in the next months.
The second phase of the project will be longer, as it consists in working on the introduction of new time-harmonized data, for social categories and transportations inter-urban indicators.
The databases are still in construction. We hope that the strong association with research fields in urban studies will feed in the next years the visualization website and allow frequent updates and maintenance of the tool.
Technical Appendix:
The architecture of the website is principally based on the JavaScript libraries OpenLayers and HighChart, and a few GML layers (one per year, for each country). The statistical measures are also stored in a MySQL database to be able to make asynchronous calls, especially using PHP (in AJAX).
References
Andrienko, N. and Andrienko G. (2005), Exploratory Analysis of Spatial and Temporal Data
- A Systematic Approach. Springer, 600 p.
Bretagnolle A. (2009), Villes et réseaux de transport : des interactions dans la longue durée
(France, Europe, Etats-Unis). Habilitation à diriger des recherches, Université Paris 1, 17
Juin 2009, http://tel.archives-ouvertes.fr/tel-00459720_v1/.
Bretagnolle Anne, Giraud Timothée, Mathian Hélène (2008), “Measuring urbanisation in the United States, from the first colonial trading posts to the Metropolitan Areas (1790 to 2000)”, in Cybergeo, 427, 40 p. http://cybergeo.revues.org/index19683.html
Bretagnolle A., Pumain D. & Vacchiani-Marcuzzo C. (2009), The organisation of urban systems. In Lane, D, Pumain, D., Van der Leeuw, S. & West G. (Eds.), Complexity perspective in innovation and social change. Springer (Methodos Series 7).
http://halshs.archives-ouvertes.fr/halshs-00459713
Dykes, J., Mac Eachren A.M., Kraak M. J. (eds) (2004), Exploring geovisualization. Amsterdam, Elsevier, 730 p.
Julien Philippe (2003), « L’évolution des périmètres des aires urbaines 1968-1999 », in Pumain D., Mattéi F. (eds.), Données urbaines, tome 4. Paris, Anthropos, Economica, pp. 11-20.
Peuquet D. J. (1994), “It’s about time; A conceptual framework for the representation of temporal dynamics in geographic information systems”, Annals of the Association of the
American Geographers, No.3, 441-461.
Paulus F. (2004), Coévolution dans les systèmes de villes : croissance et spécialisation des
aires urbaines françaises de 1950 à 2000, Thèse Université Paris 1, http://tel.archives-ouvertes.fr/tel-00008053/en/
Pumain Denise, Riandey Benoît (1986), « Le fichier de l’INED : Urbanisation de la France », in Espace Populations Sociétés, vol. 2, pp. 269-278.
Pumain D. (2004), “An Evolutionary approach to Settlement Systems”, in Champion, Hugo (eds), New Forms of Urbanization, Beyond the Urban-Rural Dichotomy. Aldershot, Ashgate, 231-247.
Van Hamme A., Bretagnolle A., Mathian H. (2010), « Animer les villes. Exploration dynamique de bases de données urbaines harmonisées dans le temps long », in
Mappemonde, Rubrique « Concours géovisualisation du F.I.G. Saint-Dié », 4 pages,