Diverse Primary and Secondary Structural Features Are
Associated With Y Complex-Dependent mRNA
Maturation in
B. subtilis
by
Archana Ram
Submitted to the Department of Electrical Engineering and Computer Science
in partial fulfillment of the requirements for the degree of
Master of Engineering in Electrical Engineering and Computer Science
at the
MASSACHUSETTS INSTITUTE OF TECHNOLOGY
February 2020
c
○ Massachusetts Institute of Technology 2020. All rights reserved.
Author . . . .
Department of Electrical Engineering and Computer Science
January 17, 2020
Certified by . . . .
Gene-Wei Li
Assistant Professor of Biology
Thesis Supervisor
Accepted by . . . .
Katrina LaCurts
Chair, Master of Engineering Thesis Committee
Diverse Primary and Secondary Structural Features Are Associated
With Y Complex-Dependent mRNA Maturation in B. subtilis
by
Archana Ram
Submitted to the Department of Electrical Engineering and Computer Science on January 17, 2020, in partial fulfillment of the
requirements for the degree of
Master of Engineering in Electrical Engineering and Computer Science
Abstract
In Bacillus subtilis, mRNA processing and decay are primarily initiated by the endonuclease RNase Y. Recent work by our group discovered a set of auxiliary factors called the Y complex that is required for the mRNA maturation of 21 operons. It is unclear, however, how these operons specifically are targeted by RNase Y and the Y complex. Here we use in silico sequence motif searches, kmer analysis and secondary structure prediction to analyze these 21 cleavage sites and their surrounding regions. We find enrichment for a guanine immediately preceding the cleavage site. Such enrichment has been previously observed in Staphylococcus aureus RNase Y cleavage sites, indicating a role for the Y complex in processing those sites as well. Surprisingly, there are no other detectable sequence or structural motifs in the regions around the 21 B. subtilis sites. This suggests that Y complex-dependent processing and, more broadly, mRNA processing in B. subtilis, is more complicated than previously anticipated.
Thesis Supervisor: Gene-Wei Li Title: Assistant Professor of Biology
Acknowledgments
I never imagined that, during my time at MIT, I would think about bacteria apart from the occasional E. coli outbreak reported on the news. This career trajectory has been entirely unexpected yet tremendously welcome. The work presented in this thesis is the serendipitous result of the insights of many talented individuals from whom I have had the great fortune of learning.
I am indebted first and foremost to Gene-Wei Li’s unfailing guidance during the past year and a half. His patient mentorship, willingness to reassure my abundant self-doubt and desire to challenge me as a scientist has allowed me to grow and mature in ways previously unimagined. Additionally I am grateful to the entire Li lab for their friendship and feedback. They amaze me daily and my work is so much stronger thanks to them.
This project would not have been possible without Alan Grossman; had it not been for his suggestion that I talk to Gene this thesis would have been on machine learning and synthetic biology. I am thankful for his willingness to take a chance on me and help me develop experimental skills despite my complete lack of biology knowledge. Through him I developed the confidence to pursue biology research for my M.Eng.
My foray into bacterial mRNA processing would not have been possible had it not been for Andrew Lo introducing me to a paper called “Bacteria as Multicellular Organisms” which caused me to completely switch fields from neuroscience and discover just how fascinating prokaryotes can be.
Finally, this past year and a half has been a period of tremendous personal growth and I owe that entirely to my chosen family–Wei Low, Lily Zhou, Anil Sindhwani and Vicki Xiao challenge me daily to be a better version of myself and I am endlessly grateful for their presence in my life. I’d also like to thank my father for his continued support and willingness to give me space during what has undoubtedly been a tumultuous time for both of us.
Contents
1 Introduction 15
2 Sequence motif analysis 19
3 Structural motif analysis 29
4 Analysis of structure surrounding the cleavage sites 33
5 Discussion 39
A Supplementary figures 43
List of Figures
1-1 A: An example of how endonuclease-initiated processing produces fragments of differential stability from a polycistronic transcript. B: Rend-seq traces show differential transcript abundances upstream and downstream of the Y complex-dependent gapA operon processing event. . . 17
2-1 A schematic of the sequence windows used for folding. On top, a 200 nt window. Below, the window used if the cleavage site was within 100 nt down-stream of a TSS. . . 20
2-2 Nucleotide frequency plot of all 21 sequence windows. Shortened window shown, full window available in Figure S12. Genomic GC% shown. . . 21
2-3 Evolutionary conservation of G [highlighted] immediately preceding the cleav-age site in four sites with high-quality alignments. Asterisks indicate 100% conservation of a given nucleotide. . . 23
2-4 Evolutionary conservation of all nucleotides across all eight high-quality MSAs. Enrichment for G preceding the cleavage site highlighted. . . 24
2-5 Nucleotide frequency plot of all 5 S. aureus Y complex-dependent windows. Genomic GC% shown. . . 25
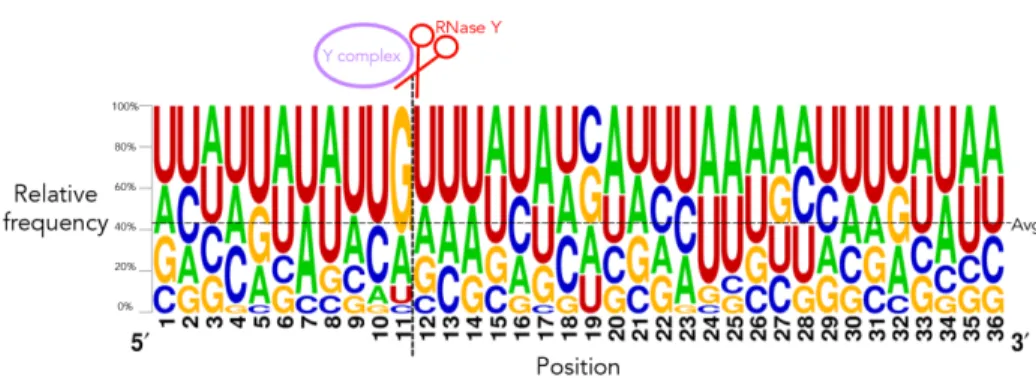
2-6 Sequence logo of all 21 sites in a shortened window. Full logo shown in figure S13. . . 25
2-7 Top 5 motifs produced by MEME. Note that E > 0.05 is not considered statistically significant. . . 26
3-1 The different folds of the cggR cleavage site. Highlighted regions are common to all folds used to generate the consensus structure. locaRNA strucure also shown. Coloring corresponds to pairing probabilities. . . 32
4-1 Pairing probabilities at each position for all sites. Cleavage-derived 5’ end highlighted. Blue lines represent median pairing probabilities, thick bars range from the first to third quartile of the data and thin bars span the full range of the data. . . 34
4-2 A, Calculation of distance from cleavage-derived 5’ end to nearest downstream paired base. B, Distribution of distances for each type of fold. . . 35
4-3 A schematic of the three types of background windows used. . . 36
4-4 𝑝 values for the number of paired sites for all folds, broken down by background set. . . 37
S1 MFE structures generated for all 21 sites. Coloring corresponds to pairing probabilities. . . 44
S2 MEA structures generated for all 21 sites. Coloring corresponds to pairing probabilities. . . 45
S3 Centroid structures generated for all 21 sites. Coloring corresponds to pairing probabilities. . . 46
S4 Pairing probability-constrained structures generated for all 21 sites. Coloring corresponds to pairing probabilities. . . 47
S5 Consensus structures generated for all 21 sites. Coloring corresponds to pair-ing probabilities. . . 48
S6 locaRNA structures generated for 8 sites. Coloring corresponds to pairing probabilities. . . 49
S7 Rend-seq traces of five S. aureus sites that appear to experience Y complex-dependent cleavage. G preceding the cleavage site highlighted in red. . . 50
S8 Evolutionary conservation of all nucleotides for the atpI and cggR MSAs. . . 51
S9 Evolutionary conservation of all nucleotides for the ffh and glnA MSAs. . . . 52
S11 Evolutionary conservation of all nucleotides for the ruvA and ydiH MSAs. . 54
S12 Full frequency plot for all 21 sites. . . 55
S13 Full sequence logo for all 21 sites. . . 55
S14 Location of “GAAA” motifs across all 21 sites. . . 56
S15 Location of “AAAA” motifs across all 21 sites. . . 56
S16 Location of “AAAAG” motifs across all 21 sites. . . 57
S17 Location of “AAAAA” motifs across all 21 sites. . . 57
S18 Location of “UGAAAA” motifs across all 21 sites. . . 58
S19 Location of “GAAAA” motifs across all 21 sites. . . 58
S20 Location of “UGAAA” motifs across all 21 sites. . . 59
S21 Location of “UGAAAAA” motifs across all 21 sites. . . 59
S22 Location of “GAAAAA” motifs across all 21 sites. . . 60
S23 Location of “AAAUGA” motifs across all 21 sites. . . 60
S24 Location of “AAAUG” motifs across all 21 sites. . . 61
S25 Location of “AAAUGAAAAA” motifs across all 21 sites. . . 61
S26 Location of “AAAUGAAA” motifs across all 21 sites. . . 62
S27 Location of “AAAG” motifs across all 21 sites. . . 62
S28 Location of “AAAAUGA” motifs across all 21 sites. . . 63
S29 Location of “GGAGGA” motifs across all 21 sites. . . 63
S30 An example of the pairwise alignment scores used to generate an alignment-to-subtilis score. In this case the B. subtilis sequence is sequence 1. . . 70
List of Tables
2.1 Table of the top 15 enriched k-mers . . . 28
Chapter 1
Introduction
Tight control of gene expression is important to any cell’s survival as it limits spurious expen-diture of cellular resources and helps cells respond to fluctuating environmental conditions. Bacteria have three main means of regulating gene expression, namely via transcriptional regulation, translational regulation and mRNA processing [1]. mRNA processing has his-torically received less attention than the other processes but is now of growing interest as it allows for rapid cellular responses to environmental changes [2].
mRNA processing is also of tremendous use in allowing for the differential expression of cotranscribed genes in bacterial multigene operons [3]. Processing is predominantly initi-ated by endonucleases, i.e. enzymes capable of severing phosphodiester bonds internal to a polynucleotide chain, that cleave transcripts into an upstream 5’ fragment and downstream 3’ fragment. Notably, the 3’ fragment contains a 5’ monophosphate as opposed to a triphos-phate [4]. Both these fragments can be targeted by exonucleases, i.e. enzymes capable of severing phosphodiester bonds from either the 5’ or 3’ end, for further decay after the initial endonucleolytic cleavage event [Figure 1-1a] [5]. One of the earliest discovered instances of such processing was the pap operon in E. coli. The endonuclease RNase E cleaves between the genes papB and papA. The papB fragment is less stable than papA and is quickly de-graded, resulting in higher papA expression levels [6].
and other Gram-negative bacteria [7]. Additionally, it is the endonucleolytic component of the multienzyme degradation complex known as the degradosome [8]. RNase E’s importance in mRNA turnover and role in the degradosome led to investigations into whether Gram-positive bacteria possess endonucleases of similar function. Indeed, the endonuclease RNase Y was found to act as the functional RNase E homolog in Gram-positive bacteria such as Bacillus subtilis [5] [9] [10].
RNase Y, like RNase E, is capable of processing operons as part of a degradosome com-plex [9]. One such processing event in B. subtilis occurs in the glycolytic gapA operon [11]. RNase Y cleaves near the end of the cggR ORF, resulting in a highly unstable 5’ cggR fragment and a comparatively stable gapA fragment [12]. RNase Y and the rest of the B. subtilis degradosome, however, are not the only components involved in processing this operon. A complex of three proteins–YaaT, YmcA and YlbF, collectively named the “Y complex”–appear to work with RNase Y to process 21 operons including the gapA operon.
These 21 operons were identified using end-enriched RNA-sequencing [Rend-seq] in B. sub-tilis strain 168 to be processed in a Y complex-dependent manner [“Y complex-dependent processing”, Figure 1-1b]. 5’ Rend-seq peaks were first detected in 168. Out of those, 5’ peaks corresponding to monophosphates, i.e. potential RNase Y cleavage products, were subsequently identified. 5’ monophosphates in 168 that were not present in ∆rny, ∆ylbF, ∆ymcA and ∆yaaT strains were considered the result of Y complex-dependent cleavage [4]. It is unclear how these operons specifically are processed by RNase Y and the Y com-plex. These genes have vastly different functions, span multiple regulons and their cleavage sites do not appear to localize to a specific region within the operon [e.g. intergenic region, 5’UTR, 3’UTR]. In this thesis we examine three possible means by which these proteins are recruited to these sites: 1. there exists a sequence enriched near the cleavage sites [“sequence motif”], 2. there exists a particular secondary structure enriched in these 21 sites [“structural motif”] or 3. these sites are cleaved due to the presence or absence of significant secondary structure in the surrounding region, rather than any motifs.
Figure 1-1: A: An example of how endonuclease-initiated processing produces fragments of differential stability from a polycistronic transcript. B: Rend-seq traces show differential transcript abundances upstream and downstream of the Y complex-dependent gapA operon processing event.
We find enrichment for a guanine immediately upstream of the cleavage site, which cor-roborates previous work in Staphylococcus aureus on RNase Y-dependent sites, but find insufficient evidence of any sequence or secondary structure motifs [13]. Additionally, we find that the amount of secondary structure at the cleavage sites lacks statistical signifi-cance, indicating that the presence or absence of secondary structure likely does not signal Y complex-dependent cleavage. Together, these results suggest that Y complex-dependent cleavage, and mRNA processing in B. subtilis at large, is more nuanced than previously appreciated.
Chapter 2
Sequence motif analysis
Sequence windows used for analysis
All analysis is conducted under the assumption that any salient sequence or structural mo-tifs lie in close proximity to the cleavage site. Nonetheless, it is entirely possible that distal elements are involved in directing cleavage, as is the case with the RNase Y-processed hbs transcript [17]. Because the space of possible distal elements salient for cleavage is much larger than that of cis-encoded elements, we have excluded distal elements from considera-tion in our analysis.
We consider sequence “windows” of at most 200 nt symmetric around the cleavage sites [Figure 2-1, also see Appendix B]. This window size has been previously used to identify regulatory RNA structures in B. subtilis [18]. Additionally, 200 nt is an order of magnitude larger than the expected size of any sequence motif [3-10 nt] [15].
Figure 2-1: A schematic of the sequence windows used for folding. On top, a 200 nt window. Below, the window used if the cleavage site was within 100 nt downstream of a TSS.
Y complex-dependent cleavage sites display enrichment for
a guanine immediately upstream of the site
Work on other endonucleases suggests that B. subtilis RNase Y may exhibit some sequence specificity. Its E. coli counterpart RNase E is known to cleave within AU-rich regions and, furthermore, work on S. aureus RNase Y suggests that cleavage tends to occur after a G in AU-rich regions [19] [13]. As such, we searched for sequence similarities among Y complex-dependent cleavage sites. Indeed, we note a sequence enrichment among the 21 Y complex-dependent cleavage sites similar to that seen in S. aureus, with 14/21 sites being preceded by a G in an AU-rich region [Figures 2-2 and S12]. We also note an enrichment for a uracil in the -2 position relative to the cleavage site, i.e. the position prior to that of the guanine. There is no significant enrichment, however, for a UG dinucleotide. UG appears in 7/21 sites, UN appears in 12/21 sites and NG appears in 14/21 sites. If we assume UN
and NG to be independent events, the frequency of UG is simply 1221 * 14
21 = 0.381. As such,
𝑝(𝑈 𝐺) = 217 = 0.333 and does not represent an enrichment for a “UG” motif preceding the cleavage site.
Figure 2-2: Nucleotide frequency plot of all 21 sequence windows. Shortened window shown, full window available in Figure S12. Genomic GC% shown.
Additionally, should this G be of functional importance [i.e. salient for cleavage], it is reasonable to expect that it be evolutionarily conserved. As such, we sought to determine if this same G enrichment occurred in other Bacillus sequences homologous [defined as >70% identical [20]] to the 21 B. subtilis windows. We constructed multiple sequence alignments for each cleavage site using sequences from 23 Bacilli, including B. subtilis, all of which possess genes encoding for RNase Y and the Y complex [see Appendix B].
When constructing the sequence alignments, we wanted to ensure that the B. subtilis se-quence aligned to the other sese-quences and therefore defined an “alignment-to-subtilis” score [see Appendix B]. High scores indicated that non-subtilis sequences exhibited good pair-wise alignment [as defined primarily through homology] of other sequences to the subtilis sequence. Previously, proteins with >30% amino acid sequence identity have been found to adopt the same structure [21]. As such, we considered an alignment to be of “high quality” if its alignment-to-subtilis score was greater than 30. 8 alignments had a score greater than 30 and, out of these, 4/8 had a well-conserved G immediately before the cleavage site [Figure
2-3].
Individually analyzing these four MSAs, however, revealed that nucleotides other than the G appeared to exhibit notable conservation for a given site. We therefore sought to examine trends in nucleotide conservation across all eight MSAs [see Appendix B]. We found that, in keeping with the previously-witnessed G enrichment, G’s were most conserved immediately preceding the cleavage site. We witnessed no notable conservation of other nucleotides near the cleavage site [Figure 2-4, Figures S8-S11]. It therefore seems to be the case that, out of the 4/8 sites whose cleavage sites were preceded by a G, their only sequence-level commonality appears to be this G.
Taken together, these results provide evidence suggesting that a G immediately preceding the cleavage site may be implicated in Y complex-dependent cleavage in B. subtilis.
G enrichment in
subtilis suggests possible Y
complex-dependence of
S. aureus RNase Y cleavage sites
Previous work has produced a curated list of 99 RNase Y-dependent cleavage sites in S. au-reus strain N315 that exhibit enrichment, similar to what we see in B. subtilis, for a guanine immediately upstream of the cleavage sites [13]. This is the same enrichment we see with the 21 B. subtilis Y complex-dependent sites. Given that S. aureus appears to experience Y complex-dependent cleavage, we sought to determine if this G could be a signature of Y complex-dependent cleavage in S. aureus as well [4].
Using Rend-seq data obtained from wild-type and ∆ylbF strains of S. aureus HG003 [a derivative of strain NCTC8325], we determined the number of Y complex-dependent cleav-age events observable from this set of 99 [4]. This comparison is possible because N315 and HG003 share high levels of sequence conservation. Along with the 99 cleavage sites we also have N315 sequences of 50 nt windows symmetric around these sites, with 25nt on either side
Figure 2-3: Evolutionary conservation of G [highlighted] immediately preceding the cleavage site in four sites with high-quality alignments. Asterisks indicate 100% conservation of a given nucleotide.
Figure 2-4: Evolutionary conservation of all nucleotides across all eight high-quality MSAs. Enrichment for G preceding the cleavage site highlighted.
of the cleavage site [Appendix B]. 93/99 of these N315 50 nt windows have an exact match to a region in HG003. Out of these 93 windows, 46 have low body coverage [≤10 reads/nt on average]. These 46 windows also have no visible 5’ peaks at the N315 cleavage site and, as such, were excluded from consideration. Out of the remaining 47 sites with moderate-to-high body read coverage, 6/47 sites had 5’ peaks in wild-type at the N315 cleavage site. Out of these 6 peaks, 5 were either visibly absent or appeared to shift in the ∆𝑦𝑙𝑏𝐹 strain, indicating that these were likely Y complex-dependent processing events. Strikingly, all 5 peaks were preceded by a G, whereas the one non-Y complex-dependent peak was preceded instead by a U [Figure 2-5, Figure S7].
These results suggest that this G preceding the cleavage site could be a signature of S. aureus Y complex-dependent cleavage and suggests that Y complex dependence could be
Figure 2-5: Nucleotide frequency plot of all 5 S. aureus Y complex-dependent windows. Genomic GC% shown.
responsible for the sequence signature previously attributed to RNase Y.
Motif searches and k-mer analyses detect no sequence
mo-tifs common to the Y complex-dependent sites
We next sought to determine if there was any motif enrichment in the 21 B. subtilis sites beyond just that of a guanine immediately preceding the cleavage site. We first probed for consensus sequences from the 21 200nt windows [plots called “sequence logos”] to probe for any nucleotide enrichment that may have been obscured by the frequency plots. We again observed enrichment for a guanine immediately upstream of the cleavage site in addition to a weak enrichment for the sequence UUGUUU from positions -3 to +3 relative to the cleavage site [Figures 2-6 and S13, Appendix B].
Figure 2-6: Sequence logo of all 21 sites in a shortened window. Full logo shown in figure S13.
The sequence logo, however, can only detect enriched sequences/motifs that occur in the same location relative to each cleavage site. We cannot assume that sequences of functional
importance are a roughly fixed distance away from their respective cleavage sites. As such, we used a motif enrichment search called MEME that uses expectation maximization to identify sequence motifs [for more details see Appendix B]. Unlike sequence logos and fre-quency plots MEME is capable of identifying motifs that vary in location across a given set of sequences [14]. We ran MEME to find the top five motifs in the 21 sequence windows. All motifs had E-values far greater than 0.05, thereby indicating that they were not significantly enriched among the 21 windows [Figure 2-7].
Figure 2-7: Top 5 motifs produced by MEME. Note that E > 0.05 is not considered statis-tically significant.
To more comprehensively determine which, if any, sequences may be enriched in the 21 win-dows, we also computed the enrichment of all k-mers [see Appendix B] size 𝑘 =3-10 nt across the windows. This size range is in concordance with previous work on RNA-binding protein motifs [15]. For a given range of values for 𝑘 we find all unique k-mers in the 21 cleavage windows. From there, we calculate enrichment of each k-mer as follows:
To determine the statistical significance of k-mer 𝑥 occurring 𝑛 times across the 21 sites [as represented by their 200nt windows], we first identify the probability that 𝑥 randomly occurs 𝑛 times across all sites. To do so we must first count how many k-mers exist among
the sites. We take this number to be 𝑁 . E.g. if we want to determine the significance of “AGG” occurring once in the sequences “{AGGA, GGGC}” we note first that these sequences produce four possible 3-mers: AGG, GGA, GGG and GGC. AGG occurs once in this set of four sequences, so 𝑁 = 4 and 𝑛 = 1. The probability that AGG occurs once in the sequences AGGA and GGGC is therefore the probability that AGG occurs once in the set “{AGG, GGA, GGG, GGC}”.
As a result, if there exist N total k-mers across the 21 sites for a given value of k, the expected probability that we find 𝑛 copies of a random k-mer x among N possible k-mers would be
(︂𝑁 𝑛
)︂
𝑄(𝑥)𝑛(1 − 𝑄(𝑥))𝑁 −𝑛
The value of 𝑄(𝑥), the probability of a random sequence 𝑥, depends on the sequence of kmer 𝑥, e.g. 𝑄(𝐴𝐺𝐺) = 𝑞(𝐴) * 𝑞(𝐺) * 𝑞(𝐺). We take the observed nucleotide frequencies to be 𝑞(𝐴) = 0.2818, 𝑞(𝑈 ) = 0.2830, 𝑞(𝐺) = 0.2171, 𝑞(𝐶) = 0.2181 based on the B. subtilis strain 168 genome, so 𝑄(𝐴𝐺𝐺) = 0.2818 * 0.2171 * 0.2171 = 0.0133 [Appendix B] [16].
Given that we have calculated the probability that kmer 𝑥 randomly occurs 𝑛 times, we can now calculate the statistical significance of 𝑥 occurring 𝑛 times among all sites.
The 𝑝 value is the probability that 𝑥 occurs ≥ 𝑛 times among the 𝑁 possible kmers. This can be calculated as 𝑝 = 𝑁 ∑︁ 𝑛 (︂𝑁 𝑛 )︂ 𝑄(𝑥)𝑛(1 − 𝑄(𝑥))𝑁 −𝑛
We then apply a Bonferroni correction to account for multiple hypotheses, leaving us with
𝑝 = 𝑁 * (︂ 𝑁 ∑︁ 𝑛 (︂𝑁 𝑛 )︂ 𝑄(𝑥)𝑛(1 − 𝑄(𝑥))𝑁 −𝑛 )︂
. Table 2-1 contains 𝑝 values and frequencies for the top 15 k-mers [Appendix B]. The most enriched k-mer was GAAA [𝑝 = 2.4046 * 10−8], which occurred 54 times across the 21 sites but did not appear in other motif searches. Each k-mer’s location varied significantly
k-mer 𝑝 value Frequency GAAA 7.296*10−8 53 AAAA 7.284*10−7 60 AAAAG 3.867*10−6 24 AAAAA 7.546*10−6 27 UGAAAA 1.614*10−5 13 GAAAA 1.855*10−5 23 UGAAA 2.004*10−5 23 UGAAAAA 4.196*10−5 8 GAAAAA 0.00014 12 AAAUGA 0.00015 12 AAAUG 0.000402 21 AAAUGAAAAA 0.000408 3 AAAUGAAA 0.0005 5 AAAG 0.0007 44 AAAAUGA 0.0008 7
Table 2.1: Table of the top 15 enriched k-mers
across sites. All k-mers, however, were clustered in roughly the same regions as they tended to either be substrings or share multiple nucleotides in common with one another [Figures S14-S28]. Notably, the top motif identified by MEME, GGAGGA, occurred 7 times across the windows, with 𝑝 = 0.0204 [Figure S29].
Given the contradictory results of these different sequence analysis approaches, we have insufficient reason to believe that there exists a single sequence motif common to these 21 sites.
Chapter 3
Structural motif analysis
Secondary structure prediction detects no structural
mo-tifs common to the 21 sites
Previous work on the glycolytic gapA operon has identified two hairpins flanking what is now known to be a Y complex-dependent cleavage site near the cggR 3’ end [22]. Additionally, secondary structures surrounding a Y complex-dependent cleavage site in the cwlO leader sequence may play a role in recruiting RNase Y [23]. As a result, it is conceivable that secondary structure near these Y complex-dependent cleavage sites could be implicated in their processing.
To determine if there existed any secondary structural motifs common to these cleavage sites, we employed multiple approaches to predict the secondary structures of the 21 se-quence windows. The standard approach to RNA folding generally involves producing mini-mum free energy [MFE] structures. MFE folding, however, incorrectly predicts roughly 30% of base pairs of a given structure [24]. To obtain more accurate estimates of the potential structures in vivo, we therefore used four folding approaches: MFE, maximum expected accuracy [MEA], centroid and pairing probability-constrained using ViennaRNA’s RNAfold [25]. MEA folding outputs the most likely structure based on a model trained on known RNA structures [26]. The centroid is the structure with the most overall similarity to all other
structures in the Boltzmann ensemble of possible folds for a given sequence [27]. RNAfold has options to produce MFE, MEA and centroid folds [Appendix B].
While MFE, MEA and centroid folds are useful means of understanding the Boltzmann ensemble for a given sequence, they provide limited insight into the nature of the ensemble itself. Specifically, they provide us with no information about the probability across the entire ensemble that a given nucleotide is paired. We determined the probability over the entire ensemble that each nucleotide was unpaired and used it to constrain folding [“pairing probability-constrained folding”]. This gives us a sense for the variance in structure across the ensemble and serves as a means of determining if the MFE, MEA and centroid structures differ greatly from the rest of the ensemble. In addition to generating pairing probability-constrained structures we also use the pairing probabilities to color all folds [Figures S1-S6, Appendix B].
The probability of each structure in the Boltzmann ensemble 𝑝(𝑠) follows a Boltzmann distribution, where
𝑝(𝑠) = 𝑒
−𝐸(𝑠) 𝑅𝑇
𝑍
for 𝐸(𝑠)=free energy of structure 𝑠, 𝑅 ≈ 1.987 * 10−3 kcalmol K is the gas constant, 𝑇 = 310K and
𝑍 =∑︁
𝑠
𝑒−𝐸(𝑠)𝑅𝑇
is the partition function [28].
To calculate the probability that a given base 𝑥 is unpaired, we first compute the parti-tion funcparti-tion for all structures in the ensemble with 𝑥 unpaired, 𝑍𝑢𝑛𝑝𝑎𝑖𝑟𝑒𝑑. Normalizing this
by the partition function for all structures, 𝑍, produces
𝑝(𝑥 unpaired) = 𝑍𝑢𝑛𝑝𝑎𝑖𝑟𝑒𝑑 𝑍
. Additional details on how to use pairing probabilities to constrain folding are available in Appendix B.
Additionally, evolutionarily conserved secondary structures can be of functional importance [29]. For sites whose multiple sequence alignments yielded an alignment-to-subtilis score of >30 [i.e. for sites whose sequence alignments were previously subject to analysis], we pro-duced evolutionary consensus structures to look for conserved structures near the cleavage sites. Given that compensatory/synonymous mutations are often indicative of evolutionary structure conservation, we used locaRNA to generate these evolutionary consensus structures [30]. We specifically chose locaRNA due to its tolerance to input sequence divergence, in con-trast with sequence-only consensus structure Appendix B such as ViennaRNA’s RNAalifold [31]. We chose not to generate locaRNA structures from sites whose alignments scored <30, however, as this sort of sequence divergence is likely indicative of a lack of proper homology. As such, we used locaRNA structures as a means of providing additional structural insight into a subset of cleavage sites.
While potentially offering more structural insight than MFE alone, centroid, MEA, locaRNA and pairing probability-constrained folds are still error-prone. Structural elements that re-main conserved across all five of these folding approaches, however, are good candidates to also be present in vivo. As such, we sought to combine MFE, MEA, centroid and pairing probability-constrained folds for a given cleavage site’s window to form a consensus structure [see Appendix B]. We did not include locaRNA folds in consensus structure generation as we do not have locaRNA structures for all 21 sites. Figure 3-1 illustrates all possible struc-tures generated for a given site.
Ultimately, none of these folding approaches yielded any visible structural motifs near the cleavage sites [Figures S1-S6].
Figure 3-1: The different folds of the cggR cleavage site. Highlighted regions are common to all folds used to generate the consensus structure. locaRNA strucure also shown. Coloring corresponds to pairing probabilities.
Chapter 4
Analysis of structure surrounding the
cleavage sites
Many cleavage sites are predicted to lie upstream of
sec-ondary structure
Analyzing the pairing probabilities for all windows at each position revealed a decrease in 𝑝(𝑢𝑛𝑝𝑎𝑖𝑟𝑒𝑑) 11-15nts downstream of the cleavage site [Figure 4-1]. As such, we sought to determine if there was an enrichment for secondary structure shortly downstream of the cleavage sites. We found the nucleotide distance from each cleavage-derived 5’ end [used as a proxy for the cleavage site] to the nearest downstream paired base, which we took to be a proxy for the first base of the nearest downstream stem. Some locaRNA folds contained no structures in the 100nts downstream of the cleavage site and, as a result, we chose to omit locaRNA from the rest of our secondary structure analysis. Regardless of folding approach [MFE/MEA/centroid/pairing probability-constrained], the cleavage site was often predicted to lie shortly upstream of a paired base, in concordance with the pairing probabilities. We then checked to see if there existed any similarities among these structures or if they were present at roughly the same distance away from the cleavage site. The distance from cleav-age site to these paired bases varied from window to window [Figure 4-2]. Additionally, we found no similarities in size or shape among the predicted structures downstream of the
Figure 4-1: Pairing probabilities at each position for all sites. Cleavage-derived 5’ end highlighted. Blue lines represent median pairing probabilities, thick bars range from the first to third quartile of the data and thin bars span the full range of the data.
cleavage sites. We therefore currently have insufficient evidence to clearly demonstrate that these structures are necessary for cleavage.
While examining structures downstream of the cleavage sites, we found that a large fraction of cleavage sites were predicted to be paired. Specifically, 13/21 MFE structures, 10/21 MEA structures, 7/21 centroid structures, 12/21 pairing-constrained structures and 10/21 consensus structures had paired cleavage sites. This led us to assess if, rather than there only being an enrichment for structure downstream of Y complex-dependent cleavage sites, such processing instead tended to occur within structured regions.
Figure 4-2: A, Calculation of distance from cleavage-derived 5’ end to nearest downstream paired base. B, Distribution of distances for each type of fold.
The amount of structure at the cleavage sites lacks
statis-tical significance
We sought to determine if the number of cleavage sites predicted to be paired indicated that RNase Y cleaved within structured regions. If so, this would highlight a fundamental differ-ence between RNase Y and its E. coli counterpart RNase E, for which secondary structure
acts as a barrier to cleavage [32].
We first produced three background sets of sequences for which we generated MFE, MEA, centroid, pairing-constrained and consensus folds [see Appendix B and Figure 4-3]. Using the B. subtilis expression data browser we identified the start and end of each of the 5659 B. subtilis ORFs and obtained two 200nt sequences for each ORF, one starting at its start codon and one ending at its stop codon [33]. To avoid any systematic bias introduced by only selecting windows from the start or end of a given ORF, we also created a background set of 5659 200nt sequences chosen at random from the genome [’random windows’].
Figure 4-3: A schematic of the three types of background windows used.
Using these background sets we then analyzed the statistical significance of having a given number of paired sites for each fold, e.g. we determined the significance of having 13/21 paired MFE cleavage sites using MFE folds of the background sequences. Just as was the case for the 21 Y complex-dependent windows, the “cleavage site” for these background se-quences was 100nt away from the end of the window, i.e. at index 100. We produced MFE, MEA and centroid folds for all 16977 windows. Due to runtime constraints we produced 800 folds of both pairing probability-constrained and consensus folds [see Appendix B].
For each background set we ran 100000 iterations of sampling, during which we chose 21 folds with replacement at random. We then determined the number of paired cleavage sites in the sample and, from there, counted the fraction of iterations in which a given sample had greater than or equal to the number of paired cleavage sites as observed in the Y complex-dependent windows. These fractions constitute 𝑝 values. In the case of the MFE folds, 𝑝 = the number of instances out of 100000 for which ≥13/21 sites predicted the “cleavage site” at index 100 to be paired.
The resulting 𝑝 values indicate that, regardless of folding approach, the cleavage sites do not appear to be significantly structured or unstructured. The number of folded sites ob-served appears to primarily be a consequence of the algorithm used [Figure 4-4].
Figure 4-4: 𝑝 values for the number of paired sites for all folds, broken down by background set.
Chapter 5
Discussion
We sought to determine if Y complex-dependent cleavage specificity is determined by se-quence motifs, secondary structure motifs, or a presence/absence of secondary structure. Our results do not find that sequence motifs or secondary structure play a role in Y complex-dependent cleavage but do suggest that cleavage often occurs after a guanine. Interestingly, this guanine is also enriched among S. aureus RNase Y cleavage sites, indicating that the Y complex may play a nontrivial role in mRNA processing in this species. The fact that we see this guanine enrichment in multiple species provides additional support to the notion that it is important for Y complex-dependent cleavage.
This work leaves numerous questions unanswered about the nature of Y complex-dependent cleavage. First, the presence of a G immediately preceding many Y complex-dependent sites is unlikely to be a sufficient condition for cleavage. The B. subtilis genome is AU-rich, with %GC= 43.5 in strain 168 [16]. G’s constitute 21.7% of the genome and, as such, G’s in AU-rich regions are relatively frequent. This G, as a result, can hardly be a means in itself of ensuring cleavage specificity.
However, this G may be part of all RNase Y sites and may not be specific to Y complex-dependent sites. While it is true that we see enrichment among Y complex-complex-dependent sites, we have no evidence suggesting that these sites are the only RNase Y-dependent sites to ex-hibit this sort of enrichment. For example, we do not conclusively know if the G enrichment
observed in 99 S. aureus RNase Y sites is a hallmark of Y complex-dependent cleavage, not just RNase Y-dependent cleavage, as we can only locate 6/99 sites in our Rend-seq data. These questions could be answered by curating a list of RNase Y cleavage sites in B. subtilis that we know not to be Y complex-dependent and seeing if they exhibit a similar enrichment for a G preceding the cleavage site. Such a list would help us conclusively determine if Y complex-dependent cleavage has weak sequence specificity for G’s in AU-rich regions.
We recognize that our work has numerous limitations. First, we are drawing conclusions based on a very small number of sites. At the moment we lack the ability experimentally and computationally to conclusively identify additional potential Y complex-dependent cleavage sites. As such, we realize that more sites may exist and that our current list of 21 may not constitute a representative sample of Y complex-dependent cleavage sites. Due to the small sample size we cannot rule out the notion that Y complex-dependent cleavage sites do in fact possess specific motifs that target them for processing. It is entirely possible that a nontrivial portion of the 21 known sites possess degenerate motifs that cannot be detected due to the small sample size.
Second, we take the amount of predicted structure at the position of cleavage to be a proxy for the amount of structure surrounding the cleavage site. This is an inherently imperfect measurement. One nucleotide is by no means representative of the amount of secondary structure in any given region. This measurement, however, offers the advantage of being easy to perform. If we instead looked at the amount of structure in the region surround-ing the cleavage site [e.g. number of paired bases in a 10nt window symmetric around the cleavage site], we run into a major issue. The amount of structure observed at a given site is dependent on the size of window chosen. As such, choosing a window that is “representative” of the amount of structure surrounding the cleavage site ultimately becomes an arbitrary task. Larger window sizes, in fact, run the risk of obscuring the amount of structure present immediately around the cleavage site and may further confound our results. As such, while using a single nucleotide is far from ideal, increasing the window size is unlikely to alleviate the problem and may in fact exacerbate it.
Third, further experimental validation is needed to confirm our findings. Site-directed muta-genesis, for example, could identify if mutating the G immediately preceding many cleavage sites to a different nucleotide inhibits cleavage [34]. This would indicate that the G is in fact necessary for Y complex-dependent processing. Additionally, in silico structure prediction can only yield so much insight into the in vivo structure of a given transcript. Approaches such as DMS-seq and DMS-MaPseq could be used to identify regions of high and low ac-cessibility in the 21 regions of interest [35] [36]. DMS data could then be used to constrain in silico folding to provide a more complete picture of the likely secondary structure at and around the cleavage sites using RNAfold’s –shape function [25].
Future work could benefit greatly from structural data on the Y complex. We do not currently know the structure of the Y complex as a whole, how or if it interacts directly with RNase Y or where RNase Y/the Y complex bind to transcripts. As such, it is possible that our sequence and structure analysis focuses on regions that are not in fact salient to cleavage. It is possible that all Y complex-dependent processing events involve distal elements such as in the case of the hbs transcript, which is processed by RNase Y but not the Y complex [17]. If so, our analysis is unable to shed light on such phenomena. Additionally, it is possible that RNase Y and the Y complex bind in different locations relative to different cleavage sites. This is not something that we can currently predict, nor it is something for which our work currently accounts.
Our work establishes that Y complex-dependent cleavage is a more complicated process than previously imagined. We now consider a few unexplored mechanisms by which these 21 sites could be targeted for processing.
First, it is possible that tertiary structure, not secondary structure, is the means by which RNase Y and the Y complex is targeted to a given site. Tertiary structure prediction is complex and notably error-prone and, as such, confirming such a possibility would be very difficult without crystal structures [37].
Second, we cannot discount the possibility that RNase Y and the Y complex are not the only factors working to process these 21 sites. It is entirely possible that we are unable to witness motifs or signatures common to these 21 sites because they are subject to different cleavage processes that involve RNase Y and the Y complex. It is feasible that different subsets of these 21 sites require additional specificity factors in order to be processed. Y complex-dependent cleavage sites could therefore contain a diverse array of motifs to attract different sets of auxiliary factors. This is not something that we can currently detect given that we only have 21 sites as reference and do not know of other proteins or RNAs that could work with the Y complex to process sites.
There are a few possibilities for such auxiliary factors. Small RNAs, for example, are known to work with RNase Y to process sites–as such, they could potentially be involved in Y complex-dependent cleavage [38]. Additionally, other proteins could be involved in the pro-cess. These factors could potentially be uncovered via transposon mutagenesis [39].
Our work suggests that Y complex-dependent operon processing lacks distinct signatures that may target RNase Y and the Y complex to these sites, raising questions of whether or not additional factors are necessary for cleavage or if primary and secondary structure are salient for processing. This study lays the groundwork for further examination of RNase Y-dependent processing events in the hopes of better understanding them in all their com-plexity.
Appendix A
Figure S1: MFE structures generated for all 21 sites. Coloring corresponds to pairing prob-abilities.
Figure S2: MEA structures generated for all 21 sites. Coloring corresponds to pairing probabilities.
Figure S3: Centroid structures generated for all 21 sites. Coloring corresponds to pairing probabilities.
Figure S4: Pairing probability-constrained structures generated for all 21 sites. Coloring corresponds to pairing probabilities.
Figure S5: Consensus structures generated for all 21 sites. Coloring corresponds to pairing probabilities.
Figure S6: locaRNA structures generated for 8 sites. Coloring corresponds to pairing prob-abilities.
Figure S7: Rend-seq traces of five S. aureus sites that appear to experience Y complex-dependent cleavage. G preceding the cleavage site highlighted in red.
Figure S12: Full frequency plot for all 21 sites.
Figure S14: Location of “GAAA” motifs across all 21 sites.
Figure S16: Location of “AAAAG” motifs across all 21 sites.
Figure S18: Location of “UGAAAA” motifs across all 21 sites.
Figure S20: Location of “UGAAA” motifs across all 21 sites.
Figure S22: Location of “GAAAAA” motifs across all 21 sites.
Figure S24: Location of “AAAUG” motifs across all 21 sites.
Figure S26: Location of “AAAUGAAA” motifs across all 21 sites.
Figure S28: Location of “AAAAUGA” motifs across all 21 sites.
Appendix B
Supplementary methods
Scripts for all analyses, as well as scripts generating all charts depicted, can be found at
https://github.com/gwlilabmit/Ram_Y_complex. There we provide detailed instructions on how to run all scripts necessary to recreate our work.
Bacillus
sequence windows and genomes of interest
We obtained B. subtilis sequences using bedtools -getfasta on the NC_000964.3 genome. For the purposes of locaRNA and multiple sequence alignments, we combined all 23 Bacillus genomes into one file and ran getfasta with the -split -name options [e.g. bedtools getfasta -fi genome_fasta_files/all_genomes.fasta -bed bedfile.bed12 -fo sequences.txt -split -name].
This approach consistently produced positive strand sequences for a given region of interest. As such, we wrote a script, also available in our github, to reverse complement all sequences corresponding to negative strand windows.
For each window we grabbed 100nt on either side of a given cleavage site. In some in-stances, the cleavage site lies within 100nt of a 5’ end, in which case we started the window at the 5’ end and extended it to 100nt downstream of the site. As a result, all windows contain 100nt downstream of the cleavage site and up to 100nt upstream. This variable motif size accounts for the fact that the spacing between motif and cleavage site may vary
from sequence to sequence.
However, when conducting analysis that required windows from all 21 sites as input, namely nucleotide enrichment searches and sequence logo generation, window sizes were set to that of the shortest window, which happened to be 112nt. Because these techniques analyze the input sequences position by position, our conclusions are strongest when each position is an-alyzed using data from all 21 sites. Such standardization was not necessary when searching for k-mer enrichment or when running MEME as such analyses are predicated on the notion that k-mers of functional importance may have varying distances to their respective cleavage sites.
Rend-seq data visualization and S. aureus analysis
When visualizing B. subtilis rend-seq data in MochiView [40] we used the NC_000964.3 genome as our sequence set. Our github contains the sequence set, location set used as well as the .wig files used for analysis. Please note that the Rend-seq trace seen in figure 1-1b was visualized using a script available on the github as well. Given that there is perfect concor-dance between our visualizations and those produced by MochiView we have not included raw MochiView output.
We referred to table S2 of [13] for 50nt sequences symmetric around the 99 RNase Y cleavage sites discovered via EMOTE. We visualized wild-type and ∆𝑦𝑙𝑏𝐹 S. aureus Rend-seq data in MochiView and searched for each of these sequences inNC_007795.1using the find feature. All materials [sequence set, location set and wigs] used for visualization are in our github. Figure S7 was generated using a script available on our github that, again, shows perfect concordance with MochiView output. Note that all wig files we use were produced as part of [4].
Nucleotide frequency plots, sequence logos and MEME
When running all three sorts of sequence analyses we standardized the length of all sequence windows to that of the shortest window [112nt]. Given that these techniques rely on position-specific information, our conclusions are strongest when each position is analyzed using data from all 21 sites. In all instances windows were aligned at the cleavage site.
We created frequency plots using the Weblogo webserver and checking the “frequency plot” option. We set our resolution to 296dpi and manually set A=green, U=red, G=yellow and C=blue. All other settings were set to their defaults.
For sequence logos, we ran weblogo in shell using a command of the form weblogo –errorbars NO –title “Title of plot” –color-scheme “classic” < infile.txt > outfile.eps.
We ran MEME via its webserver. Our queries limited output to five motifs. We ran a motif search on sequence windows for all 21 sites with a minimum motif width of 3nt and a maximum width of 50nt. We ran a ZOOPS search using both a 0-order and 1st-order back-ground model to correct for both single-nucleotide and dinucleotide biases. Both searches yielded identical results; we chose to show results using a 1st-order background model. All other parameters were set to their defaults.
K-mer analysis
We only show the top 15 k-mers which, coincidentally, are all the k-mers for which 𝑝 < 0.001. The full list of 16595 k-mers and their associated frequencies/𝑝 values can be generated using scripts available on our github.
We find 𝑝(𝐴), 𝑝(𝑈 ), 𝑝(𝐺) and 𝑝(𝐶) by going through the 168 genome, counting the instances of A/U/G/C and dividing by the total nucleotide length of the genome.
Multiple sequence alignments and evolutionary nucleotide
conserva-tion
For both sequence alignments and locaRNA we generated fasta-format files for each cleavage site. Fasta headers denoted the species corresponding to each sequence.
We ran multiple sequence alignments using Clustal Omega 2 in shell [41]. We always gener-ated “slow/accurate” alignments. All species used for the alignment have either “reference” or “representative” NCBI genomes. Both genome types are curated and validated [42]. Addi-tionally, we confirmed using NCBI BLAST and String-db all species contain genes encoding for RNase Y and all members of the Y complex and, as a result, could feasibly experience Y complex-dependent cleavage [43] [44]. The list of species used, including B. subtilis, can be found in Table B.1.
For each of the 21 sites, we first searched for sequence homology to B. subtilis using NCBI BLAST [45]. If a given species had multiple homologs to the corresponding B. subtilis se-quence, we ran EMBOSS needle to find the homolog with the best pairwise alignment to the B. subtilis sequence [46]. Each B. subtilis window needed ≥ 11 homologous sequences in order to be considered for further analysis. As a result, the site could perceivably also be subject to Y complex-dependent cleavage in these other species. 5/21 sites had <10 homol-ogous sequences and, as such, were excluded from consideration.
We then defined the “alignment-to-subtilis” score to be the average pairwise alignment scores [as produced by Clustal Omega] between B. subtilis and all other sequences [41]. We know the location of the B. subtilis sequence for each fasta-format input file to Clustal Omega and, as a result, can identify identity scores for all pairwise alignments to B. subtilis [Figure S30]. From here we simply take the average of these pairwise alignment scores to produce the alignment-to-subtilis score.
Bacillus pseudofirmus OF4 [47] Bacillus clausii KSM-K16 [48]
Bacillus licheniformis DSM 13 = ATCC 14580 [49] Bacillus cytotoxicus NVH 391-98 [50]
Bacillus cellulosilyticus DSM 2522 [51] Bacillus amyloliquefaciens DSM 7 [52] Bacillus oceanisediminis 2691 [53] Bacillus thuringiensis YBT-1518 [54] Bacillus methanolicus MGA3 [55] Bacillus mycoides [56]
Bacillus megaterium NBRC 15308 = ATCC 14581 [57] Bacillus smithii [58] Bacillus simplex [59] Bacillus pumilus [60] Bacillus weihaiensis [61] Bacillus flexus [62] Bacillus horikoshii [63] Bacillus atrophaeus [64] Bacillus glycinifermentans [65] Bacillus anthracis str. Ames [66] Bacillus anthracis str. Sterne [67] Bacillus thuringiensis [68]
Bacillus cereus ATCC 14579 [69]
Bacillus subtilis subsp. subtilis str. 168 [16]
Table B.1: List of species used for MSA and locaRNA.
around the B. subtilis cleavage site for all MSAs. We choose this window size because the distance from B. subtilis cleavage site to the start of each MSA varies significantly from alignment to alignment. We then determined the fraction of A/U/C/G at each position for a given MSA. From there, we aligned all eight MSAs and determined again the fraction of A/U/C/G at each position. For code please consult our github.
MFE/MEA/Centroid structure generation
We generated MFE/MEA/centroid structures via RNAfold in shell. The commands used were as follows:
Figure S30: An example of the pairwise alignment scores used to generate an alignment-to-subtilis score. In this case the B. alignment-to-subtilis sequence is sequence 1.
rnafold –noPS –infile=fasta_format_sequences.txt –outfile=mfe_s-tructures.txt
MEA:
rnafold –noPS –MEA –infile=fasta_format_sequences.txt –outfile= mea_structures.txt
Centroid:
rnafold –noPS -p –infile=fasta_format_sequences.txt –outfile=ce-ntroid_structures.txt
Pairing probability-constrained structure generation
Because unpaired bases have greater accessibility than paired bases, we can then treat these pairing probabilities as we would SHAPE-seq/DMS-seq accessibility values. We can therefore constrain folding with pairing probabilities using RNAfold’s –shape option. The resulting command follows the form
rnafold –noPS –shape=pairing_probabilities.dat
–infile=fasta_format_sequence.txt –outfile=pairing_probability_st-ructure.txt
The .dat file is a two-column text file. Each line is tab-separated–the first entry is the [one-indexed] position and the second entry is that position’s accessibility. In order to gen-erate the .dat files we need to produce 𝑍𝑢𝑛𝑝𝑎𝑖𝑟𝑒𝑑 for all positions in addition to determining 𝑍.
We find 𝑍 by running the command rnafold –noPS -p0
–infile=fasta_fo-rmat_sequence.txt –outfile=z_value.txt on a sequence window of interest. The output file provides us with the ensemble free energy.
We find 𝑍𝑢𝑛𝑝𝑎𝑖𝑟𝑒𝑑 by individually constraining each nucleotide in the window to be unpaired
[“x” using RNAfold constraints] and running the following:
rnafold –noPS -p0 -C –infile=fasta_format_constraints.txt
–outfile=z_value.txt. The constraints are fasta-formatted as “fasta header \n sequence \n constraints \n”. Constraint examples are available in our github. Again this produces ensemble free energies, which we take to be 𝑍𝑢𝑛𝑝𝑎𝑖𝑟𝑒𝑑 for each position.
Note that, while these scripts can run in batch, they require that each site have its own set of files [i.e. separate .txt files dedicated to [1] the constraints, [2] the 𝑍𝑢𝑛𝑝𝑎𝑖𝑟𝑒𝑑 values [3]
the 𝑍 value].
From here we can produce .dat files from the 𝑍 and 𝑍𝑢𝑛𝑝𝑎𝑖𝑟𝑒𝑑 values generated. Note that
each site must have its own .dat file else RNAfold –shape will not work as intended.
From here we can generate the pairing probability-constrained structures using the dat-files.
as the process is quick to perform on a small number of sites. We did, however, automate it when performing 𝑝 value analysis. All scripts to perform pairing probability-constrained structure generation are available on our github, both automated and non-automated. We recommend not automating structure generation if running these scripts for the first time on a small number of sites.
Consensus structure generation
For each site of interest we collect all salient structures into one file. In some cases RNAfold introduces an extra loop at the end of a structure–this loop corresponds to no sequence. As such, we standardize the length of our consensus structure to be that of the shortest structure. We then iterate over each structure position by position to generate a preliminary consensus structure [“pre-consensus structure”].
If a simple majority of sites have a given character 𝑘 [‘.’, ‘(’ or ‘)’] at position 𝑥, the pre-consensus structure has character 𝑘 at position 𝑥. In the event of a tie [e.g. ‘.’ in two sites at position 𝑥 while ‘)’ is present in the other two sites at position 𝑥], we choose one of the tied characters for the pre-consensus structure’s position 𝑥.
In the case of the 21 cleavage sites, the pre-consensus dot-bracket structures must undergo parentheses matching prior to being visualized. As such, we only use parentheses-matched consensus structures for our analysis but recognize that, if we were to produce dot-bracket representations of the in vivo structures of these 200nt windows, the result may not be parentheses-matched. For the sake of consistency we therefore perform parentheses match-ing on all consensus structures used for 𝑝 value analysis. We perform matchmatch-ing as follows:
We assume that all structures present in the window must start and end within the window. As such, we iterate through the string and push each left paren [i.e. the start of a stem] to a stack. If we encounter a right paren [i.e. the end of a stem] prior to the first left paren, we set it to “.” [“unpaired”]. As such, “...).” becomes “...”. We then paren-match from the “outside-in.” We assume last-seen left-paren is matched with the first-seen right paren, i.e.
in “.(().)” the first “(” pairs with the last “)” and so on. As such, every time we observe a right paren, we pop the left paren stack. If we reach the end of the string prior to emptying the stack, all remaining left parens are set to “.”. Similarly, if we empty the stack and find additional right parens, we set them all to “.”.
Scripts to generate consensus structures are available on our github.
locaRNA structure generation
We ran locaRNA using itswebserverusing default settings. For details on locaRNA structure generation please see our github.
Structure visualization
We visualized structures for all 21 sites in VARNA using the command
java -cp relative/path/to/VARNAv3-93.jar fr.orsay.lri.varna.appli-cations.VARNAcmd -i structure_of_interest.txt -colorMapStyle
“0.00:#0000FF,0.50:#FFFFFF,1.00:#FF0000” -colorMap [colormap values here] [70]. This colors each nucleotide in the structure with its corresponding pairing probability. We grabbed colormap values for a given site from the .dat files produced by pairing probability-constrained structure generation. Colormap values must be comma-separated without spaces, e.g. 1.0,2.0,3.0. Scripts to generate colormaps from .dat files are available on our github.
We manually identified and colored the cleaved 5’ on each site using VARNA’s “annotate region” feature [size of annotation set to 20]. We also colored the first nucleotide of the near-est start codon as well as the last nucleotide of the nearnear-est stop codon in the same fashion if they were also present within the window.
𝑝 value analysis for pairing probability-constrained and consensus
folds
Due to runtime constraints, we produced pairing probability-constrained and consensus folds from each background set in batches of 100, ran 100000 rounds of sampling and repeated until we observed no change in the resulting 𝑝 values from the past iteration. This resulted in 800 folds from each background set. For scripts and additional information please consult our github.
Bibliography
[1] Bervoets, I., & Charlier, D. (2019). Diversity, versatility and complexity of bacterial gene regulation mechanisms: opportunities and drawbacks for applications in synthetic biology. FEMS microbiology reviews, 43(3), 304-339.
[2] Takayama, K., & Kjelleberg, S. (2000). The role of RNA stability during bacterial stress responses and starvation. Environmental Microbiology, 2(4), 355-365.
[3] Takayama, K., & Kjelleberg, S. (2000). The role of RNA stability during bacterial stress responses and starvation. Environmental Microbiology, 2(4), 355-365.
[4] DeLoughery, A., Lalanne, J. B., Losick, R., & Li, G. W. (2018). Maturation of polycistronic mRNAs by the endoribonuclease RNase Y and its associated Y-complex in Bacillus subtilis. Proceedings of the National Academy of Sciences, 115(24), E5585-E5594.
[5] Hui, M. P., Foley, P. L., & Belasco, J. G. (2014). Messenger RNA degradation in bacterial cells. Annual review of genetics, 48, 537-559.
[6] Naureckiene, S., & Uhlin, B. E. (1996). In vitro analysis of mRNA processing by RNase E in the pap operon of Escherichia coli. Molecular microbiology, 21(1), 55-68.
[7] Mackie, G. A. (2013). RNase E: at the interface of bacterial RNA processing and decay. Nature Reviews Microbiology, 11(1), 45.
[8] Carpousis, A. J. (2002). The Escherichia coli RNA degradosome: structure, function and relationship to other ribonucleolytic multienyzme complexes.
[9] Lehnik-Habrink, M., Pförtner, H., Rempeters, L., Pietack, N., Herzberg, C., & Stülke, J. (2010). The RNA degradosome in Bacillus subtilis: identification of CshA as the major RNA helicase in the multiprotein complex. Molecular microbiology, 77(4), 958-971.
[10] Lehnik-Habrink, M., Newman, J., Rothe, F. M., Solovyova, A. S., Rodrigues, C., Herzberg, C., ... & Stülke, J. (2011). RNase Y in Bacillus subtilis: a natively disordered protein that is the functional equivalent of RNase E from Escherichia coli. Journal of bacteriology, 193(19), 5431-5441.
[11] Commichau, F. M., Rothe, F. M., Herzberg, C., Wagner, E., Hellwig, D., Lehnik-Habrink, M., ... & Stülke, J. (2009). Novel activities of glycolytic enzymes in Bacillus subtilis: interactions with essential proteins involved in mRNA processing. Molecular & Cellular Proteomics, 8(6), 1350-1360.
[12] Ludwig, H., Homuth, G., Schmalisch, M., Dyka, F. M., Hecker, M., & Stülke, J. (2001). Transcription of glycolytic genes and operons in Bacillus subtilis: evidence for the presence of multiple levels of control of the gapA operon. Molecular microbiology, 41(2), 409-422.
[13] Khemici, V., Prados, J., Linder, P., & Redder, P. (2015). Decay-initiating endoribonu-cleolytic cleavage by RNase Y is kept under tight control via sequence preference and
sub-cellular localisation. PLoS genetics, 11(10), e1005577.
[14] Bailey, T. L., Boden, M., Buske, F. A., Frith, M., Grant, C. E., Clementi, L., ... & Noble, W. S. (2009). MEME SUITE: tools for motif discovery and searching. Nucleic acids research, 37(suppl_2), W202-W208.
[15] Dominguez, D., Freese, P., Alexis, M. S., Su, A., Hochman, M., Palden, T., ... & Yeo, G. W. (2018). Sequence, structure, and context preferences of human RNA binding proteins. Molecular cell, 70(5), 854-867.
[16] Bacillus subtilis subsp. subtilis str. 168 complete genome - Nucleotide - NCBI. (2019). Ncbi.nlm.nih.gov. Retrieved 8 August 2019, from
https://www.ncbi.nlm.nih.gov/nuccore/NC_000964.3
[17] Braun, F., Durand, S., & Condon, C. (2017). Initiating ribosomes and a 5’/3’-UTR interaction control ribonuclease action to tightly couple B. subtilis hbs mRNA stability with translation. Nucleic acids research, 45(19), 11386-11400.
[18] Manzourolajdad, A., & Arnold, J. (2015). Secondary structural entropy in RNA switch (Riboswitch) identification. BMC bioinformatics, 16(1), 133.
[19] McDowall, K. J., Lin-Chao, S., & Cohen, S. N. (1994). A+ U content rather than a particular nucleotide order determines the specificity of RNase E cleavage. Journal of Biological Chemistry, 269(14), 10790-10796.
[20] Koonin, E. V., & Galperin, M. (2013). Evolutionary Concept in Genetics and Genomics. In Sequence—evolution—function: computational approaches in comparative genomics.
Springer Science & Business Media.
[21] Gilson, A. I., Marshall-Christensen, A., Choi, J. M., & Shakhnovich, E. I. (2017). The role of evolutionary selection in the dynamics of protein structure evolution. Biophysical journal, 112(7), 1350-1365.
[22] Meinken, C., Blencke, H. M., Ludwig, H., & Stülke, J. (2003). Expression of the glycolytic gapA operon in Bacillus subtilis: differential syntheses of proteins encoded by the operon. Microbiology, 149(3), 751-761.
[23] Noone, D., Salzberg, L. I., Botella, E., Bäsell, K., Becher, D., Antelmann, H., & Devine, K. M. (2014). A highly unstable transcript makes CwlO D, L-endopeptidase expression responsive to growth conditions in Bacillus subtilis. Journal of bacteriology, 196(2), 237-247.
[24] Hajiaghayi, M., Condon, A., & Hoos, H. H. (2012). Analysis of energy-based algorithms for RNA secondary structure prediction. BMC bioinformatics, 13(1), 22.
[25] Hofacker, I. L. (2003). Vienna RNA secondary structure server. Nucleic acids research, 31(13), 3429-3431.
[26] Clote, P., Lou, F., & Lorenz, W. A. (2012). Maximum expected accuracy structural neighbors of an RNA secondary structure. BMC bioinformatics, 13(5), S6.
[27] Ding, Y. E., Chan, C. Y., & Lawrence, C. E. (2005). RNA secondary structure prediction by centroids in a Boltzmann weighted ensemble. Rna, 11(8), 1157-1166.
[28] RNAlib-2.4.14: Partition Function and Equilibrium Probability Algo-rithm(s). (2019). Tbi.univie.ac.at. Retrieved 14 November 2019, from
https://www.tbi.univie.ac.at/RNA/ViennaRNA/doc/html/pf_algorithm.html
[29] Washietl, S., Hofacker, I. L., Lukasser, M., Hüttenhofer, A., & Stadler, P. F. (2005). Mapping of conserved RNA secondary structures predicts thousands of functional noncoding RNAs in the human genome. Nature biotechnology, 23(11), 1383.
[30] Hofacker, I. L., Fekete, M., & Stadler, P. F. (2002). Secondary structure prediction for aligned RNA sequences. Journal of molecular biology, 319(5), 1059-1066.
[31] Gruber, A. R., Bernhart, S. H., & Lorenz, R. (2015). The ViennaRNA web services. In RNA bioinformatics (pp. 307-326). Humana Press, New York, NY.
[32] Richards, J., & Belasco, J. G. (2019). Obstacles to Scanning by RNase E Govern Bacterial mRNA Lifetimes by Hindering Access to Distal Cleavage Sites. Molecular cell, 74(2), 284-295.
[33] Nicolas, P., Mäder, U., Dervyn, E., Rochat, T., Leduc, A., Pigeonneau, N., ... & Becher, D. (2012). Condition-dependent transcriptome reveals high-level regulatory architecture in Bacillus subtilis. Science, 335(6072), 1103-1106.
[34] Ho, S. N., Hunt, H. D., Horton, R. M., Pullen, J. K., & Pease, L. R. (1989). Site-directed mutagenesis by overlap extension using the polymerase chain reaction. Gene, 77(1), 51-59.
[35] Rouskin, S., Zubradt, M., Washietl, S., Kellis, M., & Weissman, J. S. (2014). Genome-wide probing of RNA structure reveals active unfolding of mRNA structures in vivo.


![Figure 2-3: Evolutionary conservation of G [highlighted] immediately preceding the cleavage site in four sites with high-quality alignments](https://thumb-eu.123doks.com/thumbv2/123doknet/14752082.580693/23.918.356.548.125.925/figure-evolutionary-conservation-highlighted-immediately-preceding-cleavage-alignments.webp)


