HAL Id: hal-03143769
https://hal.archives-ouvertes.fr/hal-03143769
Submitted on 17 Feb 2021HAL is a multi-disciplinary open access archive for the deposit and dissemination of sci-entific research documents, whether they are pub-lished or not. The documents may come from teaching and research institutions in France or abroad, or from public or private research centers.
L’archive ouverte pluridisciplinaire HAL, est destinée au dépôt et à la diffusion de documents scientifiques de niveau recherche, publiés ou non, émanant des établissements d’enseignement et de recherche français ou étrangers, des laboratoires publics ou privés.
A critical analysis of the X-ray photoelectron spectra of
Ti3C2Tz MXenes
Varun Natu, Mohamed Benchakar, Christine Canaff, Aurélien Habrioux,
Stephane Celerier, Michel Barsoum
To cite this version:
Varun Natu, Mohamed Benchakar, Christine Canaff, Aurélien Habrioux, Stephane Celerier, et al.. A critical analysis of the X-ray photoelectron spectra of Ti3C2Tz MXenes. Matter, Cell Press, 2021, �10.1016/j.matt.2021.01.015�. �hal-03143769�
1
A Critical Analysis of the X-Ray Photoelectron Spectra of Ti
3C
2T
zMXenes
Varun Natuǂ, Mohamed Benchakarǁ, Christine Canaffǁ, Aurélien Habriouxǁ, Stéphane Célérier ǁ, and Michel W. Barsoumǂ,*
ǂ
Department of Materials Engineering, Drexel University, Philadelphia, PA, USA ǁ
Institut de Chimie des Milieux et Matériaux de Poitiers (IC2MP), Université de Poitiers, CNRS, F-86073 Poitiers, France
*Corresponding author: barsoumw@drexel.edu
Abstract:
Since their discovery in 2011, the 2D transition metal carbide, nitrides, and carbonitrides -
dubbed MXenes - have garnered a lot of worldwide interest. Given their 2D structure, surface, or
termination, chemistries play a vital role in most applications. X-ray photoelectron spectroscopy,
XPS, is one of the most common characterization tools for quantifying surface terminations and
overall chemistry. Herein we critically review the XPS fitting models proposed for Ti3C2Tz
MXene in the literature and make the case that they are at best incomplete and at worst
contradictory. We propose a new fitting algorithm based on all the data obtained from previously
published studies. In our approach, we assign the Ti 2p peak at 455.0 eV, to the C-Ti-O\O\O and
C-Ti-C octahedra. The peaks at 456.0, 457.0, 457.9, and 459.6 eV are assigned to C-Ti-O\O\F,
C-Ti-O\F\F, C-Ti-F\F\F, and TiO2-xF2x, respectively. The first four represent possible Ti atom
terminations; the last is an oxyfluoride. In our proposed model we do not distinguish between O
and OH terminations in the Ti 2p spectra; we only do so in the O spectra. Lastly, we propose and
2
Introduction:
After the discovery of 2D titanium carbide (Ti3C2Tz) - the first MXene - in 2011, nearly 30 new
MXenes have been discovered so far in the last 10 years and several others are predicted to be
stable according to computational calculations and are awaiting experimental realization.[1–3]
MXenes show potential in various applications like energy storage and conversion,[4–6]
photodetectors and sensors,[7] catalysts for various reactions,[8] reinforcement in polymer
composites,[9] and electromagnetic interference (EMI) shielding,[10] among many others. MXenes
are so labelled because they are obtained by selective etching of the A atomic layers from the
parent MAX phases. The MAX phases have a general formula of Mn+1AXn where M stands for
an early transition metal, X stands for C and/or N and A is mostly a group 13 or 14 element.[11–13]
Because when the Al layers are etched they are replaced by surface terminations, the general
formula of MXenes is Mn+1XnTz, where Tz represents surface terminations that are typically a
combination of –O, –OH, and/or –F.[14] The -ene suffix was added to signify their similarity to
other 2D materials like graphene.[1] Recently discovered MXene synthesis technique of using
molten salt to etch out the A layer leads to terminations like -Cl, -Br, and -I, and further chemical
modifications can also result in -S, -Te, and -NH terminations.[15,16]
Given the 2D morphology of MXenes, their surface chemistries play an important role in
determining their properties. For example, surface terminations are responsible for the
spontaneous ion intercalation and exchange in between MXene layers.[17] They are also
responsible for the hydrophilicity of MXenes which makes it one of the most easily processable
2D material.[18] In energy storage devices like supercapacitor and batteries, MXene surface
3
Kamysbayev et al. showed that superconductivity in Nb2CTz is dependent on the type of surface
terminations.[16] The work function of MXenes can also be tuned by modifying its surface groups
making them good electronic contacts in circuits.[20] Apart from these applications, MXene
surface terminations have also been shown to play a role in influencing optical, mechanical,
magnetic and, a multitude of other properties.[21]
Due to the critical role surface terminations play on properties, it is important to characterize
them properly. There a number of techniques that can do so including, X-Ray photoelectron
spectroscopy (XPS), X-ray adsorption spectroscopy (XAS),[22] nuclear magnetic resonance
spectroscopy (NMR),[23,24] Raman spectroscopy,[25] and transmission electron microscopy (TEM)
coupled with electron energy loss spectroscopy (EELS).[26,27] XPS remains the most widely used
of all the techniques. There are several advantages of using XPS to analyze MXenes as it is
sensitive to all the elements except H and He.[28] It can be used to analyze bonding environments
of constituent elements, quantify the elemental compositions including terminations, and detect
small concentrations of elements especially if they are at the surfaces.[28] Other advantages
include non-destructive sample preparation and the fact that restrictions on sample size and form
are low. XPS spectrometers are widely available in most university settings and large research
and development laboratories.
To date, four studies have focused on understanding and fitting XPS spectra on Ti3C2Tz
flakes.[14,20,29,30] As discussed below, while there are similarities between the various fitting
protocols, there are also some inconsistencies that can sow confusion. In this review, we
summarize XPS fitting models proposed in the literature especially for Ti3C2Tz and, propose a
4
we fit the XPS spectra based on nature of the surface termination surrounding each Ti atom,
rather than the oxidation states of Ti as many, including us, have previously done. We also argue
that the ambiguity in the fitting is higher in the O and F spectra compared to the Ti and C
high-resolution spectra.
Before going into a detailed discussion of the various fits, it should be noted that the Ti 2p
spectrum has 2 peaks at roughly 455 and 463 eV corresponding to Ti 2p3/2 and Ti 2p1/2
respectively. The Ti 2p peak is split into 2 peaks due to spin-orbit splitting and both peaks
contain information about the Ti bonding environment . Therefore, when component peak fitting
is used to deconvolute these peaks, all components fit under the Ti 2p3/2 peak are also fit in the Ti
2p1/2 peak (further details are given later in the Titanium section). Component peaks are fit to
understand what species of Ti are present and from here onwards in the discussion of the various regions whenever ‘peaks’ are mentioned we refer to the component peaks used to fit the spectra
and not the envelope peaks.
Fit-I
The first detailed study dedicated to understand the XPS spectra of Ti3C2Tz was carried out by
Halim et al. in 2016.[14] They based their fittings on the oxidation states of Ti and attribute the
first 3 peaks at 455.0 eV, 455.8 eV, and 457.2 eV to Ti+1, Ti+2, Ti+3 oxidation states, respectively
(Fig. 1a, Table 1). The peak separation between the Ti 2p3/2 and 2p1/2, ΔTi2p, caused by spin-orbit
splitting (see below) was kept fixed at 6.2 eV, 5.5 eV, and 5.7 eV for the Ti+1, Ti+2, Ti+3 peaks,
respectively (Table 1).[14] This ΔTi2p is consistent with other XPS studies on Ti metal and related
5
The ΔTi2p in TiO (Ti+2) is ~ 5.6-5.7 eV and that for Ti2O3 (Ti+3) is ~ 5.7 eV. [31,32] In our proposed
fit (see below) a ΔTi2p of 6.1 eV was used for all Ti peaks related to Ti3C2Tz.
The C-Ti-F component peak was set at 460.2 eV, with a ΔTi2p of 6 eV (Table 1). These values are
consistent with fluorinated Ti compounds like TiF3.[33] The last set of Ti peaks found around
459.3 eV (ΔTi2p= 5.6 eV) and 460.2 eV (ΔTi2p= 6 eV) (Fig. 1a, Table 1) were ascribed to TiO2
and TiO2-xF2x oxides, respectively, formed due to the degradation/oxidation of Ti3C2Tz by
reaction with ambient air and/or water. Note that Halim et al. assumed these two components not
to originate from the Ti3C2Tz flakes themselves, but rather from their oxides and oxyfluorides.
We make the same assumption below.
Irrespective of the type of termination present, the C 1s high-resolution spectra associated with
Ti3C2Tz all appear in the quite narrow range of ≈ 281.9-282.0 eV (Fig. 1b, Table 1). This signal
originates from C-atoms residing in the Ti octahedra. The rest of the components are typically
ascribed to C contamination introduced during synthesis or from ambient air. This is so universal
in Ti3C2Tz synthesized in F-ion containing acids that it can be used as a check on the calibration
of the XPS spectra. As discussed below, there are some exceptions (for details see Carbon (C
1s) section).
In the O 1s spectra (Fig. 1c, Table 1), two components associated with Ti3C2Tz flakes were set at
531.2 eV and 532.0 eV and ascribed to -O and -OH terminations, respectively. Three other peaks
were added to the fitting at 529.9 eV, 532.8 eV, and 533.8 eV corresponding to, respectively,
TiO2, Al2O3, and adsorbed or interlayer water (Table 1). Contributions from C-O, C=O, -COOH,
6
making their estimation difficult and probably leading to overestimation of some of the
components in the O 1s spectra.
The F 1s spectra were fit with 4 components corresponding to C-Ti-F, TiO2-xF2x, AlFx, and
Al(OF)x at 685.0, 685.3, 686.4, and 688.3 eV, respectively. With only 38 % of the total
photoemission spectra attributed to the C-Ti-F of MXene itself, the majority was due to the
aforementioned impurities.
7 Figure 1: Component peak fits of XPS spectra of as-prepared Ti3C2Tz powders. High-resolution
component peak fits of, a) Ti 2p, b) C 1s, c) O 1s, and d) F 1s regions.[14]
Table 1: Summary of XPS peak fits by Halim et al. shown in Figure 1.[14] The Ti3C2Tz sample was prepared by etching the MAX phase in 48% HF. Binding energies BE and full-width at half maximum, FWHM, values of the Ti 2p3/2 peaks are listed in columns 2 and 3, respectively. Respective numbers for Ti 2p1/2 peaks are shown in brackets.
Region BE (eV) FWHM (eV) Fraction Assigned to
Ti 2p3/2 (2p1/2) 455.0 (461.2) 455.8 (461.3) 457.2 (462.9) 458.6 (464.2) 459.3 (465.3) 460.2 (466.2) 0.8 (1.5) 1.5 (2.2) 2.1 (2.1) 0.9 (1.0) 0.9 (1.4) 1.6 (2.7) 0.28 0.30 0.32 0.02 0.03 0.05 C-Ti-(O/OH) C-Ti2+-(O/OH) C-Ti3+-(O/OH) TiO2 TiO2-xF2x C-Ti-F C 1s 282.0 284.7 286.3 0.6 1.6 1.4 0.54 0.38 0.08 C-Ti-(O/OH/F) C-C CHx/C-O O 1s 529.9 531.2 532.0 532.8 533.8 1.0 1.4 1.1 1.2 2.0 0.29 0.18 0.18 0.19 0.17 TiO2 C-Ti-Ox and/or OR C-Ti-OHx and/or OR Al2O3 and/or OR H2O and/or OR F 1s 685.0 685.3 686.4 688.3 1.7 1.1 2.0 2.0 0.38 0.29 0.30 0.02 C-Ti-F TiO2-xF2x AlFx Al(OF)x Fit-II:
Persson et al.[29] proposed a different fitting model. They based their fits on the crystal sites that
the various atoms occupy.[29] When dealing with the Ti spectra, they differentiated between
8
“\” are the terminations present. For example, C-Ti-O\O\O corresponds to Ti atoms in octahedra
with 3 C atoms and 3 O surface atoms at the vertices. In C-Ti-F\F\F, all the terminations are F.
The notation C-Ti-(O,F) represents mixed O and F-terminations.[29]
Their fits are based on density functional theory (DFT) calculations by Khazaei et al. who found
two thermodynamically favorable sites on MXene surfaces: A sites A corresponding to surface
group occupying positions above the central Ti atom (so-called FCC sites) and B sites
corresponding to surface group above the C atoms right below the surface Ti atoms (Figs. 2d,e).
[34]
The Ti 2p3/2 peak was fit with 3 components corresponding to Ti-O\O\O, Ti-(O,F), and
C-Ti-F\F\F at 455.1 eV, 455.9 eV, and 456.9 eV, respectively (Fig. 2c, Table 2). As just noted,
because Persson et al. do not distinguish between the C-Ti-O\O\F, C-Ti-O\F\F configurations;
they only assigned one peak for the two at 455.9 eV. The ΔTi2p was kept constant for all
components and fixed at 6.1 eV. Also, no oxide peaks were included in the fits as the authors
scanned MXenes right after etching and washing with minimal exposure to ambient air.
The O 1s spectra were fit with 3 peaks, 2 of which were assigned to -O terminations occupying
the A and bridging sites, while the third was assigned to a -O co-absorbed with -F on the A sites.
The respective energies were 531.3, 529.9, and 531.9 eV (Fig. 2b, Table 2). Similarly, in the F 1s
spectra, 2 peaks were observed at 684.5 eV and 685.4 eV corresponding to F terminations and
-F terminations co-adsorbed with O (-Fig. 2a, Table 2). Similar to -Fit-I, only one C 1s peak at
282.0 eV was ascribed to the MXene flakes; the rest were ascribed to adventitious C
contaminations.
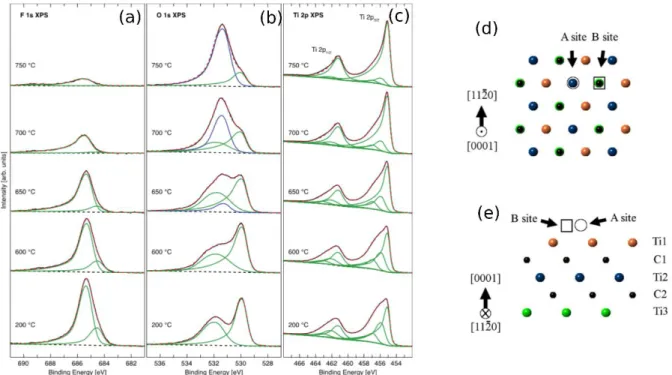
9 Figure 2: Peak fits of XPS spectra of Ti3C2Tz MXene during in-situ vacuum annealing inside a XPS chamber at various temperatures. High-resolution component peak fits of, a) F 1s b) O 1s, c) Ti 2p, and d) F1s regions ; d) top and e) side view with A and B possible termination sites.[29]
Table 2: Summary of XPS peak fits shown in Figure 2. The Ti3C2Tz sample was prepared by etching the MAX phase in 10 % HF. Binding energies BE and FWHM values of Ti 2p3/2 peaks are listed in columns 2 and 3, respectively. Respective numbers for the Ti 2p1/2 peaks are shown in brackets.
[29]
This summary is only of the fits after annealing at 200 °C.
Region BE (eV) FWHM (eV) Assigned to
Ti 2p3/2 (2p1/2) 455.1 (461.2) 455.9 (462.0) 456.9 (463.0) 0.7 (1.4) 1.1 (1.9) 1.1 (1.9) C-Ti-O\O\O C-Ti-(O, F) C-Ti-F\F\F C 1s 282.0 284.3 285.2 286.4 0.64 1.3 1.3 1.3 Ti-C-Ti C-C CHx C-OH O 1s 529.9 531.3 531.9 0.89 1.2 1.6-2.3 C-Ti-O (bridging) C-Ti-O (A-site) C-Ti-O/F (A-site) F 1s 684.5 685.4 1.0 1.0 C-Ti-F C-Ti-O, F
10
Fit-III:
Similar to Persson et al.[29], Schultz et al. also measured XPS in situ as a function of heating but
they used a different fitting model (Fig. 3, Table 3).[20] Three components were fit in the Ti 2p3/2
spectra (Fig. 3g) corresponding to C-Ti-C, C-Ti-O, and C-Ti-F at 455.2 (ΔTi2p=5.9 eV), 456.2
(ΔTi2p=5.4 eV) and 457.3, eV (ΔTi2p=5.4 eV), respectively (Fig. 3g, Table 3). The first peak was
assigned to Ti bonded to C only – i.e. the central Ti atoms labelled Ti2 in Fig. 3b - while the
second and third peaks were assigned to Ti atoms bonded to pure O- and pure F-terminations,
respectively (Fig. 3g). In this model, the assumption was made that the central Ti atoms
surrounded octahedrally with 6 C atoms can be differentiated from the ones closer to the
surfaces. As discussed below, such differentiation is not trivial to say the least.
In the O 1s spectra, 3 related components were fit at 529.8, 531.6, and 533.8 eV corresponding to
bridging O-terminations (Fig. 3h), O-terminations at A/B sites (Figs. 3b,c), and OH terminations
at A/B sites. Schultz et al. claimed that the OH component overlaps with adsorbed water making
those two difficult to distinguish. Only one component for the C and F spectra corresponding to
MXene was fit at 291.9 eV and 685.2 eV, respectively, the remainder were ascribed to impurities
(Fig. 3f, i, Table 3). Henceforth this fit proposed by Schultz et al. will be referred to as Fit-III.
11 Figure 3: a) Top and b-e) side views with possible termination sites. Peak fits of XPS spectra of Ti3C2Tz during in situ vacuum annealing inside an XPS chamber at various temperatures. High-resolution component peak fittings of, f) C 1s, g) Ti 2p, h) O 1s, and i) F1s region.[20]
12 Table 3: Summary of XPS peak fits shown in Figure 3. Sample was prepared by etching Ti3AlC2 in a LiF+HCl mixture. Numbers in brackets in column 2 are peak locations for Ti 2p1/2 while the BE values the Ti 2p3/2 peaks are listed outside the brackets.
[20]
These values correspond to fits of spectra collected at RT.
Region BE (eV) Assigned to Ti 2p3/2 (2p1/2) 455.2 (461.1) 456.2 (461.6) 457.3 (462.7) Ti-C Ti-O Ti-F C 1s 281.9 284.9 286.2 288.9 Ti-C-Ti C-C C-O C=O O 1s 529.8 531.6 532.5 533.4 533.8 C-Ti-O (Bridge) C-Ti-O (A/B site)
C-O C=O Adsorbed H2O or C-Ti-OH F 1s 685.2 687.1 C-Ti-F F-contamination Fit-IV:
In a recent paper, Benchakar et al.[30] used as similar approach to that of Halim et al. in the Ti 2p
region, except the component at ~ 460.0 eV, which was ascribed to -F terminations by Halim et
al., [14] was ascribed to a titanium fluoride (TiFx) salt formed due to over-etching (Fig. 4, Table
4).[30]
The O 1s fits, on the other hand, used aspects of the fits I and III. The -O terminations at A and
the bridging sites were similar to those of Fit-III (Table 1,3,4), respectively assigned to
C-Ti-O(ii) and C-Ti-O(i) in Table 4 and Figure 4. An -OH component similar to Fit-I was also
assumed. Peaks for organic contamination and titanium oxyfluoride (TiO2-xF2x) were also added.
Note that the contribution of titanium oxide and oxyfluoride in the O1s region at 530.6 and 529.9 eV, respectively are not at the same as those of Halim et al. Similar to previous studies, only one
13
component in the F 1s and C 1s regions was fit (Fig. 4, Table 4). Henceforth this model will be
referred to as Fit-IV.
Figure 4: Peak fits of XPS spectra (according to Benchakar et al.) of Ti3C2Tz synthesized using different conditions indicated on right-hand side.[30] In Table 4, we only list the results of the topmost panels, viz. MXene etched using 10 % HF.
14 Table 4: Summary of XPS peak fits for MXene synthesized using 10% HF shown in top of Figure 4. Binding energies BE and FWHM values of the Ti 2p3/2 peaks are listed in columns 2 and 3, respectively. Respective numbers for Ti 2p1/2 peaks are shown in brackets.
[30]
Region BE (eV) FWHM (eV) Fraction Assigned to
Ti 2p3/2 (2p1/2) 455.0(461.0) 455.8 (461.7) 457.0 (462.8) 458.9 (464.6) 460.0 (466.4) 0.8 (1.1) 1.3 (1.6) 1.9 (2.3) 1.6 (2.9) 1.2 (1.8) 9.95 10.16 12.54 3.76 1.87 C-Ti+1-(O/OH/F) C-Ti2+-(O/OH/F) C-Ti3+-(O/OH/F) TiO2-xF2x/TiO2 TiFx C 1s 281.9 284.4 286.4 0.6 1.8 1.9 22.65 5.22 0.74 C-Ti-(O/OH/F) C-C C-O O 1s 529.7 530.6 531.2 532.0 533.0 533.7 0.8 1.2 1.4 1.4 1.5 2.2 8.86 3.15 2.55 2.04 1.85 0.69 C-Ti-O(i) TiO2-xF2x C-Ti-O(ii) C-Ti-OH OR H2O F 1s 685.0 686.6 1.3 1.6 12.30 1.65 C-Ti-F F-contamination Critical Analysis
Based on these 4 important studies, it is clear that there is no clear consensus in the MXene
community about the interpretation of Ti3C2Tz XPS spectra. In Fits-I, II, and IV the first peak in
the Ti 2p3/2 spectra is at ~ 455.0 eV is assigned to C-Ti-Tz, while in Fit-III it is assigned to
Ti-C-Ti. The discrepancies in BEs of the C-Ti-F components are even larger than those of C-Ti-O. In
Fits I and II there is a 3.3 eV difference in the BEs of the respective C-Ti-F peaks. In Fits-I and
III that difference is 2.9 eV. Fit-IV does not account for a separate C-Ti-F peak since it is
claimed that these peaks overlap with those of the C-Ti-O/OH peaks and thus cannot be
distinguished. Apart from these two peaks, other peaks in Fits-I, II and III are assigned to
15
are serious problem. What renders the problem even more confusing is that most other studies
that use XPS for characterization of Ti3C2Tz, use either of these 4 models or, even in some cases,
a mix of them. The purpose of this paper is to critically assess these four fits and recommend a
less confusing way forward.
Generally, due to some samples charging during XPS measurements, the spectra obtained tend to
shift to higher BE values. To counter this issue, the spectra need to be calibrated. Here there are a
number of approaches. One sets the BE of C-C bonds from adventitious carbon to ~284.8 eV.
One problem with this method is that it relies on C impurities whose BE values is not well
agreed upon and several reports have used values anywhere between 284.5-285.0 eV making
reliable calibration difficult.[35] This 0.5 eV difference does not allow for accurate calibration.[35]
The second method is to add powders of noble metals like Au or Ag to the samples, with
well-known BEs.[36] This method has never been used in the MXene literature and is not discussed
further.
The third, and highly recommended herein, is aligning the Fermi edge of the spectra to 0 eV.
This is an efficient and accurate method of calibration.[35] Therefore the C-C B.E should be used
for calibration only be when Fermi edge is not sharp or the C-Ti-C peak in the C 1s spectra of
Ti3C2Tz is not at 282.0 eV (Details of C 1s spectra fitting are discussed later). In the 4 fits
discussed above, Halim et al.[14] (Fit-I) and Persson et al.[29] (Fit-II) uses the Fermi edge for
calibration, while Benchakar et al.[30] (Fit-IV) set the Ti-C-Ti peak BE in the C 1s spectra to
281.9 eV. Schultz et al.[20] (Fit-III) do not mention their method of calibration.
In the following, we discuss each element separately.
16
As shown in Table 5, the C 1s BE values are quite reproducible between studies. That peak lies
at 282.0±0.06 eV. This also implies that the BE of the C atoms in the octahedral sites, viz.
Ti-C-Ti, are not affected by the type of surface terminations attached during etching in F-ion
containing acids. It also seems to be independent of the M:X ratio, viz. n in Tin+1XnTx, or the
presence of nitrogen, N, in neighboring X sites.
Over the 7 studies listed in Table 5, the standard deviation in the BE values is only 0.06 eV. It
follows that this BE is an important anchor point that if not found suggests problems with the
XPS spectra, most likely with calibration and/or the absence of MXenes. Therefore, in cases
where the Fermi edge is not sharp enough to use for calibration, we recommend setting the BE in
the C 1s spectra to 282.0 eV. It should be noted that this calibration works well with MXenes
synthesized in F-containing acids. In recently discovered molten salt synthesized MXenes, initial
XPS studies suggest the Ti-C-Ti peaks deviate from 282.0 eV (see below).
The BE of a purely covalent C=C bond is ≈ 284.5 eV[37]. The Ti-C-Ti BE of 282.0 eV in
Tin+1CnTz, implies the C atoms are withdrawing electrons from the Ti atoms, which is fairly well
established for MXenes at this point.[22] The relationship between the M-C-M component BE and
Pauling’s electronegativity, EN, of the M in the MXene is plotted in Figure 5 and listed in Table
6. These results indicate that the bond polarity decreases as the EN difference between M and C
atoms goes down and that the 282.0 eV value is thus only valid for Ti3C2Tz and even then, as
discussed below, only under certain circumstances.
Table 5: C 1s BE values of C-Ti-Tz peaks from literature. Note values were taken only from studies where the Fermi edge was used for calibration of the XPS spectra.
MXene Etching method BE (eV) FWHM (eV) Reference
Ti3C2Tz 50 % HF LiF + HCl 282.0 282.0 0.6 0.6 [14] [17]
17 NH4HF2
10 % HF etched NaOH treated Vacuum annealed up to 700 °C 281.9 282.0 282.0 0.6 0.6 0.6 [38] [39] [29] Ti2CTz 10 % HF 281.9 0.6 [14] Ti3CN 30 % HF 282.1 0.7 [14] Average 282±0.06
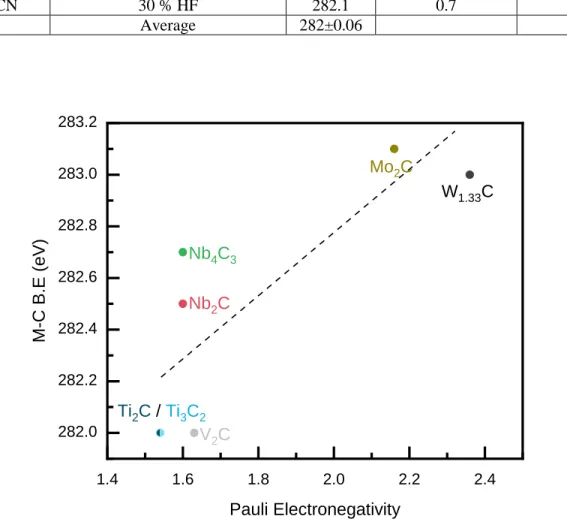
Figure 5: BE of C-M-Tz component in C 1s spectra plotted vs EN of transition metal. Values were taken only from studies where the Fermi edge was used for calibration of XPS spectra.[14,40–42] Dotted line is a guide to the eyes.
Table 6: BE values of C-M-Tz components of various MXenes as plotted in Figure 5.
MXene composition BE of C-M-Tz (eV) Reference
Ti2CTz 281.9 11 V2CTz 282.0 37 Nb2CTz 282.5 11 Nb4C3Tz 282.7 11 1.4 1.6 1.8 2.0 2.2 2.4 282.0 282.2 282.4 282.6 282.8 283.0 283.2 V2C M-C B.E (eV) Pauli Electronegativity Ti2C / Ti3C2 Nb2C Nb4C3 Mo2C W1.33C
18
Mo2CTz 283.1 35
W1.33CTz 283.0 36
Titanium (Ti 2p):
Before discussing the details of fitting the Ti 2p spectra, several important considerations need to
be established. More specifically,
1) The Ti 2p spectra are always split into 2 main peaks corresponding to Ti 2p3/2 and Ti 2p1/2.
Any component fit to a Ti 2p3/2 peak should also be used to fit the Ti 2p1/2 peak. In theory, the
area ratio between the two should be exactly 2:1, but in practice, due to imperfect background
subtraction, possible overlapping of satellite peaks and the Coster-Kronig effect the area ratios
may slightly deviate from expected.[43]
2) The separation ΔTi2p between the Ti 2p1/2 and Ti 2p3/2 peaks should be consistent for all
components assigned to the same material. Here ΔTi2p for Ti3C2Tz related peaks is set to 6. 1eV
and for oxides and oxyfluorides it is set to 5.7 eV.
3) Because MXenes are highly conductive, the component peaks should have asymmetric line
shapes instead of the commonly used symmetric Gaussian line shapes. As shown in Figures 6a,b,
the same Mo 3d spectra of a Mo2CTz MXene are fit using both asymmetric (Fig. 6a) and
symmetric peaks (Fig. 6b). In the latter, an extra, unphysical, Mo component is needed to
achieve a good fit. This component is not needed when the correct asymmetric peaks are used.
Here Mo2CTz was chosen as an example to make this point because only one component is fitted
19
4) Instead of the more commonly used Shirley background, for Ti3C2Tz we suggest to use a
Tougaard background instead as it has been shown to give better quantitative results especially
for transition metal-based compounds.[28,44] For consistency, a Tougaard background was used
for the C 1s, O 1s, and F 1s spectra as well. Some MXene studies have assumed a linear
background. This should be avoided as the linear background does not have a physical
underpinning like the Shirley or Tougaard backgrounds.[28,44] That being said, more detailed
analysis is necessary to understand which background works the best for MXenes as even under
Tougaard or Shirley background several different variations like iterated Shirley, 2 or 3 parameter Tougaard, etc. are possible.”
5) Due to several components being fit in a broad envelop currently it is not possible to resolve
the FWHM of each component independently. Therefore, we propose to set the FWHM of
MXene related components fits under the Ti 2p3/2 to be equal. The same for the Ti 2p1/2; we
constrained them have equal FWHM. Note that does not imply that the FWHM are the same for
both; In general, the Ti 2p1/2 components have broader FWHM compared to their Ti 2p3/2
counterparts due to the Coster-Kronig effect.
Though the above 5 points might seem basic to the XPS community, they are at times ignored in
20
Figure 6: Peak fitting of Mo 3d spectra Mo2CTz MXene using, a) asymmetric peaks and b) symmetric peaks for the C-Mo-Tz component. Raw data were obtained from Ref [5] and refit for this figure.
Ti3C2Tz vs. Ti2CTz
In Fit-III, Schultz et al. differentiate Ti bonded to 6 C atoms and those bonded to only 3. They
assigned the former with a BE of 455.2 eV. Figures 7a, b depict the crystal structures of Ti2CTz
and Ti3C2Tz, respectively. The Ti atoms circled in blue, shown in both figures, have identical
bonding environments; they are bonded to 3 C atoms and 3 T-atoms (Fig. 7c). The Ti atoms in
the middle layer of the Ti3C2 slab, circled in brown, are surrounded by 6 C atoms. Said otherwise
these Ti atoms sit in the centers of C-octahedra (Fig. 7d). So, in principle, there should be 2
distinct components, with the C-Ti-C atoms having a lower BE than the C-Ti-T site since the EN
of C is lower than that of O, F, Cl, etc., and should match closely that of Ti in cubic TiC (454.6
eV[45]). More importantly, the C-Ti-C atoms should be absent from the Ti 2p spectra of Ti2CTz.
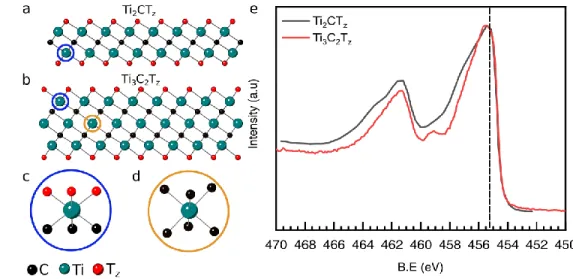
However, when we overlay typical Ti 2p spectra of both MXenes (Fig. 7e) it is evident that at
lower BEs – to the right of the dashed line - the overlap is excellent. It follows that the C-Ti-C
21
assignment of the 455.2 eV peak to the C-Ti-C site in Fit-III and other studies,[46–48] is wrong. As
discussed below this result may be because the charge on the C atoms in Ti3C2Tz is ≈ -2. The
deviations between the two Ti spectra at higher BEs are probably due to the difference in the
associated -F termination. This comment notwithstanding, more detailed studies using
high-resolution synchrotron facilities in tandem with DFT are needed to better understand why the
two Ti sites are apparently indistinguishable.
Figure 7: a) Crystal structures of Ti2CTz and b) Ti3C2Tz MXenes; c) and d) magnified views of Ti atoms circled blue and brown in a and b with different bonding environment; e) Ti 2p spectra of Ti2CTz (grey) and Ti3C2Tz MXene.
Do the Ti MXene peaks correspond to Ti oxidation states or local environments?
If care is not taken during etching and, more importantly, the storage of Ti3C2Tz flakes, they will
oxidize, usually to rutile and/or anatase TiO2.[49,50] If that is the case, it is crucial to be able to
differentiate the Ti atoms terminated by O atoms and those in separate oxide or oxyfluoride
particles. This problem is quite acute if during etching the C atoms are replaced by O atoms as
22
at 3:2, respectively. Under harsh etching conditions that may not be the case. This possibility is
not discussed herein, but a good indication that it may be occurring is a z > 2.[51,52]
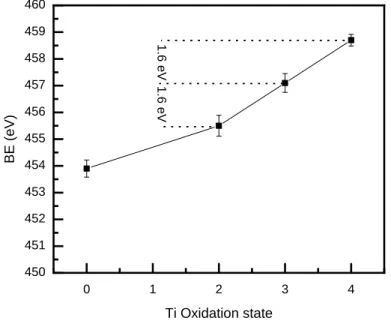
Figure 8 plots the BE of the Ti-O component in the Ti 2p spectra vs. the Ti oxidation states in Ti
metal (Ti0), and various Ti oxides starting, with TiO (Ti+2), Ti2O3 (Ti+3) and TiO2 (Ti+4).[32] From
this plot, it is reasonable to conclude that the BE differences, ∆BE, between Ti oxidation states
are more or less constant and equal to ≈ 1.6 eV.[32] This example was chosen because Ti oxides
can be made with a range of stoichiometries with varying oxidation states of Ti atoms and the Ti
atoms are always bonded to -O atoms. Therefore, if the type of ligands attached to Ti atoms is
kept the same - as in the case here - then ∆BE of Ti 2p3/2 peaks of the compound should be more
or less equal with increasing Ti oxidation states. According to Fits I and IV, the ∆BE between
the C-Ti+1-Tz and C-Ti+2-Tz components is 0.8 eV and ∆BE between the C-Ti+2-Tz and C-Ti+3-Tz
peaks is 1.4 eV for Fit-I, and 2 eV for Fit-IV.[14,30] But based on the results shown in Figure 8,
the 3 components should be more or less equally spaced in BE.
Figure 8: BE of Ti 2p peak of titanium oxide vs oxidation state of Ti in that oxide. Ti with oxidation state 0 is Ti metal.[32] 0 1 2 3 4 450 451 452 453 454 455 456 457 458 459 460 1.6 eV BE (eV) Ti Oxidation state 1.6 eV
23
Furthermore, based on the XANES analysis by Lukatskaya et al.[22] it was found that the average
oxidation state of Ti in Ti3C2Tz is ~ +2.4. Based on the fractions obtained in Fit-I (Table 1) if we
just consider the first 3 components - C-Ti+1-O/OH, C-Ti+2-O/OH, C-Ti+3-O/OH - and
redistribute the ratios amongst them we get new fractions which are roughly 0.31, 0.33, and 0.35,
respectively. The average charge per Ti atom would thus be:
3 = 2.02 (1)
This deviation of 0.4 in the Ti oxidation states between Fit-I and the XANES measurements,
implies that the fraction of the areas under the first two peaks in Fit-I is overestimated. More
importantly, it is highly unlikely that there are Ti oxidation states below +2 in MXene since Ti+1
states are unstable.
Regardless of the exact termination chemistries, the molecular weight of Ti3C2Tz can be assumed
to be ~200 g/mol. In a recent in-depth characterization of Ti3C2Tz and Ti3CNTz MXenes by Sun
et al.[53] they concluded - from electron paramagnetic resonance, EPR - that the Ti+3
concentration to be 7.08x10¹⁸ atoms/g of Ti3C2Tz. This translates to < 1 % Ti+3 atoms in Ti3C2Tz.
If that is the case, it follows that both Fits-I and IV significantly overestimate the Ti+3 peak areas.
Therefore, at this juncture, the assumptions made in Fit-II appear to be the best way to fit the Ti
2p XPS spectra in Ti3C2Tz. In other words, we assign energies to the Ti atoms centered on the
following octahedra: C-Ti-O\O\O, C-Ti-F\O\O, C-Ti-F\F\O, and C-Ti-F\F\F, respectively,
24
indistinguishable.. We note in passing that this suggests that the average oxidation state of the C
and O atoms are similar at ≈ -2.
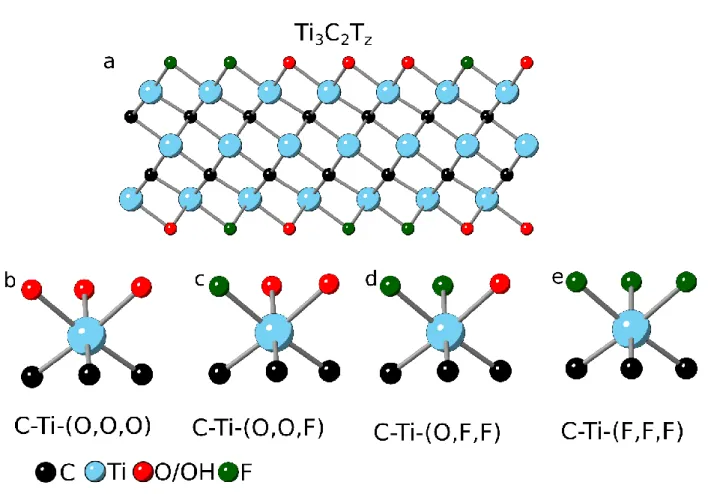
Figure 9: a) Crystal structure of Ti3C2Tz MXene; surface Ti atoms terminated by, b) 3 O atoms c) 1 F and 2 O atoms d) 2 F and 1 O atom and, e) 3 F atoms.
Separations between the C-Ti-O/OH, C-Ti-F peaks and other component peaks:
Figure 10 plots the BEs in the Ti 2p spectra of various TiX compounds – where Ti is in a +3 or
+4 oxidation state - versus a normalized EN of X, where X = S, O, F and Cl. The EN is
normalized by multiplying the EN of X atoms by the X/Ti ratio to take the effect of chemistry
out of the comparison. The trend is clear; increasing EN of X increases the Ti BEs more or less
25
for the gray points and +3 for the red ones. [32,33] Another important observation is that for a
given Ti oxidation state, ∆BE between the Ti-F and Ti-O surroundings is constant and around ~
2.8-2.9 eV. This is important because it strongly suggests that ∆BE between the C-Ti-O\O\O and
C-Ti-F\F\F sites should also be ~2.9 eV. Based on these arguments, if we assign the first Ti 2p
peak at 455.0 eV to C-Ti-O\O\O, as done in Fit-II, then the C-Ti-F\F\F peaks should be around 2.9 eV higher at ≈ 458 eV. The C-Ti-O\O\F and C-Ti-O\F\F, on the other hand, should be ≈ 1 eV
apart at 456 eV and 457 eV, respectively.
To confirm that interpolations from Figure 10 are meaningful, the Ti 2p BE value of TiOF2[54,55]
is calculated from the grey curve and found to be 459.6 eV, which matches quite well with the
experimental BE of 459.5 eV (blue star in Fig. 10), found in the literature. [54,55] A similar
exercise for TiOCl gives a value, based on Figure 10, of 457.8 eV, which again is in good
agreement with the value of 457.9 eV reported in the literature[56] (green star Fig. 10). The
arguments strongly support the placement of C-Ti-F\F\F peak 2.9 eV higher than its O
counterpart.
Finally, it should be noted that -OH terminations are also found on MXene surfaces (see below).
Here we assume they are indistinguishable from their O counterparts in the Ti 2p spectra.[57,58]
26 Figure 10: BE of Ti-X (X= S, O, F, Cl) component in the Ti 2p spectra vs normalized electronegativity of X atom. Gray points join Ti+4 compounds; red one, Ti+3 ones.[32,33] Blue star marks BE of TiOF2 while green marks that of TiOCl.[54–56] Red and black dashed lines represent least squares fits of xxx and yy respectively. OK? If so give the equations somewhere in text.
Fit-V
In addition to the arguments made above, the following constraints were applied in our fit:
1) Similar to Fit-II, the ΔTi2p for all MXene peaks was kept constant at 6.1 eV.
27
3) The peak shape used for the MXene components is asymmetric and similar to that of
Biesinger et al. as described in their XPS fittings of Ti metal.1 [32] Symmetric Gaussian peaks, on
the other hand, were used to fit the oxide contributions.
4) As discussed in the preceding section, a Tougaard background was assumed for fitting all core
level spectra.
5) The FWHM of all C-Ti-Tz peaks fit under Ti 2p3/2 peak were constrained to be equal.
Similarly all C-Ti-Tz peaks fit under the Ti2p1/2 peak were constrained to be equal.
1
In private communication Biesinger confirmed that asymmetric lines can also used for fitting Ti-C component in cubic TiC. The sample fit of cubic TiC according to Ref [32] can be found on his website -
http://www.xpsfitting.com/2008/10/titanium-carbide.html. 470 468 466 464 462 460 458 456 454 452 450 Experimental C-Ti-(O,O,O) C-Ti-(O,O,F) C-Ti-(O,F,F) C-Ti-(F,F,F) TiOxF4-2x Background Fittied Curve Int en sity (a .u) B.E (eV)
28 Figure 11: XPS spectra of Ti 2p region fit according to Fit-V. Raw data used obtained from Ref [30] as was recorded from Ti3C2Tz MXene etched from Ti3AlC2 MAX in 10 % HF.
Table 7: Summary of XPS peak fittings of Ti 2p spectra obtained from Ref [30] of Ti3C2Tz synthesized by etching Ti3AlC2 MAX in 10% HF solution. The components were fit according to Fit-V as shown in Figure 11. Binding energies BE and FWHM values of the Ti 2p3/2 peaks are listed in columns 2 and 3, respectively. Respective numbers for Ti 2p1/2 peaks are shown in brackets.
Region BE (eV) FWHM (eV) Fraction Assigned to
Ti 2p3/2 (2p1/2) 455.1 (461.1) 456.0 (462.1) 457.0 (463.1) 457.9 (464.0) 459.6 (465.2) 1.1 (1.5) 1.1 (1.5) 1.1 (1.5) 1.1 (1.5) 2.0 (3.0) 0.53 0.22 0.11 0.04 0.10 C-Ti-(O\O\O) C-Ti-(O\O\F) C-Ti-(O\F\F) C-Ti-(F\F\F) TiO2-xF2x Oxides in Ti3C2Tz MXene:
It is commonly assumed that when Ti-containing MXenes oxidize, they form TiO2. A careful
perusal of these oxidation studies,[30,49] show that clear oxide peaks emerge at BEs between 459.0
and 459.5 eV. These values are higher than the ~458.6 eV, values reported in pure TiO2
oxides.[32] Based on the arguments made in Figure 10, it is reasonable to assume that the titania
formed is not pure, but is rather doped with some F atoms and therefore those peaks should be
labeled as TiO2-xF2x instead of TiO2. Though it is difficult to find the exact value of x, a rough
estimate can be calculated by interpolating the BE values from the gray curve shown in Figure
10.
Based on all the above points, we refit the Ti 2p data by Benchakar et al. for Ti3C2Tz, etched in
10% HF according to Fit-V and the peak fits are shown in Figure 11. The corresponding BE
values for each component are listed in Table 7.[30]
29
Recently, Li et al. synthesized completely -Cl terminated MXene using a molten salt synthesis
approach.[15] In their XPS fits, they used symmetric instead of asymmetric peaks, which resulted
in an extra set of peaks. As discussed above, the extra peak is probably an artifact of using
symmetric peaks. Further, they calibrated their spectra using the adventitious C peak which
might not lead to accurate results. We refit their raw data, using the assumptions made for Fit-V
as shown in Figure 12a, b, and Table 8. Recently, Lu et al. found that MXene surfaces
synthesized in molten ZnCl2 salts are completely saturated by Cl terminations.[59] Based on these
observations there should be only 1 set of peaks corresponding to C-Ti-Cl/Cl/Cl. Unfortunately,
as the Fermi edge was not scanned, we had to calibrate the spectra by setting the Ti-C-Ti peak to
282.0 eV. Doing so resulted in a C-Ti-Cl\Cl\Cl BE of 454.8 eV, which is unlikely since that is
equal to the BE in the parent MAX.[60] Intriguingly, and for reasons that are unclear at this time,
when we etched Ti3AlC2 in a non-aqueous solution, where the terminations were quite F-rich the
Ti-C-Ti peak was found at 282.0 eV.[6]
Similarly, we re-fit the XPS results of Kamysbayev et al.[16] (Fig. 12 c-h), based on the
assumption that the MXene surface is saturated with only 1 type of termination. It should be
noted here that Li et al.[15] used C-C bond energy of 284.6 eV for calibration, while Kamysbayev
et al. used a BE of 284.8 eV for calibration. This is a good example, of why using C-C bond BE
for calibration is not recommended.
Referring back to Figures 12c-h. Here again, because the Fermi edge was not scanned, we set the
Ti-C-Ti peak to 282.0 eV for calibration purposes. In the case of Ti3C2Br2 (Fig. 12c, d) the BE of
the Br\Br\Br bond was found to be 454.8 eV which is coincidentally equal to that
30
the BE to higher, rather than lower values. What both sets of results suggest is that the Ti-C-Ti
peak in MXenes synthesized in molten salts can no longer be assumed to be at 282.0 eV.
In the case of Ti3C2Tez (Fig. 12e,f) the C-Ti-Te/Te/Te BE was found to be 455.0 eV which is
comparable to the C-Ti-O\O\O peak of Ti3C2Tz synthesized in F-containing acids. Even though
Te is less electronegative than O, the BE of the first peak does not shift below 455.0 eV. Here
again this conclusion probably stems from the Ti-C-Ti peak not being at 282.0 eV. The C-Ti-()
peak – where () represents an unterminated Ti bond - (Fig. 12g,h) in the unterminated MXene
samples was at 454.9 eV (Table 8) which is slightly lower than the first peak of C-Ti-O\O\O at
455.0 eV found in regular MXene. This shift of BE to lower energy is expected as
electron-withdrawing surface terminations are removed from the surface. In the case of Ti3C2(), a second
MXene peak at 456.7 eV (Table 8) was added to achieve a good fit. What this peak physically
corresponds to is currently unclear.
These comments notwithstanding, more work needs to be carried out to examine and better
understand these chemical shifts. Having a well calibrated energy scale is crucial and highly
31
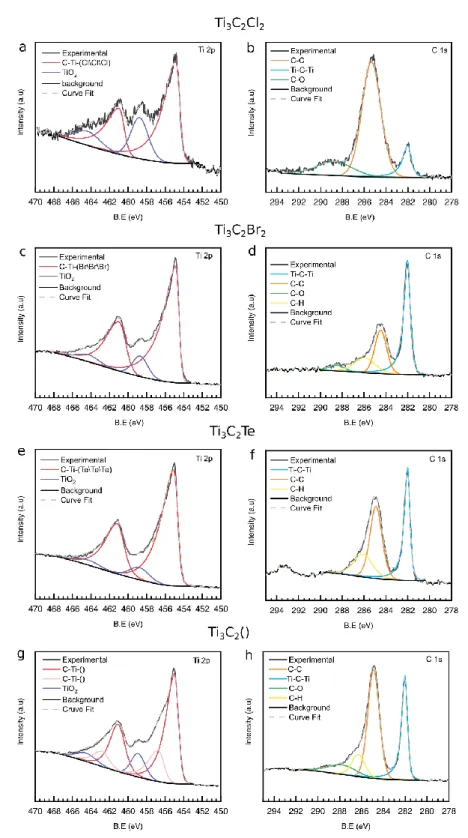
Figure 12: XPS spectra of Ti 2p and C 1s region fit according to Fit-V. Raw data obtained from Ref. [16,61]
as was recorded from Ti3C2Tz powders etched in molten salt baths starting with Ti3AlC2 at 550°C in case of Ti3C2Cl2 and 650 °C in for the remaining compositions. a,b) Ti 2p and C 1s spectra of Ti3C2Cl2; c,d) Ti 2p and C 1s spectra of Ti3C2Br2; e,f) Ti 2p and C 1s spectra of Ti3C2Te ; g,h) Ti 2p and C 1s spectra of Ti3C2(),where () refers to non-terminated surfaces.
32 Table 8: Summary of XPS peak fittings of Ti 2p spectra obtained from Ref [16,61] of as-synthesized Ti3C2Tz obtained by etching Ti3AlC2 in molten salt baths. The components were fit according to Fit-V as shown in Figure 12. Binding energies BE and FWHM values of the Ti 2p3/2 peaks are listed in columns 2 and 3, respectively. Respective numbers for Ti 2p1/2 peaks are shown in brackets.
Sample Region BE (eV) FWHM (eV) Fraction Assigned to
Ti3C2Cl2 Ti 2p3/2 (2p1/2) 454.8 (460.9) 458.7 (464.3) 1.1 (1.3) 2.2 (3.2) 0.73 0.27 C-Ti-Cl\Cl\Cl TiO2 C 1s 282.0 285.3 288.9 0.8 2.0 2.5 0.12 0.77 0.11 Ti-C-Ti C-C C-O Ti3C2Br2 Ti 2p3/2 (2p1/2) 454.8 (460.9) 458.7 (464.3) 0.9 (1.7) 1.9 (2.7) 0.88 0.12 C-Ti-Br\Br\Br TiO2 C 1s 282.0 284.5 285.9 288.5 0.6 1.3 2.3 1.7 0.52 0.27 0.16 0.05 Ti-C-Ti C-C C-H C-O Ti3C2Te Ti 2p3/2 (2p1/2) 455.0 (461.1) 458.8 (464.4) 1.0 (1.7) 2.5 (3.0) 0.90 0.10 C-Ti-Te TiO2 C 1s 282.0 285.0 286.0 0.5 1.3 2.0 0.40 0.40 0.20 Ti-C-Ti C-C C-H Ti3C2() Ti 2p3/2 (2p1/2) 454.9 (461.0) 456.7 (462.8) 458.9 (464.5) 1.0 (1.7) 1.4 (1.8) 1.7 (2.5) 0.65 0.23 0.12 C-Ti-() C-Ti-() TiO2 C 1s 282.0 284.9 286.3 287.8 0.5 1.2 1.4 3.0 0.30 0.47 0.12 0.11 Ti-C-Ti C-C C-H C-O O 1s Spectra:
The O 1s spectra of Fits I-IV are all different. Fit-I has 5 component peaks: the lowest energy
peak at 529.9 eV is ascribed to TiO2; the next two peaks at 531.2 eV and 532.0 eV are assigned
to C-Ti-O and C-Ti-OH, respectively. The peaks at 523.8 and 533.8 eV are allocated to alumina
and adsorbed water respectively.
Persson et al. (Fit-II) claim that -OH terminations are not present on the MXene surfaces and the
33
(see Fig. 2, Fig. 3e). They argued that if the peak at 532.0 eV was due to OH, then the observed
intensity loss of this peak - with increasing temperature - should reduce the total area under the O
1s curve during annealing, which is not observed. From there they conclude that the changes in
peak intensities observed are due to a rearrangement of surface O atoms from bridging sites to A
sites (Fig. 2).
However, Seredych et al. in their thermogravimetric analysis, coupled with gas mass
spectroscopy (TGA-MS) studies of various MXene under flowing helium (He) gas showed that
upon heating the F-atoms desorb from the MXene surface in the form of HF and not F2
molecules.[62] If that is the case, then the -OH terminations can converted to -O, by the loss of H
to HF formation. In such a scheme, the total O content would remain unchanged as observed.
Though this is just a hypothesis to possibly explain the lack of O 1s area change by Persson et
al., more work needs to be done to better understand this phenomenon.
Moreover, recent NMR and neutron scattering studies have proven the presence of -OH
terminations.[23,53,63] Another important point to note is that vacuum annealing experiments by
Persson et al. were carried out in ultra-high vacuum that, in principle, allow for O
arrangements. But to understand the true nature of the O/OH terminations the samples need to
re-exposed to air and water to saturate the lattice sites left unterminated after -F desorption and the
sample should be rescanned.
Fit-III is similar to Fit-II, but instead of 2 possible crystallographic sites proposed in Fit-II (Fig.
2d), 3 different possible sites are proposed (Fig. 3a,h). Fit-IV uses a mix of Fits-I and II and
ascribed the peaks at 529.7 and 531.2 eV to bridging and A-site O, while the peak at 532.0 eV
34 Figure 13: O 1s spectra of fresh Ti3C2Tz MXene right after synthesis (blue) and after aging the same sample for 1 (red) and 6 months (grey).[30]
Fit-I assigns the peak at 529.9 eV to TiO2/TiO2-xF2x, while in Fit-IV that peak is fit at 530.6 eV.
They cannot both be correct. To determine which of these is correct, the data by Benchakar et
al.[30] was replotted and the O 1s spectra of freshly synthesized MXene obtained after etching
Ti3AlC2 in 48 % HF and its subsequent aging in the ambient atmosphere for 1 and 6 months were
overlaid in Figure 13. From these results it is obvious that after 6 months a clear peak appears ~
530.8 eV, implying that the oxide peak assignment in Fit-IV is correct. Moreover, in their study,
Benchakar et al.[30] confirmed that peak intensity increases with the fraction of TiO2-xFx in the Ti
2p region as shown by the preparation of partially oxidized Ti3C2Tz using a FeF3/HCl etching
agent (Fig. 4). This attribution was adopted in our Fit-V.
540 538 536 534 532 530 528 526 HF 48 MX 6 months in air HF48 MX 1 month in air HF 48 MX Fresh Norm alized In ten sity( I /Ima x ) ( a.u ) B.E (eV)
35
Based on these observations it is clear that fitting O 1s spectra in Ti3C2Tz is not trivial due to
multiple overlapping contributions from surface terminations, oxides, and hydroxides. Moreover,
the impurities from adventitious carbon and other organics contribute to the O 1s spectra as well
and their contribution cannot be determined at this point. Therefore, more work is required to
better understand the O 1s spectra.
F 1s spectra:
Fits I, III, IV all assign only one peak to F-terminations with a BE ~ 685.0 eV. Fit-II fits 2 peaks
corresponding to C-Ti-F and C-Ti-(O, F) at 684.5 and 685.4 eV respectively. Depending on the
etching and processing conditions impurities like AlF3, TiO2-xF2x, etc. are also fit under F 1s
spectra. However, since F is the most EN element, the chemical shifts in its XPS spectra are
small rendering the quantification of impurities difficult. Furthermore, the choice of asymmetry
of the C-Ti-F peaks will also influence the quantification of any impurity peaks.
Quantification:
As discussed above, it is not trivial to quantify the surface terminations of Ti3C2Tz flakes using
XPS. What renders the problem even more intractable is that the results obtained from different
characterization techniques, on nominally comparable samples, are not close. This is best seen by
a perusal of the chemistries listed in Table 9, on samples obtained by etching Ti3AlC2 powders in
48 % HF at RT. The results of XPS analyses[14,30] are compared with those obtained by NMR[23]
and neutron pair distribution function, PDF, analysis.[64] The final chemistries (column 2 in Table
9) are quite different. From Table 9 it is also clear that not only are there discrepancies in the
36
to column 3 in Table 9, the O:OH ratios vary anywhere from 0.07 to 8, and the O:F varies from
0.3 to 11. Ideally, all techniques should yield comparable chemistries. The fact that they do not
imply that much more work is needed in this domain. These large deviations imply that either
some of these techniques cannot be used to quantify the termination chemistries or more in-depth
studies are required to shed light on these discrepancies.
Table 9: Chemistries of Ti3C2Tz samples all obtained by etching Ti3AlC2 in 48% HF. Charge
total is calculated by assuming charge on O = - 2 and on OH and F = -1. Chemistries reported by XPS herein are ones reported in the original work.
Method Formula O:OH:F Tz Ref
Total z Charge total XPS* Ti3C2O0.3(OH)0.02(OH/H2Oads)0.3F1.2 1:0.07:4 1.52 (1.82) 1.82 (2.12)
[14] XPS^ Ti3C2.03O(i)0.43O(ii)0.06(OH)0.3F1.34 1:0.6:2.7 2.13 2.62
[30]
NMRǂ Ti3C2O0.84(OH)0.06F0.25 1:0.07:0.3 1.15 2.0
[23]
PDFǁ Ti3C2O0.1(OH)0.8F1.1 1:8:11 2.0 2.1
[65] *In Ref [14] Halim et al. calculated values in parenthesis assuming all the H2O as OH, the values outside the parenthesis are assuming otherwise.
^ In Ref [30] Benchakar et al. fit 2 sites for O terminations denoted (i) and (ii) for calculation of Tz both have been added.
ǂ In Ref [23] Hope et al. assumed a charge total of Tz equal to + 2 and back-calculated the stoichiometry. ǁ In Ref [64] Wang et al. assumed z = 2 and back-calculated the stoichiometry.
In Figure 14, we refit the results of Benchakar et al.[30] for Ti3AlC2 etched in 10 % HF using
Fit-V. The results are summarized in Table 10. The C 1s spectra were fit with 1 asymmetric peak at
282.0 eV corresponding to C atoms centered in Ti-octahedra. The other C 1s peaks were ascribed
to adventitious carbon.
In the O 1s spectra, the first peak at 529.8 eV was ascribed to C-Ti-O\O\O. The peak at ~532.0
eV is ascribed to the C-Ti-OH bond in Fits-I and IV and to a C-Ti-O/Fbond by Fit-II, where O/F
corresponds to the O co-adsorbed with F atoms. Moreover, by coupling XPS and Raman
37
for the variation of the OH/O ratio, Benchakar et al. [27] show that this peak can, with a large
degree of certainty, be attributed to C-Ti-OH. Nevertheless, a contribution of the C-Ti-O/Fbond
in this peak cannot be excluded. Therefore, in Fit-V we assume that the 532.0 eV peak is
probably a convolution of C-Ti-OH and C-Ti-(O,F) moieties. The 530.8 eV peak was ascribed to
O in TiO2-xF2x (Fig. 13,14).[54]
The F 1s spectra were fit with only one asymmetric peak at 684.9 eV. Given that the BE of the F
1s peak in TiO2-xF2x is also ~ 685.0 eV[54,55] it is currently not possible to deconvolute the peak.
For the quantification, shown in Table 10, a few assumptions were made:
1) The BE of the TiO2-xF2x peak in the Ti 2p spectra was constrained between 459.0-460.0 eV.
We further assume x = ½. This implies the oxide chemistry is TiO1.5F. It should be noted that the
BE of TiOF2 shown in Figure 10 was obtained from prior work where the presence of TiOF2 was
also confirmed by XRD. In the case of oxide formation due to oxidation of Ti3C2Tz, XPS
indicates a BE closer to TiOF2. XRD measurements, however, indicate the presence of rutile or
anatase TiO2.[49] Prior work by Czoska et al. on F-doped TiO2 found that some F atoms can play
two roles: Some replace O atoms in the titania lattice and others replace surface hydroxyl
groups.[66] We believe a similar phenomenon also occurs on the surface of TiO2 formed on
MXene surfaces, because XPS indicates a higher F-content compared to a bulk analysis by XRD.
Therefore, we assume an approximate stoichiometry of TiO1.5F. Further, depending on the
etching condition usedMashtalir[67] and Benchakar et al.[8] from their XRD and Raman
spectroscopy analysis, respectively, also observed the formation of TiOF2 and/or TiO2-xF2x in
MXene samples. It should be noted since TiO2 is a semiconductor its corresponding peaks might
38
TiO2 on metallic substrates, [68][69], found that the BE of the Ti 2p3/2 peak ascribed to TiO2 was
below 459.0 eV. It is thus reasonable to assume here, given the conductive nature of Ti3C2Tz ,
that the TiO2 peaks should not move to higher BE and that the shifts are solely due to F on the
surface and/or the bulk of the oxide. But to confirm these conjectures more detailed preferably
in-situ oxidation studies of Ti3C2Tz should be carried out.
3) The BE of the titanium oxide peak in the O 1s spectra was assumed to be 530.8 eV (according
to the O 1s discussion based on Figure 13). The area was constrained such that the Ti:O ratio in
the oxide stoichiometry is 1:1.5 based on a TiO1.5F formula.
4) Since we assume that the TiO2-xF2x peak overlaps with the C-Ti-F peak in the F1s region, the
area of the oxide peak was subtracted from the total peak area. The oxide peak area subtracted
was constrained such that the Ti:F ratio in oxide stoichiometry was 1:1, again based on the
assumed TiO1.5F formula.
5) Minimal impurities were assumed. Other than adventitious carbon and titanium oxyfluoride
no other impurities were taken into consideration during fitting.
Based on these fits, the chemical formulae obtained (Table 11) agree well with 2 general
well-established structural constraints. The first is that the Ti:C ratio of MXene is roughly 3:2.
The second is that z in Tz ~ 2. The latter is an excellent assumption since this is the value one
obtains if one were to fill the close-packed sites on the Ti surfaces. Said otherwise it is the value
one would obtain if every termination atom is bonded to the 3 Ti atoms. DFT calculations have
shown that the energy of the system increases rapidly for z > 2.[70] Values of z > 2.5 suggest that
39
Values of z < 2 would imply the presence of bare Ti bonds which is impossible given its
reactivity. Even if ultrahigh vacuum, Ti surfaces are rapidly covered in a layer of oxygen, let
alone ambient atmospheres. If any XPS analysis results in z <<2, that should be taken as a large
red flag that the analysis is seriously flawed. These constraints are important and deviations from
these values suggest either problems with the fits and/or very unusual processing/storing
40 Figure 14: Fit-V of XPS spectra of Ti3C2Tz obtained after etching Ti3AlC2 in 10% HF, a) Ti 2p, b) C 1s,
c) O 1s and, d) F 1sregions. Raw data obtained from Ref [30].
Table 10: Summary of XPS peak fittings based on Fit-V for MXene synthesized using 10% HF as shown in Figure 14. Binding energies BE and FWHM values of the Ti 2p3/2 peaks are listed in columns 2 and 3, respectively. Respective numbers for Ti 2p1/2 peaks are shown in brackets.
Region BE (eV) FWHM (eV) Fraction Assigned to
Ti 2p3/2 (2p1/2) 455.1 (461.1) 456.0 (462.1) 457.0 (463.1) 457.9 (464.0) 459.6 (465.2) 1.1 (1.5) 1.1 (1.5) 1.1 (1.5) 1.1 (1.5) 2.0 (3.0) 0.53 0.22 0.11 0.04 0.10 C-Ti-(O\O\O) C-Ti-(O\O\F) C-Ti-(O\F\F) C-Ti-(F\F\F) TiO2-xF2x C 1s 282.0 284.4 286.5 0.6 1.9 1.5 0.74 0.20 0.06 Ti-C-Ti C-C C-O O 1s 529.8 532.0 530.8 533.4 0.9 1.0 2.0 1.5 0.51 0.18 0.23 0.08 C-Ti-O C-Ti-OH/C-Ti-O/F TiO2-xF2x Adsorbed H2O F 1s 684.9 1.1 1 C-Ti-F/TiO2-xF2x
Table 11: MXene chemistries calculated after applying Fit-V to Ti3C2Tz spectra obtained from
Ti3AlC2 powders etched in various media and conditions indicated in column 1. All raw data
obtained from Ref [30]. Bold entries are those obtained using Fit-IV on results published in Ref. 30. Total charge on terminations is calculated assuming O = -2 and OH and F= -1. OF stands for
O co-absorbed with F. As we cannot differentiate between OH and OF in Fit-V in column 5 we
assume all the 532.0 eV peaks in O 1s to be only OF while in column 6 we assume it be all OH
while calculating the charge total of Tz . Fit-IV this differentiation is not made so charge total is
given in column 4. Etchant Chemistry z (moles) Charge total of Tz Fit-IV Ref [27] Assuming all OF Assuming all OH HF- 48 % Ti3C1.94O0.39(OF/OH)0.25F1.5 2.14 - - 2.8 - 2.53 Ti3C2.03O0.49(OH)0.30F1.34 2.13 -2.62 - - HF - 10 % Ti3C2.1O0.81(OF/OH)0.20F0.89 1.9 - 2.91 - 2.71 Ti3C2.08O1.04(OH)0.19F0.61 1.84 -2.88 - - LiF+HCl (60°C) Ti3C2.1 O0.98(OF/OH)0.15F0.8 1.93 -- - 3.07 - 2.91 Ti3C1.86O1.0(OH)0.16F0.70 1.86 -2.86 - - LiF+HCl (RT) Ti3C2.0 O0.85(OF/OH)0.30F0.94 2.09 - - 3.24 - 2.94 Ti3C1.94O0.94(OH)0.17F0.75 1.86 -2.80 - -
41
Therefore, Fit-V can also be used for the overall quantification of surface terminations. Ti3C2Tz
etched in 48 % HF has nearly double the F-content compared to MXene synthesized using
milder etching methods (Table 11). Also, the charge calculated based on Tz was slightly lower in
MXene synthesized using 48% HF compared to MXene synthesized using milder etching
methods. For the latter, the average charge of Tz is between - 2.9 and - 3.3. At - 2.5 to - 2.8, it is
slightly lower in samples etched in 48 % HF. Based on these results if we assume an average Tz
charge of 3.3 considering all the contribution under the 532.0 eV in O 1s to be from the
C-Ti-(O,F)and assuming the Ti oxidation state to be +2.4 we can calculate the oxidation state to C to
be ≈ – 1.95. Doing similar calculation but instead ascribing the peak at 532.0 eV completely to
C-Ti-OH and assuming an average Tz charge of 2.9, the oxidation state of C is -2.15. In other
words, in both cases, the average oxidation of C is ≈ - 2. If that is the case, it is not surprising
that it is difficult to differentiate in the Ti 2p spectra between, the central Ti atoms and those near
surfaces terminated by O\O\O.
The average depth of analysis using XPS is generally around 5-10 nm.[28,71] Unlike bulk
materials that can be assumed to be homogenous for nanomaterials like MXene which are only 1
nm thick, the XPS quantification is averaging over several MXene flakes. For example,
assuming a 200 µm spot size of the X-ray beam and a probing depth of 10 nm gives us average
quantification over 106 MXene flakes. Therefore, we are not collecting signals from just the
surface terminations but also from the core of each flake, the interlayer intercalated species like
cations and water molecules, and from impurities like oxides, etching residues, etc. Also, the
subsurface photoelectrons will have higher scattering lengths compared to the ones on the
surface, due to which subsurface MXenes flakes will tend to show slightly different chemistry
42
these problems, it is difficult to obtain exact chemistries of bulk MXene samples, but rough
estimations can be obtained via our proposed fittings.
Conclusions
In this work, we compare and contrast four methods in the literature used to fit the XPS spectra
of Ti3C2Tz. Confusingly, these models make quite different assumptions and each results in
different termination chemistry. According to our analysis, none of the existing methods is
perfect.
We also make the case that the most physically tenable approach is to fit the Ti 2p3/2 spectra
based on the apexes of the octahedra that surround the Ti atoms. Consequently, we assign the
peak at 455.0 eV to C-Ti-C and/or C-Ti-O\O\O octahedra. It is difficult to distinguish between
the two. The peaks at 456.0, 457.0, 457.9 eV, are assigned to the O\O\F, O\F\F,
C-Ti-F\F\F, octahedra, respectively. The peak at 459.2 eV is assigned to TiO2-xF2x. The BE of the C
atoms sitting in the Ti-octahedra in the MX layers is almost always at 282.0 eV. This value
appears to be independent of almost all variables except, possibly, when the Ti3AlC2 is etched in
molten salts.
The Ti3C2Tz affiliated F 1s spectra, like C 1s, were fit with only 1 peak corresponding to
F-terminations. Quantifying non-MXene F contributions is much more difficult compared to C 1s
and should be avoided if at all possible.
Fitting of the O 1s spectra was the most ambiguous and a lot more work needs to be carried out
43
and that at 532.0 eV to C-Ti-OH and/or C-Ti-O/F. Apart from these two, MXene peaks at 530.8
and 533.4 eV were ascribed to TiO2-xF2x and adsorbed H2O, respectively.
Asymmetric line shapes, similar to those used for fitting spectra of Ti metal, are used in our
proposed model. But given that the behavior of scattered electrons is different in MXenes
compared to pure Ti metal these peak shapes need to be further optimized specifically for
MXenes. This is non-trivial as we need to consider interflake and intraflake transport of electrons
between MXene sheets and also the role of interlayer species, impurities, etc. Improved synthesis
of MXenes flakes coupled with a better understanding of electronic transport in MXenes can
help us model better peak shapes specifically for Ti3C2Tz MXenes.
Hopefully, future studies can lead to a better understanding leading to more accurate
quantification. The help of modelization by DFT calculations is probably required. Finally, this
review was focused mainly on the Ti3C2Tz which is by far the most studied MXene and even
here the XPS fits are not completely understood therefore utmost care should be taken while
fitting other MXene compositions as findings from Ti3C2Tz may or may not directly translate to
those fittings.
Fitting Methods:
CasaXPS Version 2.3.19PR1.0 software was used for peak fitting. The XPS spectra were calibrated by setting the valence edge to zero, which was calculated by fitting the valence edge with a step-down function and setting the intersection to 0 eV. Because MXenes are electrically conductive, all MXene related peaks were fit using an asymmetric Lorentzian line shape. The oxide peaks, on the other hand,
44 were fit using a symmetric Gaussian/Lorentzian line shape. The background was determined using the Tougaard algorithm, which is a built-in function in the CasaXPS software.
To calculate the elemental ratios the global elemental ratios were first calculated by considering the total areas under the curves and the relative sensitivity factors for each element. This was done with the help of internal tools provided by CasaXPS software. Further, global elemental ratios obtained were multiplied by the percentage of photoemission spectra contribution by the MXene or oxide component. This was calculated for each element individually to obtain the chemical formula shown in Table 11.
Acknowledgment
:This work was funded by the Division of Materials Research of NSF (DMR 1740795). IC2MP
acknowledges financial support from the “Agence National de la Recherche” (reference
ANR-18-CE08-014 – MXENECAT project), the European Union (ERDF), the "Région Nouvelle
Aquitaine" and the French research ministry (Ph.D. thesis of M. Benchakar).
We would like to acknowledge and thank Drs. Joseph Halim, Dr. Qing Huang, Dr. Dmitri
Talapin, Dr. Johanna Rosen and Dr. Per Persson for sharing their raw data used herein. We
would also like to acknowledge Drs. Farley, Biesinger and Tougaard for their advice on peak
fitting and background subtraction.
References:
[1] M. Naguib, M. Kurtoglu, V. Presser, J. Lu, J. Niu, M. Heon, L. Hultman, Y. Gogotsi, M.
45
[2] B. Anasori, M. R. Lukatskaya, Y. Gogotsi, Nat. Rev. Mater. 2017, 2, 16098.
[3] L. Verger, C. Xu, V. Natu, H.-M. Cheng, W. Ren, M. W. Barsoum, Curr. Opin. Solid
State Mater. Sci. 2019, DOI 10.1016/j.cossms.2019.02.001.
[4] V. Natu, M. Clites, E. Pomerantseva, M. W. Barsoum, Mater. Res. Lett. 2018, 6, 230.
[5] S. Intikhab, V. Natu, J. Li, Y. Li, Q. Tao, J. Rosen, M. W. Barsoum, J. Snyder, J. Catal.
2019, 371, 325.
[6] V. Natu, R. Pai, M. Sokol, M. Carey, V. Kalra, M. W. Barsoum, Chem 2020, 6, 616.
[7] K. Montazeri, M. Currie, L. Verger, P. Dianat, M. W. Barsoum, B. Nabet, Adv. Mater.
2019, 31, 1903271.
[8] M. Benchakar, V. Natu, T. A. Elmelegy, M. Sokol, J. Snyder, C. Comminges, C. Morais,
S. Célérier, A. Habrioux, M. W. Barsoum, J. Electrochem. Soc. 2020.
[9] M. Carey, Z. Hinton, V. Natu, R. Pai, M. Sokol, N. J. Alvarez, V. Kalra, M. W. Barsoum,
Cell Reports Phys. Sci. 2020, 1, 100042.
[10] F. Shahzad, M. Alhabeb, C. B. Hatter, B. Anasori, S. Man Hong, C. M. Koo, Y. Gogotsi,
Science (80-. ). 2016, 353, 1137.
[11] M. Sokol, V. Natu, S. Kota, M. W. Barsoum, Trends Chem. 2019, DOI
10.1016/j.trechm.2019.02.016.
[12] Z. M. Sun, Int. Mater. Rev. 2011, 56, 143.
[13] M. W. Barsoum, MAX Phases, Wiley-VCH Verlag GmbH & Co. KGaA, Weinheim,
![Table 1: Summary of XPS peak fits by Halim et al. shown in Figure 1. [14] The Ti 3 C 2 T z sample was prepared by etching the MAX phase in 48% HF](https://thumb-eu.123doks.com/thumbv2/123doknet/14759917.584522/8.918.100.808.490.859/table-summary-halim-shown-figure-sample-prepared-etching.webp)


![Table 7: Summary of XPS peak fittings of Ti 2p spectra obtained from Ref [30] of Ti 3 C 2 T z synthesized by etching Ti 3 AlC 2 MAX in 10% HF solution](https://thumb-eu.123doks.com/thumbv2/123doknet/14759917.584522/29.918.99.797.254.375/table-summary-fittings-spectra-obtained-synthesized-etching-solution.webp)