HAL Id: hal-02600692
https://hal.inrae.fr/hal-02600692
Submitted on 16 May 2020HAL is a multi-disciplinary open access
archive for the deposit and dissemination of sci-entific research documents, whether they are pub-lished or not. The documents may come from teaching and research institutions in France or abroad, or from public or private research centers.
L’archive ouverte pluridisciplinaire HAL, est destinée au dépôt et à la diffusion de documents scientifiques de niveau recherche, publiés ou non, émanant des établissements d’enseignement et de recherche français ou étrangers, des laboratoires publics ou privés.
Defences. D3.2: Rapid and cost-effective dike condition
assessment methods: geophysics and remote sensing
P. Royet, S. Palma-Lopes, C. Fauchard, P. Mériaux, L. Auriau
To cite this version:
P. Royet, S. Palma-Lopes, C. Fauchard, P. Mériaux, L. Auriau. FloodproBE Project WP 3: Relia-bility of Urban Flood Defences. D3.2: Rapid and cost-effective dike condition assessment methods: geophysics and remote sensing. [Research Report] irstea. 2013, pp.136. �hal-02600692�
WP 3: Reliability of Urban Flood
Defences
D3.2: Rapid and cost-effective dike condition assessment
methods: geophysics and remote sensing
Date: April 2013
Report Number: WP3-01-12-20
Version Number: 1_4_P03
Deliverable Number: Due Date for Deliverable: Actual Submission date: Task Leader:
D3.2 30/09/11 03/12/12
Irstea (formerly Cemagref)
FloodProBE is co-funded by the European Community
Seventh Framework Programme for European Research and
Technological Development (2009-2013)
FloodProBE addresses “Technologies for Improved Safety of the Built
Environment in Relation to Flood Events”
Start date: November 2009, duration: 4 Years
Document Dissemination Level PU
PU = Public
PP = Restricted to other programme participants (including the Commission Services).
RE = Restricted to a group specified by the consortium (including the Commission Services).
CO = Confidential, only for members of the consortium (including the Commission Services).
CL restricted = Classified with the mention of the classification level restricted "Restraint UE"
CL confidential = Classified with the mention of the classification level confidential "Confidential UE"
CL secret = Classified with the mention of the classification level secret "Secret UE"
Document Information
Title Rapid and cost-effective dike condition assessment methods: geophysics
and remote sensing
Lead Author Paul Royet
Contributors Sergio Palma-Lopes, Cyrille Fauchard, Patrice Mériaux, Lucie Auriau Distribution "[Click here and list Distribution]"
Report Number WP3-01-12-20
Document History
Date Version Prepared by Organisation Approved
by
Notes
15/03/12 1_0_Pn Mériaux,
Palma-Lopes
Irstea, Ifsttar Royet Draft version for the Prague workshop
8/10/2012 Mériaux
Palma Lopes
Irstea Ifsttar
including remarks from the Prague Workshop
23/10/2012 1_1 Mériaux
Palma-Lopes
Irstea Ifsttar
Royet Final version for review
9/11/2012 1_2 Royet Irstea Final version after MT
review
3/12/2012 1_3 Royet Irstea Corrections to table 2.2
05/04/2013 1_4 Palma Lopes
& Fauchard
Ifsttar, CETE-NC
Royet Final corrections requested by reviewers and experts (FIGW)
Acknowledgement
The work described in this publication was supported by the European Community’s Seventh Framework Programme through the grant to the budget of the FloodProBE project, Grant Agreement Number 243401.
Disclaimer
This document reflects only the authors’ views and not those of the European Community. This work may rely on data from sources external to the members of the FloodProBE project Consortium. Members of the Consortium do not accept liability for loss or damage suffered by any third party as a result of errors or inaccuracies in such data. The information in this document is provided “as is” and no guarantee or warranty is given that the information is fit for any particular purpose. The user thereof uses the information at its sole risk and neither the European Community nor any member of the FloodProBE Consortium is liable for any use that may be made of the information.
Summary
The recent and dramatic floods of the last years in Europe (Windstorm Xynthia, February 2010) and United-States (Hurricane Katrina, August 2005) have shown the vulnerability of flood defence systems composed of man-made structures (as levees, walls, etc.) and natural structures (as dunes, etc.). The first key point for avoiding these dramatic damages and the high cost of a failure and its consequences lies in the knowledge of the safety level of the protection system. Identifying weak points of the system is the most important but the most difficult issue.
Most of the levees are old structures, built several centuries ago, then rebuilt, modified, heightened several times, with some materials that do not necessarily match the original conception of the structure. Other factors introduce weaknesses in a levee: (i) trees, roots, burrows or nests could modify the structure of the levee and reduce its mechanical properties; (ii) particular geological formations and their evolution could also threaten the dike, as it occurred in the city of Orléans, France, where levees have collapsed in karstic areas. In urban context, the levees present many other singularities, such as embedded networks, canalisations, human constructions like houses and walls. Due to all these factors, levees have to be considered as heterogeneous structures. Considering the stretch of hundreds of kilometres and the heterogeneity of the structures, rapid, cost-effective and reliable techniques for assessing and surveying the defence system must be carried out.
This report refers to the question of assessing embankment levees safety. The first part briefly presents a synthesis of the global approach related to diagnosis.
The second part focuses on the contribution of geophysical methods; guidelines are issued from the conclusions of an International Workshop on Geophysics held in Paris in March 2011. This chapter contains guidelines on application to urban areas for managers to implement and integrate geophysical investigation results into the asset support system. If focuses on technical, practical and economical features such as geophysical method applicability, reliability, rapidity, limitations (particularly in urban areas) and cost-effectiveness. Approaches based on method combination and comprising overall investigation followed by detailed investigation phases are confirmed.
Slingram (electromagnetic induction) profiling and Electrical Resistivity Tomography are among the
most preferred methods. However, all other methods can play important and specific roles, depending on the stakeholder requirements and the asset features and setting. Temporal approaches have proved powerful tools for weak zone detection and monitoring and should be more widely used in the near future.
The third part is dedicated to remote sensing and more specifically to the helicopter borne LiDAR (Light Detection and Ranging) technology, which provides extremely accurate topographic data at a highly efficient rate. In support of a real case study (“Val d’Orléans” Pilot Site), a methodology is developed for performing an helicopter borne survey and for using remote sensing LiDAR data and high-resolution aerial imagery – acquired in “dry conditions” (e.g. not in a flood context) - to contribute efficiently to a rural or urban flood defense structure diagnostic or assessment.
Contents
Document Information ... ii Document History ... ii Acknowledgement ... ii Disclaimer ... ii Summary ... iii1 Introduction to levee assessment ... 11
1.1 Levee break or damage mechanisms ... 11
1.2 A general methodology for levee assessment ... 12
1.3 Preliminary studies... 13
1.4 Geophysical studies ... 15
1.5 Geotechnical testing ... 15
1.6 Numerical modelling ... 16
1.7 Synthesis of the assessment ... 17
2 Rapid geophysical investigation for condition assessment of embankment dikes in urban areas ... 19
2.1 About this geophysics guidance ... 19
2.1.1 Problem statement ... 19
2.1.2 The FloodProBE ‘Geophysics’ Task ... 19
2.1.3 Scope and objectives of chapter 2 ... 20
2.1.4 How to use this chapter ... 20
2.1.5 Legitimacy ... 21
2.2 Geophysical methods applied to embankment dike investigation ... 22
2.2.1 A brief introduction to near-surface geophysics... 22
2.2.2 Geophysics applied to embankment dike investigation ... 24
2.2.3 Recommended geophysical approaches for investigating embankment dikes .. 27
2.2.4 Practical features of the main geophysical methods applied to embankment dike investigation: Usefulness, applicability and cost-effectiveness ... 33
2.3 Step-by-step guidance to selecting and implementing geophysical approaches ... 39
2.3.1 Overall assessment methodology: interactions with geophysical investigations 40 2.3.2 Stakeholder requirements ... 42
2.3.3 Dike information needed by geophysics expert ... 47
2.3.4 Getting ready for the geophysics implementation ... 49
2.3.5 Overall rapid investigation ... 49
2.3.7 Interpretation and reporting of the geophysical results ... 56
2.4 A real case study on the Orléans pilot site ... 56
2.4.1 Orléans pilot ... 56
2.4.2 Preliminary studies ... 56
2.4.3 Geophysical investigations ... 59
2.4.4 Conclusion and interpretation of the geophysical investigation: providing a detailed dike model to stakeholder ... 64
2.4.5 Acknowledgements ... 64
2.5 A real case study in the Hull pilot site (UK) ... 66
2.5.1 Introduction of the selected sites and measurement methodology ... 66
2.5.2 Preliminary studies and research ... 67
2.5.3 Tidal Embankment Humber Estuary, New Winteringham (Site A) ... 67
2.5.4 Fluvial Embankment New Ancholme River (SITE B) ... 75
2.5.5 Coastal Embankment Immingham (SITE C) ... 78
2.5.6 Conclusion ... 78
2.6 Conclusion and prospects ... 79
2.7 Appendix: Geophysical method technical sheets ... 80
2.7.1 Slingram electromagnetic induction (EMI) profiling ... 80
2.7.2 Electrical Resistivity Tomography (ERT) ... 82
2.7.3 Ground Penetrating Radar (GPR) ... 87
2.7.4 Seismic methods ... 90
2.7.5 Self-Potential (SP) techniques ... 94
2.7.6 Ground Temperature Sounding and Tomography ... 96
3 Using Helicopter-Borne LiDAR to Contribute to Levee Assessment - Experiment on “Val d’Orléans” Pilot Site ... 100
3.1 Topographical data is essential to levee assessment ... 100
3.1.1 Levees in Urban Areas ... 100
3.1.2 High Resolution Topographical Data Required ... 100
3.1.3 Levee Top Longitudinal Profiles Against Maximum Headwater Level During Floods 102 3.1.4 Cross-sections ... 102
3.1.5 Topographic Plan ... 103
3.1.6 Flood Plain Topography ... 103
3.1.7 Conclusion on the importance of topographical data ... 104
3.2 Remote Sensing Technologies Contributing To Levee Assessment ... 104
3.2.2 LiDAR ... 104
3.2.3 Summary Table ... 109
3.3 Methodology for Using High Resolution Lidar Data ... 109
3.3.1 Val d’Orléans Pilot Operation – Overview ... 109
3.3.2 Proposed Method to Contribute to a Levee Assessment ... 115
3.4 Conclusion ... 128
3.4.1 Relevance to Practice ... 128
3.4.2 Remaining gaps in Knowledge ... 129
3.4.3 Summary table of the methodology ... 129
3.5 Appendixes to Chapter 3 ... 129
4 References ... 133
4.1 General to levee assessment ... 133
4.2 Specific to geophysics ... 133
4.3 Specific to remote sensing ... 135
Tables
Table 2.1 Practical features of the main geophysical methods applied to dike investigation .... 37Table 2.2 Geophysical method applicability with respect to stakeholder requirements. (Green: Recommended method or even preferred method; Yellow: Conditionally applicable method; Red: Not applicable method or not recommended method from a cost-effective viewpoint (see Table 2.1)). ... 44
Table 2.3 Asset data sheet compiling the information needed by the geophysics expert. ... 48
Table 2.4 Typical values of dielectric constant for common geological and civil engineering materials ... 88
Table 3.1 Connections between Topography and Levee Damage or Break Mechanisms ... 101
Figures
Figure 1.1 General methodology proposed in 2007 by the French National Project CriTerre (Fauchard & Mériaux, 2007) ... 12Figure 1.2 Example of historical data of the dikes of the Authion river (France, Loire) (Dion, 1961) ... 13
Figure 2.1 General scheme of a geophysical investigation process: (a) geophysical data acquisition, (b) geophysical parameter graph, map or cross-section with additional borehole data and (c) subsoil structure model or geotechnical property distribution. 23 Figure 2.2 Geophysical acquisition device examples: (a) Dipole electromagnetic profiling with GEM2 equipment (© METCENAS, G IMPULS PRAHA s.r.o.), (b) Slingram electromagnetic profiling with EM31 device towed on non-metallic cart (© LRPC Saint-Brieuc), (c) GPR profiling with towed antenna (© LRPC Saint-Brieuc) and (d) Electrical Resistivity Tomography (© ERINOH, Ifsttar). ... 23
Figure 2.3 Examples of embankment levees protecting urban areas (Orléans, France). Some stretches are very lightly embedded (left side views) whereas others are very strongly embedded (right side views) in the urban environment. (© CETE Normandie
Centre, DREAL Centre). ... 27
Figure 2.4 The main recommended geophysical investigation zoning approach (‘First approach’) and a significant alternative (‘Second approach’) (in Fargier et al., 2012). ... 29
Figure 2.5 Principle of temporal approaches ... 31
Figure 2.6 Overall concept for selecting a geophysical approach (© M.W. Morris and FIGW participants). ... 39
Figure 2.7 Condition assessment methodology: this diagram presents a close-up and an alternative to Figure 1.1 in the sense that geophysical and geotechnical investigations are conducted in a fully interactive process (with mutual expectations and benefits). ... 41
Figure 2.8 Geological map of Orléans and the surrounding countryside ... 57
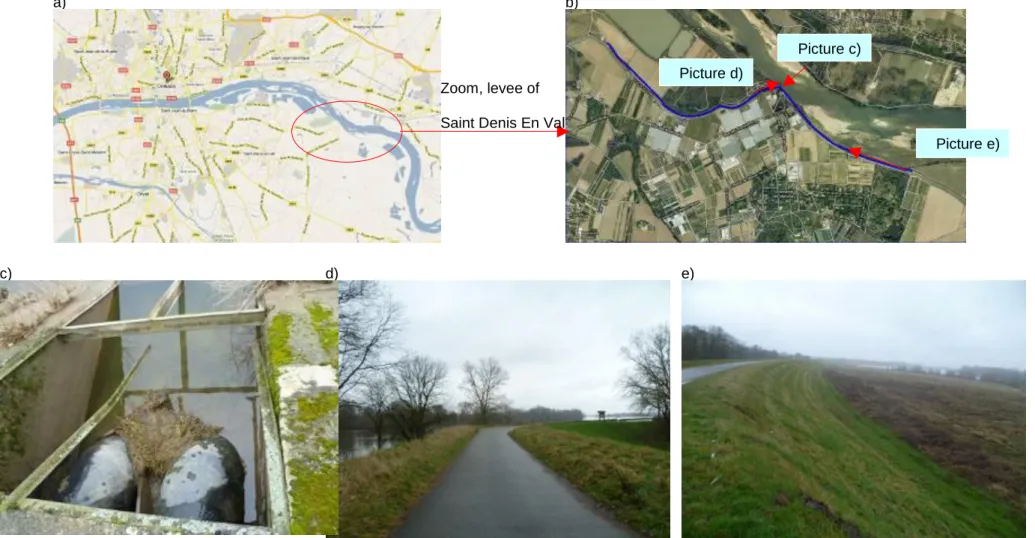
Figure 2.9 a) Map of Orléans and its region, b) aerial photo of studied dike in Saint-Denis-En-Val, c) gas network, d) road structure and e) view of the dike and the Loire bed ... 58
Figure 2.10 Stretch studied with location of old breaches ... 59
Figure 2.11 Dike model from geotechnical testing ... 59
Figure 2.12 RMT results on the studied dike. Top: 162 kHz and bottom: 693 kHz. Red: land side of the crest; blue: river side of the crest... 60
Figure 2.13 Slingram (EM31, VD mode) results on the studied dike. Red: land side of the crest; blue: river side of the crest ... 61
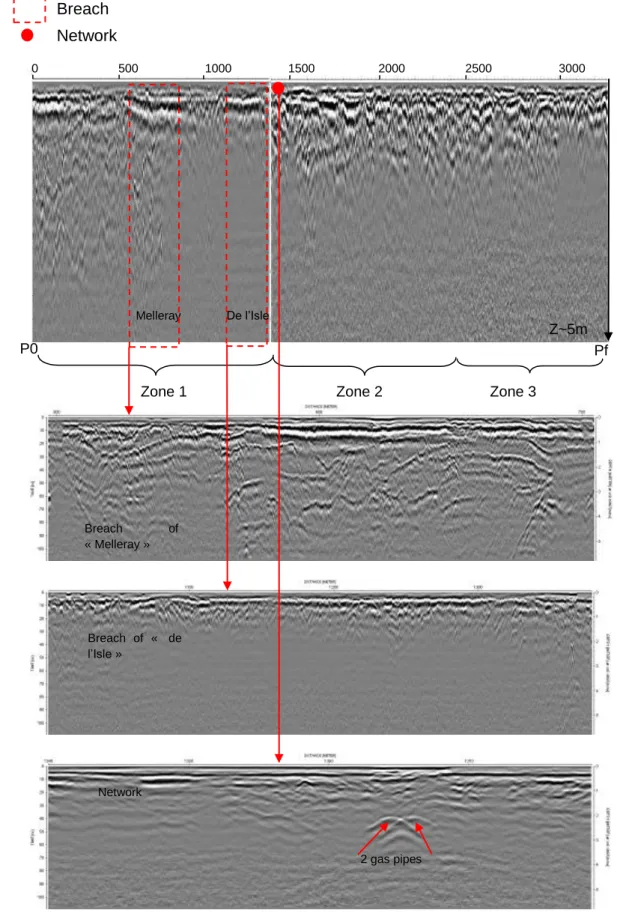
Figure 2.14 GPR measurements at 200 MHz. On top, whole profile and zoom on the breaches and the gas network. ... 62
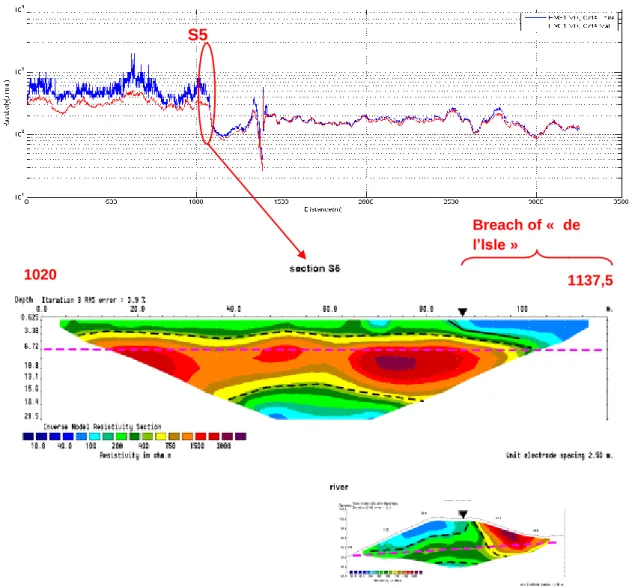
Figure 2.15 Slingram and ERT measurements at the transition with a known old breach. ... 63
Figure 2.16 Dike model and interpretation deduced from geophysical measurements ... 65
Figure 2.17 Sites in Humber estuary; Hull (UK) ... 66
Figure 2.18 First zoning by the Slingram method (GEM2) at Site A ... 68
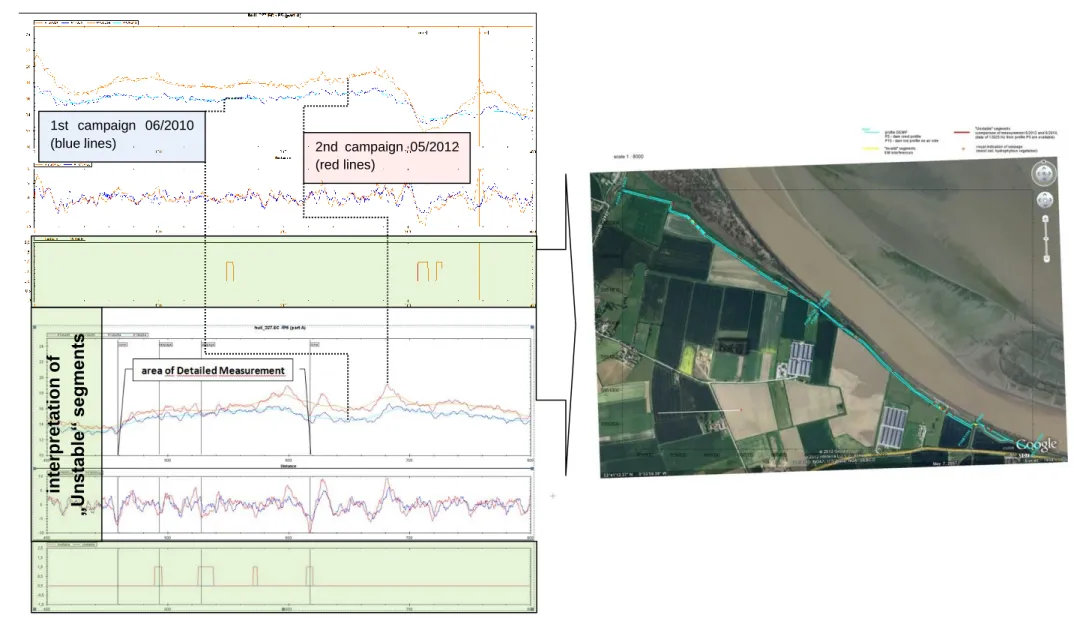
Figure 2.19 Overview of the detailed measurement and interpretation of possible problematic area ... 69
Figure 2.20 Slingram profile measured on Site A in 05/2012 ... 70
Figure 2.21 Examples of long term repeated / monitoring measurement – Site A - Slingram method – regional profile P5A ... 71
Figure 2.22 Methods and measured profiles within the detailed measurement at Site A ... 72
Figure 2.23 Detailed ERT result at Site A, profile K72. ... 74
Figure 2.24 Detailed SP result at Site A: Repeated SP measurements along profile P12 (top) and time changes of average SP readings from P12 (bottom). ... 75
Figure 2.25 Slingram profile and detailed ERT measurement at Site B ... 77
Figure 2.26 Slingram profile and results at the Site C ... 78
Figure 2.27 Slingram principle in vertical dipole (VD) mode (Chouteau, 2001)... 80
Figure 2.28 Example of Slingram measurement on a dike crest (Fauchard and Mériaux, 2007) . 81 Figure 2.29 Schematic of a single apparent resistivity measurement using 4 “point” electrodes denoted A, B, M and N ... 83
Figure 2.30 Common electrode configurations used in DC-resistivity techniques, including ERT 84 Figure 2.31 Resistivity (and conductivity) ranges for common geological materials (adapted from: Palacki, 1991) ... 85
Figure 2.32 Example of ERT inversion results on dike for averaged Half-Wenner data with topographic correction (Hennig et al., 2005) ... 86
Figure 2.33 Principe of Radar (GPR) measurements ... 88
Figure 2.34 Example of B-scan. The road layers are continuous signals below 1 m. Notice at 690 m, a transition zone between an attenuating part of the dike and a sandy part of the dike ... 89
Figure 2.36 Example of seismic refraction survey results on a canal. Time-curve representation of refracted waves (top) and interpreted velocity map (bottom) as functions of distance and depth (or travel time). The interpreted contact between the dike body and the substratum (black line) was correlated with borehole data (Bièvre and
Norgeot, 2005) ... 92
Figure 2.37 a) Conventional MASW method, b) Cross-correlation method, together with an interpreted geological section (c). The geology consists of brown silt (BS), graveled sandy alluvium (SG), limestone substratum (L). Weathered materials are marked WM (Bitri et al., in Coll., 2011) ... 93
Figure 2.38 SP acquisition protocol using: a reference electrode, a mobile electrode, bentonite clay for plugging the electrodes into the ground surface and a voltmeter ... 94
Figure 2.39 Example of 2D-SP inversion result: Vertical section of electrical current density Js distribution ... 95
Figure 2.40 Schematic sketch of the ground temperature technique ... 97
Figure 2.41 Installation of an array of temperature probes along the embankment crest ... 97
Figure 2.42 Temperature tomography along a vertical section of an embankment ... 98
Figure 2.43 Temperature versus time at different depths for seasonal and daily variations... 98
Figure 3.1 Helicopter-Borne LiDAR Acquisition Principle [source: Fugro-Geoid] ... 106
Figure 3.2 Laser Multiple Return Principle [source : Fugro Geoid] ... 107
Figure 3.3 Plan and 3D Views of Natural Colored Raw Points of Left Bank Abutment Area .... 112
Figure 3.4 Oblique and Nadir Raw Aerial Pictures Upstream Capucins Levee ... 112
Figure 3.5 Ortho-Mosaic Index Charts ... 113
Figure 3.6 Left to Right, SDM and No-Vegetation SDM from the Same Area ... 113
Figure 3.7 DTM of Same Area as Above ... 114
Figure 3.8 Abstract from Jargeau Spillway Topographic Plan ... 114
Figure 3.9 Playing Geo-Referenced Videos with FliMap Analyst Plug-In ... 115
Figure 3.10 Nadir Photograph of a Levee with a Curb in Urban Area ... 116
Figure 3.11 Nadir Photograph of a Vegetation Block on the Levee ... 116
Figure 3.12 Nadir Photograph of a Farm Embedded in the Levee ... 116
Figure 3.13 Nadir Photograph of a Breach in the place named “la Brèche” ... 116
Figure 3.14 Left to Right: Oblique Video and Nadir Photograph of a Junction with Watercourse down the Levee Toe ... 117
Figure 3.15 Old 1856 Map Showing Information on High Floods ... 117
Figure 3.16 Example of 1/500 Topographic Plan on Capucins Levee ... 119
Figure 3.17 SDM (Left) Result from SDM/No-Construction SDM Raster Subtraction ... 120
Figure 3.18 SDM with Color Shadowing ... 120
Figure 3.19 Photograph of Sight Holes and Outlet on Capucins Levee Crossing Work ... 121
Figure 3.20 Treatments Performed with ArcGis on Figure 3.19 Area. ... 121
Figure 3.21 Example of SDM/No-Vegetation SDM Subtraction to Display Vegetation ... 122
Figure 3.22 Photograph and SDM of Sample Transition Structure ... 123
Figure 3.23 Châteauneuf-sur-Loire Location Map ... 124
Figure 3.24 Diagram Showing 1856 Flood Water Level and Levee Profile from Point A to Point B on Loire River Left Bank ... 124
Figure 3.25 Example of a Narrow Levee Profile on the Loire River Right Bank, in Val de Bou .. 126
Figure 3.26 Cross-Section along Black Line (Figure 3.25) ... 126
Figure 3.27 Flashboard Gallery on Val de Bou ... 127
FloodProBE work package 3 framework
The recent and dramatic floods of the last years in Europe (Windstorm Xynthia in France, February 2010, floods in South of France, 2002 and 2003, historical floods in Central Europe, Summer 2005), United-States (Hurricane Katrina, August 2005) and Asia (Thailand, 2011) have shown the vulnerability of flood defence systems composed of man-made structures (as levees, walls, etc.) and natural structures (as dunes, etc.). The first key point for avoiding these dramatic damages and the high cost of a failure and its consequences lies in the knowledge of the safety level of the protection system. Identifying weak points of the system is the most important but the most difficult issue.
Most of the levees are old structures, built several centuries ago, then rebuilt or repaired (after a breach), modified, heightened several times, with some materials that do not necessarily match the original conception of the structure. The levee foundations are also heterogeneous and in general were not properly treated to improve their water-tightness or other fundamental properties. Other factors introduce weaknesses in a levee: (i) trees, roots, burrows or termite nests could modify the structure of the levee and reduce its mechanical properties; (ii) particular geological formations and their evolution could also threaten the dike, as it occurred in the city of Orléans, France, where levees have collapsed in karstic areas. In urban context, the levees present many other singularities, such as embedded networks, pipes, human constructions like houses and walls. Due to all these factors, levees have to be considered as heterogeneous structures. Considering the stretch of hundreds of kilometres and the heterogeneity of the levees, both good assessment methods, based on sturdy fundamental knowledge of the failure mechanisms and the strength of the levee components, and rapid, cost-effective and reliable techniques for data acquisition and surveying the defence system are necessary.
FloodProBE work package 3 relates to the question of assessing earthen levees safety, more specifically in urban area. Task 3.1 actions deal with fundamental knowledge about the failure mechanisms or resistance of the dike. Task 3.2 actions deal with rapid, cost-effective investigation techniques. Task 3.3 deals with the question of the assessment methodology itself.
An assessment1 is a process that has the objective to evaluate the performance of a levee system relating to one of its main functions: to protect against a given natural event and to be stable/safe. A complete assessment should include a diagnosis of the actual or possible causes of failure, in order to remediate or prevent them.
The assessment process can be described, in a very simple way, as the use of one or more methods of treating and combining data in order to obtain an evaluation of the performance of the levee system, according to its main function (protect against flood) and/or its reliability (against the possible failure modes). This can be done in different ways, as there are different assessment methods used in different countries, all based on a combination of data processing, using expert judgment, index based methods, empirical models, physical and/or mathematical models.
1 ASSESSMENT relates to the global process of evaluating the safety level of the levee; DIAGNOSIS comes in
complement when we want to specifically analyze the causes (mechanisms, failure modes) of a problem or of a risk.
Assessment make use of a lot of data. Some are already available at the start of an assessment process, while other ones are needed but unavailable; so specific data gathering has to be made during the assessment process. These data gathering can be done during specific inspections and investigations. And all data has its place in the information system of the levee manager.
Task 1 of work package 3 deals with improving fundamental knowledge of: - Mechanisms leading to failure of an earthen work (internal erosion, 3.1.1)
- Structural weaknesses and associated failure modes (structure transitions, 3.1.2), - Performance of the levee (resistance to external erosion brought by vegetation, 3.1.3) which are essential for understanding the possible failure modes of the levee.
Task 2 of work package 3 deals with rapid and cost-effective investigation techniques: - Geophysics, to complement classical geotechnical investigations and tests,
- LiDAR to get a high quantity of topographic information as well as high resolution pictures and videos.
which are essential data to be used during an assessment process.
Task 3 of the work package 3 details the general assessment framework developed during the project, as well as presents different examples of assessment methods and the way they can be improved using the developed framework.
This report is on task 2 and refers to the question of getting data to be used in assessing earthen levees safety. The first part briefly presents a synthesis of the global approach related to diagnosis. The second part focuses on the contribution of geophysical methods; guidelines are issued from the conclusions of an International Workshop on Geophysics held in Paris in March 2011. The third part is dedicated to remote sensing and more specifically to the helicopter borne LiDAR (Light Detection and Ranging) technology, which provides extremely accurate topographic and imagery data at a highly efficient rate and that was tested on “Val d’Orléans” Pilot Site in the framework of FloodProBE, with the financial support of two structures managing organisations (DREAL Centre and SNCF) and of an industrial partner (Fugro-Geoid).
Statement: the terms “levee” and “dike” are considered as synonyms. We also employ the term “embankment” when the structure is made of earth.
1 Introduction to levee assessment
1.1 Levee break or damage mechanisms
In rural or suburban areas, flood protection dikes are generally built as embankments (and are most commonly referred to as “levees”). Such design has always been widely accepted by hydraulic work designers as it helps highlight the watertight (clay or silt) or semi-permeable (silty sand) ground deposits frequently observed in alluvial valleys. It specifically complies with the technical and financial optimum for levees by minimizing earthmoving constraints (cut and fill construction).
Embankment flood dikes are subjected to four main damages or break mechanisms (Mériaux & Royet, 2007) that are more or less associated with the action of water these structures are supposed to retain or contain:
Internal erosion;
Overflow: when the levee top is exceeded by the river water level (overflowing) or waves (overtopping);
Sliding slope;
Slope external erosion on the watercourse side from the action of flow or waves. These mechanisms are not independent: they may be sequenced and/or maintain each other until they induce the levee break (total or partial breach with release of a flood wave). For example: current-driven erosion results in the slope getting steeper on the watercourse side of a waterway levee, with the said slope sliding upon the fall in the water level (mechanical “break” in so-called rapid draw-down conditions) and, at the next flood, the embankment – with a narrower profile, thereby supporting an increased hydraulic gradient – is subjected to internal erosion that will lead to a breach.
Of all such four mechanisms, internal erosion stands out as hardly identifiable as, by essence, it is produced at the heart of the structure and its foundation and develops at a more or less slow pace:
From the one part, through visual observation which, by nature, only helps identify indications displayed outside the structure;
From the other part, through geophysical or geotechnical methods since the event may be extremely local and internal erosion is only proven when the dragging of ground particles from the work or the foundation thereof has taken place and led to the formation of under-dense areas, voids or ducts.
Thus, internal erosion will rather be identified by reviewing its initiating events or indirect effects, including the specific construction or behavioral features of the structure or foundation thereof from which such internal erosion may arise: permeable areas, ground/rigid structure interfaces, internal flow development, etc.
1.2 A general methodology for levee assessment
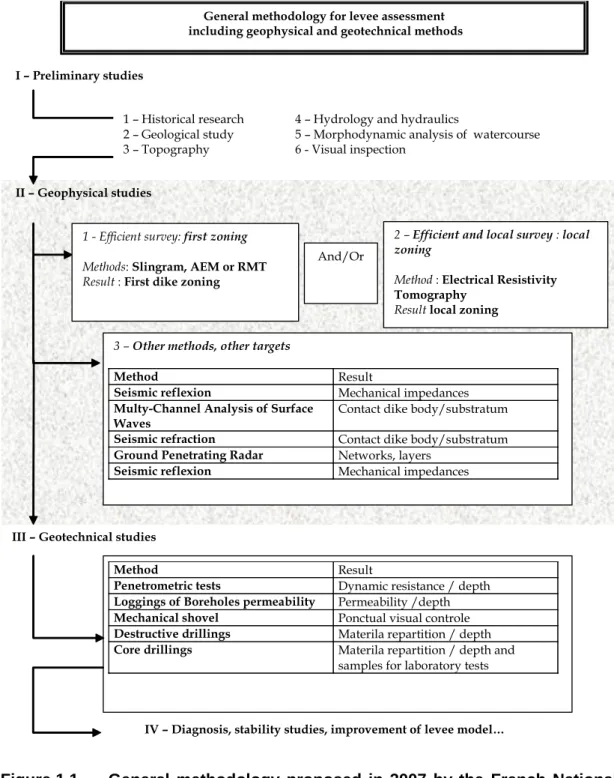
The management of levees involves many stakeholders and consists of surveying, maintaining and making safety assessments (Mériaux & Royet, 2001). The initial assessment, including diagnosis of the (potential) problems, should identify the weaknesses of the structure (zoning) and provide the level of safety. Thus, a general assessment methodology (Figure 1.1) has been proposed by Fauchard & Mériaux (2007), including a particular interest for data originating from geophysics.
Method Result
Penetrometric tests Dynamic resistance / depth Loggings of Boreholes permeability Permeability /depth Mechanical shovel Ponctual visual controle Destructive drillings Materila repartition / depth Core drillings Materila repartition / depth and
samples for laboratory tests 4 – Hydrology and hydraulics
5 – Morphodynamic analysis of watercourse 6 - Visual inspection
III – Geotechnical studies II – Geophysical studies I – Preliminary studies
1 - Efficient survey: first zoning Methods: Slingram, AEM or RMT Result : First dike zoning
2 – Efficient and local survey : local
zoning
Method : Electrical Resistivity
Tomography
Result local zoning
IV – Diagnosis, stability studies, improvement of levee model… General methodology for levee assessment
including geophysical and geotechnical methods
And/Or
3 – Other methods, other targets
Method Result
Seismic reflexion Mechanical impedances Multy-Channel Analysis of Surface
Waves Contact dike body/substratum Seismic refraction Contact dike body/substratum Ground Penetrating Radar Networks, layers
Seismic reflexion Mechanical impedances 1 – Historical research
2 – Geological study 3 – Topography
Figure 1.1 General methodology proposed in 2007 by the French National Project CriTerre (Fauchard & Mériaux, 2007)
It applies to the levees running alongside rivers, where the dikes are not in a permanent hydraulic loading. The assessment is performed in dry condition. This methodology is based on several tests carried out in the framework of the French National Project “CriTerre” and the ERINOH (Internal Erosion in Hydraulic Earthworks) project. This methodology can be applied to sea defences, with slight differences on in-situ inspections and hydraulic matters. A similar proposal is also included in the GMS methodology (Beneš et al., 2005).
This assessment (Figure 1.1) begins with preliminary studies, before performing geophysical surveys. It goes on with geotechnical testing, before ending with the evaluation of the safety level.
1.3 Preliminary studies
The preliminary studies consist in gathering all available information concerning the levee, the near environment and its history, and producing the basic needed studies (Lino & al., 2000).
a) The historical research (Figure 1.2) can establish the way the levee was built, the locations of old repaired breaches, material distribution, etc. The study of historical archives gives clues wherefrom the materials were extracted so as to build and repair the dike.
Figure 1.2 Example of historical data of the dikes of the Authion river (France, Loire) (Dion, 1961)
b) The geological study (map and in-situ observations) of the near area gives information about materials potentially used for building the levee and on the underlying substratum. Karstic areas or solutable foundation must be identified as they can threaten the levee. c) The topography of the dike contains valuable information. From the longitudinal profile of the crest, we can assess the risk of overtopping during a flood by comparing it with the highest past flood. A map of the transverse profile is also required for stability studies and risks of internal erosion, as well as for an accurate location of any structure (walls, crest water gates, crossing networks…) that can modify the interaction between water and levee in case of flood. Finally, the topography is useful for levee management and maintenance. It provides 3D coordinates for visual inspection, geophysical and geotechnical studies. The topographic map has usually a scale of 1:500 to 1:1000. With conventional methods,
longitudinal profiles are performed on the crest with a point every 20 to 25 m and transverse profiles are realized every 50 to 200 m, depending on the context. This is a critical issue in the dike study, and it could be time and cost consuming for dike of long extent. In that case,
LiDAR systems are an interesting alternative surveying technique and provide accurate 3D
points along the dike with a high point density (see chapter 3).
d) A hydrological survey involves determining the nature of floods with different recurrence intervals (flow rates, duration and frequency). It is based on watercourse flow rate measurements taken at stream-gauging stations, together with information on historical floods. Significant changes in land use in catchment areas (dense urbanisation, extensive reforestation programmes, etc.) or large-scale upstream developments (flood-control dams) are liable to modify flood-water regimes (especially during medium-intensity floods) and may necessitate the updating of previous hydrological surveys.
Hydraulic studies are used to convert the results from hydrological studies into flow lines for
ten-year, thirty-year and hundred-year (or more) floods. They require knowledge of the detailed topography of the stream bed (costly) and the implementation of a hydraulic model. In most cases, a steady-state, mono-dimensional model is sufficient. Historical flood flow lines may provide enough information, dispensing with the need for the hydrological and hydraulic surveys mentioned above, provided that:
– Historical flooding has not led to dike failure;
– Stream bed modifications (longitudinal profile, new embankments, changes in floodplain land use) do not lead to any significant change in flow lines at equivalent flow rates;
– The hydrology of the catchment area has not changed significantly.
Comparisons of the flow lines for different flood recurrence intervals against the longitudinal profile of the levee (taking into account a necessary freeboard) make it possible to define the
maximum protection flood – that is, the most extreme event against which the dike is
expected to protect the valley.
The survey should be completed with an analysis of scenarios of exceptional flood peaks and associated phases of retreating water (spill over, filling and draining times of the flood spreading plain, operation of spillways, evacuation works, flap gates, sluices, etc.).
e) The morphodynamic study consists in understanding the sedimentology, the hydrology and the morphometric characteristics of the waterway. Geomorphic processes of rivers may impact the safety of levees by various means (Degoutte, 2006):
– Bank scour by flowing water that can destabilize levees if near the riverbed;
– Horizontal channel changes that may alter the currents during floods or bring the low flow channel closer to the levee;
– Evolution of the river profile by generalized incision - that can destabilize levees by rotational sliding, decrease the frequency of overflows, change the location of the first overflow, alter operation of weirs in levees;
– Evolution of the river profile by generalized aggradation – that can also change the conditions of overflow.
These processes are influenced by sediment transport of alluvial materials, but we will not forget the importance of woody vegetation, both for its role in the resistance of the banks, and for the transport and accumulation of wood. The transported wood can attack the river banks, slopes of the levee or protection of these slopes. Wood deposited during floods can cause localized areas of overflow on levees.
The morphodynamic study must take into account the temporal evolution of the watercourse channel such as translation of meanders, sideways progression of the river arms or deposits, regressive or progressive erosion of the river bed, aggradation, etc.
f) The visual inspection is performed after the historical research and the topographic work. This phase confirms, completes or invalidates any information previously collected. It is recommended to perform this inspection by three inspectors: one on the crest, and two at the levee toes on riverside and landside. Any anomaly should be reported on the topographic map and specific data sheets.
1.4 Geophysical studies
The geophysical exploration (see chapter 2) consists in mapping the levee body (nature and distribution of the material – the levee substratum is considered as a part of the levee body). Both the geometry (stretch and height) of the levee and the materials influence the choice of the methodology as well as the interpretation of the measurements.
Considering a typical study where the levee is a long structure of several kilometres, a classical approach starts with carrying out a rapid and cost-effective survey. It provides information on the homogeneity of the entire dike body. Then, heterogeneous areas that may weaken the dike body during a flood event are located.
Depending on the geophysical method, a physical parameter is measured according to different profile paths: along the crest (longitudinal profile), across the dike (transverse profile), at the toes of the dike (longitudinal profiles at the river side and the land side). The results of a geophysical survey must be correlated with the previous studies. This first survey helps focusing on interesting areas, which can be measured with appropriate geophysical or/and geotechnical methods (Figure 1.1).
1.5 Geotechnical testing
Geotechnical testing is generally carried out after the first investigations (prior knowledge of historical building and materials, localisation of heterogeneous areas). The final interpretation of geophysical measurements is only relevant when coupled with geotechnical testing. People interpreting the measurements have to decide to extrapolate - or not – the local tests to the rest of the levee.
Geotechnical testing locally provide physical parameters of the levee body that are required for a good diagnosis. A detailed methodology is given in (Lino et al., 2000)
Penetrometric tests are generally the first geotechnical method used to provide information about the soil density (derived from the measured dynamic resistance (in MPa) with regard to
depth) and the layer thickness in the dike body. It consists in hammering a conical tip in soil with some characteristics depending on the penetrometric device. The depth of penetration can easily reach 10 m.
Permeability testing (e.g. the Lefranc test) consists in drilling a borehole, injecting and/or pumping water in an open-ended cavity, called a lantern, at the bottom of the borehole. It measures the variations of hydraulic head and its flow rate and gives the hydraulic conductivity (m.s-1) around the lantern. Some devices evaluate both the soil density and the permeability.
Shear tests with phicometer provide the shear strength and the friction angle of soil. It consists in a probe – metal expansion shells - fitted with horizontal annular teeth inserted into the borehole. The shells move only laterally so that the teeth dig the soil. The method needs a good drilling quality with no lining –not the case in highly heterogeneous soils – and is not suited for soft soils.
A local investigation can be carried out with a mechanical shovel, digging a pit in the dike body or at its toe. It provides the distribution of materials.
Mechanical drilling basically provides the advance speed in borehole, and the location of interface layers. In case of destructive drilling, materials are breaking up and transported to the surface (cuttings) using a circulating fluid or a helicoidal cutting tool (auger). If percussion or roto-percussion conducts drilling (for cohesive and rocky soils), the analysis of cuttings can be difficult, but more information is provided by registered parameters like advance speed, tool pressure, circulation fluid pressure... The auger is applied mostly for loose and poorly cohesive soils and allows taking some material samples for lab-test analysis (water content, Atterberg limits, etc). In case of core drilling - non-destructive testing – soil samples are extracted directly from borehole without modifying physical properties of soils. Then the samples can be packed and sent for lab testing. Core drilling is local, more expensive and time consuming than destructive drilling, but provides very useful information for assessing dike properties.
All these methods require a free access to vehicle in the measuring location (crest and/or toe of the dike).
1.6 Numerical modelling
Numerical modelling is now widely used in geotechnical design. Improvements in the computational ability of modern computers and the development of more user-friendly specialist software programmes mean that a whole range of structural loading hypotheses can be tested rapidly on a given structure. Though useful, such tools nonetheless have two major limitations:
– Any model is an intellectual simplification of the real situation, which is based on the more or less complete representation of a few physical phenomena and their interactions (including boundary conditions);
– The quality of modelling results depends directly on the quality and representative character of the data used to set the model’s parameters.
On the first point, we can consider that, being relatively simple structures, levee analysis does not require highly sophisticated models and that many tools used widely in engineering could be considered suitable for use. On the second point however, modelling proves to be limited in that levees are heterogeneous and certain model parameters are difficult to obtain in a representative and reliable fashion (mechanical properties in particular).
So, dike modelling should be carried out by:
– Referring whenever possible to the results of previous studies before embarking on any new calculations;
– Prioritising simple models, the parameters and boundary conditions of which can be relatively easily fixed;
– For levee diagnosis, systematically checking the sensitivity of results by varying the data within ranges determined by the results of exploratory surveys or by other studies;
– Using models to compare a variety of upgrading solutions and/or optimise their dimensions.
The purpose of internal hydraulic modelling carried out in a steady state with a parametric study of permeability values is to obtain the internal piezometric head to be taken into consideration in mechanical modelling in addition to the hydraulic gradients used to evaluate the risk of piping (see FloodProBe D3.1). This is particularly relevant in case of sand layers in connection with the river bed.
Geomechanical modelling is carried out using simple two-dimensional models based on
circular or plane failure mechanisms, as part of studies into the overall stability of the dike. It is best to opt for a parametric approach, given that one of the major advantages of mechanical modelling is to assess the improvements afforded by upgrading and to compare different solutions.
1.7 Synthesis of the assessment
When carrying out diagnosis, it is good practice to include an assessment of the infrastructures and human activities that would be affected in the event of levee failure or malfunction.
A brief assessment of the consequences of levee failure should be made so as to classify segments being studied in order of priority and to gear diagnostic and upgrading methods to the vulnerability of the protected area as necessary.
Vulnerability is evaluated according to the following criteria:
– Land use (urban, periurban, industrial, agricultural, etc.); – Size of the protected population;
– Infrastructures and networks under threat (roads, railways, channels, buried networks, etc.)
(1) – Low to medium vulnerability; (2) – High vulnerability;
(3) – Very high vulnerability.
Risk results from a combination of hazard probability (unforeseeable turns of events) and vulnerability (importance of human interests liable to suffer the prejudicial consequences of such events). This risk is evaluated for a given flood level, which is usually associated with a reference recurrence interval or historic event.
Failure probability is evaluated on the basis of conclusions drawn from diagnosis, which
seeks to classify each segment of dike according to a category of failure probability: (1) – reliable dike in terms of the reference event (flooding)
(2) – dike with a low degree of failure probability; (3) – dike with a high degree of failure probability.
The global failure probability of a particular segment is the failure probability corresponding to the failure mechanism or degradation (overtopping, scouring, internal erosion, etc.) most likely to occur.
Evaluation of the risk associated with a particular segment is a combination of that
section’s failure probability and the vulnerability of the protected area. It is possible to give a score that could be, for example, the multiplication of the probability and vulnerability scores. A suitably-scaled (1:10,000) cartographic approach is recommended for conclusions about risk analysis. It should show:
Division into homogeneous segments;
Grading by segment of the probability of malfunction and failure; Vulnerability by zone of protected areas;
2 Rapid
geophysical
investigation
for condition
assessment of embankment dikes in urban areas
2.1 About this geophysics guidance
2.1.1 Problem statement
Geophysical investigation has become a popular phase within overall methodologies for assessing embankment dike condition, as it allows investigating larger volumes as compared to conventional exploration techniques for assessing geotechnical properties. Nonetheless, geophysics experts’ views on geophysical method selection and applicability appear to not always converge. Debates seem to circle and to feed on technical, regional and cultural preferences rather than on more fundamental and practical issues. This in turn prevents end users, such as flood defence managers, to more widely and confidently make use of geophysics, as concluded from the FP6-FLOODsite research programme. Furthermore, it is definitely desirable to work towards European harmonisation of guidance.
2.1.2 The FloodProBE ‘Geophysics’ Task
A specific task within the FP7-FloodProBE programme was entitled “Rapid, non intrusive geophysical methods for assessing dikes”. It originated from the above problem statement. This task comprised:
Organizing and holding an international workshop on the above mentioned issues
Carrying out geophysical studies and cross-testing on some of the pilot sites provides by FloodProBE partners
Task outputs included reports on the Geophysics Workshop and on the Pilot studies (see references: Palma Lopes et al., 2012; Boukalová et al., 2010; Boukalová et al., 2012; Fauchard et al., 2012). This chapter represents the main task deliverable as a guidance on application to urban areas for managers to implement and integrate geophysical investigation results into the asset support system.
The FloodProBE International Geophysics Workshop (FIGW) was held from March 21st to 23rd, 2011, in Paris, France. It brought together a panel of about twenty attendees including geophysics experts and stakeholders from European and worldwide countries. It provided these experts with space for discussion with the aim of gaining wider international agreement on the applicability and reliability of geophysical methods for the cost-effective investigation of urban flood defence embankment systems. The experts complied with the proposed goals and produced agreed conclusions. A report on the FIGW has been produced and is available for download (see Palma Lopes et al., 2012).
These conclusions together with state-of-the-art, results from recent key research initiatives (e.g. CRITERRE, DEISTRUKT, IMPACT, FLOODsite, GEMSTONE, ERINOH and USACE initiatives e.g. Sabatier, 2010) questionnaires and surveys circulated among the invited experts are the foundation for the present guidance.
In support to the FIGW outputs, known geophysical approaches were validated and method complementarity was also tested on FloodProBE pilot sites (Boukalová et al., 2010; Boukalová et al., 2012; Fauchard et al., 2012).
2.1.3 Scope and objectives of chapter 2
This chapter addresses the geophysical investigations that schematically stand in phase II of the overall dike assessment methodology presented in Chapter 1 and Figure 1.1. It also shows the importance of the interactions with the other phases included in this overall assessment plan.
The scope of the present ‘Geophysics’ guidance (Chapter 2) includes the applicability, reliability and cost-effectiveness of geophysical methods for assessing the condition of embankment dikes and levees in urban areas.
It is important to note here that “urban area” is a context that is critical to geophysics applicability. The present guidance addresses embankment hydraulic structures that protect urban areas. But these structures themselves can actually stand in a variety of situations (from nearly rural to completely inserted in urban environment, see Figure 2.3). Therefore, the impact on method applicability is also very variable and deserves special attention. The main objectives are the following:
To give asset managers more insight into the applicability and reliability of geophysical methods for assessing embankment flood defence systems in urban areas, before using it in practice;
To show asset managers how geophysical investigation is brought to practice and how geophysical results can cost-effectively contribute to an embankment dike condition assessment which in turn contributes to its stability assessment.
2.1.4 How to use this chapter
The core of chapter 2 stands in sections 2.2 to 2.5, each having a specific role and approach:
Section 2.2 addresses issues and concepts from a ‘geophysics’ angle. Depending on their
geophysical background and experience, readers may read it as a whole or just browse it to find answers to a variety of questions (from very general to very specific) such as:
What is (near surface) Geophysics?
What is specific to applying geophysics to embankment dike investigation?
What is specific to geophysics in urban areas?
What are the most recommended geophysical investigation approaches?
Which geophysical methods are applicable to the dike I manage and the requirements I have?
Which geophysical methods are disturbed (outcast) by the urban environment of the dike I manage?
Which geophysical methods are rapid, cost-effective enough for what I need?
Section 2.3 addresses the geophysical investigation process from a ‘stakeholder’ point of view. It is built as a step-by-step approach mimicking the successive steps that make up a
methods are brought to practice and how geophysical investigations are implemented (from the method selection to the data interpretation). It also shows the needed interactions between all condition assessment phases (Figure 1.1) and the corresponding actors (dike manager, geophysics sub-contractor, and geotechnical engineer). Again, depending on their background and experience, asset managers may read the section as a tutorial or simply use it as a reminder check list.
Section 2.4 and section 2.5 present real case studies in order to show how the previously
described approach is implemented. The aim is to provide ‘non-expert’ readers with an example of real geophysical results and interpretation, and to link to the investigation process steps unfolded in section 2.3. The case studies were carried out on the Hull and the Orléans pilot sites within the FloodProBE project.
Section 2.6 presents a general conclusion on the guidance and prospects for the
geophysical approaches applied to embankment dikes in urban areas.
Section 2.7 is an appendix containing technical sheets introducing each of the main
geophysical methods discussed in this guidance. References to well known textbooks are also given for readers wishing to see more detailed information on a specific method (including methods for which no technical sheet is provided here).
2.1.5 Legitimacy
The information and recommendations contained in this chapter have been validated by all contributors to the FIGW (invited experts and other contributors), many of whom represent National practices build on recommendations from key research initiatives from around Europe and abroad.
The present ‘geophysics’ guidance (Chapter 2) is consistent with other guidance and program results such as:
CRITERRE research project (Fauchard and Mériaux, 2007) recommendations;
DEISTRUKT project (RIMAX) recommendations (Weller et al., 2008 ; Niederleithinger et al., 2012);
The outcomes from the following research initiatives (Boukalová and Beneš, 2008): GEMSTONE (E!3658 GEMSTONE: GEophysical Methods for STudying OperatioN of Embankments, EUREKA Program, http://www.vodnizdroje.cz/gemen.htm), IMPACT (IMPACT: Investigation of Extreme Flood Processes & Uncertainty, FP5 project,
http://www.samui.co.uk/impact-project/; Beneš et al., 2005) and FLOODsite (FLOODsite: Integrated Flood Risk Analysis and Management Methodologies, FP6 integrated project, http://www.floodsite.net/html/project_overview.htm);
ERINOH research project (Coll., 2012) guidance book (due for publication end of 2012);
The International Levee Handbook initiative (ILH, Coll., to bee released 2013).
It needs to be emphasized that the legitimacy of the present guidance is only relevant within the scope of the FloodProBE project and at the time of publication. Indeed, it is expected that
research efforts will be focusing on enhancing relevant methodologies and technologies in the near future.
2.2 Geophysical
methods
applied
to
embankment
dike
investigation
2.2.1 A brief introduction to near-surface geophysics
This section is dedicated to introducing some basic principles of near-surface geophysics (practical information, not theoretic) and also a quality questioning that is common to most geophysical fields of application (including dike investigation).
2.2.1.1 Basic principles
Near-surface geophysics provides a variety of methods and technologies to investigate subsoil from the surface. Investigations are non-intrusive, as in medical auscultation and imaging techniques.
Geophysical investigation is based on the interaction between a physical field (e.g. electromagnetic field or mechanical wave propagation field) and the subsurface materials. These interactions are sensitive to material properties (nature and state parameters such as bulk density or moisture content). Therefore, geophysical investigations have shown great potential to inform on subsoil features such as: structure (layering), nature (geology), condition and spatial variations of soil properties. Development and use of temporal approaches for detecting and monitoring time changes has also become a dynamic field of activity.
Fields of application are numerous and have grown from former geophysical prospecting (mining, oil and water prospecting, geology identification) to the smaller scales of environmental, civil engineering and hazard mitigation applications.
A geophysical survey is designed on the basis of available site information and the aims and constraints of the investigation. This process implies the selection of one (or more) geophysical method(s) applicable to the case study. The implementation comprises data acquisition, data processing and interpretation (Figure 2.1).
There are several types of data acquisition techniques (e.g. profiling, sounding, mapping, imaging, monitoring), depending on the investigation goals, the selected method, the equipment used and the required depth of investigation and spatial resolution. For each geophysical method, a number of commercial devices are available (see examples Figure 2.2). Data processing ranges from very basic to very complex, also depending on the selected geophysical method and the purpose of the investigation. Expected geophysical results take the form of graphs, horizontal maps or vertical sections.
The geophysical interpretation requires modelling and result quality assessment (reliability or uncertainty level). The joint interpretation of data from various sources (e.g. combination of geophysical methods with borehole/CPT data, geologic data and/or historical data) usually yields higher reliability results.
Figure 2.1 General scheme of a geophysical investigation process: (a) geophysical data acquisition, (b) geophysical parameter graph, map or cross-section with additional borehole data and (c) subsoil structure model or geotechnical property distribution.
(a) (b)
(c) (d)
Figure 2.2 Geophysical acquisition device examples: (a) Dipole electromagnetic profiling with GEM2 equipment (© METCENAS, G IMPULS PRAHA s.r.o.), (b) Slingram electromagnetic profiling with EM31 device towed on non-metallic cart (© LRPC Saint-Brieuc), (c) GPR profiling with towed antenna (© LRPC Saint-Brieuc) and (d) Electrical Resistivity Tomography (© ERINOH, Ifsttar).
Geophysics
(a) Data acquisition (b) Geophysical result (c) Subsoil model
Data
processing Interpretation
Borehole data
2.2.1.2 A common quality questioning
As for any experimental field, geophysical measurements are sensitive to various internal and external sources of noise. Moreover, geophysical methods are non-intrusive investigation tools (similarly to Non-Destructive Evaluation techniques) and thus they only allow for indirect sub-surface investigation. Furthermore, some interpretation processes (e.g. data inversion) are complex and face ‘equivalence’ problems (non-unique solutions). The combination of data noise with inversion error inevitably leads to some model
uncertainty. This uncertainty can be reduced by calibrating and confirming the geophysical
results by direct investigations acquired in one or more locations (e.g. geotechnical testing, geological data). Nevertheless, a potential risk of error remains. This fact has not always been well explained by geophysicists to geophysics end-users, which in turn has lead to some misunderstanding and disappointment.
This problem relates to the general issue of geophysics quality, which includes geophysics expertise, report quality and transparency. Stakeholder understanding and confidence in geophysics can be significantly improved when the geophysical results reliability is thoroughly assessed and clearly explained to the end-user. Moreover, the most rapid geophysical investigation may not yield the highest resolution and reliability. Therefore, this issue is also a matter of risk/cost compromise.
Recently, there have been national initiatives to improve geophysical result quality and enhance end-users’ understanding and confidence level: e.g. Czech (certification by Ministry of Environment, Czech Republic), French (www.agapqualite.org/) and German certification procedures for geophysics sub-contractors. There are standardization efforts on progress as well, in Europe (e.g. CEN, 2011) and in the USA (e.g. ASTM International, 2011).
2.2.2 Geophysics applied to embankment dike investigation
Application of geophysical methods to the investigation of embankment manmade structures has grown for at least two decades (e.g. Jackson et al., 2002). Nowadays, geophysical techniques are frequently used for assessing and monitoring earth hydraulic structures (e.g.
Fauchard and Mériaux, 2007; Llopis and Simms, 2007; Boukalová and Beneš, 2008; EDF experience in France), and there are numerous recent or on-going research works focusing on the improvement of these applications (e.g. Sjödahl et al., 2006).
Further details on state-of-the art literature and recent and on-going key research initiatives can be found in the FIGW report (Palma Lopes et al., 2012). A broad variety of case studies and research works can also be found within the scientific and technical material submitted and discussed by the geophysics experts attending the FIGW (Coll., 2011), as well as in Sabatier (2010). These sources of information show that there are now numerous geophysical methods successfully applied to embankment dike investigation.
The most commonly used geophysical methods for investigating and monitoring embankment dikes and levees are:
Slingram2 electromagnetic induction (EMI) profiling,
Radio Magnetotelluric (RMT) profiling,
Airborne Electromagnetic (AEM) induction profiling,
Lateral Resistivity profiling (LRP, e.g. Schlumberger Resistivity profiling),
DC-Electrical Resistivity Tomography (ERT),
Ground Penetrating Radar (GPR),
Multichannel Analysis of Surface Waves (MASW),
Seismic Refraction,
Micro-Gravimetry,
Magnetics (e.g. Magnetic profiling),
Self-Potential (SP) techniques,
Thermometry based techniques (e.g. Temperature Sounding method).Most of these methods were discussed in detail during the FIGW (Palma Lopes et al., 2012), except for RMT and AEM that were barely mentioned. A technical sheet can be found in appendix (section 2.7) for each of the geophysical methods that were mainly discussed. Further theoretical and practical information has been widely published (e.g. Telford et al., 1990).
When implementing geophysics, what is specific to investigating an embankment dike or levee? What are the additional constraints, particularly in urban areas?
An embankment is a manmade earth structure generally lying on a natural formation (foundation); the embankment may have a non-homogeneous structure and include reinforcement/repair zones, thus presenting a complex picture to geophysics. Urban earth structures have a key role and safety challenges are huge: asset managers wish geophysical investigation results to be accurately and reliably meet a variety of detection and zoning needs (see Section 2.3.2.1 and Table 2.2).
Traditional geotechnical investigation techniques are accurate but only provide local information whereas asset managers need quick and overall condition assessment; Geophysics offers volume investigation that allows for optimizing geotechnical testing number and location. However, geophysics results are less accurate and require calibration based on geotechnical testing data, and reliability assessment. Therefore
geophysical and geotechnical information are both needed and improve each
other mutually.
2 ‘
Slingram’ techniques mentioned in this guidance are consistent with those defined as ground-based Slingram techniques in the CEN CWA 16373:2011 standard (CEN, 2011). These include single and multi-frequency based devices.
An urban flood protection system is usually a very long linear structure (tens to hundreds of km long) protecting a dense urban area; assessing (or monitoring) a complete asset brings an obvious time/cost challenge: asset managers wish investigation approaches to be cost-effective. This should include balancing assessment budget among complementary investigation options such as geotechnical testing, rapid geophysical investigation, detailed geophysical investigation and repeated geophysical investigation.
The geometry (topography) of a dike has an impact on most geophysical methods as the physical field/subsoil interaction is affected by the surface shape; this needs to be accounted for when implementing and interpreting geophysical investigations of dikes and recent research efforts have been put on this topic.
Also to be accounted for: the load conditions at the time of the geophysical investigations, as the presence of a large volume of water (permanent, periodic or sporadic) next to the embankment may have a significant impact on the geophysical signals.
On the positive side, seasons and varying load conditions lead to time changes of soil properties, which offers the opportunity to implement temporal investigation approaches for detecting and monitoring anomalous time changing zones within an embankment dike. These are potential weak spots for the future; therefore investigation approaches not only need to offer one-time surveys but also temporal
and monitoring techniques, either for detecting weak spots or for implementing long
term surveillance (see section 2.2.3.3).
In urban areas, there is variable amount of anthropogenic structures/activities surrounding the dike (Figure 2.3) (e.g. metallic objects, electric power lines, building encroachment, traffic vibrations, etc.). These features can either disturb geophysical signals, or even simply prevent the use of some geophysical methods.