Distinct Tissue-Specific Roles for the
Disease-Associated Autophagy Genes ATG16L2 and ATG16L1
The MIT Faculty has made this article openly available.
Please share
how this access benefits you. Your story matters.
Citation
Khor, Bernard et al. "Distinct Tissue-Specific Roles for the
Disease-Associated Autophagy Genes ATG16L2 and ATG16L1." Journal of
immunology 203, 7 (August 2019): 1820-1829 © 2019 American
Association of Immunologists
As Published
http://dx.doi.org/10.4049/jimmunol.1800419
Publisher
American Association of Immunologists
Version
Author's final manuscript
Citable link
https://hdl.handle.net/1721.1/128135
Terms of Use
Creative Commons Attribution-Noncommercial-Share Alike
Distinct tissue-specific roles for the disease-associated
autophagy genes ATG16L2 and ATG16L1
Bernard Khor*,†,‡,§,¶, Kara L Conway*,†,‡, Abdifatah S Omar†,‡, Moshe Biton†,‡, Adam L
Haber‡, Noga Rogel‡, Leigh A Baxt†,‡, Jakob Begun*,†,‡, Petric Kuballa†,‡, John D Gagnon‡, Kara G Lassen†,‡, Aviv Regev‡, Ramnik J Xavier*,†,‡,¶
*Gastrointestinal Unit and Center for the Study of Inflammatory Bowel Disease, Massachusetts
General Hospital, Harvard Medical School, Boston, MA 02114, USA.
†Center for Computational and Integrative Biology, Massachusetts General Hospital, Harvard
Medical School, Boston, MA 02114, USA.
‡The Broad Institute of MIT and Harvard, 7 Cambridge Center, Cambridge, MA 02142, USA. §Pathology Service, Massachusetts General Hospital, Boston, MA 02114, USA.
Abstract
The clear role of autophagy in human inflammatory diseases such as Crohn’s disease was first identified by genome-wide association studies and subsequently dissected in multiple mechanistic studies. ATG16L1 has been particularly well studied in knockout and hypomorph settings as well as models recapitulating the Crohn’s disease-associated T300A polymorphism. Interestingly, ATG16L1 has a single homolog, ATG16L2, which is independently implicated in diseases including Crohn’s disease and systemic lupus erythematosus. However, the contribution of ATG16L2 to canonical autophagy pathways and other cellular functions is poorly understood. To better understand its role, we generate and analyze the first, to our knowledge, ATG16L2 knockout mouse. Our results show that ATG16L1 and ATG16L2 contribute very distinctly to autophagy and cellular ontogeny in myeloid, lymphoid and epithelial lineages. Dysregulation of any of these lineages could contribute to complex diseases like Crohn’s disease and systemic lupus
erythematosus, highlighting the value of examining cell-specific effects. We also identify a novel genetic interaction between ATG16L2 and epithelial ATG16L1. These findings are discussed in the context of how these genes may contribute distinctly to human disease.
Keywords
ATG16L2; Autophagy; Colitis; Inflammation; Inflammatory bowel disease
¶Corresponding authors: Bernard Khor, Tel: 206-341-8900, Fax: 206-342-6580, bkhor@benaroyaresearch.org and Ramnik J Xavier,
Tel: 617-726-7411, Fax: 617-724-6832, rxavier@partners.org. Author Contributions:
B.K., K.G.L., A.R. and R.J.X. designed experiments. B.K., K.L.C., A.S.O., L.A.B., J.B., P.K. and J.D.G. performed experiments and data analysis. M.B., A.L.H. and R.N. performed single-cell RNAseq experiments and data analysis. B.K. and R.J.X. wrote the paper.
HHS Public Access
Author manuscript
J Immunol
. Author manuscript; available in PMC 2020 October 01. Published in final edited form as:J Immunol. 2019 October 01; 203(7): 1820–1829. doi:10.4049/jimmunol.1800419.
A
uthor Man
uscr
ipt
A
uthor Man
uscr
ipt
A
uthor Man
uscr
ipt
A
uthor Man
uscr
ipt
Introduction
Autophagy is an evolutionarily conserved process that regulates the degradation of targeted cargo that can range from damaged intracellular components to infectious microbes and is essential for cellular and tissue homeostasis(1). Consistent with the tight conservation of this process, perturbations in autophagy typically have significant consequences across a wide range of cell types and organisms, from yeast to humans(1). The association between autophagy and human diseases, including inflammatory bowel disease, systemic lupus erythematosus and diabetes, critically underscores the clinical relevance of better understanding the mechanistic details of this process(2).
Genomewide association studies previously highlighted a link between autophagy and Crohn’s disease(3). Like many complex inflammatory diseases, the pathophysiology of Crohn’s disease involves patient-specific perturbations in the innate immune, adaptive immune and/or epithelial compartments(4). Thus, understanding the precise role that each susceptibility gene plays in individual cell types is key to both understanding how it contributes to disease risk overall as well as selecting corresponding personalized
therapeutic regimens. Of the 3 autophagy-related genes linked to Crohn’s disease, namely GPR65, IRGM and ATG16L1, the ATG16L1 polymorphism has been of particular interest because it results in a threonine to alanine substitution (T300A)(3, 5). Several previous studies have documented profound effects of either loss or T300A mutation of ATG16L1 in mice and humans(6-9). Murine models have further demonstrated the distinct effect of ATG16L1 loss or T300A mutation in different cell types, including epithelial and immune cells(6, 7, 10, 11). Major effects on granule exocytosis, IL-1β release and mitochondrial homeostasis were characterized in Paneth cells, macrophages and T cells respectively. These findings reinforce the value of understanding cell type-specific effects to holistically understand how individual genes contribute to disease risk.
Another intriguing feature of ATG16L1 is that it has a homolog, ATG16L2, which is present in all mammals but not evolutionarily older organisms(12). Both ATG16L1 and ATG16L2 share the same structural domains and significant amino acid sequence similarity, and both are related to the ancestral yeast ATG16 protein(12). The emergence of ATG16L2 in mammals raises the possibility that it may play novel roles in autophagy and disease. In this regard, several genetic studies have linked ATG16L2 with susceptibility to two auto-inflammatory diseases, Crohn’s disease and systemic lupus erythematosus, in East Asian populations, including Korean, Japanese, and Chinese(13-17). Decreased levels of ATG16L2 have also been linked to multiple sclerosis(18, 19). Thus, ATG16L2 biology appears to be pertinent to human health.
Despite these intriguing genetic links to disease, the function of ATG16L2 remains to be clearly elucidated. Although ATG16L2 is structurally similar to ATG16L1 and is likewise able to form a complex with the autophagy proteins ATG5 and ATG12, overexpression and knockdown studies in MEFs and COS-7 cells suggest that ATG16L2 is not essential for canonical autophagy(12). Conversely, knockdown experiments in mouse pancreatic acinar cells indicate that ATG16L2 may contribute to canonical autophagy and cellular
homeostasis, raising the possibility of cell-specific effects(20). Potential factors confounding
A
uthor Man
uscr
ipt
A
uthor Man
uscr
ipt
A
uthor Man
uscr
ipt
A
uthor Man
uscr
ipt
definitive interpretation of these results include residual expression in knockdown
experiments and idiosyncrasies of each experimental system. Whether ATG16L2 modulates ATG16L1 function in some subtler manner or exerts a non-canonical autophagy function, and what cell types such functions might be relevant in, remains unclear. Elucidating these functions will provide critical insights into inflammatory disease pathobiology.
To date, how ATG16L2 might contribute to pathophysiology of Crohn’s disease remains unknown. In order to address this issue, we generated mice deficient in ATG16L2 to enable studies of physiologically relevant cell types and contexts. To our knowledge, this is the first report of ATG16L2-knockout mice. In particular, we examine here the consequences of ATG16L2 loss on the development and function of innate immune, adaptive immune and intestinal epithelial cells.
Materials and Methods
Mice.The murine Atg16l2 gene encodes a 627 amino-acid protein spanning ~13 kb. We deleted the entire Atg16l2 gene in one targeting step. The pATG16L2loxP.Neo targeting vector was used to replace a 13 kb region containing the entire ATG16L2 coding sequence, from about 300 bp upstream of the Atg16l2 start codon to about 700 bp downstream of the stop codon, with a loxP-flanked neomycin resistance gene (Fig 1A). pATG16L2loxP.Neo was generated by cloning the 5’ homology arm (7.8-kb KpnI-PacI fragment from a PCR product generated with 5’ATG16L2–166UK [AAGGTACCCAGGCACAAGCAGTCTAAGAG] and
5’ATG16L2–8517N [AAAAGCGGCCGCCGCTGTGCTTTGCCCTAGTA]) and the 3’ homology arm (3.9-kb KpnI-HindIII fragment from a PCR product generated with 3’ATG16L2–4815U [GGTGGGTCTTGTTTTTTTGC] and 3’ATG16L2–12
[CACTCCCCTAGACTTGTCC]) into pDT.aPA, a kind gift from Dr. Brian Seed. The 5’ and 3’ arms were checked by sequencing. Embryonic stem cells were generated from B6/129 F1 mice, cultured and targeted as previously described(21) (ingenious targeting laboratory, NY). Mice germline for the Atg16l2loxP.Neo allele were generated by standard targeting strategies(21) (ingenious targeting laboratory, NY). The Atg16l2Δ allele was derived by breeding Atg16l2loxP.Neo/+ mice to mice expressing the Cre recombinase under a CMV promoter (Stock #6054, Jackson Labs, ME). The Atg16l2Δ allele was bred onto the B6 background using speed congenics (Charles River, WA). The Atg16l1T300A and Atg16l1CKO (conditional knockout) alleles have been previously reported(7). Mice harboring the
Atg16l1CKO allele were crossed to mice expressing the Cre recombinase under the control of the CD11c, Lck and villin promoters as indicated (Jackson Labs, ME). Animals were used at 6–10 wks of age and age- and sex-matched for independent experiments. Animals were housed in a pathogen-free facility, and all procedures were performed in accordance with the institutional animal care and use committee at Massachusetts General Hospital.
Southern blot analyses.
Genomic DNA was isolated and prepared for Southern blot analyses as previously described(21). Briefly, DNA was digested with EcoRV (New England Biolabs, MA), separated by agarose electrophoresis and transferred onto Zetaprobe membrane (Bio-rad,
A
uthor Man
uscr
ipt
A
uthor Man
uscr
ipt
A
uthor Man
uscr
ipt
A
uthor Man
uscr
ipt
CA). PCR was used to generate probe A (5’ATG16L2–8517U [TACTAGGGCAAAGCACAGCG] and 5’ATG16L2–9513
[TCGGTCTACACTGTTCTTTTTTTC]) and probe B (3’ATG16L2–5991U [GAAGGGATTTTCAGTCATTTGAT] and 3’ATG16L2–4815
[GCAAAAAAACAAGACCCACC]). Probe N was a kind gift from Dr. Barry Sleckman. Probes were labeled by random hexamer priming (Roche, IN) using [α−32P]dCTP.
Western blot analyses.
Cell extracts were prepared using standard lysis buffer (100 mM Tris-HCl, 100 mM NaCl, 1% NP-40, 1 mM DTT, 10 mM NaF, 0.5 mM Na3VO4) with protease inhibitor (Roche, IN) and separated by sodium dodecyl sulfate-polyacrylamide gel electrophoresis (Bio-rad, CA). Proteins were transferred onto PVDF membranes (Immobilon-P, Millipore, MA) and visualized using antibodies against LC3 (L7543, Sigma Aldrich), p62 (03-GP62-C, American Research Products) and actin (A2066, Sigma Aldrich, MO) with the appropriate secondary reagents goat rabbit HRP (P0448, Dako, CA) [actin, LC3] or rabbit anti-guinea pig HRP (P0141, Dako, CA) [p62].
Cell culture.
MEFs were generated as previously described. Briefly, dams from Atg16l2+/Δ x Atg16l2+/Δ mating pairs were euthanized at 13 days post-coitus. Embryonic body tissue was trypsinized and expanded for at least 2 weeks; an aliquot was genotyped to obtain at least 3 matching sets of Atg16l2+/+ and Atg16l2Δ/Δ MEFs; data from all MEFs showed similar data within each genotype. Bone-marrow–derived dendritic cells (BMDCs) were generated by culturing bone marrow stem cells in complete RMPI containing 37.5 ng/mL GM-CSF (315–03, Peprotech, NJ) for 7d and analyzed for >90% CD11c+ by flow cytometry before experimental use. Splenic B and T cells and bone marrow neutrophils were isolated by negative selection using magnetic cell sorting (130–090-862, 130–095-130, 130–097-658, Miltenyi Biotec, CA). Splenic macrophages were isolated by CD11b positive selection (130–049-601, Miltenyi Biotec, CA). Splenic macrophages were cultured at 106 cells/ml, treated with 100 ng/ml IFNγ and additionally stimulated with 2 ng/mL LPS and 10 μg/mL MDP as indicated; supernatants were collected 24 hours later. All cells were maintained in 37°C and 5% CO2.
Antibacterial autophagy assays.
Assays were performed as previously described(22). For S. Typhimurium experiments, S. enterica serovar Typhimurium SL1344 carrying a DsRed2 expression plasmid was grown overnight in Luria-Bertani broth (LB) containing 100 μg/mL ampicillin at 37°C, subcultured 1:33 for a further 3 h and added to HeLa-LC3-GFP cells previously plated onto coverslips at a multiplicity of infection (MOI) of 100. At 1 hour after infection, cells were fixed in 2% (wt/vol) paraformaldehyde overnight and stained with Hoechst to visualize nuclei. For Listeria experiments, Listeria cultures were grown overnight in brain heart infusion broth (BHI) at 37°C, subcultured 1:50 in BHI and grown to OD600 of 0.4. Primary splenic
macrophages were infected at an MOI of 2–10 for 30 min, cells washed and fixed in methanol at 1 h post infection and stained with an antibody against LC3 (APG8C, Sigma Aldrich, MO). Counting was performed using wide-field fluorescence illumination with a
A
uthor Man
uscr
ipt
A
uthor Man
uscr
ipt
A
uthor Man
uscr
ipt
A
uthor Man
uscr
ipt
100X lens (Zeiss Axioplan2; Carl Zeiss MicroImaging). Randomly chosen fields were assessed for LC3-GFP-positive bacteria with at least 75 cells on three different coverslips counted for each condition.
Enzyme-linked immunosorbent assays.
IL-1β and IL-2 were detected by sandwich ELISA per manufacturer’s protocol (559603, BD Biosciences). TNP-specific antibody was measured using EIA high-binding plates (3590, Corning) coated with 10 μg/mL TNP-BSA (T-5050, Biosearch Technologies) and subsequent detection using HRP-conjugated streptavidin and BD OptEIA substrate kit (555214, BD Biosciences). Quantitation was based on absorbance at 450 nm, read on a SpectraMax M5 micro-plate reader (Molecular Devices). Samples were run in triplicate.
Whole blood characterization and flow cytometry.
Peripheral blood was collected by facial vein bleed into EDTA Microtainer tubes (BD Biosciences, NJ) and CBC performed on a Heska Hematrue (Heska, CO). Flow cytometry was acquired on a FACSVerse (BD Biosciences, NJ) and analyzed using Flowjo (Flowjo, OR). Cell sorting was performed on an Astrios (Beckman Coulter). Antibodies were used from (1) BioXCell: Fc block (2.4G2), and (2) eBioscience: B220-APC-Cy7 (RA3–6B2), CD11c-APC (N418), CD138-PE-Cy7 (DL-101), CD19-APC (1D3), CD19-PE-Cy7 (1D3), CD21-FITC (4E3), CD23-PE (B3B4), CD25-APC (PC61.5), CD3-FITC (145–2C11), CD4-PE-Cy7 (RM4–5), CD43-APC (R2/60), CD44-PE (IM7), CD45.1-PE (A20), CD45.2-APC (104), CD5-APC (53–7.3), CD62L-APC (MEL-14), CD8-APC-Cy7 (53–6.7), CD8-FITC (53–6.7), Foxp3-PE (FJK-16s), IFNγ-APC (XMG1.2), IgD-FITC (11–26c), IgM-PE (eB121–15F9), IL-17-APC (eBio1787), NK1.1-PB (PK136). Cell viability assessed using fixable Live/Dead Aqua dye (Invitrogen). Flow cytometry for LC3 was performed per manufacturer’s instructions (FlowCellect, Millipore).
Bone marrow chimeras.
Bone marrow was harvested from CD45.1+CD45.2+ wildtype mice and
CD45.2+ATG16L2Δ/Δ mice and treated with RBC lysis buffer (eBioscience). Hematopoietic stem cells were mixed at 1:1 ratio and injected into irradiated (12 Gy) CD45.1+ hosts (5×10⁵ cells/mouse). Hosts were euthanized and tissues harvested for analysis 10 – 12 weeks after irradiation.
T cell functional assays.
Naïve CD4+CD62L+ T cells were purified by magnetic cell sorting (130–104-453, Miltenyi Biotec, CA). To assess proliferation, cells were labeled with CFSE (Celltrace, Thermo Fisher) and stimulated with anti-CD3/anti-CD28 Dynabeads (Thermo Fisher) at a 1:4 bead:cell ratio. Cells were analyzed by flow cytometry 2 and 3 days after stimulation, and percentage of proliferating CFSElow cells noted. T cell differentiation was performed as previously reported(23). Briefly, CD4+CD62L+ T cells were stimulated on plates pre-coated with anti-CD3 and anti-CD28 (145–2C11 and 37.51, BioXCell, NH) in polarizing media as follows - Th17: anti-IL4, -IL12 and -IFNγ (11B11, C17.8 and XMG1.2, 2 μg/ml, BioXCell, NH) with TGFβ, IL-6 and IL-1β (Peprotech, NJ) and 0.5, 20 and 20 ng/ml respectively;
A
uthor Man
uscr
ipt
A
uthor Man
uscr
ipt
A
uthor Man
uscr
ipt
A
uthor Man
uscr
ipt
Treg: anti-IL4, -IL12 and -IFNγ with 10 ng/ml TGFβ; Th1: anti-IL4 with 1 ng/ml IL-12. Cells were fed, split and analyzed 2, 3 and 4 days after stimulation, respectively. Prior to analysis, cells were restimulated using 50 ng/ml PMA and 500 ng/ml ionomycin (Sigma Aldrich, MO) with Golgistop (BD Biosciences, NJ). For IL-2 studies, no polarizing cytokines were added and supernatant was harvested after 24 hours of stimulation.
Immunization studies.
To assess T cell-independent response, 50 μg TNP- Ficoll (F-1300, Biosearch Technologies), a Type 2 TI antigen, in 200 μL of PBS was injected intra-peritoneally (i.p.). Serum anti-TNP antibody levels were measured 7 and 14 d post-immunization. To assess T cell-dependent response, 100 μg TNP-chicken gamma globulin (CGG) (T-5052, Biosearch Technologies) was mixed with 100 μL of Imject alum (77161, Pierce Biotechnology) in PBS, and a total volume of 200 μL was injected i.p. with an identical booster i.p. injection on day 14. Serum was harvested and anti-TNP antibody quantitated by ELISA.
Citrobacter model.
C. rodentium were grown overnight at 37°C in LB with 100 μg/ml nalidixic acid, resuspended in PBS at 2×10¹⁰ colony-forming units (CFUs) per mL and administered by oral gavage at 0.1 mL per mouse. At indicated time points, fecal pellets were weighed, homogenized, serially diluted, and plated onto LB agar containing nalidixic acid. Distal colon tissue was harvested and stored in RNAlater (Ambion) for cytokine analysis.
Real-time Quantitative PCR.
Cecum and terminal ileum tissue was harvested and stored in RNAlater (Ambion). RNA was extracted from homogenized tissues using the RNeasy kit (Qiagen) and cDNA synthesized using iScript cDNA Synthesis kit (Bio-Rad). Quantitative PCR was performed using iQ SYBR Green Supermix (Bio-Rad) on an iCycler with iQ5 Multicolor Real-Time PCR Detection System (Bio-Rad). Reaction conditions comprised 37 cycles of PCR with annealing temperature of 59°C. The threshold cycle (CT) for each sample was determined for each gene and normalized to the CT value of the endogenous housekeeping gene GAPDH. Data were calculated using the 2-∆∆CT method(24). The following primers were
used: IFNγ Fwd: ATGAACGCTACACACTGCATC, IFNγ Rev:
CCATCCTTTTGCCAGTTCCTC; IL-1β Fwd: GCCCATCCTCTGTGACTCAT, IL-1β
Rev: AGGCCACAGGTATTTTGTCG; IL-4 Fwd: GGCATTTTGAACGAGGTCAC, IL-4 Rev: GCATGGAGTTTTCCCATGTT; IL-6 Fwd: GTAGCTATGGTACTCCAGAAGAC, IL-6 Rev: ACGATGATGCACTTGCAGAA; TNFα Fwd:
GACGTGGAACTGGCAGAAGAG, TNFα Rev: TTGGTGGTTTGTGAGTGTGAG.
Crypt isolation and single cell sorting.
Crypts were isolated from whole small intestine. Tissue was rinsed in cold PBS, opened longitudinally, sliced into ~2 mm fragments and incubated in 20 mM EDTA-PBS on ice for 90 min, shaking every 30 min. Tissue was then shaken vigorously and supernatant was collected as fraction 1 in a new conical tube. Remaining tissue was incubated in fresh EDTA-PBS and a new fraction was collected q30 min until the supernatant consisted almost
A
uthor Man
uscr
ipt
A
uthor Man
uscr
ipt
A
uthor Man
uscr
ipt
A
uthor Man
uscr
ipt
entirely of crypts. The final crypt-enriched fraction was washed twice in PBS, centrifuged at 300g for 3 min, and dissociated with TrypLE Express (Invitrogen) for 1 min at 37ºC. The single cell suspension was filtered (40 μm), stained and single cells sorted into each well of a 96-well PCR plate containing 5 μl of TCL buffer with 1% 2-mercaptoethanol (2-ME, Sigma Aldrich). The cells were stained for 7AAD− (Life Technologies), CD45− (eBioscience), CD31− (eBioscience), Ter119− (eBioscience), EpCAM+ (eBioscience), and for specific epithelial cells were also stained for CD24+/− (eBioscience) and c-Kit+/− (eBioscience). A population control of 200 cells and a no-cell control were included in separate wells. The plate was sealed tightly (Microseal F, Fisher), centrifuged at 800g for 1 min and snap-frozen on dry ice and kept at −80ºC until lysate cleanup. Bulk population cells were processed in parallel in 100 μl TCL with 1% 2-ME.
Plate-based scRNA-seq.
Libraries were prepared using a modified SMART-Seq2 protocol as previously reported(25). Briefly, RNA lysate cleanup was performed using RNAClean XP beads (Agencourt), followed by reverse transcription with Maxima Reverse Transcriptase (Life Technologies) and whole transcription amplification (WTA) with KAPA HotStart HIFI 2× ReadyMix (Kapa Biosystems) x21 cycles. WTA products were purified with Ampure XP beads (Beckman Coulter), quantified with Qubit dsDNA HS Assay Kit (ThermoFisher), and assessed with a high sensitivity DNA chip (Agilent). RNA-seq libraries were constructed from purified WTA products using Nextera XT DNA Library Preparation Kit (Illumina). On each plate, the population and no-cell controls were processed using the same method as the single cells. Libraries were sequenced on an Illumina NextSeq 500. Data was deposited into the Gene Expression Omnibus repository (https://www.ncbi.nlm.nih.gov/geo/query/acc.cgi? acc=GSE134226). Wildtype scRNAseq data is posted in GSE106510 and ATG16L2-knockout data is posted in GSE134226.
Plate-based scRNA-seq data pre-processing.
BAM files were converted to merged, de-multiplexed FASTQs using the Illumina provided Bcl2Fastq software package v2.17.1.14. Paired-end reads were mapped to the UCSC mm10 mouse transcriptome using Bowtie with parameters “-q --phred33-quals -n 1 -e 99999999 -l 25 -I 1 -X 2000 -a -m 15 -S -p 6”, which allows alignment of sequences with one mismatch. Expression levels of genes were quantified as transcript-per-million (TPM) values calculated by RSEM v1.2.3 in paired-end mode. For each cell, we quantified the number of genes for which at least one read was mapped, and then excluded all cells with either fewer than 3,000 detected genes or a transcriptome-mapping rate of <40%. Selection of variable genes was performed by fitting a generalized linear model to the relationship between the squared coefficient of variation (CV) and the mean expression level in log/log space, and selecting genes that significantly deviated (p<0.05) from the fitted curve, as previously described(26).
tSNE visualization.
For visualization purposes only (and not for clustering), dimensionality was further reduced using the Barnes-Hut approximate version of the t-distributed stochastic neighbor
embedding (tSNE). This was implemented using the ‘Rtsne’ function from the ‘Rtsne’ R package using 20,000 iterations and a perplexity setting that ranged from 10 to 30 depending
A
uthor Man
uscr
ipt
A
uthor Man
uscr
ipt
A
uthor Man
uscr
ipt
A
uthor Man
uscr
ipt
on the size of the dataset. Scores from the first n PCs were used as the input to tSNE, where n was determined for each dataset using the permutation test.
k-NN graph based clustering.
To cluster single cells by their expression profiles, we used unsupervised clustering, based on the Infomap graph-clustering algorithm, following approaches recently described for single cell CyTOF data and scRNA-seq(27). Briefly, we constructed a k nearest-neighbor (k-NN) graph on the data using as the metric for each pair of cells, the distance between the scores of significant PCs. The parameter k was chosen in a manner roughly consistent with the size of the dataset. The k-NN graph was computed using the function ‘nng’ from the R package ‘cccd’ and was then used as the input to Infomap, implemented using the
‘infomap.community’ function from the ‘igraph’ R package. Detected clusters were
annotated by cell types or states using known markers for IEC subtypes(28). Specifically, for each known epithelial type we selected five canonical marker genes (e.g., Lgr5, Ascl2, Slc12a2, Axin2 and Olfm4 for stem cells, or Lyz1, Defa17, Defa22, Defa24 and Ang4 for Paneth cells), and scored all clusters for their expression.
Histology.
To visualize Paneth cells, sections of mouse intestine were deparaffinized and antigen retrieval performed with Target Retrieval solution (Dako North America Inc, Carpinteria, CA) in a pressure cooker for 30 minutes. Slides were stained with rabbit anti-lysozyme (Dako) at 1:1000 in a humid chamber overnight and visualized with Alexa 488-conjugated secondary antibody. TUNEL staining was performed by Servicebio (Woburn, MA). Paneth cells were independently enumerated (≥ 35 crypts/mouse, ≥ 3 mice per genotype) by 2 blinded observers with similar results.
Results
Generating and characterizing Atg16l2-knockout mice
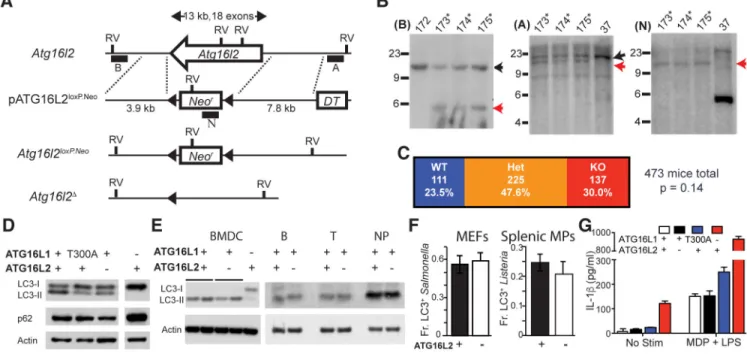
We generated knockout mice deficient in ATG16L2 to enable gold standard studies in vivo and in primary cells. We designed a targeting strategy that specifically excised all coding exons of Atg16l2, preventing potential confounding contributions from partial protein fragments (Fig. 1A). Appropriate targeting and Cre-mediated excision of the neomycin selection cassette was verified by Southern blot analysis, PCR and sequencing (Fig. 1B). Breeding of Atg16l2+/− heterozygous pairs showed that Atg16l2−/− offspring are viable and born at Mendelian proportions (Fig. 1C). The non-requirement of ATG16L2 for embryonic or perinatal viability allowed us to examine the role of ATG16L2 in a wide range of cell types. Given ATG16L2’s homology to ATG16L1 and ability to bind to proteins known to be essential for autophagy, we first examined processes typically perturbed by defects in canonical autophagy in relevant cell types.
Impaired autophagy typically results in accumulation of p62 and the LC3-I isoform. We generated 3 independent lines each of ATG16L2-sufficient (Atg16l2+/+) and -deficient (Atg16l2−/−) MEFs from Atg16l2+/− heterozygous matings. While western blot analyses of previously generated MEF lines with perturbed ATG16L1 (Atg16l1T300A/A and Atg16l1−/−)
A
uthor Man
uscr
ipt
A
uthor Man
uscr
ipt
A
uthor Man
uscr
ipt
A
uthor Man
uscr
ipt
showed accumulation of p62 and LC3-I as previously demonstrated, MEF lines deficient in ATG16L2 did not (representative data in Fig. 1D). A similar lack of LC3-I accumulation was seen in various ATG16L2-deficient cells of hematopoietic origin, including bone-marrow-derived dendritic cells, as well as sorted primary B cells, T cells and neutrophils (Fig. 1E).
Additionally, Crohn’s disease is associated with defects in selective autophagy, which frequently require stimulation to reveal(7). In this context, we examined the role of ATG16L2 in antibacterial autophagy. Testing of ATG16L2-deficient MEFs and primary splenic macrophages showed no significant defect in antibacterial autophagy in either cell type (Fig. 1F). Finally, we examined IL-1β secretion in primary splenic macrophages. Whereas mutations in or loss of ATG16L1 led to elevated IL-1β secretion as previously reported, loss of ATG16L2 had no appreciable effect (Fig. 1G). Taken together, these data demonstrate across multiple cell types and readouts that ATG16L2, unlike ATG16L1, is not a requisite member of the canonical autophagy pathway in MEFs or primary innate and adaptive immune cells.
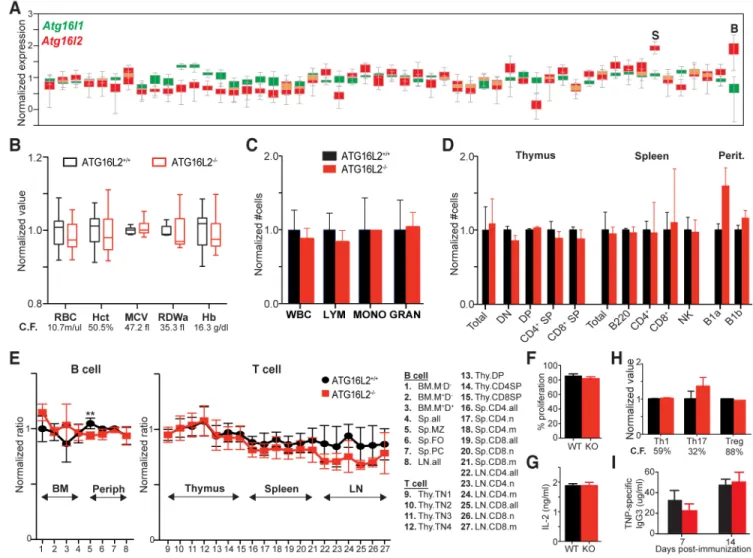
Analysis of ATG16L1 and ATG16L2 expression patterns across different tissues deposited in the GTEX portal showed significantly higher relative expression of ATG16L2 in blood and spleen, raising particular interest in the role of ATG16L2 in the development and function of hematopoietic cells (Fig. 2A). In particular, studies of several genes have linked autophagy to erythropoiesis. Interestingly, some of these genes are essential for autophagy (e.g. Atg7) while others are not (e.g. Ulk1, Nix) (29-32). In contrast to the latter group, loss of ATG16L2 resulted in no detectable perturbations across a spectrum of RBC-related parameters, arguing against a defect in erythropoiesis (Fig. 2B) (31, 32). Similarly, no appreciable defects were seen in the peripheral myeloid compartments, demonstrating the absence of both developmental and functional defects in innate immune cells (Fig. 2C, 1F and 1G).
Most essential autophagy genes, including ATG16L1, play important roles in the development and function of B and T lymphocytes, leading us to characterize these processes closely in ATG16L2-deficient mice(33-35). Analysis of littermates across different ages showed no overt defects in T cell subsets in the thymus or in the periphery (Fig. 2D). Similarly, no defect in B cell populations was seen, even in the natural B1a and B1b populations, which are reported to be particularly sensitive to autophagy defects (Fig. 2D)(33). Analyses of B cell development in bone marrow also showed no differences. Because homeostatic forces can sometimes mask the effect of smaller but important contributions, we generated mixed bone marrow chimeras using CD45.1-congenic hematopoietic stem cells mixed with either Atg16l2+/+ or Atg16l2−/− hematopoietic stem cells expressing the CD45.2 congenic marker into either immune-sufficient or Rag−/− hosts with similar results. This much more sensitive method shows equivalent contribution of both congenic markers up to the point in development at which the gene of interest plays a significant role, with differences appearing in that population and its descendants. Aside from a statistically significant (q<0.01) decrease in marginal zone splenic B cells, our results failed to identify any stage in T- or B-cell development in which ATG16L2 played an essential role (Fig. 2E).
A
uthor Man
uscr
ipt
A
uthor Man
uscr
ipt
A
uthor Man
uscr
ipt
A
uthor Man
uscr
ipt
Finally, we interrogated several fundamental parameters of T- and B-cell function. We assessed T cell response to anti-CD3/anti-CD28 stimulation, examining both proliferation as well as IL-2 production (Fig. 2F and 2G). We also investigated in vitro differentiation of naïve CD4+ T cells to both pro-inflammatory (Th1, Th17) and anti-inflammatory (Treg)
lineages (Fig. 2H). Finally, we assessed intrinsic B cell function by measuring antibody production to a T-independent antigen (Fig. 2I). Across these different studies, we did not uncover a significant role for ATG16L2 in T- and B-cell function.
Taken together, these data indicate that ATG16L2 is not a requisite component either for canonical autophagy or for development and function of major hematopoietic subsets. One leading hypothesis for this observation might be that ATG16L2 loss is compensated for by ATG16L1. To test this notion, we generated mice doubly deficient for ATG16L1 and ATG16L2. Because loss of ATG16L1 is embryonic lethal, we used the ATG16L1
conditional knockout in conjunction with Lck-Cre, which deletes early in T-cell ontogeny. We designed breeding pairs to generate littermates to determine if loss of ATG16L2 exacerbates the ATG16L1 phenotype in the T-cell lineage.
Dissecting the contributions of ATG16L1 and ATG16L2 to T cell development and function
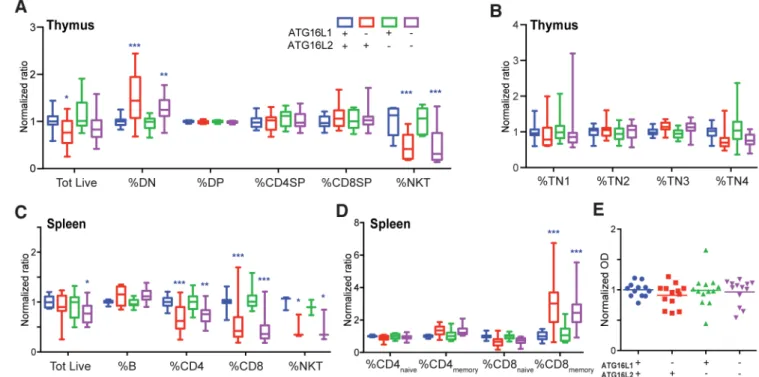
As expected from deletion of other genes essential for canonical autophagy, loss of ATG16L1 perturbs thymic development(34). This defect is most pronounced in the NKT lineage, consistent with recent reports examining other canonical autophagy genes (Fig. 3A) (36). However, loss of ATG16L1 also results in modestly decreased thymic cellularity and slightly increased proportion of CD4−CD8− double-negative (DN) cells, with proportions of CD4- and CD8- double-positive and single-positive cells largely unchanged (Fig 3A). Previous reports have identified CD4−CD8−CD3+ cells as pro-inflammatory cells increased in the peripheral blood of patients with systemic lupus erythematosus; we find that the increase in the DN compartment of ATG16L1-deficient mice is due to increased CD3−CD4−CD8− triple negative (TN) thymic progenitors rather than CD4−CD8−CD3+ mature T cells (Supplemental Fig. 1A) (37, 38). Close examination of the CD3−CD4−CD8− triple negative (TN) compartment suggests a subtotal TN3-TN4 block with ATG16L1 loss (Fig. 3B). Consistent with our results above, loss of only ATG16L2 does not perturb any of these populations, compared to wildtype littermates (Fig. 3A and 3B). Importantly,
additional loss of ATG16L2 does not exacerbate the ATG16L1 phenotype (Fig. 3A and 3B). Furthermore, western blot analyses of T cells doubly deficient in ATG16L1 and ATG16L2 also show no exacerbation of LC3-I accumulation compared to ATG16L1-deficient T cells (Supplemental Fig. 1B).
Similar results were observed in the periphery. Splenic cellularity trended lower with loss of ATG16L1, due to decreases in NKT, CD4+ and CD8+ T cell populations, and a
corresponding relative increase in B cell proportion (Fig. 3C). Within both CD4+ and CD8+ T cells, loss of ATG16L1 also resulted in a shift from naïve CD62L+ to memory CD44+ cells (Fig. 3D). Lupus-associated CD4−CD8−CD3+ cells trended towards a slight, not statistically significant, increase with loss of ATG16L1 (Supplemental Fig. 1C). Flow cytometry revealed increased LC3, consistent with impaired autophagy, in NKT and T cells deficient for ATG16L1 (Supplemental Fig. 1D). Additional loss of ATG16L2 did not
A
uthor Man
uscr
ipt
A
uthor Man
uscr
ipt
A
uthor Man
uscr
ipt
A
uthor Man
uscr
ipt
exacerbate any of these phenotypes; only splenic cellularity showed a statistically insignificant downward trend in the double knockouts (Fig. 3B and 3C and Supplemental Fig. 1C). Finally, we assessed B/T interactions by immunizing with a T-dependent antigen. Loss of ATG16L1 and/or ATG16L2 did not affect the ability to generate antibodies in these experiments (Fig. 3E). Taken together, these results argue against the notion that ATG16L2 exerts functions redundant to ATG16L1 in T cells.
Dissecting the contributions of ATG16L1 and ATG16L2 to intestinal epithelial development and function
Finally, we examined a possible role for ATG16L2 in epithelial cell function with particular emphasis on the gastrointestinal tract given the genetic linkage to Crohn’s disease. In order to assess for functional deficits, we examined the response in a model of infectious colitis with Citrobacter rodentium, in which ATG16L1 has previously been shown to play a role(8). Similar to our approach in analyzing T cells, we generated mice deficient in epithelial ATG16L1 by breeding the Atg16l1 conditional knockout to villin-cre. Again, we used littermates to examine the effect of ATG16L2 loss, either in the presence or absence of epithelial ATG16L1.
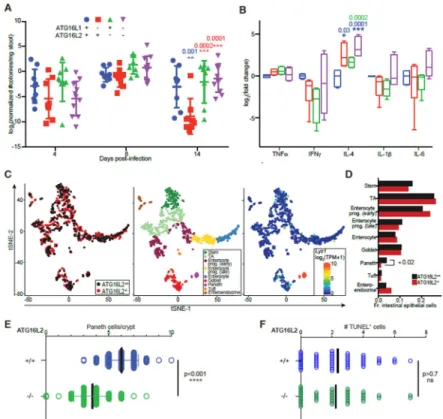
Similar to previous reports using a hypomorphic allele of Atg16l1, loss of epithelial ATG16L1 in our hands confers resistance to C. rodentium infection (Fig. 4A)(8). Loss of ATG16L2 alone has no effect on susceptibility to infection in this model (Fig. 4A). However, loss of both ATG16L1 and ATG16L2 consistently reverses the resistance conferred by loss of ATG16L1 alone (Fig. 4A). Our interrogation of inflammation-associated cytokines revealed that loss of ATG16L1 and/or ATG16L2 resulted in elevated IL-4 and decreased IFNγ and no statistically significant differences in IL-6 and IL-1β, consistent with a Th1/Th2 imbalance (Fig. 4B). However, no statistical significant differences were found between loss of ATG16L1 with and without loss of ATG16L2 to explain the phenotypic difference observed. Flow cytometric analyses of cells isolated from the lamina propria of infected mice identified IFNγ+ cells; staining for IL-4 was equivocal (Supplemental Fig. 2 and data not shown). Mice lacking epithelial ATG16L1 tend to exhibit fewer IFNγ-expressing CD4+ T cells, this trend appears to be reversed by concomitant loss of ATG16L2 (Supplemental Fig. 2). Similar patterns are not observed in CD11c+, NKT, CD8+ or CD4−CD8− T cells. Together with the results from C. rodentium studies, this suggests that modulation of IFNγ-expression in CD4+ T cells by ATG16L2 and epithelial ATG16L1 may particularly contribute to control of intestinal pathogens. The identity of the majority of IFNγ-expressing cells remains to be clarified, pointing to the value of further characterization (Supplemental Fig. 2). These results suggest that perturbation of ATG16L1 and/or ATG16L2 in epithelial cells might alter immune responses to infection, but additional factors likely impact response to infection. To interrogate the potential contribution of epithelial cell-intrinsic defects, we performed single-cell RNAseq on wildtype and ATG16L2-deficient intestinal epithelial cells. These studies found that loss of ATG16L2 altered the cellular architecture of the intestinal epithelium (Fig. 4C and 4D). Most notably, ATG16L2-deficient intestinal epithelium exhibited a statistically significant decrease in Paneth cells with trends towards increased early progenitors in enterocyte and
enteroendocrine populations (Fig. 4D). Consistent with these findings, independent
A
uthor Man
uscr
ipt
A
uthor Man
uscr
ipt
A
uthor Man
uscr
ipt
A
uthor Man
uscr
ipt
histological analyses demonstrate decreased Paneth cells in ATG16L2-deficient mice (Fig. 4E). We did not observe any differences in TUNEL staining, arguing against increased Paneth cell apoptosis in ATG16L2-deficient mice (Fig. 4F). Taken together, these data suggest that ATG16L1 and ATG16L2 play distinct, physiologically relevant roles in
intestinal epithelial cell biology. Further experiments will better define the relevant pathways in normal homeostasis as well as in disease.
Discussion
The realization that autophagy plays an important role in many human diseases, ranging from cancer to auto-inflammatory disease, has concretized the importance of understanding the mechanistic underpinnings of this process. In particular example, observations that Crohn’s disease and systemic lupus erythematosus share some clinical features, including inflammation in multiple overlapping organ systems, and genetic associations support the notion of shared pathophysiological pathways in at least a subset of patients(13-16, 39, 40). Studies suggesting efficacy of the autophagy-enhancing mTOR inhibitor sirolimus in both diseases further support the clinical relevance of dissecting the role of individual autophagy components to develop novel therapeutics and identify patient subsets who might benefit most(37, 38, 41, 42). Another dimension to this effort has been added with the evolving understanding that autophagy itself is not a single, uniform pathway that functions identically in all cell types, suggesting that novel functional contributions of autophagy genes remain to be uncovered(43). In the context of autophagy and human disease, ATG16L1 has long been of interest and the development of a murine model of the human T300A polymorphism has propelled the ability to interrogate how perturbations in different cell types might contribute to disease(6, 7). ATG16L2 is emerging as a gene of great interest in its own right, as a close homolog of ATG16L1 that arose in mammals, and itself
independently linked to human inflammatory disease(12-17). Despite this interest, extremely little is understood about ATG16L2 biology and conflicting understandings have arisen from prior studies, which could potentially be attributed to the limitations of pre-existing tools. By generating and characterizing a complete knockout of ATG16L2 in mice for the first time to our knowledge, our results contribute critically to a precise understanding of ATG16L2 biology.
Several of our findings support and extend those of Ishibashi et al, whose results suggest that ATG16L2 is not required for basal autophagy, at least in MEFs(12). Our ATG16L2-deficient mice allow us to address limitations in previous studies relating to subtotal knockdown (e.g. with standard knockdown approaches) or effects specific to immortalized cell lines. Not only do we find no biochemical evidence of gross perturbations in canonical autophagy in a variety of ATG16L2-deficient primary cells, the viability of ATG16L2-deficient mice is also not characteristic of other genes essential for canonical autophagy.
The inflammatory diseases with which ATG16L1 and ATG16L2 are associated exemplify the contemporary understanding that such diseases can involve dysregulated interactions with innate immune, adaptive immune, epithelial and/or microbiome components. Thus, it is critical to understand the role of a protein not only in the context of a pathway, but also in specific cellular contexts. Given the relative higher expression in blood and spleen, we
A
uthor Man
uscr
ipt
A
uthor Man
uscr
ipt
A
uthor Man
uscr
ipt
A
uthor Man
uscr
ipt
assessed numerous parameters of development and function in the innate and adaptive immune compartments. While we were unable to identify any significant defects associated with loss of ATG16L2, our results do not preclude the possibility that ATG16L2 may contribute in these compartments in subtler but nonetheless physiologically important ways. In the setting of pathogen defense, our results use a different system to recapitulate and extend previous findings that an ATG16L1 hypomorph confers resistance to C. rodentium infection and demonstrate a role for ATG16L1 in epithelial cells, in addition to the reported role in monocytes(8). Interestingly, loss of epithelial ATG16L1 confers susceptibility to S. typhimurium infection, pointing to an unusual example of a genetic defect differentially affecting pathogen susceptibility(9). The observation that loss of ATG7 results in increased susceptibility to C. rodentium infection, in contrast to ATG16L1, highlights complex relationships between pathogens and individual autophagy proteins(44). In this context, our results show that ATG16L2 functionally impacts epithelial homeostasis in an ATG16L1-dependent manner. The details of this genetic interaction remain to be clearly defined. While our data describe changes in Paneth cells consequent to ATG16L2 loss, the role of ATG16L2 in Paneth cell biology is likely to be quite distinct from that of ATG16L1 as evidenced by both histologic appearance and converse effects on C. rodentium resistance. Interestingly, whereas previous studies find the loss of ATG16L1 or ATG5 impact Paneth cells detectably only in the context of inflammation, loss of ATG16L2 demonstrates significant effects on Paneth cells at steady state (45, 46). While the data support the working hypothesis that the genetic interaction in this model occurs mainly in Paneth cells, further experiments are needed to clarify the disease-specific dysregulation in these cells and rule out the contribution of other cell types. Interestingly, our data already suggest how epithelial ATG16L1 loss may affect other cell types, such as CD4+ T cells, in a manner that
genetically interacts with ATG16L2, further pointing to intricate effects on interacting cell types that will be important to dissect. It is tempting to speculate that these distinct and interacting functional features of ATG16L1 and ATG16L2 may explain, at least in part, how these genes are both linked to Crohn’s disease and systemic lupus erythematosus, albeit in ethnically distinct populations.
In summary, to our knowledge we have generated the first knockout model of ATG16L2, an autophagy-related gene linked to human inflammatory disease. Our data find that ATG16L2 behaves very differently from other canonical autophagy genes, including its homolog ATG16L1. These results help extend our conception of the different contributions of autophagy-related genes to cell-specific physiology.
Supplementary Material
Refer to Web version on PubMed Central for supplementary material.
Acknowledgements
We would like to thank Elizabeth Creasey and Isabel Latorre for assistance with project management, and Tina Polintan for editorial assistance.
A
uthor Man
uscr
ipt
A
uthor Man
uscr
ipt
A
uthor Man
uscr
ipt
A
uthor Man
uscr
ipt
This work was supported by N.I.H. grants T32 CA009216–31 (BK), T32 HL066987–12 (BK) and K08 DK104021– 01 (BK), the Human Frontiers Science Program (MB), the Klarman Cell Observatory at the Broad Institute (AR and RJX) and a Broadnext10 award (AR and RJX).
References
1. Mizushima N, and Komatsu M. 2011 Autophagy: renovation of cells and tissues. Cell 147: 728–741. [PubMed: 22078875]
2. Levine B, Mizushima N, and Virgin HW. 2011 Autophagy in immunity and inflammation. Nature 469: 323–335. [PubMed: 21248839]
3. Barrett JC, Hansoul S, Nicolae DL, Cho JH, Duerr RH, Rioux JD, Brant SR, Silverberg MS, Taylor KD, Barmada MM, Bitton A, Dassopoulos T, Datta LW, Green T, Griffiths AM, Kistner EO, Murtha MT, Regueiro MD, Rotter JI, Schumm LP, Steinhart AH, Targan SR, Xavier RJ, NIDDK IBD Genetics Consortium, Libioulle C, Sandor C, Lathrop M, Belaiche J, Dewit O, Gut I, Heath S, Laukens D, Mni M, Rutgeerts P, van Gossum A, Zelenika D, Franchimont D, Hugot J-P, de Vos M, Vermeire S, Louis E, Belgian-French IBD Consortium, Wellcome Trust Case Control Consortium, Cardon LR, Anderson CA, Drummond H, Nimmo E, Ahmad T, Prescott NJ, Onnie CM, Fisher SA, Marchini J, Ghori J, Bumpstead S, Gwilliam R, Tremelling M, Deloukas P, Mansfield J, Jewell D, Satsangi J, Mathew CG, Parkes M, Georges M, and Daly MJ. 2008 Genome-wide association defines more than 30 distinct susceptibility loci for Crohn’s disease. Nature Genetics 40: 955–962. [PubMed: 18587394]
4. Khor B, Gardet A, and Xavier RJ. 2011 Genetics and pathogenesis of inflammatory bowel disease. Nature 474: 307–317. [PubMed: 21677747]
5. Lassen KG, and Xavier RJ. 2017 Genetic control of autophagy underlies pathogenesis of inflammatory bowel disease. Mucosal immunology 10: 589–597. [PubMed: 28327616]
6. Murthy A, Li Y, Peng I, Reichelt M, Katakam AK, Noubade R, Roose-Girma M, DeVoss J, Diehl L, Graham RR, and van Lookeren Campagne M. 2014 A Crohn’s disease variant in Atg16l1 enhances its degradation by caspase 3. Nature 506: 456–462. [PubMed: 24553140]
7. Lassen KG, Kuballa P, Conway KL, Patel KK, Becker CE, Peloquin JM, Villablanca EJ, Norman JM, Liu T-C, Heath RJ, Becker ML, Fagbami L, Horn H, Mercer J, Yilmaz OH, Jaffe JD, Shamji AF, Bhan AK, Carr SA, Daly MJ, Virgin HW, Schreiber SL, Stappenbeck TS, and Xavier RJ. 2014 Atg16L1 T300A variant decreases selective autophagy resulting in altered cytokine signaling and decreased antibacterial defense. Proc Natl Acad Sci USA 111: 7741–7746. [PubMed: 24821797] 8. Marchiando AM, Ramanan D, Ding Y, Gomez LE, Hubbard-Lucey VM, Maurer K, Wang C, Ziel
JW, van Rooijen N, Nuñez G, Finlay BB, Mysorekar IU, and Cadwell K. 2013 A deficiency in the autophagy gene Atg16L1 enhances resistance to enteric bacterial infection. Cell Host Microbe 14: 216–224. [PubMed: 23954160]
9. Conway KL, Kuballa P, Song J-H, Patel KK, Castoreno AB, Yilmaz OH, Jijon HB, Zhang M, Aldrich LN, Villablanca EJ, Peloquin JM, Goel G, Lee I-A, Mizoguchi E, Shi HN, Bhan AK, Shaw SY, Schreiber SL, Virgin HW, Shamji AF, Stappenbeck TS, Reinecker H-C, and Xavier RJ. 2013 Atg16l1 is required for autophagy in intestinal epithelial cells and protection of mice from Salmonella infection. Gastroenterology 145: 1347–1357. [PubMed: 23973919]
10. Kabat AM, Harrison OJ, Riffelmacher T, Moghaddam AE, Pearson CF, Laing A, Abeler-Dörner L, Forman SP, Grencis RK, Sattentau Q, Simon AK, Pott J, and Maloy KJ. 2016 The autophagy gene Atg16l1 differentially regulates Treg and TH2 cells to control intestinal inflammation. Elife 5: 2066.
11. Hubbard-Lucey VM, Shono Y, Maurer K, West ML, Singer NV, Ziegler CGK, Lezcano C, Motta ACF, Schmid K, Levi SM, Murphy GF, Liu C, Winkler JD, Amaravadi RK, Rogler G, Dickinson AM, Holler E, van den Brink MRM, and Cadwell K. 2014 Autophagy gene Atg16L1 prevents lethal T cell alloreactivity mediated by dendritic cells. Immunity 41: 579–591. [PubMed: 25308334]
12. Ishibashi K, Fujita N, Kanno E, Omori H, Yoshimori T, Itoh T, and Fukuda M. 2011 Atg16L2, a novel isoform of mammalian Atg16L that is not essential for canonical autophagy despite forming an Atg12–5–16L2 complex. Autophagy 7: 1500–1513. [PubMed: 22082872]
A
uthor Man
uscr
ipt
A
uthor Man
uscr
ipt
A
uthor Man
uscr
ipt
A
uthor Man
uscr
ipt
13. Yang S-K, Hong M, Zhao W, Jung Y, Baek J, Tayebi N, Kim KM, Ye BD, Kim K-J, Park SH, Lee I, Lee E-J, Kim WH, Cheon JH, Kim Y-H, Jang BI, Kim H-S, Choi JH, Koo JS, Lee JH, Jung S-A, Lee YJ, Jang JY, Shin HD, Kang D, Youn H-S, Liu J, and Song K. 2014 Genome-wide association study of Crohn’s disease in Koreans revealed three new susceptibility loci and common attributes of genetic susceptibility across ethnic populations. Gut 63: 80–87. [PubMed: 23850713] 14. Oh SH, Baek J, Kim KM, Lee E-J, Jung Y, Lee YJ, Jin H-S, Ye BD, Yang S-K, Lee J-K, Seo E-J,
Lim HT, Lee I, and Song K. 2015 Is Whole Exome Sequencing Clinically Practical in the Management of Pediatric Crohn’s Disease? Gut Liver 9: 767–775. [PubMed: 26503572]
15. Lessard CJ, Sajuthi S, Zhao J, Kim K, Ice JA, Li H, Ainsworth H, Rasmussen A, Kelly JA, Marion M, Bang S-Y, Bin Joo Y, Choi J, Lee H-S, Mo Kang Y, Suh C-H, Tae Chung W, Lee S-K, Choe J-Y, Cheol Shim S, Hee Oh J, Jin Kim J-Y, Han B-G, Shen N, Siew Howe H, Wakeland EK, Li Q-Z, Wook Song Y, Gaffney PM, Alarcón-Riquelme ME, Criswell LA, Jacob CO, Kimberly RP, Vyse TJ, Harley JB, Sivils KL, Bae S-C, Langefeld CD, and Tsao BP. 2016 Identification of a Systemic Lupus Erythematosus Risk Locus Spanning ATG16L2, FCHSD2, and P2RY2 in Koreans. Arthritis Rheumatol 68: 1197–1209. [PubMed: 26663301]
16. Fuyuno Y, Yamazaki K, Takahashi A, Esaki M, Kawaguchi T, Takazoe M, Matsumoto T, Matsui T, Tanaka H, Motoya S, Suzuki Y, Kiyohara Y, Kitazono T, and Kubo M. 2015 Genetic
characteristics of inflammatory bowel disease in a Japanese population. J Gastroenterol 1–10. 17. Molineros JE, Yang W, Zhou X-J, Sun C, Okada Y, Zhang H, Chua KH, Lau Y-L, Kochi Y, Suzuki
A, Yamamoto K, Ma J, Bang S-Y, Lee H-S, Kim K, Bae S-C, Zhang H, Shen N, Looger LL, and Nath SK. 2017 Confirmation of five novel susceptibility loci for Systemic Lupus Erythematosus (SLE) and integrated network analysis of 82 SLE susceptibility loci. Hum Mol Genet.
18. Yin L, Liu J, Dong H, Xu E, Qiao Y, Wang L, Zhang L, Jia J, Li L, and Geng X. 2014 Autophagy-related gene16L2, a potential serum biomarker of multiple sclerosis evaluated by bead-based proteomic technology. Neurosci. Lett 562: 34–38. [PubMed: 24406150]
19. Igci M, Baysan M, Yigiter R, Ulasli M, Geyik S, Bayraktar R, Bozgeyik İ, Bozgeyik E, and Bayram A. 2016 Gene Expression Profiles of Autophagy-Related Genes in Multiple Sclerosis. Gene 588: 38–46. [PubMed: 27125224]
20. Li N, Wu X, Holzer RG, Lee J-H, Todoric J, Park E-J, Ogata H, Gukovskaya AS, Gukovsky I, Pizzo DP, VandenBerg S, Tarin D, Atay C, Arkan MC, Deerinck TJ, Moscat J, Diaz-Meco M, Dawson D, Erkan M, Kleeff J, and Karin M. 2013 Loss of acinar cell IKKα triggers spontaneous pancreatitis in mice. J Clin Invest 123: 2231–2243. [PubMed: 23563314]
21. Khor B, Bredemeyer AL, Huang C-Y, Turnbull IR, Evans R, Maggi LB, White JM, Walker LM, Carnes K, Hess RA, and Sleckman BP. 2006 Proteasome activator PA200 is required for normal spermatogenesis. Mol Cell Biol 26: 2999–3007. [PubMed: 16581775]
22. Begun J, Lassen KG, Jijon HB, Baxt LA, Goel G, Heath RJ, Ng A, Tam JM, Kuo S-Y, Villablanca EJ, Fagbami L, Oosting M, Kumar V, Schenone M, Carr SA, Joosten LAB, Vyas JM, Daly MJ, Netea MG, Brown GD, Wijmenga C, and Xavier RJ. 2015 Integrated Genomics of Crohn’s Disease Risk Variant Identifies a Role for CLEC12A in Antibacterial Autophagy. CellReports 11: 1905–1918.
23. Khor B, Gagnon JD, Goel G, Roche MI, Conway KL, Tran K, Aldrich LN, Sundberg TB, Paterson AM, Mordecai S, Dombkowski D, Schirmer M, Tan PH, Bhan AK, Roychoudhuri R, Restifo NP, O’Shea JJ, Medoff BD, Shamji AF, Schreiber SL, Sharpe AH, Shaw SY, and Xavier RJ. 2015 The kinase DYRK1A reciprocally regulates the differentiation of Th17 and regulatory T cells. Elife 4. 24. Schmittgen TD, and Livak KJ. 2008 Analyzing real-time PCR data by the comparative C(T)
method. Nat Protoc 3: 1101–1108. [PubMed: 18546601]
25. Picelli S, Faridani OR, Björklund AK, Winberg G, Sagasser S, and Sandberg R. 2014 Full-length RNA-seq from single cells using Smart-seq2. Nat Protoc 9: 171–181. [PubMed: 24385147] 26. Brennecke P, Anders S, Kim JK, Kołodziejczyk AA, Zhang X, Proserpio V, Baying B, Benes V,
Teichmann SA, Marioni JC, and Heisler MG. 2013 Accounting for technical noise in single-cell RNA-seq experiments. Nat Methods 10: 1093–1095. [PubMed: 24056876]
27. Shekhar K, Lapan SW, Whitney IE, Tran NM, Macosko EZ, Kowalczyk M, Adiconis X, Levin JZ, Nemesh J, Goldman M, McCarroll SA, Cepko CL, Regev A, and Sanes JR. 2016 Comprehensive Classification of Retinal Bipolar Neurons by Single-Cell Transcriptomics. Cell 166: 1308– 1323.e30. [PubMed: 27565351]
A
uthor Man
uscr
ipt
A
uthor Man
uscr
ipt
A
uthor Man
uscr
ipt
A
uthor Man
uscr
ipt
28. Sato T, Vries RG, Snippert HJ, van de Wetering M, Barker N, Stange DE, van Es JH, Abo A, Kujala P, Peters PJ, and Clevers H. 2009 Single Lgr5 stem cells build crypt-villus structures in vitro without a mesenchymal niche. Nature 459: 262–265. [PubMed: 19329995]
29. Zhang J, Randall MS, Loyd MR, Dorsey FC, Kundu M, Cleveland JL, and Ney PA. 2009 Mitochondrial clearance is regulated by Atg7-dependent and -independent mechanisms during reticulocyte maturation. Blood 114: 157–164. [PubMed: 19417210]
30. Kundu M, Lindsten T, Yang C-Y, Wu J, Zhao F, Zhang J, Selak MA, Ney PA, and Thompson CB. 2008 Ulk1 plays a critical role in the autophagic clearance of mitochondria and ribosomes during reticulocyte maturation. Blood 112: 1493–1502. [PubMed: 18539900]
31. Schweers RL, Zhang J, Randall MS, Loyd MR, Li W, Dorsey FC, Kundu M, Opferman JT, Cleveland JL, Miller JL, and Ney PA. 2007 NIX is required for programmed mitochondrial clearance during reticulocyte maturation. Proc Natl Acad Sci USA 104: 19500–19505. [PubMed: 18048346]
32. Sandoval H, Thiagarajan P, Dasgupta SK, Schumacher A, Prchal JT, Chen M, and Wang J. 2008 Essential role for Nix in autophagic maturation of erythroid cells. Nature 454: 232–235. [PubMed: 18454133]
33. Miller BC, Zhao Z, Stephenson LM, Cadwell K, Pua HH, Lee HK, Mizushima NN, Iwasaki A, He Y-W, Swat W, and Virgin HW. 2008 The autophagy gene ATG5 plays an essential role in B lymphocyte development. Autophagy 4: 309–314. [PubMed: 18188005]
34. Stephenson LM, Miller BC, Ng ACY, Eisenberg J, Zhao Z, Cadwell K, Graham DB, Mizushima NN, Xavier R, Virgin HW, and Swat W. 2009 Identification of Atg5-dependent transcriptional changes and increases in mitochondrial mass in Atg5-deficient T lymphocytes. Autophagy 5: 625– 635. [PubMed: 19276668]
35. Conway KL, Kuballa P, Khor B, Zhang M, Shi HN, Virgin HW, and Xavier RJ. 2013 ATG5 regulates plasma cell differentiation. Autophagy 9: 528–537. [PubMed: 23327930]
36. Pei B, Zhao M, Miller BC, Véla JL, Bruinsma MW, Virgin HW, and Kronenberg M. 2015 Invariant NKT cells require autophagy to coordinate proliferation and survival signals during differentiation. The Journal of Immunology 194: 5872–5884. [PubMed: 25926673]
37. Lai Z-W, Borsuk R, Shadakshari A, Yu J, Dawood M, Garcia R, Francis L, Tily H, Bartos A, Faraone SV, Phillips P, and Perl A. 2013 Mechanistic target of rapamycin activation triggers IL-4 production and necrotic death of double-negative T cells in patients with systemic lupus erythematosus. The Journal of Immunology 191: 2236–2246. [PubMed: 23913957]
38. Kato H, and Perl A. 2014 Mechanistic target of rapamycin complex 1 expands Th17 and IL-4+ CD4-CD8- double-negative T cells and contracts regulatory T cells in systemic lupus
erythematosus. The Journal of Immunology 192: 4134–4144. [PubMed: 24683191] 39. Katsanos KH, Voulgari PV, and Tsianos EV. 2012 Inflammatory bowel disease and lupus: a
systematic review of the literature. J Crohns Colitis 6: 735–742. [PubMed: 22504032] 40. Cotsapas C, Voight BF, Rossin E, Lage K, Neale BM, Wallace C, Abecasis GR, Barrett JC,
Behrens T, Cho J, de Jager PL, Elder JT, Graham RR, Gregersen P, Klareskog L, Siminovitch KA, van Heel DA, Wijmenga C, Worthington J, Todd JA, Hafler DA, Rich SS, Daly MJ, FOCiS Network of Consortia. 2011 Pervasive sharing of genetic effects in autoimmune disease. PLoS Genet 7: e1002254. [PubMed: 21852963]
41. Lai Z-W, Kelly R, Winans T, Marchena I, Shadakshari A, Yu J, Dawood M, Garcia R, Tily H, Francis L, Faraone SV, Phillips PE, and Perl A. 2018 Sirolimus in patients with clinically active systemic lupus erythematosus resistant to, or intolerant of, conventional medications: a single-arm, open-label, phase 1/2 trial. Lancet 391: 1186–1196. [PubMed: 29551338]
42. Mutalib M, Borrelli O, Blackstock S, Kiparissi F, Elawad M, Shah N, and Lindley K. 2014 The use of sirolimus (rapamycin) in the management of refractory inflammatory bowel disease in children. J Crohns Colitis 8: 1730–1734. [PubMed: 25240477]
43. Green DR, and Levine B. 2014 To be or not to be? How selective autophagy and cell death govern cell fate. Cell 157: 65–75. [PubMed: 24679527]
44. Inoue J, Nishiumi S, Fujishima Y, Masuda A, Shiomi H, Yamamoto K, Nishida M, Azuma T, and Yoshida M. 2012 Autophagy in the intestinal epithelium regulates Citrobacter rodentium infection. Arch. Biochem. Biophys 521: 95–101. [PubMed: 22475450]
A
uthor Man
uscr
ipt
A
uthor Man
uscr
ipt
A
uthor Man
uscr
ipt
A
uthor Man
uscr
ipt
45. Matsuzawa-Ishimoto Y, Shono Y, Gomez LE, Hubbard-Lucey VM, Cammer M, Neil J, Dewan MZ, Lieberman SR, Lazrak A, Marinis JM, Beal A, Harris PA, Bertin J, Liu C, Ding Y, van den Brink MRM, and Cadwell K. 2017 Autophagy protein ATG16L1 prevents necroptosis in the intestinal epithelium. J Exp Med 214: 3687–3705. [PubMed: 29089374]
46. Burger E, Araujo A, López-Yglesias A, Rajala MW, Geng L, Levine B, Hooper LV, Burstein E, and Yarovinsky F. 2018 Loss of Paneth Cell Autophagy Causes Acute Susceptibility to Toxoplasma gondii-Mediated Inflammation. Cell Host Microbe 23: 177–190.e4. [PubMed: 29358083]
A
uthor Man
uscr
ipt
A
uthor Man
uscr
ipt
A
uthor Man
uscr
ipt
A
uthor Man
uscr
ipt
Key points:
• ATG16L2-deficient mice are viable and exhibit intact canonical autophagy.
• Intestinal infection reveals ATG16L2-(epithelial) ATG16L1 genetic interaction.
A
uthor Man
uscr
ipt
A
uthor Man
uscr
ipt
A
uthor Man
uscr
ipt
A
uthor Man
uscr
ipt
Fig. 1. Role of ATG16L1 and ATG16L2 in canonical autophagy functions.
(A) Schematic of targeting strategy, not drawn to scale, indicating the Atg16l2 exons in a single open arrow, the genes for neomycin resistance (Neor) and diphtheria toxin sensitivity (DT), loxP sites (filled triangles), EcoRV sites (RV) and probes for Southern analyses (filled boxes). (B) Southern blot analyses of selected ES clones with indicated probes in
parentheses. Molecular weights indicated to the left of each blot, as well as expected band sizes for the wildtype and targeted alleles (black and red arrows respectively). Asterisks denote clones with appropriate patterns, 172 shows an untargeted clone, 37 shows a non-homologous integration. C. Summary of genotypes from 473 pups born to Atg16l2+/Δ × Atg16l2+/Δ mating pairs indicating numbers and percentages of offspring with 0, 1 and 2 Atg16l2+/Δ alleles (WT, Het and KO respectively). Chi-squared test p value, compared to a 1:2:1 Mendelian ratio, is shown. (D) Western blot analyses of LC3 isoforms and p62 accumulation in MEFs with perturbed ATG16L1 (T300A or deficient) or ATG16L2. Representative of 3 independent experiments. (E) Western blot analyses of LC3 isoforms in bone marrow-derived dendritic cells (BMDCs) and primary B cells, T cells and neutrophils (NP). Representative of 2 independent experiments. (F) Antibacterial autophagy in either ATG16-sufficient or -deficient MEFs and primary splenic macrophages (MPs). (Data shown as mean ± SD, n = 75 cells per condition from 3 biologic replicates, representative of 3 independent experiments) (G) IL-1β production in primary splenic macrophages in response to stimulation with MDP and LPS. (Data shown as mean ± SD, representative of 3
independent experiments)
A
uthor Man
uscr
ipt
A
uthor Man
uscr
ipt
A
uthor Man
uscr
ipt
A
uthor Man
uscr
ipt
Fig. 2. Effect of ATG16L2 loss on development and function of hematopoietic subsets.
(A) Data obtained from the GTex Portal (https://gtexportal.org/home/) showing normalized expression of Atg16l1 and Atg16l2 (green and red, respectively; overlap in yellow) across different tissues. Blood and spleen are indicated, tissues where expression of Atg16l2 appears disproportionately higher. (B) Hematopoietic parameters in ATG16L2-deficient mice. RBC, red blood cell count; Hct, hematocrit; MCV, mean corpuscular volume; RDW, red cell distribution width; Hb, hemoglobin. Data shown as min-max box-and-whiskers plots. (9 gender- and age-matched mice/cohort, min-max plot, representative of 3 independent experiments) (C) Leukocyte parameters in ATG16L2-deficient mice. Data shown as mean ± SD, 3 mice per group, representative of 3 independent experiments. (D) Immune cell subsets in major lymphoid compartments. Perit, peritoneum; DN, CD4−CD8− double negative; DP, CD4+CD8+ double positive; SP, CD4+/CD8+ single positive. Data shown as mean ± SD, 3 littermates per group, representative of 3 independent experiments. (E) Mixed bone marrow chimeras of wildtype CD45.1+CD45.2+ stem cells with either ATG16L2-sufficient or -deficient CD45.2+ stem cells into immune-sufficient CD45.1+ hosts. Black and red lines show normalized contribution from wildtype and ATG16L2-deficient CD45.2+ cells respectively. BM, bone marrow; Periph, periphery; Sp, spleen; MZ, marginal zone; FO, follicular B cells; PC, plasma cells; LN, lymph node; Thy, thymus; n, naïve; m,
A
uthor Man
uscr
ipt
A
uthor Man
uscr
ipt
A
uthor Man
uscr
ipt
A
uthor Man
uscr
ipt
memory. Data shown as mean ± SD of 3 independent experiments, 4 recipients per group per experiment. (F) Proliferation of ATG16L2−/− (KO) T cells in response to anti-CD3/ CD28 stimulation. (F-H Data shown as mean ± SD, technical triplicates, representative of 3 independent experiments) (G) IL-2 production be ATG16L2−/− (KO) T cells in response to anti-CD3/CD28 stimulation. (H) Ability of ATG16L2−/− (KO) T cells to differentiate into
pro- and anti-inflammatory subsets. (I) Ability of ATG16L2−/− (KO) mice to mount an antigen-specific T-independent antibody response. Data shown as mean ± SD, 3 mice per group, representative of 3 independent experiments. All differences non-significant unless otherwise indicated; **, q<0.01; t-test (E, F, H) with Benjamini, Krieger and Yekutieli correction (A-D, G).
A
uthor Man
uscr
ipt
A
uthor Man
uscr
ipt
A
uthor Man
uscr
ipt
A
uthor Man
uscr
ipt
Fig. 3. Impact of ATG16L1 and/or ATG16L2 loss on T cell development and function.
(A) and (B) Thymic development in mice deficient in ATG16L1 and/or ATG16L2. Earliest
CD4-CD8-CD3- triple negative (TN) subsets are displayed separately for clarity. (C) and
(D) Splenic lymphoid populations in mice deficient in ATG16L1 and/or ATG16L2. Naïve
and memory subsets are displayed separately for clarity. (A-D) Data shown as min-max box-and-whiskers plots of 5 independent experiments, 3 age- and gender-matched mice per group per experiment. (E) Effect of loss of ATG16L1 (in T cells) and/or ATG16L2 on ability to mount an antigen-specific T-dependent antibody response. All differences non-significant unless otherwise indicated; *, p<0.05; **, p<0.01; ***, p<0.005; 2-way ANOVA with Dunnett correction, comparisons against wildtype (blue).
A
uthor Man
uscr
ipt
A
uthor Man
uscr
ipt
A
uthor Man
uscr
ipt
A
uthor Man
uscr
ipt
Fig. 4. Impact of ATG16L1 and/or ATG16L2 loss on epithelial barrier biology and function.
(A) Effect of loss of ATG16L1 (in epithelial cells) and/or ATG16L2 on response to oral
infection with Citrobacter rodentium. Data shown as mean ± SD, 4 mice per group, 2 independent experiments, 2-way ANOVA with Tukey correction. (B) Cytokine response in mice deficient in ATG16L1 and/or ATG16L2 after infection with Citrobacter rodentium. Data shown as min-max box-and-whiskers plots of 2 independent experiments, technical triplicates, 2 mice each, 2-way ANOVA with Tukey correction. (A-B) All differences non-significant unless otherwise indicated; *, p<0.05; **, p<0.01; ***, p<0.005. Significant differences from wildtype, ATG16L1-deficient and ATG16L2-deficient mice in blue, red and green respectively. (C) Single-cell RNAseq of epithelial cells from mice deficient in ATG16L1 and/or ATG16L2. Displayed is tSNE analysis of all cells in aggregate, overlaid with genetic identity (left), cellular identity (middle) and Lyz1 expression to highlight Paneth cells (right). (D) Comparison of cell populations between genotypes. *, p<0.05, hypergeometric test. (E-F) Histological quantitation of Paneth cells (E) and TUNEL+ cells (F) in intestinal sections from ATG16L2-deficient mice, Mann-Whitney p-values.