Dynamics in a Photoresponsive Surfactant System
byBradley A. Cicciarelli
B.S. Chemical Engineering, University of Florida, Gainesville, FL (2001)
Submitted to the Department of Chemical Engineering in partial
fulfillment of the requirements
for the degree ofDoctor of Philosophy at the
Massachusetts Institute of Technology May 2007
@ 2007 Massachusetts Institute of Technology. All rights reserved.
Signature of Author... ...
Department of Chemical Engineering May 15, 2007 Certified by ... V...
T. Alan Hatton Ralph Landau Professor of Chemical Engineering Practice Thesis Supervisor Certified by... ... ... .. ..
Keieth A. Smith Gilliland Professor of Chemical Engineering Thesis Supervisor
Accepted by... ...
MASSACHUSETTS INSTITUTE. William M. Deen
OF TECHNOLOGY Carbon P. Dubbs Professor of Chemical Engineering
Chairman, Committee for Graduate Students
ARCHIVES
JUN 1
12007
Dynamics in a Photoresponsive Surfactant System
byBradley A. Cicciarelli
Submitted to the Department of Chemical Engineering on May 15, 2007, in partial fulfillment of the requirements for the degree of
Doctor of Philosophy in Chemical Engineering
Abstract
The study of surface tension and other surface properties is motivated by the large number of industrially relevant processes involving interfaces, such as coating, detergency, printing, foams, and so forth. These surface properties become increasingly important as the length scale of the. system is reduced (as in microfluidic devices). Recently, much research has been focused on developing surfactants which respond to a particular stimulus (such as temperature, pH, light, etc.), so that properties such as surface tension and viscosity can be controlled using a convenient external trigger. Using light for this purpose has some advantages over other methods, as light can easily be focused and patterned (using optical lenses, filters, and masks) to give excellent precision for changing solution properties in a targeted area.
A nonionic photoresponsive surfactant has been developed which incorporates the light-sensitive azobenzene group into its hydrophobic tail. Cis-trans photo-isomerization of this group causes a change in the structure of the surfactant molecule which alters its aggregation state in bulk solution and its adsorption capacity at an air-water interface. NMR studies indicate that a solution removed from light for an extended period of time is comprised almost entirely of the
trans isomer, while samples exposed to light of fixed wavelength eventually reach a
photostationary state containing significant amounts of both isomers, with UV illumination producing a mixture dominated by the cis isomer.
Surface pressure measurements of adsorbed monolayers of the surfactant under various illumination conditions were made using a Langmuir film balance. The results indicate that adsorbed cis surfactant exerts a greater surface pressure than the adsorbed trans isomer, and that
any cis present in a saturated layer tends to dominate the surface pressure behavior of the film.
Fluorescence experiments were used to study the aggregation behavior of the surfactant in aqueous solution. The results suggest that the trans and cis isomers segregate into separate, co-existing aggregate phases and that the critical concentration associated with the onset of
aggregation is very different for the two isomers.
In measurements performed well above the CMC, the dynamic surface tension of surfactant solutions following the creation of a fresh interface was found to depend strongly on the illumination state of the sample, though the same equilibrium tension was reached in all cases. The observed dynamic behavior is consistent with a mechanism in which the cis and trans isomers present in the mixtures compete for adsorption at the air/water interface.
Diffusion models were developed to estimate the time scales expected for surfactant adsorption and surface tension relaxation in these systems. These models account for the role of aggregates in the adsorption process, and consider limiting behavior for three aggregate properties: mobility, dissolution rate, and ability to incorporate into the interface. Good agreement is found between the model predictions and the experimentally observed relaxation time scales. The results suggest that trans-rich aggregates are important to the adsorption of trans surfactant, but that aggregates play little or no role in the adsorption of the cis isomer. In other experiments, high-intensity illumination focused on a surface saturated with surfactant was used to drive
photoisomerization of adsorbed surfactant, resulting in rapid, substantial changes in surface tension. These changes are consistent with proposed conformations of the adsorbed surfactant, and with earlier monolayer studies.
Thesis Supervisor: T. Alan Hatton
Title: Ralph Landau Professor of Chemical Engineering Practice Thesis Supervisor: Kenneth A. Smith
Acknowledgements
I need to thank my advisors, Alan Hatton and Ken Smith, for all that they have done for me during my time at MIT. I sincerely appreciate their guidance and support during my thesis research. I am very thankful for my experience in being co-advised: both Alan and Ken have been involved in every step of the project, and they each brought different viewpoints and areas of expertise to our meetings and discussions. I have greatly benefited from this exposure and have learned a lot from each of them. I am also particularly grateful for the patience they have
shown me throughout my tenure, particularly during the times when things were not going well and were looking pretty discouraging. Thanks for sticking it out with me.
I would also like to thank the rest of my thesis committee, Professors Pat Doyle and Bill Deen, for their service on my committee and for their helpful input and suggestions over the years. I
also appreciate the support of my entire committee during my job application process.
I am also indebted to many members of the Hatton group, both past and present. Tiangang Shang pioneered all of the early work with these surfactants and provided a wealth of information. Geoff Moeser was a great mentor to me in my early stages as a researcher and was a source of both knowledge and encouragement. Lino Gonzalez has proven to be a great friend and helpful resource over the years. He has always been willing to help me with my project when asked, offering assistance in everything from brainstorming for new ideas to interpreting data to
developing mathematical models. Harpreet Singh, Andre Ditsch, Marco Lattuada, Sanjoy Sircar, Smeet Deshmukh, Huan Zhang, Dhananjay Dendukuri, and Nate Aumock have all been helpful to me at various points along my thesis, and have been a pleasure to work with over the years.
Specifically, I thank Sanjoy for his help in NMR experiments and with chemical synthesis. Harpreet was very helpful in aiding me during light scattering studies. Additionally, Kris Stokes of the Hammond group has been helpful in training and allowing me to use the Langmuir trough located in their lab. Josephine Elia has also made substantial contributions to this work during her two years spent in our lab as an undergraduate researcher. Her hard work, critical thinking, and cheerful attitude were great assets to this research, and will be missed. Beth Tuths and Linda Mousseau also deserve many thanks for all of their administrative assistance.
I have been blessed with many great friends in the chemical engineering department with whom I have shared countless fun experiences, fond memories, and useful discussions. These people have shaped my experience as a graduate student, and are too many in number to recount in entirety here. but I would be remiss if I did not at least specifically acknowledge Keith Tyo, Mike Rappel. Daryl Powers, Chad Augustine, Patrick Underhill, Ramin Haghgooie, Anna Pisania. and Mark Styczynski for their valued friendship. I also wish to thank Tara Winternitz, Melissa Haines. and Jamie Newman, who, at different points during the past six years, have made my life much more enjoyable, and have offered a refuge from the frustrations and disappointments that research often brings.
Finally. I must thank my family for all of their love, support. and encouragement. My parents, Lee and Sandra Cicciarelli. and my sister, Monica Cicciarelli, have always been there for me, and I cannot thank them enough. I could not ask to be part of a better family. and my
Table of Contents
Chapter 1: Introduction
14
1.1 M otivation ... ... 14
1.2 Background: Surfactant Behavior ... 14
1 .2.1 Structure ... 14
1.2.2 Properties ... 15
1.2.2.1 Interfacial Adsorption ... 15
1.2.2.2 Self-Assembly ... 16
1.2.2.3 Dynamic Surface Tension ... 18
1.2.2.4 M ixtures ... 20
1.3 Background: Responsive Systems ... 22
1.3.1 Types of Responsive Surfactants... 22
1.3.2 Photoresponsive Surfactants ... 23
1.4 Research Overview ... 25
1.5 References ... 26
Chapter 2: Surfactant Synthesis and Characterization
29
2.1 Introduction ... 29.2 Experimental ... 30
2..1 M aterials ... 30
2.2.2 Surfactant Synthesis and Structure ... 31
.. 3 Illumination...32 .2.4 Characterization M ethods ... 33 2.2.4.1 UV-Vis Absorption ... 33 .2.4.2 NM R ... 34 2.3 Characterization Results ... 35 2.3.1 UV-Vis Absorption ... 35 2.3.2 NM R ... 36
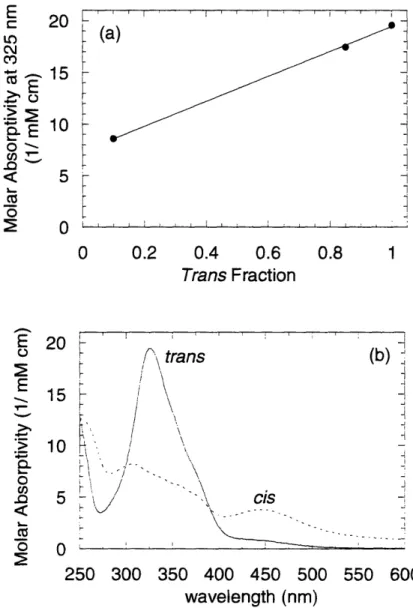
2.3.3 Isomeric M olar Absorptivity Determination ... 37
2.4 Summary ... 39
2.5 References ... 40
Chapter 3: Equilibrium Bulk and Surface Properties
41
3.1 Introduction ... 4 1
3.2 E xperim ental ... 41
3.2.1 Monolayer Studies using a Langmuir Film Balance ... 41
3.2.2 Aggregation Studies using Fluorescence Measurements... 42
3 .3 R esu lts ... 4 3 3.3.1 Monolayer Studies ... 43
3.3.2 Aggregation Studies ... 48
3.4 Sum m ary ... 53
3.5 R eferences ... 54
Chapter 4: Dynamic Surface Tension: Relaxations
55
4.1 Introduction ... 554.2 Experimental / Methods...55
4.2.1 Axisymmetric Drop Shape Analysis Theory ... 55
4.2.2 Limitations of the Method ... 61
4.2.3 Pendant Bubble Method ... 63
4 .3 R esults ... 65
4.3.1 Dynamic Surface Tension Results... . 65
4.3.2 Effect of Surfactant Concentration ... 69
4.4 Modeling of Surfactant Diffusion and Adsorption ... 70
4.4.1 Development of Models which Account for Role of Aggregates...70
4.4.2 Model Predictions ... 79
4.5 Sum m ary ... 81
4.6 R eferences ... 82
Chapter
5:
Dynamic Surface Tension: Response to Illumination
84
5.1 Introduction ... 845.2 Experimental Method ... 84
5.3 R esults ... . 85
5.3.1 Response of Surface Tension to Bubble Surface Illumination ... 85
5.3.2 Interpretation of Results Using Film Balance Results ... 88
Chapter 6: Effect of Temperature
93
6.1 Introduction ... 93
6.2 Experimental Methods... 94
6.2.1 Dynamic Surface Tension ... 94
6.2.2 Fluorescence ... ... 95
6.2.3 Rapid Dilution Studies ... 95
6.3 R esults ... . 96
6.3.1 Effect of Temperature on Surface Tension Relaxations ... 96
6.3.2 Modeling of Diffusion and Adsorption ... 100
6.3.3 Effect of Temperature on Aggregation ... 101
6.3.4 Comparison of Model Predictions with Experimental Results...108
6.3.5 Rapid Dilution Studies ... 111
6.4 Sum m ary... 113
6.5 R eferences ... 115
Chapter 7: Conclusions
118
7.1 Sum m ary of Research ... 1187.2 Future Research Directions ... 122
7.3 R eferences ... 126
Appendix
127
A .I Introduction ... 127A.2 Dynamic Light Scattering ... 127
A.3 Langmuir Trough Experiments ... 131
A.3.1 Wilhelmy Plate Experiment ... 131
A.3.2 Kinetic Barrier Experiment ... 133
A.4 Pendant Drop Perturbation Experiments ... 135
A.5 Marangoni Flow Experiments ... 142
A .6 R eferences ... 147
List of Figures
Figure 1-1. Cartoon illustration of amphipathic structure of surfactant molecule and of
preferential adsorption of surfactants at the air/water interface when dissolved in water. ... 16 Figure 1-2. Cartoon illustration of micelles formed in a surfactant solution at high concentration. This figure depicts a two-dimensional slice through the micelles, revealing the hydrophobic interior. Micelles are three-dimensional structures in which the hydrophilic groups shield this hydrophobic core from the solvent (water)... 17 Figure 1-3. Qualitative depiction of typical dynamic surface tension profile after creation of a fresh air/w ater interface... 19 Figure 1-4. (a) Photoisomerization of azobenzene. (b) Molecular structure of the
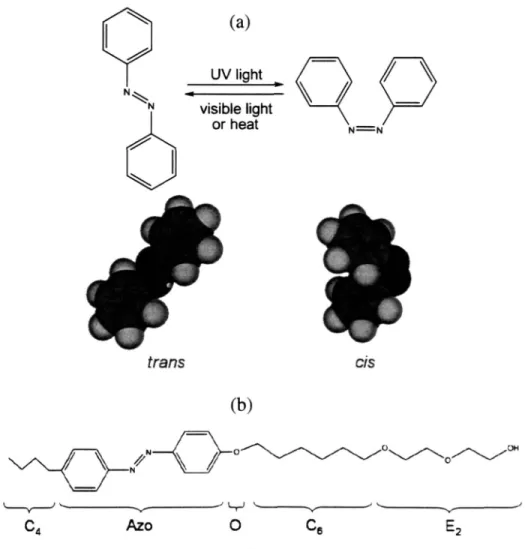
photoresponsive surfactant C4AzoOC6E2. C4 = butyl tail group; Azo = azobenzene group; 0 = ether oxygen middle polar group; C6 = alkyl spacer with 6 methylene groups; E2 = surfactant
head group consisting of two ethylene oxide moieties. Figure from Shang et al. ... 24 Figure 2-1. Molecular structure of the photoresponsive surfactant C4AzoOC6E2. C4 = butyl tail group; Azo = azobenzene group; 0 = ether oxygen middle polar group; C6 = alkyl spacer with 6 methylene groups; E2 = surfactant head group consisting of two ethylene oxide moieties. Figure
from Shang et al... ... 30 Figure 2-2. Schematic of the synthesis pathway for the surfactant C4AzoOC6E2... . . . ...32
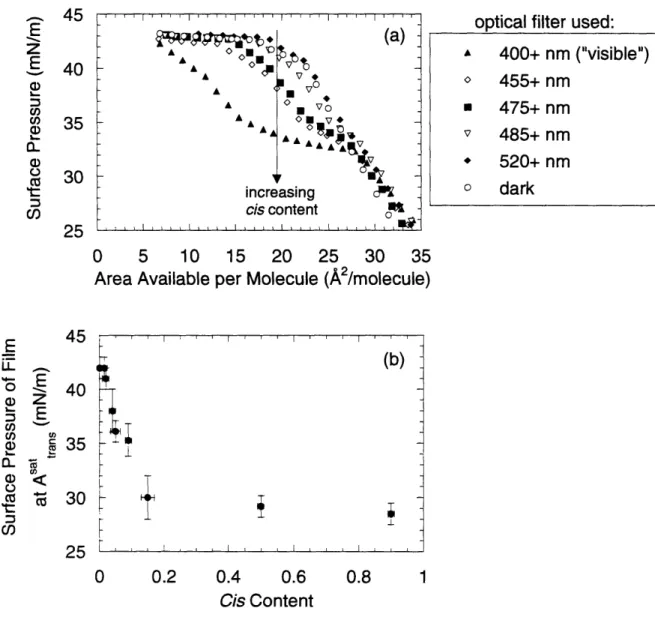
Figure 2-3. Characteristics of the optical filters used to illuminate samples to photostationary states before making physical measurements...33 Figure 2-4. (a) Molar absorptivity spectra for aqueous solutions of C6 photosurfactant. (b) Transient behavior of UV-Vis absorbance peaks for 0.03 mM C6 solution originally in a dark-adapted state, then alternately illuminated with visible and UV light...36 Figure 2-5. (a) Molar absorptivity data at 325 nm for aqueous solutions of C6 photosurfactant. Solid line represents best-fit line of the form given by Eqn. 2-2. (b) Molar absorptivity of the individual trans and cis isomers in aqueous solutions as estimated from application of Eqn. 2-2 to the absorptivity data shown in Figure 2-4a...38 Figure 3-1. Results of compression studies using monolayers of adsorbed photosurfactant. Open and closed versions of each symbol indicate replicate experiments for the purposes of
establishing reproducibility ... 43 Figure 3-2. Proposed conformations of surfactant adsorbed at the air/water interface. From S h ang ... ... .. 44 Figure 3-3. (a) Results of compression studies using monolayers of adsorbed photosurfactant having isomeric compositions intermediate between the dark and visible states. The legend
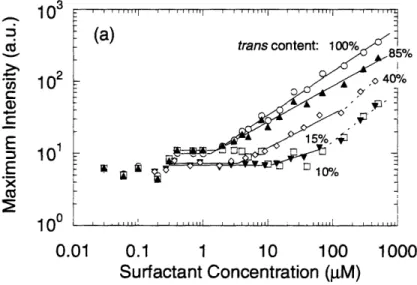
refers to the cut-on wavelength of the optical longpass filter used to illuminate samples prior to spreading. (b) The surface pressure of the film at the trans saturation point as a function of cis co n ten t... 4 7 Figure 3-4a. Emission intensity for solutions containing a fixed amount of Nile Red and
varying amounts of C6 photosurfactant. Solid lines are best-fit lines used to estimate first (trans)
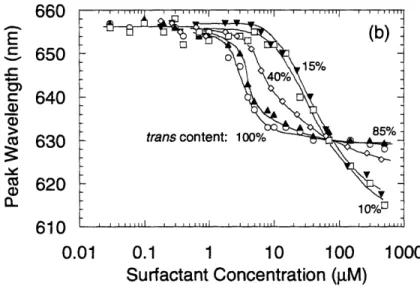
CMC in these samples. Dashed lines are used to estimate second (cis) CMC... 48 Figure 3-4b. Emission peak wavelength data for C6/Nile Red samples... 50
Figure 3-4c,d. (c) Peak wavelength data for C/Nile Red samples plotted against trans
concentration. (d) Peak wavelength data plotted against cis concentration... 51 Figure 3-5. Cryo-TEM images of 600 gM samples obtained by Shang et al. (a) Vesicles formed in dark-adapted sample. (b) Bicontinuous phase formed in UV-illuminated sample.... ... 52 Figure 4-1. Figure 1 from Fordham, which illustrates the two pertinent drop dimensions used in early pendant drop calculations... 56 Figure 4-2. Illustration of the expansion of an element of curved surface ... 58 Figure 4-3. Schematic of drop shape analysis system. Kriss DSA10 Drop Shape Analysis system with DSA 1.8 software was used in pendant bubble studies. Note: Figure not drawn to scale ... . . .. 64 Figure 4-4. (a) Dynamic surface tension profiles of a 0.20 mM aqueous C6 solution under various illumination conditions obtained using the pendant bubble method. Open and closed versions of each symbol indicate replicate experiments for the purposes of establishing reproducibility. Data points are shown in plots with less frequency than they were acquired during the experiment, for the purpose of clearly distinguishing the different symbols. (b) Cartoon illustration of competitive adsorption mechanism by which cis surfactant (bent tail) reaches the interface before the trans isomer (straight tail), but is eventually displaced by the
trans isomer. In these depictions, only the air/water interface and sublayer (thin layer of solution
adjacent to the interface) are shown. Numbers used to label sketch correspond to different surface ages for UV curve shown in (a)...68 Figure 4-5. (a) Characteristic cis relaxation time scale plotted as a function of cis concentration. (b) Characteristic trans relaxation time plotted as a function of trans concentration...70 Figure 4-6. Depiction of the depletion layers and corresponding concentration profiles assumed during development of surfactant diffusion models for the case of fast-dissolving aggregates... 73 Figure 4-7. Depiction of the depletion layers and corresponding concentration profiles assumed during development of surfactant diffusion models for the case of non-dissolving or "frozen" aggregates which are nonetheless fusible...77
Figure 4-8. Characteristic tension relaxation times for C6 solutions of varying concentrations. (a) Dark sample. (b) UV-illuminated sample. Lines correspond to various diffusional time scale models which examine limiting cases for aggregate dissolution rate, aggregate mobility, and the ability of the aggregate to incorporate itself into the interface... 80 Figure 5-1. (a) Dynamic surface tension studies of a 0.16 mM C6 solution involving
illumination of the bubble surface during the experiment. Surfactant solution was initially in the visible state, then illuminated with UV light. (b) Cartoon depiction of surfactant (cis: bent tail,
trans: straight tail) adsorbed at the bubble surface just before (1) and just after (3) illumination
w ith U V light... 86 Figure 5-2. (a) Dynamic surface tension studies of a 0.16 mM C6 solution involving
illumination of the bubble surface during the experiment. Surfactant solution was initially in the UV state. (b) Cartoon depiction of surfactant (cis: bent tail, trans: straight tail) adsorbed at the bubble surface just before (4) and just after (5) first illumination with visible light. (c) Depiction of surfactant adsorbed at the bubble surface just before (1) and just after (2) second illumination of visible light... 88 Figure 5-3. Langmuir film balance results used to explain results seen from experiments in Figures 5-1 and 5-2. Numbers associated with illumination in Figures 5-1 and 5-2 correspond to numbered points on surface pressure-area isotherms shown in Figure 5-3...90 Figure 5-4. Dynamic surface tension studies of a 0.4 mM C6 solution involving illumination of the bubble surface during the experim ent...91 Figure 6-1. Dynamic surface tension profiles for aqueous 0.25 mM C6 photosurfactant solutions at various temperatures. Sample in dark-adapted state...96 Figure 6-2. Dynamic surface tension profiles for aqueous 0.25 mM C6 photosurfactant solutions at various temperatures. Sample in visible photostationary state...97 Figure 6-3. Characteristic relaxation time scales from pendant bubble studies as a function of temperature. Trans values taken as half the time needed for 86% relaxation to equilibrium in dark and visible samples. Cis values taken as time needed for 63% relaxation to intermediate plateau in visible sam ples... 99 Figure 6-4. (a) Maximum fluorescence emission intensity for dark solutions at different
temperatures containing a fixed amount of Nile Red probe and varying amounts of C6
photosurfactant. (b) Emission peak wavelength data for these samples. Solid lines used to fit data for CMC estimates are shown for the 7 *C, 25 *C, and 44 *C data series. (c) Trans CMC as a function of temperature, estimated from wavelength data...103 Figure 6-5. (a) Emission intensity for LV-illuminated solutions of different temperatures containing a fixed amount of Nile Red probe and varying amounts of C6 photosurfactant. Solid
lines used to fit data for CMC estimates are shown for the 7 *C data series. (b) Emission peak wavelength data for these samples. (c) Cis CMC as a function of temperature. estimated from
intensity data. Note: The critical concentration reported is the cis concentration, not the total concentration ... 105 Figure 6-6. Comparison of diffusion models to experimental data for trans relaxations.
Experimental data taken from measurements of dark sample at 0.25 mM...110 Figure 6-7. (a) Fluorescent emission intensity at 630 nm from an aqeuous dark surfactant solution at 10 *C containing aggregates (initially 150 VM) and Nile Red which is diluted rapidly tenfold. Solid line represents exponential curve used to fit results. (b) Time scales needed for re-equilibration of sample intensity after rapid dilution, reported as a function of temperature. Shaded band near 5 seconds represents the range of time constants observed for mixing in control experim ents...113 Figure A-1. Dynamic light scattering (DLS) results for aqueous C6 solutions at a concentration of 600 pLM. (a) After 5 minutes of laser exposure. (b) After 30 minutes of laser exposure...130 Figure A-2. Dynamic light scattering (DLS) results for aqueous C6 solutions at a concentration of 37 gM after a 5 m inute scan...131 Figure A-3. Dynamic surface pressure profile for an aqueous 0.16 mM C6 solution measured by a Wilhelmy plate after sample was loaded into a dish...133 Figure A-4. Results from an experiment in which a surface was compressed during surfactant
ad sorp tio n ... 135 Figure A-5. (a) Typical drop volume and surface tension behavior for an experiment involving rapid contraction of a pendant drop of aqueous C6 solution in the dark-adapted state. (b)
Re-equilibration time scales for drop expansion and contraction experiments of varying magnitudes of perturbation ... 136 Figure A-6. (a) Typical drop volume and surface tension behavior for an experiment involving rapid expansion of a pendant drop of aqueous C6 solution in the UV state. (b) Re-equilibration time scales for drop expansion and contraction experiments of varying magnitudes of
perturbation ... 142 Figure A-7. Cartoon depiction of surface tension-driven flow using photoresponsive surfactants and non-uniform illumination of the surface. (a) Visible and UV light shining on different ends of a surface. (b) UV light shining in the middle of a surface otherwise illuminated with visible lig h t...14 3 Figure A-8. Diagram of the system considered when developing model for Marangoni flow.. 144
List of Tables
Table 4-1. Surface tension fitting results for pendant drops of water of varying volumes.
Tension values reported are the average and standard deviation of four measurements taken over 3 s span ... . . 62
Chapter 1
Introduction
1.1 Motivation
Surface active agents, or surfactants, have been defined as substances that, when present at low concentration in a system, adsorb onto the interfaces of the system and markedly alter the free energies of those interfaces [1]. They appear in a diverse range of products, including motor oils, pharmaceuticals, detergents, and foods. Study of surface tension and other surface properties is motivated by the large number of industrially relevant processes involving
interfaces, such as coating, detergency, printing, foams, etc. [2] These surface properties become increasingly important as the length scale of the system is reduced (as in microfluidic devices). Often, only the equilibrium properties of the interface are important. However, many practical applications involve surfactant solutions and the creation of new interfaces on time scales smaller than those needed for the interfacial properties to reach equilibrium values. In these cases, the dynamic interfacial properties have the most relevance, and such circumstances have motivated the focus on system dynamics found in the research reported here. Additionally, there is great incentive for being able to control the properties of a system using a particular stimulus, and this is why a responsive surfactant system is chosen for this study.
1.2 Background: Surfactant Behavior
1.2.1 Structure
Most surfactant properties are consequences of their characteristic molecular structure. They typically contain a structural group that has very little attraction for the solvent. known as a
lyophobic group, together with a group that has a strong attraction for the solvent, called the lyophilic group [1]. This is known as an amphipathic structure. Temperature and other factors (e.g., electrolyte concentration) affect the amphipathicity of a surfactant molecule in a particular solvent under a given set of operating conditions. In a polar solvent such as water, the lyophobic group may be a hydrocarbon, fluorocarbon, or siloxane chain of proper length, while an ionic or highly polar group may act as the lyophilic group [1]. Surfactants are often classified based on
the ionic character of their lyophilic group: anionic surfactants bear a negative charge, cationic surfactants bear a positive charge, zwitterionic surfactants have both positive and negative charges present, and nonionic surfactants bear no ionic charge.
1.2.2 Properties
1.2.2.1 Interfacial Adsorption
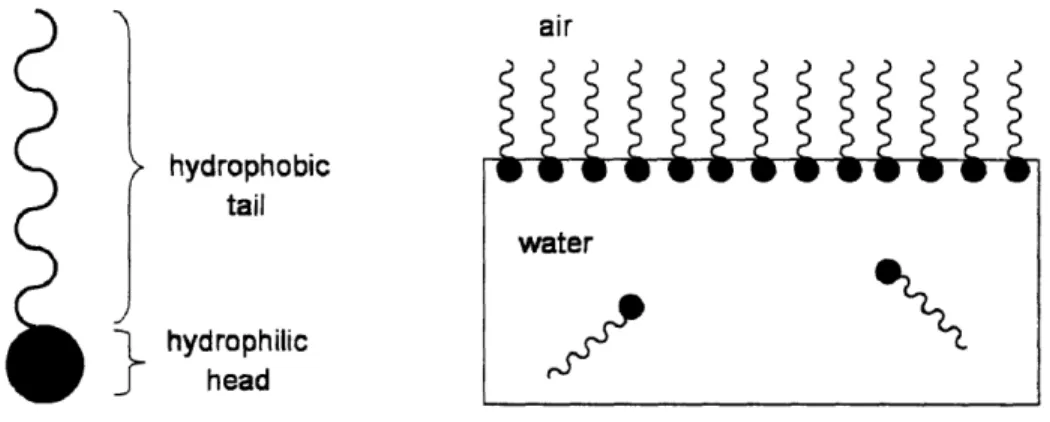
When a surface-active agent is dissolved in a solvent, the presence of the lyophobic group in the interior of the solvent causes a distortion of the solvent liquid structure, increasing the free energy of the system [I]. When the solvent is water, this disruption of the structure of the water molecules and its associated phenomena are referred to as the "hydrophobic effect" [3, 4]. It is therefore more energetically favorable for the surfactant molecule to reside at an interface than in bulk solution. The presence of the lyophilic group prevents the surfactant from being expelled completely from the solvent as a separate phase [1, 3], but surfactant molecules nonetheless accumulate at an interface. This concentration of surfactant at an interface lowers the interfacial free energy or interfacial tension. The surfactant molecule is positioned at the interface such that the lyophilic group remains in the solvent while the lyophobic group oriented away from it. This is illustrated in Figure 1-1 for generic surfactant molecules at an air/water interface.
air hydrophobic tail water
hydrophilic
headFigure 1-1. Cartoon illustration of amphipathic structure of surfactant molecule and of preferential adsorption of
surfactants at the air/water interface when dissolved in water.
1.2.2.2 Self-Assembly
In addition to adsorbing at an interface, surfactant molecules in solution may also decrease the distortion of the solvent structure (and reduce the free energy of the system) by aggregating into clusters (micelles) with their lyophobic groups directed toward the interior of the cluster and their lyophilic groups directed toward the solvent [1]. This is illustrated in Figure 1-2 for generic surfactant molecules in an aqueous solution. Micellization is then another mechanism for removing lyophobic groups from contact with the solvent and minimizing the free energy of the system. This comes at the cost of the reduction of freedom for a surfactant molecule now confined to the micelle, and in the case of ionic surfactants, experiencing electrostatic repulsion from other similarly charged surfactant molecules in the micelle [1]. These forces increase the free energy of the system and therefore oppose micellization. Thus, micellization depends on the balance between factors promoting it and those opposing it.
air
water
monomer
e-v
micelle
Figure 1-2. Cartoon illustration of micelles formed in a surfactant solution at high concentration. This figure
depicts a two-dimensional slice through the micelles, revealing the hydrophobic interior. Micelles are
three-dimensional structures in which the hydrophilic groups shield this hydrophobic core from the solvent (water).
The onset of micelle formation is found to take place at a critical concentration referred to as the critical micelle concentration (CMC). Below the CMC, the surfactant exists primarily as
unassociated molecules, and above the CMC, additional surfactant added to the solution is incorporated into the surfactant aggregates. The formation of micelles in solution is accompanied by a considerable change in many physical properties of the solution: surface tension, electrical conductivity, osmotic pressure, light scattering, dye solubility, etc. [I] As a result, measurements of these properties are used to determine the CMC of a given surfactant
system. For systems not too far above the CMC, the shape of the micelles formed is generally considered to be roughly spherical. Changes in temperature, surfactant concentration, additives in the liquid phase, and structural groups in the surfactant all may cause changes in the size,
shape. and aggregation number (number of surfactant molecules contained in the micelle) of the micelle. with structure varying from spherical to rod- or disk-like to lamellar in shape [5]. In concentrated solutions (ten times the CMC or more), micelles are generally nonspherical.
Worm-like micelles, vesicles, lamellar sheets, and other extended structures (e.g. bicontinuous phases) are all possible shapes for surfactant aggregates [6-10]. Surfactant aggregates are not
static structures. Rather, they are in dynamic equilibrium with individual surfactant molecules which are constantly being exchanged between bulk solution and the aggregates. Additionally, aggregates themselves are continuously disintegrating and reforming [11].
1.2.2.3 Dynamic Surface Tension
As described earlier, surfactant molecules in solution tend to accumulate at an interface and lower its interfacial tension. The creation of fresh interfaces is common in many industrial processes, including those involving coatings, sprays, foams, and emulsions. Just after a new
surface is formed in a surfactant solution, the surface is initially free of surfactant, and the interfacial tension of the surface is the same as that of the pure solvent [12]. As this surface ages. surfactant molecules are delivered to the interface and begin to adsorb, lowering the interfacial tension. This continues until the surface becomes saturated with surfactant and the surface tension* reaches an equilibrium value. The value of surface tension during the course of this adsorption process, which can be measured via tensiometry, bubble pressure, optical
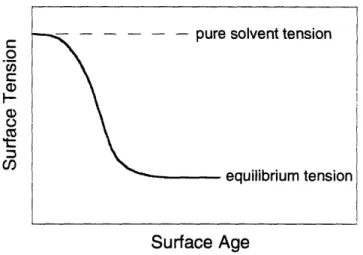
techniques. and various other methods [13]. is referred to as the dynamic surface tension. A typical plot of surface tension versus the age of a surface in a surfactant system shows a dynamic surface tension profile which decreases monotonically from the pure solvent tension value until it reaches the equilibrium tension value, as illustrated in Figure 1-3.
The term "surface tension" is used as a special case of the more general term "interfacial tension" in which one of the phases separated by the interface is gaseous. usually air.
0 Cf)
C
1-CD CU) equilibrium tensionSurface Age
Figure 1-3. Qualitative depiction of typical dynamic surface tension profile after creation of a fresh air/water
interface.
The dynamic surface tension behavior of a surfactant system is influenced by the rate of delivery of surfactant to the interface as well as the thermodynamics that govern how effectively a given
surfactant reduces the tension of a surface once adsorbed [14]. Adsorption of surfactant at the interface can be limited by transport of surfactant to the interface or by additional barriers to adsorption once the surfactant reaches the interface. The most extensively studied case is that of diffusion-limited surfactant adsorption. Ward and Tordai [15] pioneered the modeling of
diffusion-controlled adsorption of monomeric surfactant at a planar interface in 1946, and since then researchers have built upon their work and extended their results to different geometries and more complex systems [16, 17]. Some studies have reported a shift in the controlling
mechanism for adsorption from being diffusion-limited at early times (and low coverage of surfactant at the interface) to being limited by kinetic adsorption barriers or a mixed mechanism at long times (and high surface coverages) [18. 19]. For surfactant systems above the CMC, the presence of micelles or other aggregates in solution adds additional factors to the dynamic adsorption process. When surfactant monomer reaches the interface and adsorbs. the local
monomer supply is depleted and the equilibrium between monomers and aggregates is disturbed. To re-establish this equilibrium, aggregates dissolve to replenish the monomer population. The rate at which aggregates can dissolve then plays a role in the adsorption process [20, 21], as
aggregates which dissolve quickly replenish the monomer supply faster and augment delivery of surfactant to the interface compared to aggregates which dissolve slowly. Additionally, the aggregates themselves can diffuse towards the interface, enhancing adsorption rates by providing a source of surfactant closer to the interface or, as suggested in recent studies, by adsorbing directly to the interface [22, 23].
1.2.2.4 Mixtures
Almost all practical applications involving surfactants employ surfactant mixtures [24-26]. Often, this is due to the difficulty or prohibitive cost of isolating a chemically pure surfactant [24. 26]. Other times, surfactants are deliberately mixed to take advantage of synergism between the individual surfactant species [24, 26]. In some cases, environmental or health concerns require that a mixture of known and approved surfactants be used for a particular application
instead of developing a new surfactant [26]. The widespread use of mixed surfactant systems has led to considerable theoretical and experimental work to understand their properties.
The presence of multiple surface-active species in solution affects the aggregation and adsorption behavior of a system. Mixed micellization occurs when surfactants of different types combine to form aggregates. Binary surfactant mixtures have been the focus of many studies aimed at mixed CMC determination. The variation of CMC with composition in such a system gives an indication of the ideality of mixing in the aggregates [27]. Generally, ideal mixing models have
been successful in describing the CMC behavior of binary ionic [28, 29] and binary nonionic [30] surfactant mixtures, especially for surfactants with the same hydrophilic group. Nonideal mixing effects in the aggregates can result in substantially lower CMCs and interfacial tensions than would be expected based on the properties of the individual components [27]. This type of nonideal mixing is often observed in ionic/nonionic mixtures and anionic/cationic mixtures, and regular solution theory does a good job of modeling many of these systems [31]. Differences between hydrophobic chains in the interior of the aggregates can also be a source of nonideal interactions, so that the ionic character of the headgroup is not the only factor impacting the ideality of mixing. In mixtures of surfactants with unusual hydrophobic groups, such as fluorocarbon or siloxane chains, or of surfactants with unusual structures, sometimes micelle "demixing", or the formation of more than one stable population of aggregates, is observed [27]. Since mixing in aggregates should be favored by entropy, the potential for demixing seems to require a significant physical basis such as immiscibility of hydrophobic groups in the core of the aggregates. or steric effects which restrict mixing based on the molecular geometries of the surfactants [27]. The poor-miscibility criterion is seen most strongly in mixtures of fluorocarbon and hydrocarbon surfactants, and the steric effects are most pronounced in mixtures of
conventional surfactants with bolaform surfactants (which have two hydrophilic headgroups, one on each end of a hydrophobic chain). The mixing behavior in these types of systems is
dependent upon the specific makeup of the surfactants involved (length of hydrophobic chain, size and ionic character of headgroup, etc.), but in many cases, mixing in the aggregates is prevented and segregation occurs [32-34].
Each component in a surfactant mixture will tend to preferentially adsorb to an interface, so these systems exhibit mixed surfactant monolayers at interfaces. Measurements of the surface
pressure (the difference between the pure solution surface tension and the tension in the presence of surfactant) and molar areas of mixed surfactant monolayers performed at various
compositions can give information regarding the impact of each species and of any potential interactions between the adsorbed surfactants [27]. In solutions containing surfactant mixtures in which several species are diffusing and adsorbing to an air/water interface, it has sometimes been observed that one species is significantly more surface active than the others, so that at
equilibrium, the interface will be dominated by this most surface-active species [25, 26]. This competitive adsorption between the different species can lead to interesting dynamic surface tension behavior. If less surface-active species are able to diffuse and adsorb to the interface more quickly than the most surface-active species (by either being present in higher
concentrations or having larger effective diffusion coefficients), then these less surface-active species will initially adsorb to the interface and dominate the interfacial properties before eventually being displaced by the most surface-active species. This can lead to unusual
inflections in a plot of surface tension versus time following creation of a fresh interface [25, 26].
1.3 Background: Responsive Systems
1.3.1 Types of Responsive Systems
Recently. considerable work has been reported on surfactant systems which are responsive to a particular stimulus. such as temperature [35]. pH [36], light [37, 38] or reduction/oxidation (redox) reactions [39. 40]. Many of these responsive surfactant systems allow for in situ and reversible control of surfactant-based properties [41]. giving rise to a variety of potential
applications, including controlled spreading and coating of surfaces [42], controlled droplet release [37], triggered release of substrates from micelles [35], control of protein folding [43], and surface tension-driven (Marangoni) flows [40]. The ability to alter the surface activity and/or aggregation state of a surfactant system in a reversible fashion with spatial and temporal control has enormous potential. Light has an advantage over other external stimuli in that it is non-invasive and readily manipulated. For example, the electrochemical approaches require that electrodes be inserted into the system and thus restrict the possible range of application [37]. By contrast, focusing and patterning of light is easily achieved using optical lenses, filters, and masks.
1.3.2 Photoresponsive Surfactants
Incorporation of a suitable chromophore into a surfactant allows UV and visible light to serve as external triggers for a change in solution properties, eliminating the need for composition or temperature changes [38]. Common photosurfactants contain a photocleavable headgroup [44,
45] or incorporate an isomerizable group, such as azobenzene or stilbene, into the hydrophobic
chain [37, 38]. The surfactant system studied here, first reported by Shang et al. [46], is nonionic and features the azobenzene group in its hydrophobic tail. As reported elsewhere [47, 48]. azobenzene undergoes a reversible photoisomerization upon changes in illumination conditions. The more thermodynamically stable state is the trans form, which has a flat planar structure, as shown in Fieure 1-4a. Illumination with ultraviolet light converts the azobenzene into a bent cis state, which reverts back to the trans form under illumination by visible light or by removal from light for an extended period of time. With this azobenzene group present in the tail of the
ability of the surfactant to pack into adsorbed monolayers at an air-water interface or into
aggregates in solution, thereby causing a significant variation in surface and bulk properties upon changes in the illumination conditions.
(a) UV light/ N visible light or heat N==N trans cis (b)
/
N\
O
C4 Azo0
Ce E2Figure 1-4. (a) Photoisomerization of azobenzene. (b) Molecular structure of the photoresponsive surfactant
C4AzoOC6E2.C4 = butyl tail group; Azo = azobenzene group; 0 = ether oxygen middle polar group; C = alkyl
spacer with 6 methylene groups; E2 = surfactant head group consisting of two ethylene oxide moieties. Figure from
Shang et al. [46].
Aqueous solutions of azobenzene-containing surfactants strongly absorb light of wavelengths near 320-360 nm when in the trans state, with the cis state absorbing strongly near 440-460 nm
rest of the surfactant molecule. Because the absorption bands of the two isomers overlap, illumination cannot be used to drive complete conversion to either the cis or trans isomer [37]. Samples which are illuminated eventually reach a photostationary state containing a mixture of the two isomers. The isomeric composition of the photostationary state depends upon the wavelength of light used for the illumination [50, 51]. Thermal reversion of cis to trans in the
absence of light leads to a sample comprised almost entirely of the trans isomer [50].
1.4 Research Overview
The bulk of this research has been performed to accomplish three main goals: i) study and characterize the equilibrium bulk and surface properties of a photoisomeric surfactant mixture, ii) experimentally determine and theoretically model the dynamic surface tension behavior of such a mixture, and iii) determine the response of the system to illumination. Chapter 2 describes the surfactant used in these studies and the results of UV-Vis absorption and NMR characterization of the surfactant. Chapter 3 discusses Langmuir film balance experiments used to determine the behavior of surfactant monolayers adsorbed at an air-water interface as well as fluorescence experiments used to determine the aggregation behavior of the surfactant in
aqueous solution. The evolution of surface tension after the formation of a fresh interface is presented in Chapter 4. including both experimental results for this surfactant system and the development of simple mathematical models aimed at describing the data. Chapter 5 focuses on the effect of illumination on adsorbed surfactant and offers an interpretation of the results based on earlier monolayer studies. The impact of temperature on the aggregation and dynamic surface tension behavior of the surfactant is described in Chapter 6.
1.5 References
1. Rosen, M.J., Surfactants and Interfacial Phenomena. 1978, New York: John Wiley & Sons.
2. Hiemenz, P.C., Rajagopalan, R., Principles of Colloid and Surface Chemistry. 3rd ed. 1997, New York: Marcel Dekker.
3. Chandler, D., Interfaces and the driving force of hydrophobic assembly. Nature, 2005.
437(7059): p. 640-647.
4. Maibaum, L., A.R. Dinner, and D. Chandler, Micelle formation and the hydrophobic
effect. J. Phys. Chem. B, 2004. 108(21): p. 6778-6781.
5. Windsor. P.A., Binary and multicomponent solutions of amphiphilic compounds.
Solubilizations and the formation, structure, and theoretical significance of liquid crystalline solutions. Chem. Rev., 1968. 68(1): p. 1-40.
6. Anderson, D.M. and H. Wennerstrom, Self-Diffusion In Bicontinuous Cubic Phases, L3
Phases, And Microemulsions. J. Phys. Chem., 1990. 94(24): p. 8683-8694.
7. Gonzalez, Y.I. and E.W. Kaler, Cno-TEM studies of worm-like micellar solutions. Curr. Opin. Colloid Interface Sci., 2005. 10(5-6): p. 256-260.
8. Kostela, J., M. Elmgren, and M. Almgren, Electrochemical properties and diffusion of a
redox active surfactant incorporated in bicontinuous cubic and lamellar phase.
Electrochim. Acta, 2005. 50(16-17): p. 3333-3340.
9. Ott. A., W. Urbach, D. Langevin, and H. Hoffmann, Surfactant Self-Diffusion In L3
Phases. Langmuir, 1992. 8(2): p. 345-347.
10. Shang, T.G., K.A. Smith, and T.A. Hatton, Self-assembly of a nonionic photoresponsive
surfactant under varying irradiation conditions: A small-angle neutron scattering and crvo-TEM study. Langmuir, 2006. 22(4): p. 1436-1442.
11. Patist. A.. S.G. Oh. R. Leung. and D.O. Shah, Kinetics of micellization: its significance to
technological processes. Colloids Surf. A, 2001. 176(1): p. 3-16.
12. Hua. X.Y. and M.J. Rosen, Dynamic surface tension of aqueous surfactant solutions: L
Basic parameters. J. Colloid Interface Sci., 1988. 124(2): p. 652.
13. Chang, C.H. and E.I. Franses. Adsorption Dynamics Of Surfactants At The Air/Water
Inteiface -A Critical-Review Of Mathematical-Models, Data, And Mechanisms. Colloids
Surf. A, 1995. 100: p. 1-45.
14. Ferri, J.K. and K.J. Stebe. Which surfactants reduce surface tension faster? A scaling
argument.for diffusion-controlled adsorption. Adv. Colloid Interface Sci., 2000. 85(1): p.
61-97.
15. Ward. A.F.H., and L. Tordai, Time-dependence of boundary tensions of solutions. I. The
role of diffusion in time-effects. J. Chem. Phys., 1946. 14(7): p. 453-461.
16. Daniel. R.C. and J.C. Berg. A simplified method for predicting the dynamic surface tension of concentrated surfactant solutions. J. Colloid Interface Sci., 2003. 260(1): p.
244-249.
17. Ferri. J.K.. S.Y. Lin, and K.J. Stebe. Curvature effects in the analysis of pendant bubble
data: Comparison of numerical solutions, asymptotic arguments, and data. J. Colloid
Interface Sci.. 2001. 241(1): p. 154-168.
18. Eastoe. J.. J.S. Dalton. P.G.A. Rogueda, E.R. Crooks, A.R. Pitt. and E.A. Simister.
Dynamic surface tensions of nonionic surftictant solutions. J. Colloid Interface Sci.. 1997.
19. Eastoe, J., A. Rankin, R. Wat, and C.D. Bain, Surfactant adsorption dynamics. International Reviews In Physical Chemistry, 2001. 20(3): p. 357-386.
20. Kjellin, U.R.M., J. Reimer, and P. Hansson, An investigation of dynamic surface tension,
critical micelle concentration, and aggregation number of three nonionic surfactants using NMR, time-resolved fluorescence quenching, and maximum bubble pressure tensiometry. J. Colloid Interface Sci., 2003. 262(2): p. 506-515.
21. Liao, Y.C., O.A. Basaran, and E.I. Franses, Micellar dissolution and diffusion effects on
adsorption dynamics of surfactants. AIChE J., 2003. 49(12): p. 3229-3240.
22. Colegate, D.M. and C.D. Bain, Adsorption kinetics in micellar solutions of nonionic
surfactants. Phys. Rev. Lett., 2005. 95(19).
23. Song,
Q.,
A. Couzis, P. Somasundaran, and C. Maldarelli, A transport modelfor theadsorption of surfactantfrom micelle solutions onto a clean air/water interface in the limit of rapid aggregate disassembly relative to diffusion and supporting dynamic tension experiments. Colloids Surf. A, 2006. 282: p. 162-182.
24. Holland, P.M., D. N. Rubingh, Preface, in Mixed Surfactant Systems, P.M. Holland, D. N. Rubingh, Editor. 1992, American Chemical Society: Washington, D.C. p. xi-xii.
25. Mulqueen, M., S.S. Datwani, K.J. Stebe, and D. Blankschtein, Dynamic surface tensions
of aqueous surfactant mixtures: Experimental investigation. Langmuir, 2001. 17(24): p.
7494-7500.
26. Mulqueen, M., K.J. Stebe, and D. Blankschtein, Dynamic interfacial adsorption in
aqueous surfactant mixtures: Theoretical study. Langmuir, 2001. 17(17): p. 5196-5207.
27. Holland. P.M., D. N. Rubingh, Mixed Surfactant Systems: An Overview, in Mixed
Surfactant Systems. P.M. Holland, D. N. Rubingh, Editor. 1992, American Chemical
Society: Washington, D.C. p. 2-30.
28. Barry, B.W., J.C. Morrison. and G.F. Russell, Prediction of the critical micelle
concentration of mixtures of alk-vltrirnethvlammoniurn salts. J. Colloid Interface Sci.,
1970. 33(4): p. 554-561.
29. Shinoda. K.. The critical micelle concentration of soap mixtures (two-component
mixture). J. Phys. Chem., 1954. 58(7): p. 541-544.
30. Clint, J.H., Micellization Of Mixed Nonionic Surface-Active Agents. Journal Of The Chemical Society-Faraday Transactions I, 1975. 71(6): p. 1327-1334.
31. Holland. P.M., Modeling Mixed Surfactant Systems: Basic Introduction, in Mixed
Surfactant Systems. P.M. Holland, D. N. Rubingh, Editor. 1992, American Chemical
Society: Washington, D.C. p. 31-44.
32. Mukerjee. P. and A.Y.S. Yang. Nonideality Of Mixing Of Micelles Of Fluorocarbon And
Hvdrocarbon Surfactants And Evidence Of Partial Miscibility From Differential Conductance Data. J. Phys. Chem., 1976. 80(12): p. 1388-1390.
33. Shinoda. K. and T. Nomura, Miscibility
Qf
Fluorocarbon And Hydrocarbon Surfactants In Micelles And Liquid-Mixtures -Basic StudiesQf
Oil Repellent And Fire Extinguishing Agents. J. Phys. Chem., 1980. 84(4): p. 365-369.34. Zana. R.. Y. Muto. K. Esumi. and K. Meguro, Mixed Micelle Formation Between
Alkyltrimethylammonium Bromide And Alkane-Alpha, Omega-Bis(Trimethylammonium) Bromide In Aqueous-Solution. J. Colloid Interface Sci.. 1988. 123(2): p. 502-511.
35. Nakayama. M. and T. Okano. Intelligent thermoresponsive polymeric micelles for
36. Le Garrec, D., J. Taillefer, J.E. Van Lier, V. Lenaerts, and J.C. Leroux, Optimizing
pH-responsive polymeric micelles for drug delivery in a cancer photodynamic therapy model.
J. Drug Targeting, 2002. 10(5): p. 429-437.
37. Shin, J.Y. and N.L. Abbott, Using light to control dynamic surface tensions of aqueous
solutions of water soluble surfactants. Langmuir, 1999. 15(13): p. 4404-4410.
38. Eastoe, J., M.S. Dominguez, P. Wyatt, A. Beeby, and R.K. Heenan, Properties of a
stilbene-containing gemini photosurfactant: Light-triggered changes in surface tension and aggregation. Langmuir, 2002. 18(2 1): p. 7837-7844.
39. Gallardo, B.S., K.L. Metcalfe, and N.L. Abbott, Ferrocenvl surfactants at the surface of
water: Principles for active control of interfacial properties. Langmuir, 1996. 12(17): p.
4116-4124.
40. Bennett, D.E., B.S. Gallardo, and N.L. Abbott, Dispensing surfactantsfrom electrodes:
Marangoni phenomenon at the surface of aqueous solutions of
(1]-ferrocenylundecyl)trimethylammonium bromide. J. Am. Chem. Soc., 1996. 118(27): p.
6499-6505.
41. Rosslee, C. and N.L. Abbott, Active control of interfacial properties. Curr. Opin. Colloid Interface Sci., 2000. 5(1-2): p. 81-87.
42. Ichimura, K., S.K. Oh, and M. Nakagawa, Light-driven motion of liquids on a
photoresponsive suiface. Science, 2000. 288(5471): p. 1624-1626.
43. Lee. C.T., K.A. Smith, and T.A. Hatton, Photocontrol ofprotein folding: The interaction
of photosensitive surfactants with bovine serum albumin. Biochemistry, 2005. 44(2): p.
524-536.
44. Dunkin, I.R., A. Gittinger, D.C. Sherrington, and P. Whittaker, A Photodestructible
Surfactant. J. Chem. Soc., Chem. Commun.. 1994(19): p. 2245-2246.
45. Dunkin, I.R., A. Gittinger, D.C. Sherrington, and P. Whittaker, Synthesis,
characterization and applications of azo-containing photodestructible surfactants. J.
Chem. Soc., Perkin Trans. 2, 1996(9): p. 1837-1842.
46. Shang, T.G.. K.A. Smith, and T.A. Hatton, Photoresponsive surfactants exhibiting
unusually large, reversible surface tension changes under varying illumination conditions. Langmuir, 2003. 19(26): p. 10764-10773.
47. Hayashita. T., T. Kurosawa, T. Miyata, K. Tanaka, and M. Igawa, Effect
Qf
Structural Variation Within Cationic Azo-Surfactant Upon Photoresponsive Function In Aqueous-Solution. Colloid Polym. Sci., 1994. 272(12): p. 1611-1619.48. Yang, L., N. Takisawa, T. Hayashita, and K. Shirahama, Colloid-Chemical
Characterization Of The Photosurfactant 4-Ethylazobenzene
4'-(Oxvethyl)Trimethylammonium Bromide. J. Phys. Chem., 1995. 99(2 1): p. 8799-8803.
49. Lee, C.T.. K.A. Smith, and T.A. Hatton, Photoreversible viscosity changes and gelation
in mixtures of hydrophobically modified polvelectrolytes and photosensitive surfactants.
Macromolecules, 2004. 37(14): p. 5397-5405.
50. Fisher. E.. M. Frankel. and R. Wolovsky, Wavelength dependence ofphotoisomerization
equilibria in azocompounds. J. Chem. Phys.. 1955. 23: p. 1367.
51. Zimmerman, G.. L.-Y. Chow. and U.-J. Paik. The photochemical isomerization of
Chapter 2
Surfactant Synthesis and Characterization
2.1 Introduction
Azobenzene is a convenient chromophore for use in photoresponsive surfactants because its light-induced isomerization between cis and trans conformations allows for reversible changes in surfactant structure. The impact that these changes have on solution properties depends upon the specific architecture of the surfactant molecule. Careful design of the molecule can lead to maximal changes in the adsorption and aggregation behavior of the surfactant upon illumination. For example, Shin et al. [1] report on the properties of an azobenzene-containing cationic
bolaform surfactant. The two-headed nature of this surfactant causes more constrained
conformations within aggregates or when adsorbed at interfaces, potentially allowing the effects of photoisomerization to be amplified. However, the ionic character of the head groups required that a second, anionic surfactant be added to the solution in order to reduce the average area occupied by these head groups (as electrostatic repulsion would cause a larger effective area for a system containing only cationic head groups), so that the effect of the conformation changes could truly be maximized [1]. With a mixture of this photosurfactant and SDS, the researchers reported substantial changes in the extent of aggregation and the dynamic surface tension of the
system upon illumination.
Shang et al. [2] have developed a nonionic surfactant which incorporates the azobenzene group into its hydrophobic tail. The lack of ionic charge on the head group allows for close packing of these head groups without addition of a second surfactant species into solution. This permits changes in tail conformation caused by illumination to have a strong impact on the adsorption
capacity of the surfactant and the structure of aggregates formed in solution. This is the surfactant studied and reported here, and a description of its synthesis and characterization follows in this chapter.
2.2
Experimental
The photoresponsive surfactant synthesized for these studies is shown in Figure 2-1. The azobenzene group is located within the tail and separated from the ethylene oxide head group by an alkyl spacer of six methylenes. This surfactant is termed C4AzoOC6E2, or simply C6.
/N
/N\
O/OC4 Azo 0 C6 E2
Figure 2-1. Molecular structure of the photoresponsive surfactant C4AzoOC6E2. C4 = butyl tail group; Azo =
azobenzene group: 0 = ether oxygen middle polar group; C6 = alkyl spacer with 6 methylene groups: E2 = surfactant
head group consisting of two ethylene oxide moieties. Figure from Shang et al. [2].
2.2.1 Materials
4-butylaniline (97%), sodium carbonate (99.95%), phenol (99+ %), di(ethylene glycol) (99%), 1.6-dibromohexane (96%). bis(trimethylsiyl)trifluoro-acetamide (99+%), and sodium hydride (95%) were purchased from Aldrich (Milwaukee. WI). Sodium nitrite (AR grade), potassium hydroxide (AR grade), hydrochloric acid (37%). and sodium hydroxide (AR grade) were obtained from Mallinckrodt Baker (Paris. Kentucky). and tetrahydrofuran and hexane from EM Science (Gibbstown. NJ). All chemicals were used as received without further purification.
2.2.2
Surfactant Synthesis and Structure
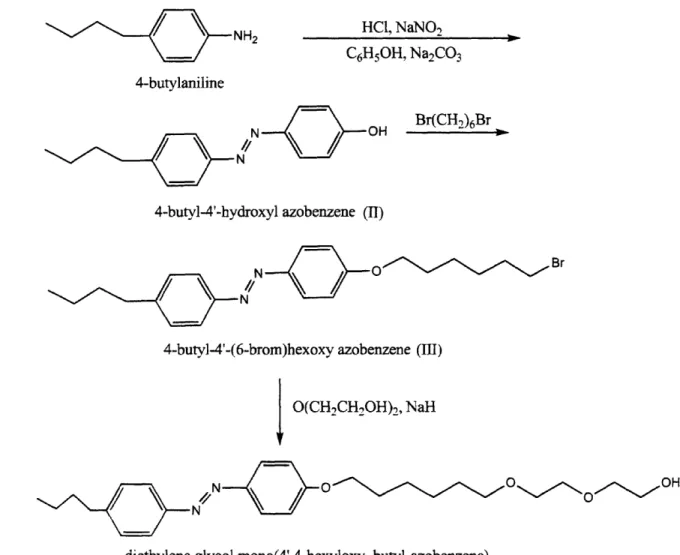
The procedure for synthesis of this surfactant has been laid out in detail by Shang [3], and a schematic of the synthesis pathway is shown in Figure 2-2. A brief outline is as follows: 4-butyl-4'-hydroxyl azobenzene (II) was prepared by dissolving 14.9 g of 4-butylaniline in 64 ml of 5M hydrochloric acid and reacting it with 15 ml of aqueous sodium nitrite (6.7 M) at 0 *C
for one hour. The resulting diazonium solution was then coupled with phenol in a slurry (9.4 g phenol + 26.5 g sodium carbonate + 50 ml MilliQ water) at 0 *C for one hour. The product was
collected by filtration, dried in a vacuum oven over night, and purified by recrystallization in hexane.
4-butyl-4'-(6-brom)hexoxy azobenzene (III) was prepared by first dissolving 10 g (II) in 40 ml THF, and adding this solution dropwise to a mixture of 24.4 g 1,6-dibromohexane, 4.5 g potassium hydroxide and 200 ml THF. The mixture was allowed to reflux for 19 hours, and was then extracted with dichloromethane. After the solvent was removed by rotary evaporation, the product was further purified by recrystallization from a hexane/THF mixture (80/20 volume ratio).
Diethylene glycol mono(4',4-hexyloxy, butyl-azobenzene) (C4AzoOC6E2) To prepare C4AzoOC6E2,. 2 g of sodium hydride was first reacted with 22 g of di(ethylene glycol) in 80 ml
THF under N2 protection for 2 hours. A solution of 4.1 g (III) with 40 ml THF was added dropwise into this reaction mixture. and the resulting solution was refluxed for 64 hours under N2. The solvent was removed from the reaction mixture by rotary evaporation, and vacuum
chromatography (60
A
silica; ethyl ether/ methanol as eluent), and further purified by recrystallization from hexane.I H-NMR, mass spectrometry, and gas chromatography were all used to analyze and verify the molecular structure of the surfactant.
NH2
HC, NaNO
2 C6HsOH, Na2CO3 4-butylaniline Br(CH,)6Br/\
N OH~ N4-butyl-4'-hydroxyl azobenzene (II)
Br
N
4-butyl-4'-(6-brom)hexoxy azobenzene (III)
O(CH-,CH2OH)
2, NaH
N N O/
OH
diethylene glycol mono(4',4-hexyloxy, butyl-azobenzene)
Figure 2-2. Schematic of the synthesis pathway for the surfactant C4AzoOC6E2.
2.2.3
Illumination
The light source used for illumination of surfactant solutions was ordinarily a 200 W mercury lamp (Oriel 6283) mounted in an arc lamp housing (Oriel 66902) and powered by an arc lamp
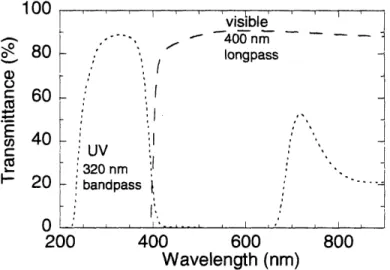
power supply (Oriel 68910). A heat absorbing filter (Oriel 59042) was placed in the path of the light to reduce heating of samples during illumination. Visible light passed through a 400 nm longpass filter (Oriel 59472), while a 320 nm bandpass filter (Oriel 59800) was used for UV light. Characteristics of these optical filters are given in Figure 2-3.
100L 1001. visible - 400inm o 80 longpass C 60 40 -C L UV 320 nm 20 :bandpass 0 -I--200 400 600 800 Wavelength (nm)
Figure 2-3. Characteristics of the optical filters used to illuminate samples to photostationary states before making
physical measurements.
2.2.4 Characterization Methods
Equilibrium properties for the system were required to enable proper interpretation of the dynamic results and were established by using UV-Vis, NMR, Langmuir film balance, and fluorescence measurements. The UV-Vis and NMR results are reported here, while discussion of the Langmuir film balance and fluorescence measurements follows in the next chapter.
2.2.4.1 UV-Vis Absorption
UV-Vis absorption spectra were obtained with a Hewlett-Packard HP 8453 spectrophotometer. Surfactant solutions were contained in a quartz cuvette with a 1 cm path length. Measurements
were taken under three different illumination conditions: first, samples were removed from all light and kept in the dark for several days. Next, samples were exposed to visible light using the optical filter described above. Measurements were taken until the absorbance spectrum of the sample ceased to change appreciably upon further illumination. This indicated attainment of a photostationary state [4]. Finally, samples were exposed to UV light (using the appropriate optical filter) until a different photostationary state was reached. These absorbance
measurements were repeated at various surfactant concentrations to determine the molar absorptivity of the solutions.
2.2.4.2 NMR
'H NMR scans were obtained at 500 MHz with a Varian Inova-500 NMR Spectrometer. In these studies, solid samples of surfactant were dissolved in deuterated chloroform (CDC 3), scanned
and analyzed, and the protons associated with each photoisomer were identified. Integration of these peaks provided estimates of the cis/trans composition of each sample. Ideally, deuterium oxide (D2O) would have been used as the solvent in these experiments due to its similarity to
water. but the extremely low critical micelle concentrations (CMCs) of these surfactants in water (in the micromolar range, as first determined by Shang et al.[2], and re-established by
fluorescence measurements discussed later) caused overlap of the signal and prevented trans and
![Figure 3-5. Cryo-TEM images of 600 pM samples obtained by Shang et al. [7] (a) Vesicles formed in dark- dark-adapted sample](https://thumb-eu.123doks.com/thumbv2/123doknet/14754952.582037/52.918.355.748.526.816/figure-images-samples-obtained-shang-vesicles-formed-adapted.webp)
