Edge Fracture of AHSS Sheets Under Out-of-plane
Loading Followed by In-plane Loading
by
Kai Wang
B.S., Automotive Engineering, Tsinghua University, Beijing, China
(2007)
M.S. Mechanical Engineering, Tsinghua University, Beijing, China
(2010)
Submitted to the Department of Mechanical Engineering
in partial fulfillment of the requirements for the degree of
Doctor of Philosophy in Mechanical Engineering
at the
MASSACHUSETTS INSTITUTE OF TECHNOLOGY
co U) o C w F-2 0 z - = cLL9 x
<l
50
C IL] WI < 0( C/)June 2015
@
Massachusetts Institute of Technology 2015. All rights reserved.
A uthor ...
Signature redacted
partment of Mechanic/ Engineering
,A
April 29th, 2015
Signature redacted
Certified byT...
...
Tomasz Wierzbicki
Accepted by...
Professr of Applied Mechanics
/
4 Tesp upmor
Signature redacted
...
David E. Hardt
Chairman, Department Committee on Graduate Students
Edge Fracture of AHSS Sheets Under Out-of-plane Loading
Followed by In-plane Loading
by
Kai Wang
Submitted to the Department of Mechanical Engineering on April 29th, 2015, in partial fulfillment of the
requirements for the degree of
Doctor of Philosophy in Mechanical Engineering
Abstract
In recent years edge fracture has become a challenge in the manufacturing indus-try with the dramatical increase in the application of light-weight materials such as Advanced High Strength Steels (AHSS) and aluminum alloys. A premature edge cracking is observed in components with blanked/trimmed/pierced edges during the subsequent metal forming process. To understand the underlying physical mecha-nism and to establish a reliable CAE model, the thesis carries out a comprehensive experimental and numerical investigation on edge fracture of a commercially available DP780 steel sheet. The study reveals that it is the substantial plastic deformation introduced during the out-of-plane sheet blanking process that compromises the ma-terial ductility within the Shear Affected Zone (SAZ), and subsequently causes the edge to fracture prematurely under the in-plane edge stretching. To simulate the fracture behavior under such a complex a loading path, the fracture initiation is modeled using the concept of a scalar damage indicator that consists of two parts which are accumulated at different stages. The first one is accumulated during the sheet blanking process, referred to as pre-damage, while the second part is produced by the following metal forming. In such a modeling frame work, a corner stone is to determine the first part of pre-damage within the SAZ. This is achieved by a hybrid experimental and numerical method. Aided by microscopic examinations on cracked surfaces, the study shows that the pre-damage distribution within the SAZ follows an exponential function that drops from the critical value of unity at the edge sur-face to zero over the width of the SAZ. The obtained pre-damage is then introduced as the initial damage value during the following metal forming process. Based on a detail experimental characterization, a plasticity and fracture model is introduced to describe the material behavior under investigation. The model is based on the von Mises yield condition, a non-associated Hill'48 flow potential and an isotropic harden-ing law, together with the MMC fracture locus description with dependence on both stress triaxiality and Lode angle parameter. The proposed model successfully predict edge fracture in numerical simulation.
Thesis Supervisor: Tomasz Wierzbicki Title: Professor of Applied Mechanics
Acknowledgments
I would like to express my most sincere gratitude to my thesis advisor Professor Tomasz Wierzbicki for his continuous guidance and support throughout the years of my stay at MIT in the Impact and Crashworthiness Lab. Without his insightful and knowledgeable guidance as well as his full trust on me, the thesis research could not have moved on so smoothly. I got many constructive comments from the members of my Ph.D thsis committee, Professor Dirk Mohr from Ecole Polytechnique, Professor David Parks from the Department of Mechanical Engineering and Professor Raul Radovitzky from the Department of Aeronautics and Astronautics at MIT. I am deeply in debt to all of them.
Special thanks are due to Dr. Ming F. Shi of US Steel for kindly helping me to pierce the hole in the specimen for hole expansion test and also for important discussion. I feel grateful to Dr. Lars Greve of Volkswagen (Germany), Dr. Benjamin Hackle and Dr. Patrick Larour of Voestapine (Austria) for their valuable discussions. It has been a great pleasure of mine to become a member of the Impact and Crashworthiness Lab. I would like to take this opportunity to thank all my colleagues for their kind support: Dr. Meng Luo, Dr. Yong Xia, Dr. Allison Beese, Dr. Dunand Matthieu, Dr. Kirki Kofiani, Dr. Elham Sahraei Esfahani, Dr. Marcelo Paredes, Mr. Stephane Marcadet, Mr. Vagelis Koutsolelos, Mr. Xiaowei Zhang, Mr. Keunhwan Pack, Mr. Colin Bonatti, Mr. Rami Abi Akl, Mr. Thomas Tancogne Dejean and Ms. Barbara Smith.
I also want to thank all my dear friends who showed me continuous care and helped me through all the tough time during my thesis research, especially Mr. Xin Zhao, Mr. Jiayin Ling, Ms. Likun Zhang and many others.
The financial support of my work through the MIT Industrial Fracture Consortium is gratefully acknowledged.
Finally, I would like to express my deepest thanks to my dear family for their unconditional love and unyielding support. It is because of them that I am brave enough to face all the challenges and pass all the obstacles.
Contents
1 Introduction
1.1 Plasticity and ductile fracture modeling . . . . 1.2 Current status of edge fracture study . . . . 1.3 Thesis outline . . . .
2 Material Characteriaztion
2.1 Introduction . . . . 2.2 Plasticity testing and modeling . . . . 2.2.1 Anisotropy . . . . 2.2.2 Calibration of the plasticity model . . . . 2.3 Fracture characterization for crack-free material . . . . 2.3.1 Fracture Modeling . . . . 2.3.2 Fracture Testing . . . . 2.3.3 Fracture model calibration . . . . 2.4 Model verification . . . . 2.5 Summary and conclusion . . . .
3 Edge Fracture Experimental Characterization and FE simulation of
Crack-free Material 57
3.1 Introduction . . . . 58
3.2 Hole expansion test . . . . 59
3.2.1 Test procedure . . . . 61 3.2.2 Test results . . . . 63 7 23 25 26 32 37 37 39 39 40 46 46 47 49 53 54
I
3.2.3 Application of non-contact measurement in HET . . . . 65
3.2.4 Cracks orientation and distribution . . . . 67
3.3 Tension test on central hole specimen . . . . 69
3.3.1 Test procedure . . . . 69
3.3.2 Test results . . . . 71
3.3.3 Interpretation of test results from CHT . . . . 72
3.4 Finite element simulation on un-cracked material . . . . 75
3.4.1 Model description . . . . 75
3.4.2 Simulation results . . . . 76
3.4.3 Crack path in thickness direction . . . . 80
3.5 Finite element analysis of crack initiation and propagation . . ... . . 82
3.6 Analytical solution of hole expansion test . . . . 85
3.7 Summary and conclusions . . . . 89
4 Sequential Simulation of Edge Fracture 93 4.1 Introduction . . . . 93
4.2 Plasticity and fracture model . . . . 95
4.3 Model description . . . . 98
4.4 R esults . . . . 101
4.5 Periodic distribution of cracks . . . . 105
4.6 Prediction of HER in one-stroke simulation . . . . 105
4.7 Summary and Conclusion . . . . 107
5 Experimental and Numerical Study on Plane-strain cess 5.1 Introduction ... 5.2 Test program . . . . 5.2.1 Test apparatus design and test setup 5.2.2 Blanking deformation measurement 5.3 Test results . . . . 5.3.1 Sheet blanking sequence . . . . Blanking Pro-109 . . . . 110 . . . . 114 . . . . 115 . . . . 116 . . . . 118 . . . . 118
5.3.2 Load displacement response and local extensometer history 5.3.3 Edge profile and surface quality observation . . . . 5.3.4 Interrupted test . . . . 5.3.5 Limitation of the current test . . . . 5.4 FE sim ulation . . . . 5.4.1 Preliminary model . . . . 5.4.2 Simulation results of preliminary model . . . . 5.4.3 Out-of-plane compression test and non-associated flow rule 5.4.4 Boundary condition improvement . . . . 5.4.5 On specimen penetration . . . . 5.4.6 FE simulation results . . . . 5.5 Summary and conclusion . . . .
6 Pre-Damage Mapping Model for Edge Fracture Prediction 6.1 Introduction ...
6.2 PDM model with detail variable mapping ... 6.2.1 M ethodology ...
6.2.2 R esults . . . . 6.3 Simplified PDM model with 1D pre-damage distribution . . . 6.3.1 M ethodology . . . . 6.3.2 R esults . . . . 6.3.3 Shell element simulation . . . . 6.4 Concluding remarks ...
7 Model for Quick Evaluation of Edge Fracture Prediction 7.1 Introduction ...
7.2 Pre-damage distribution within a manufactured edge . . . . . 7.2.1 A phenomenological model of pre-damage distribution 7.2.2 Microscopic observation on the hole expansion . . . . . 7.3 Interrupted Hole Expansion Test . . . . 7.4 Calibration of the pre-damage distribution in a blanked edge .
121 122 123 125 127 127 128 130 138 141 142 145 149 . . . . 149 . . . . 151 . . . . 151 . . . . 154 . . . . 155 . . . . 155 . . . . 157 . . . . 158 . . . . 159 161 . . . . 161 . . . . 163 . . . . 163 . . . . 165 . . . . 167 . . . . 168 "Ww
7.5 Parametric study on pre-damage distribution . . . . . 7.5.1 Tool sharpness and alignment . . . . 7.5.2 Plasticity and fracture parameters . . . . 7.6 Model application and simulation results . . . . 7.6.1 Effects of pre-damage in the distal end of SAZ 7.6.2 M esh size effect . . . . 7.7 Summary and conclusion . . . .
. . . . 172 . . . . 172 . . . . 173 . . . . 177 . . . . 178 . . . . 179 . . . . 183
8 Summaries and Future Work
8.1 Summary of main results ...
8.1.1 Plasticity and fracture characterization and modeling of AHSS 8.1.2 Experimental study on edge fracture . . . . 8.1.3 Numerical simulation of edge fracture . . . . 8.1.4 Pre-damage distribution within the SAZ . . . . 8.2 Suggestions for future studies . . . .
187 187 187 188 189 190 191
List of Figures
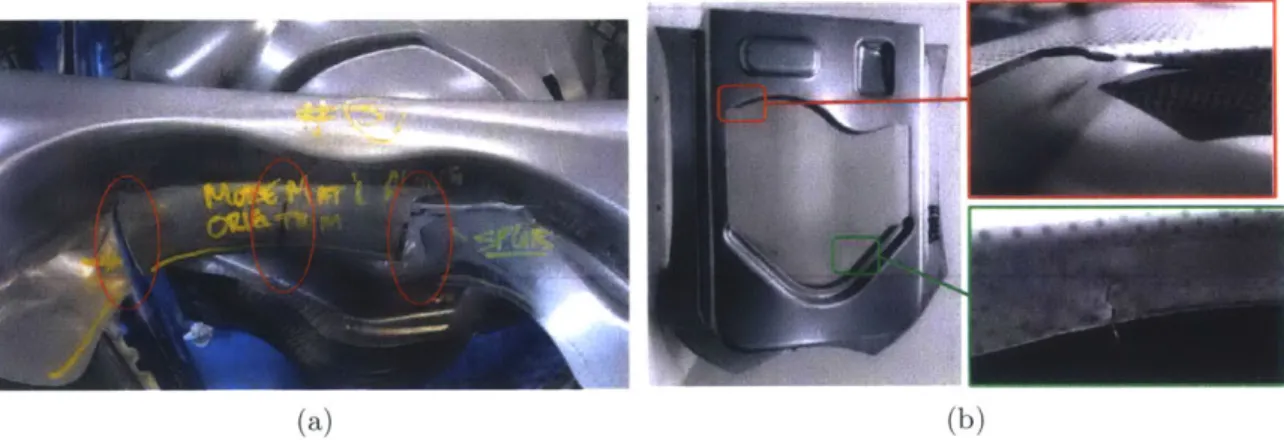
1-1 Edge fracture observed on components during the forming process.
Photograph courtesy of (a) US steel and (b) Voestalpine (Linz). . . . 24
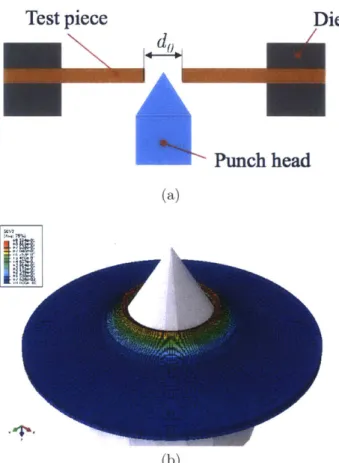
1-2 Schematics of conical hole expansion process and a typical plastic strain distribution within the specimen. . . . . 28 1-3 Results of (a) hole expansion using flat punch and (b) Nakajima and
Marciniak punch test on FLC samples showed a hot spot away from the edge [37]. . . . . 29 1-4 Illustrative damage indicator distribution of a dog-bone specimen
sub-jected to tension. . . . . 29 1-5 (a) Illustrative middle section profile showing the specimen thickness
change and (b) plastic strain distribution around a localized neck-ing at different load level before fracture durneck-ing a dog-bone specimen tension[36. . . . . 32
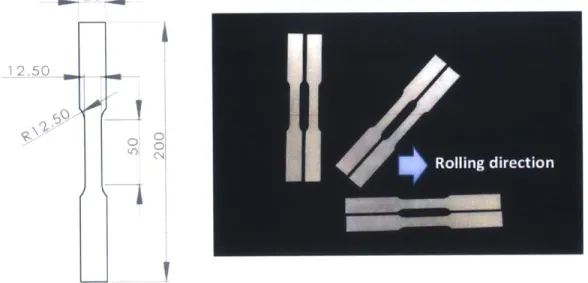
2-1 (a) Illustrative micro-structure of a DP steel. Photo curtesy of World Auto Steel. (b) Micro structure of the current DP780 steel under investigation. Surface processed by 3.5% nital and 96.5% ethanol for one m inute. . . . . 38 2-2 Geometry of uniaxial tension specimens (dimensions in mm; specimen
thickness is 1.6mm). Specimens are cut at 0, 45 and 90 degrees to the rolling direction . . . . 41 2-3 Stress strain curves of dog-bone tension tests in three directions for
2-4 Identification of a reliable strain hardening curve to large strains. (a) Choices of the strain hardening extrapolations. (b) Predictions of the force-displacement response using different stress-strain curves. Refer to Table 2.4 for the Swift law parameters. (c) Finite element model used for the numerical analysis, only 1/8 of the specimen was simulated considering symmetry. . . . . 45 2-5 Schematics of the dual-actuator loading frame [53]. . . . . 49
2-6 FE mesh for each of the four fracture specimen and locations of critical elements for fracture initiation: (a) notched tension specimen, (b) ten-sion specimen with a center hole, (c) equi-biaxial punch disk specimen (d) biaxial butterfly specimen. . . . . 50
2-7 Load displacement response of tests for fracture model calibration, test data compared with simulation. . . . . 51
2-8 Loading paths at the critical material points of the specimens: (a) for all eight experiments in the space of (ip, 7, j) ; (b) for all eight experiments in the space of (rp, q). . . . . 52
2-9 MMC fracture envelope for the present DP780 steel showing the equiv-alent strain to fracture as a function of the stress triaxiality q and the Lode angle parameter 9. The black trajectories denote the loading path of the eight experiments which are used for calibration and validation.
(a) general envelope in 3D space, (b) plane-stress loading condition. . 53
2-10 Verification of the plasticity model using tension tests on notched spec-im en . . . . 54
3-1 Schematic of the hole piercing tools . . . . 61
3-2 Test machine set up and clamping tool for hole expansion test . . . . 62
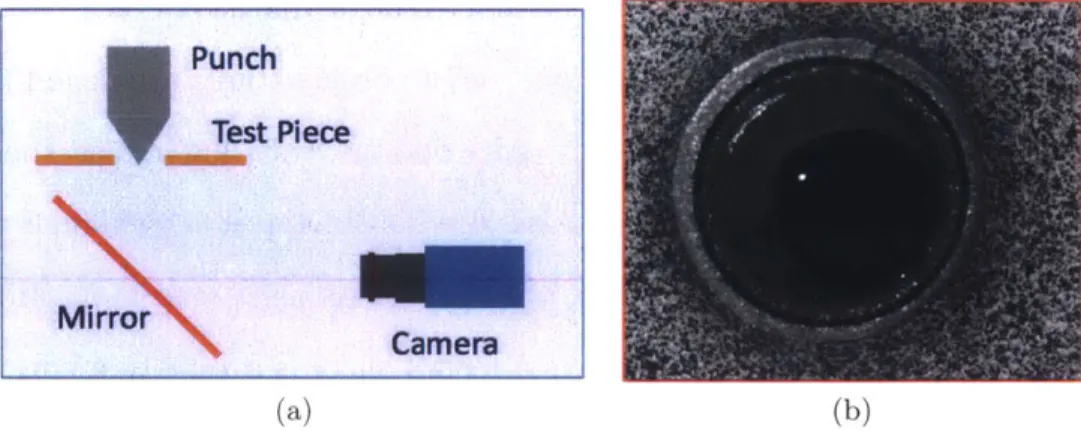
3-3 (a) Schematic of camera arrangement in a hole expansion test, (b) captured image of specimen after fracture observed . . . . 64
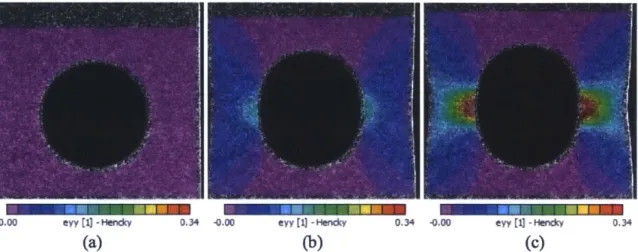
3-4 Contour plots of major logarithmic strain at three different punch head displacements during a hole expansion test measured by 3D DIC,
iso-metric and top view . . . . 65
3-5 Correction of the inner hole diameter measured from DIC. (a) points measured in DIC, (b) points tracked in FE analysis, point 1 is at hole edge, point 2 correspond the pixel tracked in DIC, (c) ratio of diameter measured at point 1 and point 2 as a function of punch displacement. 66 3-6 HER in four tests on water jet cut specimen . . . . 67
3-7 Crack distribution for different type of edge . . . . 68
3-8 Crack orientation and propagation in hole expansion tests . . . . 69
3-9 Shear band field at a round edge [51]. . . . . 69
3-10 CT specimen and the equivalent plastic strain distribution within the specim en . . . . . .70 3-11 (a) Specimen schematic diagram of the central hole specimen, and the locations to extract displacement results in DIC. (b) Load displacement response from the tensile test. . . . . 71
3-12 Contour plots of logarithmic axial strain (tensile direction) at three different piston displacements during a tension test on central hole specim en. . . . . 72
3-13 No obvious localized necking around fracture . . . . 73
3-14 Logarithmic axial strain contour measured by 2D DIC on last frame before fracture of central hole specimen . . . . 74
3-15 Strain distribution and extrapolation of one hole expansion test . . 74
3-16 Summary of strain at fracture. For HET the strain is taken from HER. For central hole specimen tension the strain is taken as the maximum local surface strain at the hole edge. The red tag over each bar denotes the standard deviation of corresponding test results . . . . 75
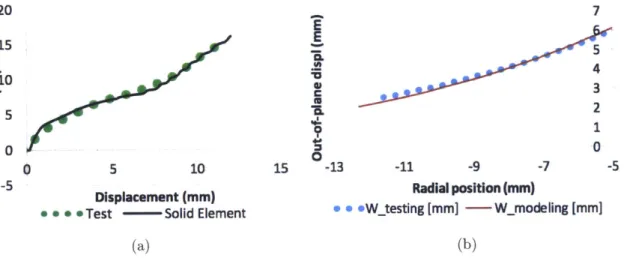
3-18 (a) Load displacement response of hole expansion test, testing vs. sim-ulation (black solid curve), (b) distribution of out-of-plane deflection with respect to distance to hole center at fracture . . . . 77 3-19 Inner diameter measurement after first through thickness crack
devel-ops, color code is damage indicator . . . . 78 3-20 (a) Local extensometer marked by the two red dots, and the middle
cross section marked by a yellow dashed line, (b) Local deformation history with respect to the overall displacement, (c) Strain distribution in the middle cross section (yellow dashed line in (a)) right before crack is observed. Radial distance is measured from the hole edge . . . . . 79 3-21 Perpendicular crack path in thickness direction predicted by FE
simu-lation with 0.1mm mesh. . . . . 80 3-22 Crack path predicted by FE simulation using 0.01mm solid elements,
compared with SEM observations of a milled specimen after hole ex-pansion test. The color code of the simulation result is damage indicator. 81 3-23 Damage accumulation and crack initiation during hole expansion test.
Modeling with Hill 48 yield condition and associated flow rule . . . . 83
3-24 Damage accumulation and crack initiation during hole expansion test. Modeling with isotropic material and associated flow rule . . . . 84 3-25 Specimen profile after hole expansion test, (a) View on specimen cross
section, (b) Specimen profile taken from scanner compared with loga-rithm ic curve . . . . 85 3-26 Coordinate definition for analytical formulation . . . . 86 3-27 Hoop strain distribution and evolution measured from FE simulation
at different punch head displacements. Comparison was made between numerical simulation and analytical solution at wo = 5mm (red dashed curve and red solid curve). . . . . 87 3-28 Relationship between punch head movement J and specimen deflection
3-29 Load displacement curve of hole expansion test, testing vs. analytical solution. . . . . 89
4-1 Summary of hole expansion test results. . . . . 94 4-2 Optimize the extrapolation of stress strain curve. (a). Stress-strain
curves from test and different extrapolations (b). Load displacement curves of notched specimen tension test and the FE simulation results. 96 4-3 Finite element model and the simulation results compared with testing
results. The conical head is modeled as analytical rigid body in Abaqus 98 4-4 Schematic of one-stoke simulation . . . . 99 4-5 FE mesh of the disk for hole punching simulation . . . . 100 4-6 FE simulation results of the hole-punching process, color code is
dam-age indicator D . . . . 101 4-7 (a) Interrupted blanking test setup. (b) The blanking crack initiation
and propagation sequence observed in tests. . . . . 102 4-8 Blanking sequence predicted by 2D plane-strain elements for die
clear-ance of 5% . . . . . 103 4-9 Blanked edge profile of (a) FE simulation and (b) test result at blanking
die clearance was 5%. . . . 104 4-10 Hole expansion simulation results with FE model of 0.01mm mesh size 106 4-11 HER prediction compared with test results . . . 107 5-1 (a) Schematics of the blanking process, (b)a typical blanked-edge profile[42] 110 5-2 Illustrations of (a) hole piercing process and (b) symmetric plane-strain
blanking process . . . 115 5-3 (a) Illustration of the plane-strain blanking tools. (b) drawing of the
tested specim en . . . . 116 5-4 Test setup and DIC deformation measurement using a microscope . . 117 5-5 Speckle patter created by (a) spray can and (b) air brush under
5-6 Blanking test sequence measured by DIC, color code of the contour is eXY, C L = 20% . . . . 119 5-7 Different strain components right before crack formation measured by
DIC, (a) Exy, (a) ex, (a) yy . .. . . .... .. . ... ... ... ... 120
5-8 Load displacement response and the evolution of the local displacement of blanking tests with different die clearances. There are two repeats of each die clearance. . . . 122 5-9 Blanked edge profile of different die clearance: (a) 5%, (b) 20% and
(c) 40% . . . 123 5-10 New surface created by blanking under SEM observation, CL=20%.
(a) The whole banked edge surface, (b) burnished zone, (c) transition zone at the border of burnished zone and rupture zone (d) shear zone in the middle of the thickness direction . . . . 124 5-11 Interrupted test results, crack formation and propagation sequence at
die clearance of 5% . . . . 125 5-12 Only one crack is formed during blanking with large die clearance of
C L= 40% . . . . . 126 5-13 Free side surface observed by the camera is different from inner cross
section of the specimen which undergoes plane-strain loading condition 127 5-14 2D plane-strain model for blanking simulation . . . . 128 5-15 Blanking simulation results of the preliminary FE model in comparison
with test results. (a) edge geometry comparison, (b) load displacement response, (c) local extensometer history, as indicated by Figure 5-8a . 129 5-16 Five layers of specimens upset during an out-of-plane compression test. 131 5-17 (a) Displacement information is extracted from the compression plates.
(b) Load displacement response of pre-compression on the specimen assem bly. . . . . 132 5-18 (a) illustration of the compliance within the test setup. (b) Stress
strain curve after excluding the elastic deformation within the test setup. 132 5-19 Stress strain curve in the thickness direction. . . . . 134
5-20 Mini dog-bone specimen subjected to compression and the FE mesh used during the simulation. . . . . 137 5-21 Specimen thickness reduction during three compression tests in the
thickness direction, simulation v.s. test result. . . . . 138 5-22 (a) displacement of the blanking tools during the test. (b) Tool gap
change due to the relative movement between die and punch during the test . . . . 139 5-23 Deformation in the blanking tools during the test. (a) Locations where
the strain information was extracted using DIC, (b) deformation his-tory of location 1, (c) deformation hishis-tory of location 2. . . . . 140 5-24 Blanking tool radii measured from the edge profile after test . . . . . 140 5-25 Improvements in boundary conditions of simulation to stay more
con-sistent with the actual blanking tests . . . . 141 5-26 Penetration happens during the simulation due to insufficient contact
definition. . . . . 142 5-27 Additional contact definition avoids penetration of the specimen into
the punch head. . . . . 142 5-28 (a) load displacement response and (b) local extensometer history from
blanking simulation with the improved boundary conditions. Simula-tion compared with test results. . . . . 143 5-29 Comparison of the specimen profile between test and simulation, red
dashed lines denotes the FE simulation. . . . . 144 5-30 Crack formation and propagation sequence during blanking with die
clearance of 5% predicted by FE simulation, which has a close correla-tion with test results in Figure 5-11. Contour plots are the simulacorrela-tion results and the color code is damage indicator. . . . . 144 5-31 FE prediction showed that only one crack is formed during blanking
with large die clearance of 40%, which agrees with the test result in Figure 5-12. The contour illustrates damage indicator. . . . . 145
5-32 Predicted edge profile .shows a quantitative correlation with the test data. (a) CL=5%, (b) CL=40%. . . . . 146 6-1 2D axisymmetric FE mesh of the disk for hole punching simulation . 151 6-2 Schematic of PDM model with edge geometry and state variables
mapped in detail. (a) Blanking simulation to obtain details about the blanked edge, (b) Variable mapping from the 2D model of Step I into the coarse solid element mesh for Step II simulation. . . . . 153 6-3 (a) FE simulation on crack-free material failed to predict the slant
fracture orientation. (b) PDM model accurately captures the slant fracture, as well as the periodic distribution of multiple cracks. . . . . 154 6-4 Damage and plastic strain distribution of blanked edge of four different
die clearances. Distance to hole edge was normalized by sheet thickness (a) Equivalent plastic strain, (b) Damage Indicator . . . . 156 6-5 (a) Average damage distribution and the discretization of
pre-damage. (b) Five layers of elements prescribed pre-damage and resid-ual strain in hole expansion test . . . . 156 6-6 Crack orientation and distribution in HET simulation, with and
with-out pre-dam age . . . . 158 6-7 Initial state of the shell element model, with pre-damage mapped in SAZ 158
7-1 Surface quality result from different machining techniques. . . . . 164 7-2 Schematic pre-damage distribution caused by different machining
tech-nique . . . . 164 7-3 Micro-cracks are observed everywhere on the blanked edge after hole
expansion test . . . . 165 7-4 Micro-cracks are also observed everywhere on the milled edge after hole
expansion test . . . . 166 7-5 Different crack patterns were predicted by model with pre-damage and
without pre-damage. . . . . 167 7-6 Hole expansion tests on milled specimens interrupted at different stages.168
7-7 Surface quality result from different machining techniques. . . . . 169 7-8 Finite Element model used for blanking simulation . . . . 170 7-9 Pre-damage distribution predicted by FEA. In the abscissa of (b), the
distance to the edge is normalized by the sheet thickness. . . . . 171 7-10 Pre-damage and residual equivalent plastic strain (PEEQ) distribution
of edges blanked at different die clearances. . . . . 171 7-11 Average pre-damage distribution at different die clearances and the
one-parameter model fitting. . . . . 172 7-12 Pre-damage and residual equivalent plastic strain (PEEQ) distribution
of edges blanked at different die clearances . . . . 173 7-13 Pre-damage distribution of artificial materials with different Swift law
hardening parameters. . . . . 175 7-14 Pre-damage distribution of artificial materials with different MMC
fracture parameters. . . . . 176 7-15 Discretization of pre-damage from the one-parameter exponential
dis-tribution and the shell element model initialization. . . . . 177 7-16 FE simulation result of the one parameter pre-damage model. . . . . 178 7-17 Four different mesh size are used in mesh-size effect investigation. . . 179
7-18 Pre-damage discretization for mesh size of (a) 0.2mm, (b) 0.5mm and (c)1.Om m . . . . 181 7-19 HER prediction results by model with different mesh sizes. . . . . 181 7-20 Pre-damage in the element is chosen as the average level of the
concen-trated region, which covers 85% of all the pre-damage when element size is larger than the concentrated region. . . . . 182 7-21 HER prediction results by model with different mesh sizes. . . . . 183 7-22 PEEQ distribution in the radial direction of models with different mesh
List of Tables
2.1 Chemical composition of DP780 used . . . . 38
2.2 Lankford parameters determined from uniaxial tensile testing for DP780 42 2.3 Hill'48 coefficients determined from average r-value of DP780 . . . . . 44
2.4 Swift hardening law parameters for the DP780 steel . . . . 46
2.5 Summary of tests for fracture calibration and verification. ... 48
2.6 Parameters of the calibrated MMC fracture model for DP780 . . . . . 52
3.1 Summary of HER from hole expansion tests . . . . 64
4.1 Strain hardening parameters of DP780 . . . . 97
5.1 Parameters of the yield function coefficient P that reduces the model to von Mises yield condition . . . . 137
5.2 Parameters of flow potential function coefficient G calibrated from Lankford ratios. . . . . 137
6.1 Parameters of flow potential function coefficient Q calibrated from average Lankford ratios for axisymmetric model. . . . . 152
6.2 Pre-damage and residual strains to be prescribed in the five layers of elem ents in SAZ . . . . 157
7.1 Discretized pre-damage and PEEQ to be assigned as initial condition in each layer of elements. . . . . 178
7.2 Discretized pre-damage following the actual average pre-damage dis-tribution. . . . . 179
Chapter 1
Introduction
In recent years, the automotive industry has witnessed a dramatic increase of ap-plications of Advanced High Strength Steels (AHSS), aluminum alloys and other lightweight materials due to the immense driving force from cost efficiency and fuel economy. These materials feature a superior strength to weight ratio and thus promise a substantial vehicle weight reduction. However, increase in the flow strength also brings big challenges to the manufacturing process such as more energy consumption, tool life, material formability, spring back and joining issues. Among them one issue of particular importance is edge fracture (or called edge cracking/splitting). Figure 1-1 shows two vehicle components made of AHSS in which edge fracture happened during forming process. The premature edge fracture occurred in the components despite the prediction of the commonly used Forming Limit Diagram (FLD) and existing Finite Element models, indicating that the traditional numerical tool not capable of predicting edge fracture. The modern automotive industry relies heavily on the CAE techniques in the design stage for cost saving and efficiency reasons. Failing to predict edge fracture may result in an over-design of the components. Also it causes design safety uncertainties that need to be verified by more expensive real component tests. It will therefore be of great value to develop a computational model that could accurately predict edge fracture.
A component undergoes two major processing steps before the edge fracture hap-pens. First it is blanked from the original sheet metal coil and then it is formed into
(a)
Figure 1-1: Edge fracture observed on components during the forming process. Pho-tograph courtesy of (a) US steel and (b) Voestalpine (Linz).
the desired geometry. Material within the area where edge fracture forms, which is the local vicinity of the component edge called Shear Affected Zone (SAZ), undergoes a complex loading path of initial out-of-plane blanking followed by in-plane stretching and/or bending. The blanking process introduces a substantial plastic deformation and pre-damage to the material in the SAZ. As a result, the local material ductility is substantially compromised which causes the premature edge fracture in the following forming process. Therefore, to model edge fracture, the sheet blanking process needs to be accounted for to address the effect of SAZ on the forming limit. In addition, severe load path changes also bring a challenge for the ductile fracture modeling. In the sheet blanking process, material on the trimmed edge is already cracked to create the new edge surface, indicating that theoretically there is no ductility left to with-stand additional plastic deformation. However, industrial practice shows otherwise. What is needed is to revisit the fracture initiation modeling.
The objective of the present thesis is to investigate the physical mechanism un-derlying edge fracture and to develop a validated computational model that can ac-curately predict edge fracture. To that end, an extensive experimental and numerical study is undertaken in order to understand the phenomena as well as the physics be-hind this issue. Also, an adequate plasticity and fracture model that can accurately describe the large deformation and fracture behavior of the material is also a corner stone to model edge fracture.
1.1
Plasticity and ductile fracture modeling
Ductile fracture of AHSS develops after a substantial plastic deformation and/or strain localization. As a result, to model ductile fracture, an accurate description of the material plastic behavior is required. A complete description of the plasticity behavior should cover the following aspects: (i) yield condition, (ii) flow strength and strain hardening law, (iii) plastic flow direction called flow rule. The quadratic von Mises yield condition and its derivatives have been proved useful in modeling the plasticity behavior of AHSS. An isotropic von Mises yield function was successfully applied by Yoshida et al. and Sun et al. [73, 64] in simulation of AHSS. Consider-ing that the rollConsider-ing process used the manufacturConsider-ing of the AHSS sheets introduces anisotropy to the material, the Hill'48 anisotropic yield condition was applied by Luo and Wierzbicki[47] in simulation of a strength-bending process on dual phase steels. The same yield condition is also utilized with success by many others[4, 9]. While in most of the research published in open literature an associated flow rule was used[4, 64, 47, 46], Mohr et al.[52] showed that a non-associated flow rule can better predicting the thinning behavior of AHSS. The study revealed that there is a considerable direction-dependency in the Lankford ratio of the AHSS material under investigation, while the stress strain curves are approximately the same, irrespective of the specimen direction. This finding is supported by the recently published research by Zhu et al.[74].
On the fracture modeling side, prediction of ductile fracture of metals is a topic of great interest to both academia and industry. In the case of bulk materials, i.e. of high stress triaxiality (7, ratio of hydrostatic stress to von Mises equivalent stress), both Gurson-type porous plasticity models [22, 66] and continuum damage mechanics models [38, 8] have been quite successful in modeling the void growth and nucleation either microscopically or macroscopically. However, for thin sheet materials which are approximately in a plane stress state, the stress triaxiality is low (7<1). In these cases, shear fracture becomes a dominant failure mechanism for many sheet metals [34, 44, 45]. Sun et al. [64] adopted an methodology taking advantage of shear
localization in simulating fracture of multiple grades of AHSS with success. Works have also been done to extend Gurson-type models to account for shear fracture and Lode angle dependence [54, 55], but the application in industry is still rare due to the complexity of the models and difficulties in parameter identification. In this regard, uncoupled phenomenological models offer a practical approach to model fracture of sheet metals [5, 711. Recently, Bai and Wierzbicki [3] formulated the Modified Mohr-Coulomb (MMC) model that is obtained by transforming the stress-based Mohr-Coulomb failure criterion into the space of stress triaxiality, Lode angle and equivalent plastic strain. The model has been applied with success to a dual phase steel [47], a TRIP steel [16], a boron steel by [19] and to aluminum sheets [6, 45]. The MMC model features a good balance between complexity/flexibility in capturing the fracture behavior and the simplicity in parameter identification and thus is a natural choice of the present study.
1.2
Current status of edge fracture study
Edge fracture is not an issue when forming material with high ductility such as mild steel. As for the lightweight materials such as AHSS, the increase of the flow strength has been achieved with an inevitable trade-off decrease in material ductility. As a result, these materials are more prone to premature edge cracking at trimmed/blanked edge. The same fact is also true for the aluminum alloys [62, 29]. The premature edge fracture poses a big challenge to the forming community during the component design process as well as manufacturing process. The traditional CAE tool such as Forming Limit Diagram (FLD) is not capable of handling this new situation [60]. Neither did existing Finite Element models. As a result, one is brought back to the traditional "trail and error" procedure using real component tests, or is left with an over-designed component that stays far away from the fracture limit. Failure to model edge fracture has crippled the application of CAE technology in modern component design.
In an attempt to address the afore-mentioned challenge, lots of experimental and numerical work has been carried out by the community. On the experimental side,
the Hole Expansion Test (HET) has been proved of particular value in edge fracture study[31, 60, 35, 10, 61, 7, 561. The hole expansion test is a widely used technique in the forming community originally designed for quantifying the edge stretch limit. In this method, the hole in the center of the disk specimen is expanded by a punch head until fracture during the test, as illustrated in Figure 1-2a. During such a test material at the hole edge is essentially subjected to an uniaxial tensile load and undergoes hoop stretching until fracture. As shown in Figure 1-2b, the maximum equivalent plastic strain is localized on the hole edge. The hole expansion ratio (HER) reported in such tests gives an easy and straight forward measure of how much the edge has been stretched until fracture. A few testing standards have already been established including: JFS T 1001-96, ISO/TS 16630-2008 [32, 33]. The test is good for edge fracture study because of the generally uniform deformation along the hole edge during the test and also because the critical crack initiation points stays at the edge until relative very large deformation.
Besides the conical shape punch head, a fiat punch head was used by Levy and Tyne [40] for the hole expansion test while Lester and Nikhare [391 used a spherical punch head. Although these two types of punch head successfully avoid the out-of-plane rotation of the hole edge which causes non-uniform stretching in the thickness direction during the hole expansion test, they also result in a localized necking beyond the hole edge which may yield fracture initiation there. Larour et al. [37] experimen-tally compared the effects of different punch head shapes in a hole expansion test. The study revealed that hole expansion test with flat punch head sees a fracture ini-tiation point away from the hole edge (Figure 1-3a) and is therefore is not a valid test for characterization of edge fracture.
In addition to hole expansion tests, other types of tests have also been tried by researchers. Golovashchenko utilized a half dog-bone specimen subjected to tension in edge fracture study of AHSS [20] and aluminum alloy [21]. The specimen has a half dog-bone shape with one side blanked and another side milled. During the test the blanked edge is subject to stretching and edge fracture is measured by the elongation limit of the specimen. However, the elongation depends on not only the blanked edge
Test piece
Die
Puch head
(a)
(b)
Figure 1-2: Schematics of conical hole expansion process and a typical plastic strain distribution within the specimen.
stretch limit, but also the localized necking inside the specimen. During a standard dog-bone specimen tension test, the critical point where fracture initiates is the center of the specimen, where severe localized necking usually happens and the stress state is close to a plane-strain loading condition with a lower fracture limit (Figure 1-4). After introducing a blanked edge in such a half dog-bone specimen, crack initiates as a result of a competition between the edge fracture and the localized necking in the middle of the specimen. As a result, in some tests where the edge is punched with a better quality, the localized necking triggers fracture inside the specimen and a typical slant fracture was observed, while in other tests, edge fracture triggers the specimen failure and a perpendicular crack was formed instead. Larour et al.
[ ]
carried out Nakajima test on FLC samples with punched edges for edge fracture study. This type of test is essentially the same as the half dog-bone specimen tension test. The test(a)
Marciniak punched Nakajima punched 20mm width 20mm width
(b)
Figure 1-3: Results of (a) hole expansion using flat punch and (b) Nakajima and Marciniak punch test on FLC samples showed a hot spot away from the edge
[1].
results showed a crack initiation from the middle of the specimen due to localized necking instead of edge fracture(Figure 1-3b).
Figure 1-4: Illustrative damage jected to tension.
indicator distribution of a dog-bone specimen
sub-From hole expansion tests it is observed that in general, the punched holes will have a much lower stretch limit compared with machined (milled, drilled or reamed) specimen. The pre-mature edge fracture challenges the traditionally established pro-cedures in the forming community and Konieczny et al.[
J
re-examined applicabilityof existing manufacturing method for conventional high strength low alloy (HSLA) steels to new generation of AHSS. A comprehensive experimental study was per-formed on both HSLA and AHSS steels. Factors including: die clearance during hole punching, bur direction (up or down) during HET test and different machining techniques (milled, laser cut, punched, etc.), were investigated. The most important finding was that within the punched specimen, different die clearances yield different HER and die clearance around 20% usually result in the highest value. Considering that the punching process has a great impact on the stretch limit of trimmed edge, Shih et al. extended the study to cover factors including new punching techniques by introducing a bevel angle to the punch head, as well as changing sheet material orientation[6 1].
Generally speaking, the main cause of edge fracture is that the blanking process produces a substantial plastic strain and pre-damage in the vicinity of the hole edge (termed as Shear Affected Zone, or SAZ), while during the milling process or water-jet cutting process very little pre-damage is introduced to the hole edge. SEM observation shows that there is pre-damage accumulated in SAZ in the forms of shear band localization [70], micro voids [13] and needle cracks [49], while there are no obvious such features in a milled edge or water-jet cut edge [18]. Butcher et al. [7] and Chiriac and Shi [11] tried to quantify the residual strain in the SAZ by micro-hardness test to find out how much pre-damage has been produced due to trimming process. The results indicated that the residual plastic strain drops rapidly from the peak value at the hole edge to zero over the width of the SAZ. The SAZ has a width of only about 30% of the specimen thickness. Beyond that zone, the material stays in the virgin state. This small SAZ gives important clues for edge fracture study. Besides the micro-hardness test, a very interesting method of calculating the distribution shear strain from the measurement of the flow lines of material during blanking was presented by Wu et al. [70].
Compared to the abundance of experimental studies, the modeling and numerical simulation of edge fracture stays relatively behind. The difficulty mainly comes from the complex loading history in the SAZ where material undergoes first out-of-plane
shear followed by in-plane stretching, and from the small length scale of the SAZ. The edge fracture issue is essentially a local formability issue caused by the small SAZ. Material ductility within the SAZ is substantially compromised, while outside the SAZ the material is still crack-free. A key ingredient in an accurate simulation of edge fracture for a blanked edge is to suitably model the SAZ to include the effects caused by trimming process. Considering the reduced material ductility in the SAZ, Butcher et al. [7] made use of the GTN model and treated the SAZ as a different material. Although quite straight forward, the material within SAZ needs to be cal-ibrated separately, which is a quite complicated process and more importantly loses generality. Sartkulvanich et al. [59] took advantage of the axisymmetry of the problem and developed an axisymmetric 2D element model to perform first a hole blanking simulation and then continued into hole expansion simulation. This sequential pro-cedure carried all information from the blanking simulation into the subsequent hole expansion simulation. However, after the first crack initiates during hole expansion test the axisymmetric condition will not stand anymore, yielding axisymmetric model inappropriate for HER prediction. Hubert et al. [30] tried a sequential (two-step) methodology during cold rolling simulation by extruding a model with 2D elements from the blanking process into a 3D element model, which enables the model to in-herit information from the blanking process into the subsequent simulation. A very recent work by Hu et al. Hu et al. [29] implemented a similar idea into the simulation of a half dog-bone tension test with a blanked edge on A6111-T4 aluminum alloys. The authors assigned both the edge geometry and material state variables obtained in sheet blanking simulation into a relative coarse mesh 3D model for the edge stretching simulation and obtained good results. However, a more general material calibration would be of great interest to the readers.
Another important issue in edge fracture modeling that has not been well ad-dressed is the mesh size effect. In general mesh size effect is caused due to the stress/strain gradient, which is quite typical in sheet metal that commonly loses sta-bility and sees localization before fracture happens[50, 28, 72, 67]. As illustrated by Figure 1-5, before crack initiates the plastic strain within the narrow localized region
is about two times higher than that outside[ ]. Within the localization region, the plastic strain changes rapidly. Thus, when introducing different mesh sizes, the re-sulting plastic deformation severity which can be roughly regarded as an average of the detail distribution in Figure 1-5, will be quite different. In terms of edge fracture prediction, this issue becomes even more severe. The width of typical localization discussed above is roughly similar to the thickness of the metal sheet[ , ]. How-ever, for edge fracture simulation, the SAZ has a width roughly only 1/3 of the sheet thickness, where a rapid change in pre-damage and other variables happens. The issue will be studied in more detail in the current thesis.
(a) C) 02. 0.6-.. C 02 A 02 0-W 0' 0 0.25 0.5 x/LO [-] 0.75 (b)
Figure 1-5: (a) Illustrative middle section profile showing the specimen thickness change and (b) plastic strain distribution around a localized necking at different load level before fracture during a dog-bone specimen tension[
].
1.3
Thesis outline
The current thesis is devoted to a comprehensive experimental and numerical inves-tigation on edge fracture. The work is divided into eight chapters with each chapter dealing with a specific topic. These chapters are organized in a logical way where each chapter deepens understand on the topic.
098
0.75
(DO.5
After the present introduction chapter, Chapter 2 presents a detail characteriza-tion of both plasticity and fracture behavior for the DP780 steel sheet under inves-tigation. A hybrid testing/simulation method is applied. The experimental study follows a general test plan designed for calibrating sheet metal material. After the experiments, a modeling frame work is then introduced to describe the plasticity and fracture behavior of the crack-free material in the in-plane direction. The model is based on the Hill'48 yield condition, an associated flow potential, an isotropic hardening law, and the MMC fracture locus description which has dependence on both stress triaxiality and Lode angle parameter. The plasticity model is calibrated
through dog-bone specimen tension tests in 00, 450 and 900 to the rolling direction,
while the fracture locus is calibrated through three different types of specimens cov-ering a wide range of stress triaxialities, e.g. butterfly specimen (for pure shear, combined shear-tension and plane-strain tension), central hole specimen (for uniax-ial tension), and disk specimen (for equi-biaxuniax-ial tension). Flat specimens with three different cut-out radius are tested to verify the calibrated model.
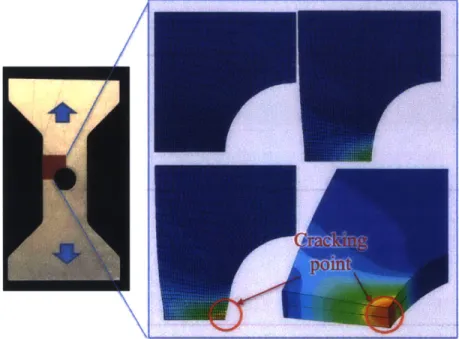
Following the material calibration, a comprehensive experimental study is carried out on edge fracture in Chapter 3. Hole expansion tests as well as tension tests on specimen with a central hole are introduced. Three different types of manufacturing techniques, including milling, water-jet cutting and blanking, are used during the specimen fabrication. The test results indicate that the fracture limit of a blanked edge is roughly reduced by half when compared with a milled edge (or water-jet cut edge). A detail numerical simulation utilizing the material parameters obtained in Chapter 2 is carried out on crack-free material for both hole expansion test (HET) and central hole specimen tension test (CHT). A good correlation between the test and simulation is obtained in terms of load displacement response, local strain history, as well as the fracture limit. In addition, the numerical simulation provides an insight of the initiation and propagation process of the multiple cracks on hole edge during the hole expansion test. The crack path in the thickness direction is also accurately captured by a simulation with an extremely fine mesh size of 0.01mm.
(milled specimen), a sequential simulation (or called one-stroke simulation) is carried out to predict edge fracture of blanked specimen in Chapter 4. The model includes the manufacturing process of blanking into the edge fracture simulation. Firstly, the hole blanking process was analyzed using a 3D FE model with an extremely fine element size of 0.01mm in the critical area where material splitting happens. Such a fine mesh is required because of the small tool gap (die clearance) during the blanking process. After that, a subsequent hole expansion simulation was continued on the same FE model, with all material parameters inherited from the blanking simulation. The fracture limit, i.e. the hole expansion ratio (HER), predicted this way was very close to that measured in tests. The one-stroke simulation also accurately predicts the slant crack path in thickness direction, as well as the perpendicular crack pattern as observed during the test. However, the simulation of the sheet blanking process is not verified quantitatively against test data, which will be addressed in the following chapter.
The study in Chapter 4 indicates that an accurate incorporation of the blank-ing process is critical in edge fracture prediction, which leads to the comprehensive experimental and numerical investigation on the plane-strain sheet blanking process in Chapter 5. Blanking tests on a DP780 steel sheet were carried out on a special fixture utilizing an in-situ microscope for the Digital Image Correlation (DIC) defor-mation measurement. The DIC method provides a detailed defordefor-mation field of the specimen that has not been reported in any other publications before. Interrupted blanking tests were carried out to study the crack formation and propagation during the blanking procedure, while Scanning Electron Microscopy (SEM) was applied to examine the blanked surface quality as well as the edge profile after test. Following the experimental study, a detailed Finite Element Model with mesh size of 0.01mm in the critical region was established for the numerical investigation. The model features (a) a non-associated Hill 48 flow rule, (b) von-Mises Yield condition and (c) modified Mohr-Coulomb (MMC) fracture model. With material parameters calibrated from the in-plane tests reported in Chapter 2 and one additional upsetting test in the thick-ness direction, as well as accurate boundary conditions measured from actual tests,
the Finite Element model accurately predicted the blanking process quantitatively. The load displacement response, as well as the size of the roll over, burnished region and fracture zone of the blanked edge are all accurately captured in the simulation.
Encouraged by the one-stroke simulation, a two-step Pre-Damage Mapping (PDM) model is developed in Chapter 6 for edge fracture prediction. The fracture behavior of the material within the SAZ is still modeled through the plastic strain based damage accumulation method. However, in addition to the damage accumulated during the forming process, there is an additional component of initial damage produced by the sheet blanking process. The accurate numerical tool for sheet blanking simulation using 2D elements established in Chapter 5 is applied to determine the pre-damage distribution within the SAZ. The PDM model uses a 2D axisymmetric model for the sheet blanking simulation, with mesh size of 0.01mm in the critical region, while performs the hole expansion simulation with a 3D FE model of regular mesh size of 0.1mm. As a result, the size of the FE model is substantially reduced which greatly saves the computational power compared with the one-stroke simulation. The pre-damage and equivalent plastic strain information obtained in blanking simulation (step I) are mapped/prescribed to the 3D element model as initial condition before the hole expansion simulation (step II). Therefore, the new 3D model inherits the effects caused by the blanking process from the 2D model. The PDM model accurately captures the first order effect of edge fracture in terms of the HER prediction. The model also accurately predicts the slant crack in the thickness direction.
Before the final conclusion is reached, Chapter 7 carries out a thorough investiga-tion on the pre-damage distribuinvestiga-tion within the SAZ by microscopic observainvestiga-tion and numerical simulation. The microscopic observation reveals a "dual nature" of crack formation. On the edge surface of a specimen subjected to hole expansion there are numerous micro cracks formed in the area originally taken as crack-free beyond the major crack (macro crack) which is visible to bare eye. The macro crack has an open-ing width of order of 0.1mm while the micro cracks are of order of 1pm. Interrupted hole expansion tests on milled specimen indicate that the micro cracks initiate much earlier than the macro cracks during a hole expansion process. These microscopic
observations suggest the pre-damage within the SAZ starts from the critical value of unity at the edge surface and drops to zero over the width of the SAZ. The following numerical parametric study indicates the pre-damage distribution can be accurately described by an one-parameter exponential function. What is more, the pre-damage distribution is relatively insensitive to the material under investigation, as well as the blanking condition. It is reasonable to introduce a master curve of pre-damage distri-bution in a quick evaluation. Such an exponential pre-damage distridistri-bution is obtained and applied to a quick evaluation model of edge fracture using shell elements. The quick evaluation model predicts HER of a blanked edge with good accuracy. However, due to the high gradient in the pre-damage distribution, the model shows an obvious mesh size effect. Larger mesh size results in a higher HER prediction. The mesh size effect is caused because that the model underestimates the effect of pre-damage on edge fracture when averaging the pre-damage distribution with such a high gradients over a large element. The element is regarded as large when its size is comparable to or even larger than the width of the SAZ. A phenomenological solution is applied by introducing a scaling factor to pre-damage and the factor depends on the mesh size.
Chapter
2
Material Characteriaztion
Contents
2.1 Introduction . . . .. . . . 37
2.2 Plasticity testing and modeling . . . . 39
2.2.1 Anisotropy ... ... 39
2.2.2 Calibration of the plasticity model . . . ... . . 40
2.3 Fracture characterization for crack-free material . . . . . 46
2.3.1 Fracture Modeling . . . . 46
2.3.2 Fracture Testing . . . . 47
2.3.3 Fracture model calibration . . . . 49
2.4 Model verification . . . .. . . . .. 53
2.5 Summary and conclusion . . .. . . . . 54
2.1
Introduction
The material chosen for the edge fracture study in the current thesis is a commer-cially available Dual Phase steel sheet DP780 supplied by VoestAlpine (Austria) which serves as a representative grade in the advanced high strength steel family. A dual phase steel features a hard phase of martensite islands distributed in a soft phase of ferrite matrix (Figure 2-1a). The hard martensite phase increases the ma-terial strength through the second phase hardening (precipitation hardening) mecha-nism. Increasing the volume fraction of martensite will generally increase the material
strength. However, the ductility of the material will be compromised at the same time. People are trying to optimize the trade-off relation between strength and ductility by adjusting grain size, strength of the two phases and the hard phase volume fraction
[
]. The current DP780 under investigation has a grain size of about 2m (Figure 2-1b). The steel sheet has an original thickness of 1.6mm after rolling and annealing. The exact chemical composition of the present DP780 steel is given in Table 2.1 as provided by the supplier.Ferrite-Martensite DP
-Ferrite Martensite x1,000 10pm """""' 0001 08 Dec 2014 (a) (b)Figure 2-1: (a) Illustrative micro-structure of a DP steel. Photo curtesy of World Auto Steel. (b) Micro structure of the current DP780 steel under investigation. Surface processed by 3.5% nital and 96.5% ethanol for one minute.
Table 2.1: Chemical composition of DP780 used
C Mn Cr+Mo Si Nb+Ti
0.12-0.16 1.8-2.5 <0.5 0.5 <0.05
The primary objective of the present chapter is to fully characterize the plasticity and fracture behavior of the DP780 steel sheet, which are the topic of Section 2.2 and Section 2.3 respectively. All together 22 tests are performed in combination with a hybrid testing/ simulation procedure to obtain the material parameters as well as to verify the calibrated material model.
2.2
Plasticity testing and modeling
Due to the rolling process, grains within the material will be deformed and elongated in the rolling direction, causing a directional preference within the material. As a result anisotropy needs to be taken care of during the material characterization.
2.2.1
Anisotropy
A uncoupled phenomenological approach is adopted in this chapter to model plastic deformation and fracture . Within such a framework, the modeling of damage and fracture initiation has no influence on the material plasticity. Conversely, the infor-mation of plastic deforinfor-mation given by the plasticity model, while the plastic strain increment, together with a calibrated fracture locus, is utilized to calculate damage accumulation and then predict crack formation. Therefore, under monotonic loading, the plastic behavior of the present DP steel sheet is modeled using a standard plastic-ity theory featuring: (1) the anisotropic Hill'48 [25] yield function, (2) the associated flow rule, and (3) the isotropic hardening law. The yield condition reads
f(u, k) = &Hill - k = 0 (2.1)
UHill = -F(a z )2 + G(-z- U,)2+ H(-, - U-,2 + 2LTr2z + 2M-z2x + 2Nr2y (2.2) where &Hill denotes the equivalent stress given by the three-dimensional Hill'48 yield function, and k represents the deformation resistance. x, y and z corresponds to rolling, transverse and thickness direction of the sheet material, respectively. The six constants F N are coefficients of anisotropy, and can be identified through proper material tests. The associated/normality flow rule is assumed as