The Effect of Electrostatic Screening
on a Nanometer Scale Electrometer
The MIT Faculty has made this article openly available. Please share how this access benefits you. Your story matters.
Citation MacLean, Kenneth, Tamar S. Mentzel, and Marc A. Kastner.
“The Effect of Electrostatic Screening on a Nanometer Scale Electrometer.” Nano Letters 11.1 (2011): 30-34.
As Published http://dx.doi.org/10.1021/nl102121e
Publisher American Chemical Society
Version Author's final manuscript
Citable link http://hdl.handle.net/1721.1/67690
Terms of Use Article is made available in accordance with the publisher's policy and may be subject to US copyright law. Please refer to the publisher's site for terms of use.
The Effect of Electrostatic Screening on a
Nanometer Scale Electrometer
Kenneth MacLean,
∗Tamar S. Mentzel, and Marc A. Kastner
Department of Physics, Massachusetts Institute of Technology, Cambridge, Massachusetts 02139
E-mail: [email protected]
Abstract
We investigate the effect of electrostatic screening on a nanoscale silicon MOSFET elec-trometer. We find that screening by the lightly doped p-type substrate, on which the MOSFET is fabricated, significantly affects the sensitivity of the device. We are able to tune the rate and magnitude of the screening effect by varying the temperature and the voltages applied to the device, respectively. We show that despite this screening effect, the electrometer is still very sensitive to its electrostatic environment, even at room temperature.
Keywords: Nanoscale electrometer, electrostatic screening, charge transport, thin film
Nanoscale electrometers have emerged as powerful tools for studying a wide variety of solid state systems. These sensors can be integrated on a semiconductor chip adjacent to a solid state structure of interest,1 or mounted on a scanning probe tip.2 Utilized in these configurations, nanoscale electrometers have had a great impact on the study of single electron devices,3–7 disor-dered materials,8,9and high mobility two dimensional electron gases.10,11 The small size of these electrometers can lead to high charge sensitivities,12 which are central to many of these applica-tions. It is widely recognized that, of the many factors that may limit the sensitivity of a nanoscale
electrometer, electrostatic screening is likely to be one of the most important. However, because in most cases the effect of the screening is more or less fixed, and cannot be easily tuned, there have been few if any experimental investigations of this effect.
In this Letter, we characterize the effect of electrostatic screening on the sensitivity of a nanoscale MOSFET (metal-oxide-silicon field-effect-transistor) electrometer. For our device, we find that screening by the lightly doped p-type silicon substrate, on which the MOSFET is fabricated, sig-nificantly affects the charge sensitivity of the device. However, because this screening is caused by a lightly doped semiconductor as opposed to a metal, we are able to tune both the rate and the magnitude of the screening effect in situ by varying the temperature and depth of the depletion region in the substrate, respectively. This tunability allows us to quantify the effect of screening for our system. We demonstrate that, despite the effects of electrostatic screening, our nanoscale electrometer can still detect very small charge fluctuations, even at room temperature.
The device used in these experiments has been discussed previously,9and consists of a nanome-ter scale silicon MOSFET that is electrostatically coupled to a strip of hydrogenated amorphous silicon (a-Si:H). An electron micrograph of the device is shown in Figure 1(a). The n-channel MOSFET is fabricated using standard CMOS techniques on a silicon substrate. The substrate is lightly doped p-type with boron (NB≈ 3 × 1015 cm−3). Adjacent to the gate of the MOSFET, we
nanopattern a strip of phosphorous doped a-Si:H. We make electrical contact to the a-Si:H using two gold contacts, which are visible as the bright regions in the two lower corners of the electron micrograph in Figure 1(a). For all of the work discussed here, a positive voltage is applied to the gate of the MOSFET, so that an inversion layer forms at the Si-SiO2 interface beneath the gate,
as shown in Figure 1(b). The conductance of the MOSFET inversion layer, GM, is limited by its
narrowest portion, which is located underneath the ≈ 60 nm wide constriction in the gate. Elec-trical contact is made to the inversion layer through two degenerately doped n-type silicon regions located on either side of the constriction (not shown in the micrograph). We measure GM by
ap-plying a small voltage ∼ 5 mV to one contact, and measuring the current that flows out through the other. We make electrical contact to the p-type substrate through the back of the chip. For the
data reported below, we negatively bias the p-type substrate by Vsub = -3 V relative to the n-type
contacts unless otherwise indicated.
10 8 GM (µS) 15 10 5 0 time (s) -2.5 -2.0 V aSi (V) 2 1 0 time (s) 3.5 3.0 2.5 G M (µS) ∆Au ∆aSi LD
(a)
Au Gate a-Si:H(c)
(b)
gate oxide a-Si:H Au inversion depletion p-Si(d)
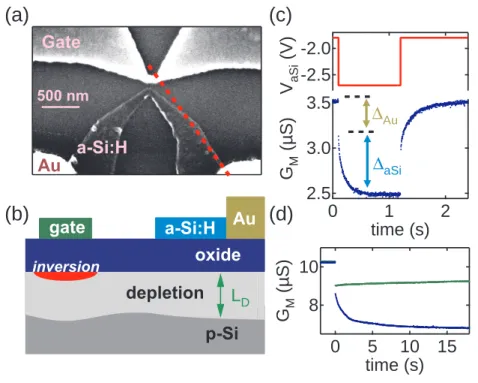
500 nmFigure 1: (a) Electron micrograph of MOSFET gate , a-Si:H strip, and gold contacts. (b) Sketch of the cross-section of the device along the dashed red line in (a). When a positive voltage is applied to the gate, an inversion layer forms at the Si-SiO2interface. A depletion region forms in the
p-type silicon substrate beneath the Si-SiO2interface, as discussed in the main text. The depth of the
depletion region below the Si-SiO2interface is denoted LD. (c) Voltage sequence applied to one of
the gold contacts (top trace) and the conductance of the MOSFET in response to changes in charge on the gold (∆Au) and a-Si:H (∆aSi) (bottom trace), at T = 125 K, as discussed in the main text. (d) Result of stepping the voltage applied to the gold contacts at T = 79 K for a device in which the strip of a-Si:H is connected to only one of the two gold contacts, as discussed in the main text. For the blue (green) data the gold contact connected (not connected) to the a-Si:H strip is changed. For these data Vsub= 0 V.
The conductance of the MOSFET is extremely sensitive to its electrostatic environment. In particular, GM is sensitive to changes in charge in either the a-Si:H or the gold contacts. As we
show below, this sensitivity is significantly affected by screening by the p-type silicon substrate: If charge Q is added to the a-Si:H or gold contacts, an oppositely charged region will form in the sub-strate underneath, thereby reducing the effect of Q on GM. This screening charge is located at the
the screening charge will be located a distance LDbeneath the Si-SiO2interface.
Our measurement consists of stepping the voltage VaSiapplied to one of the a-Si:H gold contacts
while simultaneously monitoring GM. An example is shown in Figure 1(c). Here we set the
voltage applied to one gold contact to 0 V, and apply the voltage sequence shown in the top trace of Figure 1(c) to the other contact.13 The bottom trace of Figure 1(c) shows the variation in GM
in response to the voltage sequence. When VaSi is first stepped from -1.8 V to -2.7 V, GM quickly
drops by an amount∆Au,14and then decreases slowly by an amount∆aSi.
As we have demonstrated in MacLean et al.,9the slow change∆aSiin GMis caused by the slow
addition of negative charge to the a-Si:H. The MOSFET electrometer senses this change in charge electrostatically, and GM decreases as negative charge is added to the a-Si:H. The time scale of
this charging is a direct measurement of the resistance of the a-Si:H strip.9 The much more rapid drop ∆Au in GM is caused by the negative charge added to the gold contacts, which charge up
very quickly because of their low electrical resistance. When VaSi is returned to -1.8 V, the same
responses∆Auand∆aSi are observed but with the opposite sign, as negative charge is now removed from the gold and the a-Si:H. A similar response is observed when the voltage sequence is applied to the other gold contact, or to both contacts at the same time.
To confirm that our interpretation of the data is correct, we study a separate device where, like the device shown in Figure 1(a), a strip of a-Si:H is patterned adjacent to a nanoscale MOSFET. However, for this device, the strip of a-Si:H is connected to only one of the two gold contacts. The data is shown in Figure 1(d). At t= 0 we step one contact from 0 to -9.9 V, while the other contact
is held constant at 0 V. A rapid drop∆Auis observed when the pulse is applied to either one of the gold contacts, but the slower response∆aSi is only observed when the pulse is applied to the gold which is connected to the strip of a-Si:H, confirming our interpretation of the data.
The sensitivity of GM to its electrostatic environment depends on screening by the underlying
p-type silicon substrate. To demonstrate this, we examine the response of the MOSFET to changes
in charge in the gold contacts at a temperature T ≈ 10 K, lower than the temperature at which the data shown in Figure 1 are acquired. At this temperature, the a-Si:H is so resistive that it does
-1.0
-0.5
0.0
V
aSi(V)
0.5
0.0
time (s)
6
5
G
M(µS)
10
110
3γ
s(Hz)
400
200
1000 / T ( K
-1)
10
110
3∆γ
s(Hz)
60
50
1000 / T ( K
-1)
2.5
5
25
T (K)
16.7
22.2 T (K)
(a)
(b)
(c)
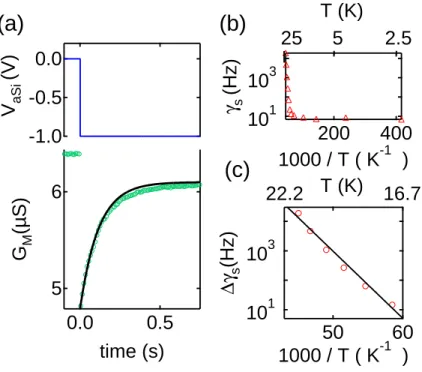
Figure 2: (a) Observation of the screening effect at T = 9.8 K, as discussed in the main text. The top trace shows the voltage step applied to the a-Si:H gold contact. For the lower trace, the solid black curve is a fit to an exponential, as discussed in the main text. (b) Screening rate γs as a function
of inverse temperature. (c) Change in screening rate∆γs as a function of inverse temperature, as
described in the main text. The solid line is a theoretical fit described in the main text. For all of these data, Vsub= 0.
not charge up on the time scale of the experiment,9 so that we can add charge to the a-Si:H gold contacts but not to the a-Si:H itself. The results are shown in Figure 2(a). When we change the voltage applied to the a-Si:H gold contacts from 0 to -1 V (top trace), we see a large decrease in the MOSFET conductance, which gradually dies away as time progresses (bottom trace).
The gradual dying away of the decrease in GM can be understood in terms of screening. When
we add charge to the gold contact, an opposing charge in the p-type substrate is induced, reducing the overall effect on GM. At low temperatures, the resistance of the substrate is high, and this
charge is induced at a slow rate. To quantify this rate, we fit the GM trace to an exponential
GM(t) = G∞+ Gscre−γst, where G∞ and Gscr are constants that depend on the voltages applied to
the MOSFET gate, p-type substrate, and gold electrodes, andγsis the screening rate.
To show that this screening effect is caused by the p-type silicon substrate, we measureγs as
a function of temperature. The results are shown in Figure 2(b). As the temperature is reduced, γs drops, saturating at a minimum valueγmin ≈ 8 Hz. In Figure 2(c), we plot∆γs=γs - γmin as
a function of inverse temperature, and fit to an activated temperature dependence ∆γs ∝e−EA/kT.
We obtain EA = 45 ± 5 meV, which agrees well with the boron acceptor binding energy.15 For
boron-doped silicon with no donor compensation, the Fermi level lies between the valence band and the boron donor level, and the activation energy for hole transport is therefore half of the boron acceptor binding energy. However, at sufficiently low temperatures, a small concentration of compensating donor states caused by defects or impurities ND will move the Fermi level into
the acceptor band.16In our case, the number of defects required is only ND∼ 1010cm−3. Because
the required density is so small, we expect the Fermi level to lie in the acceptor band, and the activation energy required for the generation of holes in the valence band to be the boron acceptor binding energy. The correspondence between the activation energy for the screening and the boron acceptor binding energy demonstrates that the conductivity of the boron doped substrate limitsγs.
Presumablyγssaturates at a minimum valueγminbecause some conduction mechanism other than
activation of holes in the p-type substrate dominates at low temperature. It is possible that this low temperature conduction occurs via tunneling of electrons between acceptor states16 in the p-type
substrate. In any case, from this data it is clear that screening by holes in the boron doped substrate significantly reduces the sensitivity of the MOSFET.
0.3
0.2
0.1
0.0
∆
(µS)
-20
-10
0
V
aSi(V)
11.4 11.2 G M (µS) 20 10 0 time (ms)Figure 3: ∆aSi (blue circles) and∆Au(gold circles) measured as a function of VaSi at T = 139 K, as
discussed in the main text. For these data, we make the MOSFET gate voltage more positive as
VaSi is made more negative so that GM ≈ 11µS at the start of each GM(t) trace. (Inset) Examples
of data from which∆aSi and∆Auare extracted for two different VaSivalues. For both GM(t) traces,
VaSi is stepped by -0.5 V at t = 0. The data are offset vertically by a small amount for clarity.
The blue and red data sets are taken at the positions of the blue and red arrows, respectively. The decrease in both∆aSi and∆Auwith increasingly negative VaSiis clearly visible.
At higher temperatures T > 25 K, γs becomes too fast for us to measure. In this regime, we
investigate the dependence of∆aSi and∆Au on VaSi. The results are shown in Figure 3. Here we
step the voltage applied to both gold contacts from VaSito VaSi−∆V , where∆V = 0.5 V. We extract ∆aSi and ∆Au from the resulting GM(t) trace as depicted in Figure 1(c). We measure both ∆aSi
and∆Au as a function of VaSi and find that both of these quantities decrease as VaSi is made more
negative. The decreases in∆aSi and∆Auare clearly visible when the GM(t) traces taken at different
VaSi values are compared, as is shown in the inset to Figure 3.
way: At VaSi= 0 V, the p-type substrate beneath the Si-SiO2is depleted, as depicted in Figure 1(a).
As VaSi is made more negative, LDis reduced beneath the gold and the a-Si:H. This has the effect
of making the screening more effective, because it brings the holes in the substrate closer to the charge they are screening. As a result, both∆Auand∆aSi decrease as VaSiis made more negative.17
The response of GM to the gold ∆Au decreases as VaSi is made more negative until VaSi≈ -8
V, at which point it saturates. This saturation is expected, because once the depletion layer below the gold shrinks to zero, so that the Si-SiO2 interface underneath the gold is in accumulation, the
distance between the charge on the gold and the screening charge is fixed at the SiO2 thickness
(100 nm). ∆aSi does not appear to saturate as VaSi is made more negative. This is not surprising,
because the a-Si:H is very close to the MOSFET gate. Because there must always be a depletion layer between the inversion layer of the MOSFET and the p-type substrate, the Si-SiO2interface
underneath the a-Si:H cannot be brought into accumulation, and the signal does not saturate. It is however surprising that for VaSi < -10 V, ∆Au is larger than ∆aSi. Although the gold contacts
are physically much larger than the a-Si:H strip, which enhances their effect on GM relative to
the a-Si:H, the a-Si:H strip is much closer to the MOSFET, so one would not expect ∆Auever to be significantly larger than ∆aSi. Thus, although the dependencies of ∆aSi and ∆Au on VaSi can
be understood in terms of screening, the relative magnitudes of these quantities are not currently understood. We have also measured the dependence of ∆Au and ∆aSi on VaSi at T = 98 K and T
= 179 K. The results are qualitatively similar, but the relative magnitudes of∆aSi and∆Auchange somewhat depending on the temperature, a result that is also currently not understood.
We have thus seen that screening by holes in the p-type substrate decreases the sensitivity of our MOSFET electrometer. We expect that there are other sources of screening in our system, for instance by the metallic gate of the MOSFET. Despite the effect of screening, our electrometer is still sensitive to very small charge fluctuations in the a-Si:H, even at room temperature. An intriguing demonstration of this is the sensitivity of the MOSFET to telegraph noise switches in the a-Si:H. 1/ f noise and discrete telegraph switches have been observed previously in the resistance
35 30 I aSi (nA) 100 50 0 time (s) 5.18 5.16 5.14 G M (µS) -0.5 0.0 c ( τ ) -100 0 100 τ (s)
(a)
(b)
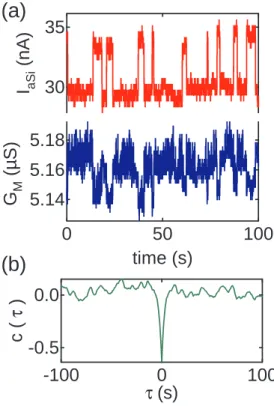
Figure 4: Noise correlations measured at room temperature. (a) Current through a-Si:H strip IaSi
(top trace) and transistor conductance GM (bottom trace) as a function of time. Here we apply
a constant voltage bias of 2 V across the a-Si:H strip. (c) Correlation between IaSi and GM, as
samples where the conductance is dominated by filaments small enough to be affected by a single switch. While the microscopic origin of 1/ f noise in a-Si:H is unclear, its phenomenology is quite
rich, and it is closely connected with Staebler-Wronski effect,19as demonstrated in Parman et al.20 At room temperature, where the resistance of the a-Si:H is not too large, we apply a voltage between the two gold a-Si:H contacts and measure the current IaSi that flows through the a-Si:H
strip. The top trace of Figure 4(a) shows IaSi measured as a function of time, exhibiting clear
telegraph noise. This switching appeared and disappeared apparently randomly, lasting ∼ 1 day. Because our sample is nanopatterned, it is not clear whether the origin of the telegraph noise we observe is the same as the origin of the noise found in bulk a-Si:H samples. However, the conductance of our heavily doped a-Si:H strip is only weakly dependent on the voltages of nearby gates, such as the voltage applied to the MOSFET gate or p-type substrate. For example, we find that we must change the MOSFET gate voltage by ∼ 30 V in order to produce a change in IaSi
as large as the ∼ 5 pA fluctuations shown in Figure 4(a). The narrow a-Si:H strip is thus not very sensitive to its electrostatic environment, and it is therefore likely that the switching seen in Figure 4(a) results from fluctuations inside or on the surface of the a-Si:H, as opposed to electron trapping external to the a-Si:H.
As we measure IaSi(t), we simultaneously measure GM(t), and the results are plotted in the
bottom trace of Figure 4(a). We see that IaSi and GM are anti-correlated. When IaSi jumps up, GM
jumps down, and vice versa. This anti-correlation is demonstrated quantitatively in Figure 4(b). Here we measure IaSiand GMsimultaneously for a much longer time than shown in Figure 4(a), and
compute the cross-correlation function between the two signals c(τ).21 Here we have normalized
c(τ) by subtracting the product of the means of IaSi and GM, and then dividing by the product
of their standard deviations.22 We see that for our data c(τ) has a negative peak at τ = 0 with a value ≈ −0.6, indicating that the two signals IaSi and GM are highly anti-correlated: With our
normalization c(0) = −1 corresponds to perfect anti-correlation.
From these data, it is clear that the MOSFET electrometer can detect single switches in a material adjacent to it. It may be that electrostatic fluctuations that give rise to the switching noise
in the a-Si:H current are detected by the MOSFET directly, or that these fluctuations change the charge distribution along the a-Si:H strip to which the MOSFET is extremely sensitive. We have observed telegraph noise in the current through nanopatterned strips of a-Si:H other than the one studied here, but these samples were not fabricated adjacent to a MOSFET charge sensor. The intermittency of the switch investigated here made it difficult to study in detail, and more work is required to determine the mechanism by which the MOSFET senses these switches.
We can quantify the sensitivity of our MOSFET charge sensor from the data shown in Fig-ure 3.23 From the size of the VaSi step (0.5 V),∆aSi ∼ 0.1 µS, and the capacitance of the a-Si:H
strip (C ∼ 100 aF), we estimate that the addition of a single electron charge distributed uniformly along the a-Si:H strip produces a change in GM of order 0.1 nS. However, since the sensitivity of
the MOSFET depends on r, the distance between the electron charge and the MOSFET, we expect that a single charge added to the portion of the strip closest to the MOSFET would produce a con-siderably larger change in GM. A charge Q added to the strip is screened by an equal and opposite
charge -Q in the substrate. The potential produced by this pair of charges is that of a dipole, and falls off as 1/r2for large r. The central portion of the a-Si:H strip is only ∼ 60 nm from the MOS-FET, whereas most of the rest of the strip is 10 times farther away. Therefore, GMcould change by
∼ 102× 0.1 nS = 10 nS for a single charge added to the central portion of the a-Si:H strip. Further
work simulating these effects is required to calculate the exact dependence of the sensitivity of the MOSFET on r, and to more quantitatively characterize the MOSFET sensitivity.
In summary, we have shown experimentally that electrostatic screening significantly affects the charge sensitivity of a nanometer scale electrometer and that despite this effect, the electrometer is still very sensitive to its electrostatic environment, even at room temperature. We expect that this work will be used to help mitigate the effects of screening in the development of even more sensitive nanoscale electrometers.
Acknowledgement
and in part by the US Army Research Office under Contract W911NF-07-D-0004.
References
[1] Field, M.; Smith, C. G.; Pepper, M.; Ritchie, D. A.; Frost, J. E. F.; Jones, G. A. C.; Hasko, D. G. Phys. Rev. Lett. 1993, 70, 1311.
[2] Hess, H.; Fulton, T.; Yoo, M.; Yacoby, A. Solid State Commun. 1998, 107, 657.
[3] Elzerman, J. M.; Hanson, R.; van Beveren, L. H. W.; Witkamp, B.; Vandersypen, L. M. K.; Kouwenhoven, L. P. Nature 2004, 430, 431.
[4] Petta, J. R.; Johnson, A. C.; Taylor, J. M.; Laird, E. A.; Yacoby, A.; Lukin, M. D.; Mar-cus, C. M.; Hanson, M. P.; Gossard, A. C. Science 2005, 309, 2180.
[5] Fujisawa, T.; Hayashi, T.; Tomita, R.; Hirayama, Y. Science 2006, 312, 1634.
[6] Gustavsson, S.; Leturcq, R.; Simovic, B.; Schleser, R.; Ihn, T.; Studerus, P.; Ensslin, K. Phys.
Rev. Lett. 2006, 96, 076605.
[7] Amasha, S.; MacLean, K.; Radu, I. P.; D. M. Zumbühl,; Kastner, M. A.; Hanson, M. P.; Gossard, A. C. Phys. Rev. Lett. 2008, 100, 046803.
[8] Drndic, M.; Markov, R.; Jarosz, M. V.; Bawendi, M. G.; Kastner, M. A.; Markovic, N.; Tinkham, M. Appl. Phys. Lett. 2003, 83, 4008.
[9] MacLean, K.; Mentzel, T. S.; Kastner, M. A. Nano Lett. 2010, 10, 1037.
[10] Martin, J.; Ilani, S.; Verdene, B.; Smet, J.; Umansky, V.; Mahalu, D.; Schuh, D.; Abstre-iter, G.; Yacoby, A. Science 2004, 305, 980.
[11] Martin, J.; Ilani, S.; Verdene, B.; Smet, J.; Umansky, V.; Mahalu, D.; Schuh, D.; Abstre-iter, G.; Yacoby, A. Nature Physics 2008, 4, 144.
[12] Aassime, A.; Johansson, G.; Wendin, G.; Schoelkopf, R. J.; Delsing, P. Phys. Rev. Lett. 2001,
86, 3376.
[13] We specify the voltages applied to the gold contacts relative to the voltage applied to the
p-type substrate.
[14] The time scale over which GM drops is the same as the time scale over which VaSi drops,
which is 5µs for the experiments presented in this Letter.
[15] Sze, S. M. Physics of Semiconductor Devices; John Wiley and Sons, 1981.
[16] Shklovskii, B. I.; Efros, A. L. Electronic Properties of Doped Semiconductors; Springer-Verlag, 1984.
[17] Here we observe a monotonic decrease in∆aSi with increasingly negative VaSi for VaSi< 0 V.
However, if VaSi is made sufficiently more positive, an inversion layer will form underneath
the a-Si:H, which we expect may lead to additional screening and a decrease in∆aSi. We have observed such a decrease in∆aSi in an experiment performed with Vsub= 0 V.
[18] Johanson, R. E.; M. G. Günes,; Kasap, S. O. J. Non-Cryst. Solids 2000, 266 - 269, 242. [19] Street, R. A. Hydrogenated Amorphous Silicon; Cambridge University Press, 1991. [20] Parman, C. E.; Israeloff, N. E.; Kakalios, J. Phys. Rev. Lett. 1992, 69, 1097.
[21] Shanmugan, K. S.; Breipohl, A. M. Random Signals: Detection, Estimation and Data
Anal-ysis; John Wiley and Sons, 1988.
[22] Sun, C.; Lee, T.; Ma, S.; Lee, Y.; Huang, S. Optics Lett. 2006, 31, 2193.
[23] We do not have a direct measurement of the absolute bandwidth of the MOSFET sensor. In principle it is given by GM/CC ∼ THz, where CC ∼ aF is the capacitance of the
MOS-FET constriction. For the measurement set up used in these experiments, the bandwidth was limited by the 400 kHz Femto current amplifier used to measure GM.