HAL Id: insu-02539986
https://hal-insu.archives-ouvertes.fr/insu-02539986
Submitted on 14 Apr 2020
HAL is a multi-disciplinary open access archive for the deposit and dissemination of sci-entific research documents, whether they are pub-lished or not. The documents may come from teaching and research institutions in France or abroad, or from public or private research centers.
L’archive ouverte pluridisciplinaire HAL, est destinée au dépôt et à la diffusion de documents scientifiques de niveau recherche, publiés ou non, émanant des établissements d’enseignement et de recherche français ou étrangers, des laboratoires publics ou privés.
From burial to exhumation: emplacement and
metamorphism of mafic eclogitic terranes constrained
through multimethod petrochronology, case study from
the Lévézou massif (French Massif Central, Variscan
belt)
Caroline Lotout, Marc Poujol, Pavel Pitra, Robert Anczkiewicz, Jean van den
Driessche
To cite this version:
Caroline Lotout, Marc Poujol, Pavel Pitra, Robert Anczkiewicz, Jean van den Driessche. From burial to exhumation: emplacement and metamorphism of mafic eclogitic terranes constrained through multi-method petrochronology, case study from the Lévézou massif (French Massif Central, Variscan belt). Journal of Petrology, Oxford University Press (OUP), 2020, 61 (4), pp.egaa046. �10.1093/petrol-ogy/egaa046�. �insu-02539986�
1
From burial to exhumation: emplacement and metamorphism of mafic eclogitic terranes constrained through multimethod petrochronology: a case study from the Lévézou
massif (French Massif Central, Variscan belt)
C. Lotout a,b, M. Poujol a, P. Pitra a,c, R. Anczkiewicz d, J. Van Den Driessche a
Corresponding author: Caroline Lotout, caroline.lotout@gmail.com
Running title: The fate of Variscan eclogite via petrochronology
a Univ Rennes, CNRS, Géosciences Rennes - UMR 6118, F-35000 Rennes, France
b Géosciences Le Mans, Le Mans Université, Avenue Olivier Messiaen, 72085 Le Mans
CEDEX 9, France
c Česká geologická služba, Klárov 3, CZ-118 21 Praha 1, Česká republika
d Institute of Geological Sciences, Polish Academy of Sciences, Kraków Research Center,
Senacka 1, PL 31-002, Kraków, Poland
Abstract
Linking mineral growth and time is required to unravel the evolution of metamorphic rocks. However, dating early metamorphic stages is a challenge due to subsequent retrograde overprinting. A fresh eclogite and a former eclogite retrogressed under amphibolite facies
© The Author(s) 2020. Published by Oxford University Press. All rights reserved. For Permissions, please e-mail: journals.permissions@oup.com
from the southern French Massif Central (Lévézou massif, Variscan belt) were investigated with a large panel of geochronometers (U-Pb in zircon, rutile and apatite, Lu-Hf and Sm-Nd in garnet) in a petrological context tightly constrained by petrographic observations, trace element analyses and phase equilibrium modelling. Both samples recorded similar HP conditions at 18-23 kbar and 680-800°C, whereas the retrogressed eclogite later equilibrated at 8-9.5 kbar and ca. 600°C. In the retrogressed sample, most of the zircon grains are characterized by negative Eu anomalies and HREE enrichment, and yield an Ordovician U-Pb date of 472.3 ± 1.7 Ma, interpreted as the emplacement age of the mafic protolith. In agreement with other data available for the Variscan belt, and based on zircon trace element record and whole-rock geochemistry, this age is considered to represent the magmatism associated with the extreme thinning of the continental margins during the Ordovician. In the same sample, a few zircon rims show a weaker HREE enrichment and yield a date of 378 ± 5.7 Ma, interpreted as a prograde pre-eclogitic age. Lu-Hf garnet dating from both samples yields identical dates of 357 ± 13 Ma and 358.0 ± 1.5 Ma inferred to approximate the age of the high-pressure metamorphic peak. Fresh and retrogressed samples yield respectively 350.4 ± 7.7 Ma and 352 ± 20 Ma dates for Sm-Nd garnet dating, and 367.8 ± 9.1 Ma and 354.9 ± 9.5 Ma for U-Pb rutile dating. Apatite grains from the retrogressed sample give a mean age of 351.8 ± 2.8 Ma. The similarity between all recorded ages from distinct chronometers and radiometric methods (U-Pb – rutile, apatite; Lu-Hf – garnet; Sm-Nd – garnet) combined with
P–T estimations from high-pressure metamorphic rocks equilibrated under different
conditions testifies to very fast processes that occurred during the Variscan orogeny, highlighting a major decompression of 15-8.5 kbar in less than 7 Myr, and suggesting mean exhumation rates in excess of 6.3 mm/yr.
Keywords: U-Pb zircon, rutile and apatite geochronology, Lu-Hf and Sm-Nd garnet dating,
P–T estimates, Petrochronology, High-Pressure metamorphism dating, Exhumation, Variscan Belt, eclogite
INTRODUCTION
High-pressure (HP) metamorphism testifies to mountain building processes, including oceanic or continental subduction, as well as crustal thickening. The subsequent exhumation of HP rocks is accompanied by retrogression and re-equilibration, driven by a combination of erosion and tectonic processes. Rates and duration of metamorphism – in particular those of
HP metamorphism that bring invaluable insight into deeply buried terranes – are key
parameters to understand the geodynamic evolution of orogens. Numerous studies have attempted to constrain the age of HP metamorphism and the subsequent exhumation history by combining several geochronometers, such as U-Pb in zircon, monazite, rutile or titanite, and Lu-Hf and/or Sm-Nd in garnet (e.g., Anczkiewicz et al., 2007, 2012; Kylander-Clark et
al., 2007, 2008; Cheng et al., 2008, 2009, 2012; Warren et al., 2012; Colett et al., 2018;
Lotout et al., 2018; Manzotti et al., 2018; Butler et al., 2018, Cheng et al., 2018). The link between these ages and the metamorphic history of the rock, i.e. between time (t) and pressure-temperature (P–T) evolution, is generally achieved through trace element analysis of the dated minerals (e.g., linking the zircon and garnet growth through their rare-earth-element (REE) patterns, e.g., Rubatto, 2002; Whitehouse and Platt, 2003, Taylor et al, 2017; Walczak
et al., 2017; Lotout et al., 2018).
In the Variscan belt, the timing of the HP metamorphism and the subsequent exhumation of the subducted rocks is controversial. The convergence between two megacontinents, Laurussia to the north and Gondwana to the south, with the contribution of microplates, such as Armorica or Avalonia (e.g., Murphy et al., 2009; Kroner & Romer,
2013), induced the closure of oceanic domains, while oceanic rocks were subducted and metamorphosed under HP to UHP conditions (e.g., Matte, 1986; Lardeaux et al., 2001; Ballèvre et al., 2009, 2014). At the scale of the entire Variscan belt, the age of the HP metamorphism spreads from the middle to the upper Devonian (see the review of Paquette et
al., 2017), with the exception of the French Massif Central (FMC). The metamorphic pressure
peak in the FMC has long been considered to be late Silurian in age (410-430 Ma), based on only four studies (Pin & Lancelot, 1982; Ducrot et al., 1983; Paquette et al., 1995; Berger et
al., 2010; Fig. 1a). Nevertheless, a recent study (Lotout et al., 2018) questioned the validity of
these HP ages, resulting from outdated methods (e.g., dissolution of fractions of zircon from metamorphic rocks) or over-interpreted data. Based on a multimethod geochronological approach (Lu-Hf and Sm-Nd in garnet; U-Pb in zircon and apatite) this study yielded an age of 376.3 ± 3.3 Ma for the HP peak metamorphism in the Najac massif (southern FMC, Fig. 1a). Therefore, in order to decipher the processes involved in the building of the Variscan orogen in the FMC and to document the timing and duration of the HP metamorphic event, more petrochronological studies are required.
The Lévézou massif, located only some 70 km to the east of the Najac massif (Fig. 1a), exposes some of the best-preserved eclogites in the FMC and was chosen as the target of a multimethod geochronological study, in order to investigate the timing of HP metamorphism in this portion of the European Variscan belt. The strategy is based on a detailed study of two samples from the same HP unit: a perfectly preserved eclogite and a former eclogite largely retrogressed under amphibolite-facies conditions. P–T conditions are estimated through a petrographical analysis and numerical modelling of phase equilibria. We then use a large panel of geochronometers (U-Pb on zircon, rutile and apatite, Lu-Hf and Sm-Nd on garnet) combined with trace element analyses in some of the dated minerals (zircon, garnet) on both
samples, to decipher the timing of the HP metamorphism and subsequent exhumation of the subducted rocks.
GEOLOGICAL CONTEXT
In the French Massif Central, relics of HP rocks are found in the so-called “Leptyno-Amphibolitic Complex” (LAC) (e.g., Forestier, 1971; Santallier et al., 1988; Ledru et al., 1989; Bouchardon et al., 1989; Faure et al., 2009; Lardeaux, 2014; Fig. 1a). In the Lévézou massif, these HP terranes are dominated by mafic and ultramafic rocks with tholeiitic and calc-alkaline affinities (Nicollet, 1978; Piboule, 1979) and contain abundant lenses of eclogite, ± coronitic metagabbro, flaser gabbro, microtroctolite, metadolerite, serpentinite and peridotite. The emplacement of the tholeiitic suite was dated at ca. 485 ± 30 Ma (U/Pb in zircon population from a trondhjemite; Pin, 1979). A gabbro from the calc-alkaline suite was dated at 367 ± 10 Ma with the same method (Pin & Piboule, 1988). No dating of the HP metamorphism was ever performed in the Lévézou massif, but it has long been considered as Silurian in age (e.g., Duguet & Faure, 2004; Faure et al., 2009; Lardeaux, 2014) based on the similarity with published HP ages from other localities of the FMC (Pin & Lancelot, 1982; Ducrot et al., 1983; Paquette et al., 1995; Berger et al., 2010). The validity of these previous studies has been recently questioned (Paquette et al., 2017; Lotout et al., 2018), and the age of the HP metamorphism in the Lévézou massif remains unknown. The upper part of the Lévézou LAC comprises kyanite-garnet bearing micaschists, leucocratic paragneisses and quartzites (Fig.1b). Numerous interpretations have been proposed for the significance of the emplacement of the LAC in the Lévézou massif: (i) Nicollet (1978) suggested that the LAC corresponds to a subducted dislocated ophiolitic sequence; (ii) Piboule (1979) suggested an early intra-continental marginal basin, not fully evolved to an oceanic stage; (iii) Piboule and
Briand (1985) interpreted the LAC as a tholeiitic suite from a shallow crustal origin in a spreading environment; (iv) Pin & Piboule (1988) proposed a collision between two independent magmatic suites to account for the composite character of the LAC; (v) for Briand et al. (1988), the magmatic signature of the LAC corresponds to an emplacement in a back-arc basin environment; and (vi) Lardeaux (2014) finally reinterpreted the chemical composition of all the LAC occurrences from the FMC, including the LAC from the Lévézou, as reflecting a hyper-extended continental margin. However, all these authors agree on the fact that the LAC does not correspond to a metamorphosed mature oceanic crust. Despite the controversies on the origin of the LAC and its geodynamic emplacement setting, it is unanimously considered as the tectonic marker of a subduction stage during the Variscan orogeny (e.g., Ledru et al., 1989; Ballèvre et al., 2009; Lardeaux, 2014 and references therein). P–T conditions for the HP metamorphism in the Lévézou were first estimated at 12.5-20 kbar and 750-840°C (Nicollet & Leyreloup, 1978), then at 16 kbar and 720 ± 30°C (Bouchardon, 1987).
The Lévézou massif (Fig. 1b) is classically subdivided into four superposed units, the Upper Gneiss Unit (UGU), the eclogite-bearing LAC, the Lower Gneiss Unit (LGU), and the Parautochthonous Unit (PAU), from the centre to the outside of the massif. The UGU is composed of paragneisses and felsic orthogneisses, migmatized to various degrees. Mafic enclaves with rare relics of HP mineral assemblages, interpreted as xenoliths (Delor et al., 1985), are locally found within orthogneisses dated at 468.2 ± 2.7 Ma (Lotout et al., 2017). The LGU is composed of amphibolite-facies metasedimentary rocks intruded by several granitic bodies. The Parautochthonous Unit (PAU) is the most external and least metamorphosed unit, and is composed of quartzo-pelitic rocks considered Neoproterozoic to Lower Paleozoic (Nicollet, 1978), micaschists and quartzites with intercalated metarhyolites considered Lower Cambrian, (Collomb, 1964, 1970; Delbos et al., 1964). Thrusting of the
UGU and LAC on the LGU, and the underlying PAU, is responsible for an apparent inverted metamorphic zonation (Burg et al., 1989).
ANALYTICAL PROCEDURES
Chemical analyses, mineral composition and P–T modelling
The samples were first cleaned from any weathered material, then crushed in a jaw crusher and in an agate mortar to obtain a fine powder. Major and trace elements analyses were performed by Inductively Coupled Plasma Atomic Emission Spectrometry (ICP-AES) and Inductively Coupled Plasma Mass Spectrometry (ICP-MS), respectively, at the Geochemical and Petrographical Research Center (SARM laboratory, CNRS-CRPG) in Nancy, following the procedure described in Carignan et al. (2001). FeO (vs. Fe2O3) was
analysed by wet titration.
Mineral analyses were carried out with a Cameca SX100 electron microprobe (Microsonde Ouest, IFREMER, Plouzané, France) operating in a wavelength-dispersive mode (for the complete analytical procedure, see Pitra et al., 2008). Both whole-rock and mineral data were plotted using the software GCDkit (Janoušek et al., 2006).
P–T pseudosections have been calculated in the model system Na2O–CaO–(K2O)–
FeO–MgO–Al2O3–SiO2–H2O–TiO2–Fe2O3 (NC(K)FMASHTO) using the software
Theriak/Domino (de Capitani and Petrakakis, 2010), and the internally consistent thermodynamic data set 5.5 (Holland & Powell, 1998; updated Nov. 2003). Mixing models for solid solutions were taken from Diener & Powell (2012) – amphibole (amph), clinopyroxene (cpx), White et al. (2007) – garnet (g), biotite (bi), Holland et al. (1998) – chlorite (chl), Holland & Powell (2003) – plagioclase (pl), Holland & Powell (1998) – talc
(ta), epidote (ep), Coggon & Holland (2002) – muscovite (mu) and White et al. (2000) – hematite (hem), ilmenite (ilm). Albite (ab), lawsonite (law), quartz (q), rutile (ru) and titanite (sphene, sph) are considered as pure end members. The conversion of the mixing models for Theriak/Domino was obtained from Doug Tinkham (http://dtinkham.net/peq.html).
Other symbols (mole/atomic proportions) used are: XMg = Mg/(Fe2++Mg) (garnet,
clinopyroxene, amphibole), XAb = Na/(Ca+Na+K) (plagioclase), XGrs =
Ca/(Ca+Mn+Fe2++Mg), X
Prp = Mg/(Ca+Mn+Fe2++Mg), XAlm = Fe2+/(Ca+Mn+Fe2++Mg), XSps
= Mn/(Ca+Mn+Fe2++Mg) (garnet), X
Jd = [(2Na)/(Mg+Fe2++Ca+2Na) x AlM1]/(Fe3++ AlM1)
(clinopyroxene), XAe = [(2Na)/(Mg+ Fe2++Ca+2Na) x Fe3+]/(Fe3++ AlM1) (clinopyroxene);
wt% – weight per cent, mol.% – mole per cent, pfu – per formula unit.
The bulk-rock compositions used to calculate the P–T diagrams were corrected for the presence of apatite, not considered in the calculations – an amount of CaO equal to 3.33 that of P2O5 was allotted for apatite and subtracted from the bulk-rock molar content of CaO (e.g.,
Pitra & De Waal, 2001; Palin et al., 2016). In both samples, H2O was considered in excess in
P–T calculations, based on the dehydration character of most metamorphic reactions during
prograde metamorphism, leading to H2O saturation. Furthermore, model predictions, mineral
parageneses and mineral chemical compositions are consistent and in good agreement, ascertaining this initial assumption. Manganese has not been taken into account in the modelling because both rocks and their rock-forming minerals (including garnet) are poor in Mn and the mixing models for amphibole and pyroxene used do not include Mn.
LA-ICP-MS dating
A mineral separation procedure has been applied to concentrate zircon, rutile and apatite grains for U-Pb dating using the facilities available at Géosciences Rennes (University
of Rennes 1). The samples were crushed and only the powder fraction with a diameter < 250 µm was kept. Heavy minerals were first concentrated by Wilfley table, then magnetic minerals were removed with an isodynamic Frantz separator. Heavy minerals were afterwards separated with heavy liquids. Zircon, rutile and apatite grains were handpicked under a binocular microscope. The selected minerals were then embedded in epoxy mounts, which were ground and polished on a lap wheel. Zircon and apatite grains were imaged by cathodoluminescence (CL) using a Reliotron CL system equipped with a digital colour camera available at Géosciences Rennes, while rutile grains were imaged by Scanning Electron Microscope using a JEOL JSM 7100 F available at the University Rennes 1 (CMEBA).
U-Pb geochronology of zircon, rutile and apatite grains was conducted by in-situ laser ablation inductively coupled plasma mass spectrometry (LA-ICP-MS) at Géosciences Rennes using an ESI NWR193UC Excimer laser coupled to an Agilent quadripole 7700x ICP-MS equipped with a dual pumping system to enhance sensitivity. The instrumental conditions are reported in the supplementary table 1. Further information on the dating protocol is given in in Ballouard et al. (2015) for zircon, in Boutin et al. (2016) for rutile, and in Pochon et al. (2016) for apatite.
Ablation spot diameters of 35 µm and 25 µm (Zrn), 60 µm (Ru) and 45 µm (Ap) with repetition rates of 3 Hz (Zrn) and 5 Hz (Ru, Ap) and a fluence of 8.7 J/cm² were used. Data were corrected for U–Pb and Th–Pb fractionation and for the mass bias by standard bracketing with repeated measurements of the GJ-1 zircon (Jackson et al., 2004), R10b for rutile (Zack et al., 2011) and the Madagascar apatite (Cochrane et al., 2014). Along with the unknowns, zircon standard Plešovice (Sláma et al., 2008), rutile standard R19 (Zack et al. 2011), apatite standards McClure (Schoene & Bowring, 2006) and Durango (McDowell et al., 2005) were measured to monitor precision and accuracy of the analyses, and produced ages of
336.6 ± 4.1 Ma (Plešovice, N = 6, MSWD = 0.095), 491.8 ± 3.4 Ma (R19, N = 8, MSWD = 0.38), 532 ± 13 Ma (McClure, N = 4, MSWD = 4.4) and 32.5 ± 1.1 Ma (Durango, N = 5, MSWD = 0.34) during the course of the analyses.
Data reduction was carried out with the GLITTER® software package developed by the Macquarie Research Ltd. (Van Achterbergh et al., 2001) for zircon, and the data reduction scheme VizualAge_UcomPbine, a set of Iolite procedures that work with Igor Pro (Chew et
al., 2014) for apatite and rutile. Concordia ages and diagrams were generated using Isoplot
4.15 (Ludwig, 2012). All errors given in supplementary table 2 are listed at one sigma, but where data are combined for Concordia age or weighted mean calculations, the final results are provided with 95 % confidence limits.
Sm-Nd and Lu-Hf dating
Mineral separation was carried out at Géosciences Rennes. Rocks were crushed and, from the fraction <500 μm, about 70 mg of amphibole for sample LV20B, 70 mg of clinopyroxene from sample LV21 and 200 mg of relatively pure garnet from each sample were handpicked under a binocular microscope. Garnet fractions were subsequently split into three roughly equal aliquots. Additionally, about 100 mg of representative whole rock powder was prepared and used together with garnet and clinopyroxene or amphibole for Lu-Hf and Sm-Nd dating, conducted at the Institute of Geological Sciences, Polish Academy of Sciences, Kraków Research Centre. Leaching, sample dissolution and column chemistry follow procedures outlined in Anczkiewicz & Thirlwall (2003) and Anczkiewicz et al. (2004). All measurements were carried out in a static mode using a Neptune multi-collector (MC) ICP-MS applying the protocols similar to those outlined in Thirlwall & Anczkiewicz (2004). Procedure blanks, standards reproducibility, decay constants and reference isotopic ratios
used for the calculations are given in the footnote of table 1. Ages and 176Hf/177Hf and
143Nd/144Nd initial ratio calculations were conducted by Isoplot 4.15 (Ludwig, 2012). Errors
for isotopic ratios are given at the 2 se (standard error) level. Age errors are quoted at 95% confidence level.
Trace element analyses in garnet and zircon
Trace element analyses in garnet (performed in thin section) and zircon (performed in grains mounted in epoxy) were conducted at the Institute of Geological Sciences, Polish Academy of Sciences, Kraków Research Centre, using an Excimer laser (193 nm) RESOlution M50 by Resonetics (now Australian Scientific Instruments) equipped with a S150 dual volume sample cell. Laser ablation was coupled with an ICP-MS XSeriesII by Thermo Fisher. Fluence of about 8 J/cm2, and 10 Hz repetition rate were applied during the
measurements. Analyses of zircon were performed in spot mode with beam size of 29 or 43 μm diameters. The results were normalized to the NIST612 primary standard using the recommended values of Jochum et al. (2011). MPI DING glasses served as secondary standards for data quality control. Silica content was used as an internal standard (fixed at 31.5 wt% in zircon). Analyses of garnet profiles were performed in raster mode with a stage speed of 0.250 mm/min and a slit size of 40 μm. More details on analytical conditions are given in Anczkiewicz & Anczkiewicz (2012). Data reduction was carried out using Iolite 3.0 (Paton et al., 2010) with the “trace element” data reduction scheme (Woodhead et al., 2007).
RESULTS
WHOLE-ROCK GEOCHEMISTRY
Two eclogite samples (LV21 and LV20B) were collected in the LAC of the Lévézou massif, in outcrops close to each other (LV21: 44°12'50"N, 2°40'48"E; LV20B: 44°14'7"N, 2°42'2"E; Fig. 1b). Both samples are calc-alkaline basic rocks (46.53% and 50.58% SiO2, and
2.61% and 3.05% Na2O+K2O, respectively) with high Al2O3 and MgO contents (LV20B:
14.53% and 8.54%, respectively; LV21: 18.92% and 11.63%, respectively; supplementary table 3). Al-FeT+Ti-Mg and Zr/Ti vs. Nb/Y diagrams show that the protoliths of the two
eclogitic samples had a basaltic composition (Fig. 2b, d), with a high-Mg tholeiitic chemical character.
REE contents are low in both samples (∑REE = 24.07 and 43.36 for LV21 and LV20B, respectively, Fig. 2a, supplementary table 3). HREE spectra are slightly depleted (Yb/Gd = 0.67-0.72). Light-REE contents are different as the fresh eclogite LV21 is depleted (La/Nd = 0.20), whereas the retrogressed eclogite LV20B shows a slight enrichement (La/Nd = 0.55)
A spider diagram normalized to NMORB immobile elements (Fig. 2c) shows that sample LV21 is systematically depleted in immobile elements. LV20B shows a similar pattern, with the exception of the La, Ce, Pr and Th that are slightly enriched.
Following the classification of Verma et al. (2006) for basic rocks based on major element contents, the geochemical contents of the two samples systematically plot within the IAB (Island-Arc Basic rock, see supplementary Fig. 1) domain. Similarly, according to the classification of Hollocher et al. (2012), based on the La/Yb – Nb/La ratios, sample LV21 plots within the Oceanic Arc box domain, while LV20B plots within the Continental Arc box domain (supplementary Fig. 2a). The Th vs. Nb diagram following Pearce (2008) highlights a crustal contamination for sample LV20B (Th/Yb=0.36 and Nb/Yb=0.49; supplementary
Fig.2b); the Th content was under the detection limit for sample LV21 and was consequently not plotted. Regardless, both samples display an arc-derived chemical character.
PRESSURE AND TEMPERATURE ESTIMATIONS
Fresh eclogite
Petrography
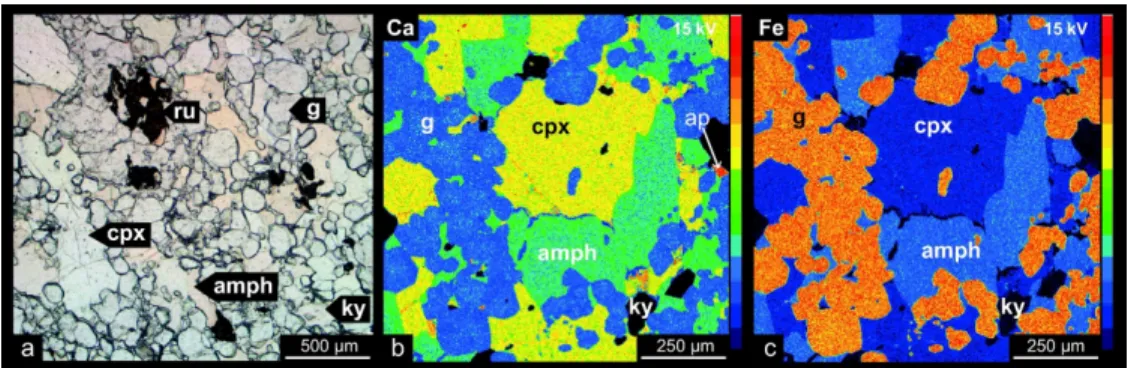
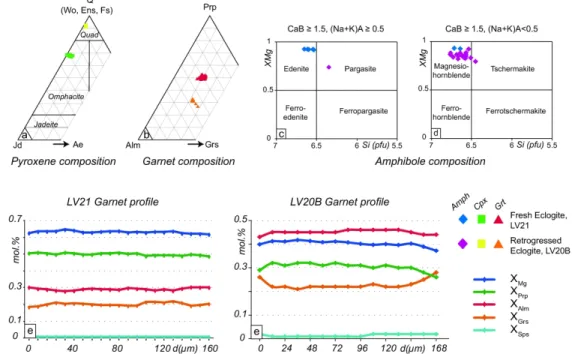
LV21 is a pale isotropic fine-grained eclogite, composed of garnet, omphacite, amphibole, kyanite and rutile. Garnet forms small subhedral grains (40-250 µm) in honeycomb textures along the clinopyroxene and amphibole grain boundaries (Fig. 3a). They are rarely included in clinopyroxene and amphibole. Garnet is inclusion-free, homogeneous, magnesian and chemically not zoned in major elements (XMg = 0.59-0.66, XPrp = 0.48-0.52,
XAlm = 0.27-0.34, XGrs = 0.17-0.22, XSps ≤ 0.01; Figs. 3b, c and 4b, e; supplementary table 4).
Subhedral tabular crystals of clinopyroxene (80-600 µm) are not zoned in major elements and have the composition of omphacite (XJd = 0.27-0.31; XAe ≤ 0.05; Fig. 4a, supplementary table
4). Few zircon crystals and numerous tiny rutile needles, oriented parallel to the crystal lattice, are commonly concentrated in the core of the omphacite crystals.
Amphibole forms euhedral to subhedral crystals (50-500 µm), which are calcic, non-zoned and chemically homogeneous and span a compositional space between edenite and magnesiohornblende (Si = 6.54-6.72 pfu, Ca = 1.57-1.78 pfu, (Na+K)A = 0.46-0.57,
Ti = 0.05-0.09 pfu , XMg = 0.92-0.93; Figs 3b, c and 4c, d; supplementary table 4). It locally
contains garnet and tiny rutile as inclusions. Rutile occurs as reddish to orange subhedral crystals (50-250 µm) in the matrix, or as needles included in the core of omphacite and
amphibole. Rare elongate kyanite can be observed in the matrix. Sulfides (pyrite, chalcopyrite), zircon and apatite constitute the accessory minerals.
No symplectites developed at the expense of the above-mentioned minerals. Therefore, the sample can be considered as a perfectly preserved, non-retrogressed eclogite. The stable metamorphic assemblage is interpreted as garnet-omphacite-amphibole-kyanite-rutile.
P–T estimates
In order to calculate P–T pseudosections, the whole-rock composition was reduced to the NCFMASHTO model system. In particular, K2O was removed from the bulk, since (i) no
K-bearing phase was observed in the thin section, (ii) the amount of K2O in the bulk rock is
very low (0.16 wt%), and (iii) the amphibole model used does not incorporate K.
In the pseudosection (Fig. 5a), the P–T stability field corresponding to the inferred eclogite-facies assemblage garnet-omphacite-amphibole-kyanite-rutile is located from ~18 to 24 kbar and 650 to >800°C. It is delimited by the appearance/disappearance lines of chlorite and epidote at low T, quartz at low P, and amphibole at high P. Compositional isopleths and the observed range of XMg of garnet (0.59-0.66) and amphibole (0.92-0.94) constrain the
equilibration conditions at 21-23 kbar and 680-800°C (Fig. 4b). Compositional isopleths have also been calculated for XGrs in garnet, and XJd and XMg in omphacite (supplementary Fig. 3).
The modelled values are compatible with observations but spread over a very large P-T space and are not helpful in better constraining the equilibration P-T conditions of the peak assemblage. Mode isopleths calculated for garnet show that garnet can only grow along a prograde P–T path (Fig. 5c).
Retrogressed eclogite
Petrography
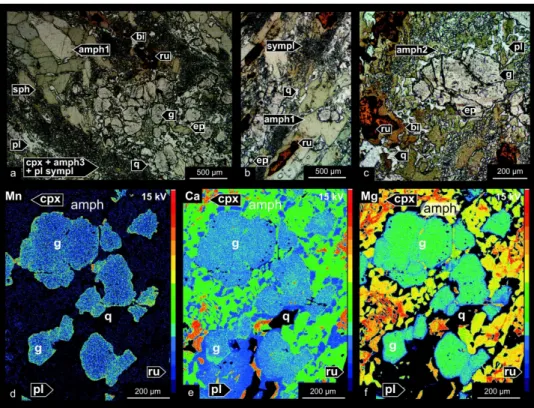
LV20B is a light greenish fine-grained rock, dominated by garnet and relatively coarse amphibole (up to 2 mm) surrounded by fine-grained symplectites of amphibole, plagioclase and diopside. Also present are minor quartz, epidote, rutile, titanite, biotite, ilmenite, zircon, and apatite. Small subhedral garnet (60-260 µm) has a large core, chemically not zoned in major elements (XMg = 0.40-0.41, XAlm = 0.45-0.46, XPrp = 0.29-0.32, XGrs = 0.21-0.23, XSps ~
0.01) and locally a slightly zoned rim (up to 40 µm thick) marked by a decrease of XMg
(0.400.37) and pyrope (0.320.26) and a concomitant increase in grossular (0.220.28) and spessartine (0.010.02; Figs 4b, e, f and 6a, c, d, e, f, supplementary table 4). Garnet locally contains inclusions of epidote, amphibole (50-150 µm) and rarely tiny K-feldspar (< 20 µm). Amphibole spans a compositional space between pargasite, tschermakite and magnesiohornblende (Fig. 4c-d) Based on their textural position, three main types of amphibole can be described. (i) Amphibole 1 forms large anhedral green crystals (0.2-2 mm). They are calcic, magnesian (Ca = 1.80-1.85 pfu; XMg = 0.73-0.83; Si = 6.53-6.79 pfu;
(Na+K)A = 0.42-0.56 pfu) and have a low Ti content (Ti = 0.04-0.11 pfu). (ii) Small brownish
crystals of amphibole 2 (50-250 µm) are commonly closely associated with rutile or surround fine-grained symplectites. They have a calcic and magnesian composition (Ca = 1.84-1.88 pfu; XMg = 0.69-0.71; (Na+K)A = 0.47-0.55 pfu, Si = 6.42-6.51 pfu), and show a higher
Ti content (Ti = 0.17-0.20 pfu). (iii) Amphibole 3 forms tiny light green crystals (10-50 µm) in symplectites with plagioclase. They are also calcic (Ca = 1.90-1.96 pfu; (Na+K)A =
0.54-0.60 pfu, Si = 6.35-6.49 pfu), magnesian (XMg = 0.67-0.76) and display a variable content in
Ti (Ti = 0.05-0.20 pfu). Garnet and amphibole 1 are commonly surrounded by coronae of amphibole 3 + diopside + plagioclase-bearing symplectites.
Ca-clinopyroxene develops in the symplectite, and displays a diopside composition (XCa =
0.92; XJd = 0.05; XAe = 0.03). Epidote occurs as rounded grains disseminated in the matrix,
locally as small inclusions ( 50 µm) in amphibole and garnet. Plagioclase occurs as small crystals in the matrix (100-300 µm), and as tiny lamellae in symplectites (Fig. 6a, d). Despite the different textural position, all crystals have the same composition (XAb = 0.58-0.69,
supplementary table 4). Rutile forms tiny prismatic inclusions (10-75 µm) in amphibole 1 and anhedral grains (100-500 µm) in the matrix (Fig. 6). Brown small biotite crystals (50-200 µm) are localized close to amphibole and rutile (Fig. 6a, d). Quartz grains are observed in the matrix (Fig. 6a, c, d). Based on textural relations, amphibole 1 is interpreted as “primary” and as a part of the original high-pressure assemblage, containing also garnet and rutile. The dominant “secondary” mineral assemblage comprises amphibole 3, plagioclase, diopside, titanite and biotite.
P–T estimates
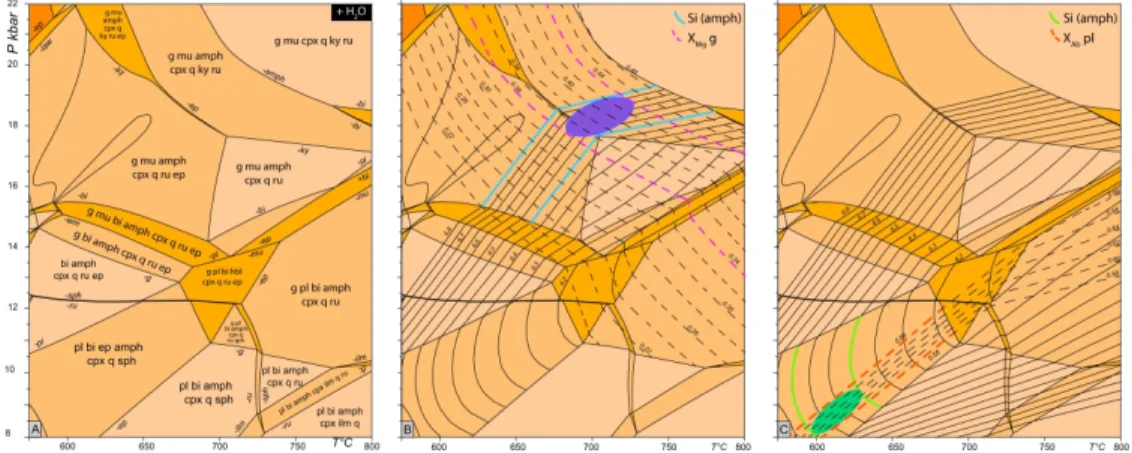
Calculations were performed in the model system NCKFMASHTO, including K2O, since
biotite is part of the dominant assemblage amphibole-diopside-plagioclase-titanite-epidote-biotite. The corresponding P–T stability field is located at <8-12 kbar, <600-700°C (Fig. 7a). It is delimited by the appearance/disappearance of garnet and epidote at high T and plagioclase at high P. Compositional isopleths were used to constrain the equilibration conditions of both the dominant (retrograde) and the primary mineral assemblages. The intersection of the isopleths for the Si content of amphibole 1 (Si = 6.5-6.8 pfu) and XMg of
garnet (XMg = 0.34-0.44) suggests the equilibration of the primary assemblage under
facies conditions at 17.5-19 kbar and 680-750°C, in the P–T stability field garnet-muscovite-amphibole-clinopyroxene-rutile-quartz ± kyanite (Fig. 7b). Due to the highly retrogressed character of the sample, we cannot ascertain the presence or absence of kyanite to constrain the P–T stability field. The intersection of the isopleths for amphibole 3 (Si = 6.35-6.50 pfu) and plagioclase (XAb = 0.58-0.69) suggests re-equilibration at 600-640°C and 8-9.5 kbar in the
stability field plagioclase-biotite-epidote-amphibole-clinopyroxene-quartz-titanite (Fig. 7c).
GARNET TRACE ELEMENT CHEMISTRY AND DATING
Trace element chemistry
Representative trace elements zoning profiles for both samples are shown in Fig. 8. Because of the selected beam size, the Hf contents were below detection limit and could not be measured in thin section. Two representative spectra from each sample were chosen to illustrate the REE variations in garnet. In both samples, the REE contents in whole rock as in garnet, clinopyroxene or amphibole are very low (supplementary table 3).
Zoning profiles in LV21 garnet display various patterns (Fig. 8a, c; supplementary table 5). The first profile displays an “oscillatory zonation”. The core of the garnet is composed of a centre characterized by a very low Lu content (down to 0.1 ppm) surrounded by the highest Lu content (~1-1.5 ppm). The surrounding rims show Lu contents decreasing towards the edge (from ~1 to 0.3-0.4 ppm). The second type of profile displays very low Lu content in the inner part of the crystal that tends to increase towards the edge up to 1 ppm. The Sm and Nd contents in both crystal types are low, near or even below the detection limits with the applied analytical conditions, but since the Sm and Nd behaviour is strongly coupled, the zonation trends can be deciphered from Sm alone. The Sm content shows a slight rise
towards the edges (up to 1-2.5 ppm) with the lowest content in the inner part of the crystal (~0.4 ppm).
Zoning profiles in LV20B garnet are similar (Fig. 8b, d; supplementary table 5). The HREE contents are low, Lu contents barely exceeding 2 ppm, but display a typical enriched core (up to 2.5 ppm) – depleted rim (down to 0.5 ppm) zonation. The Sm and Nd values are low, rarely higher than the detection limits. When detected, Sm shows contents ranging from 0.2 to 2 ppm throughout the crystals. Nd contents do not exceed 0.6 ppm in the core of the garnet crystals, but can reach up to ~1.6 ppm in the rims.
Garnet dating
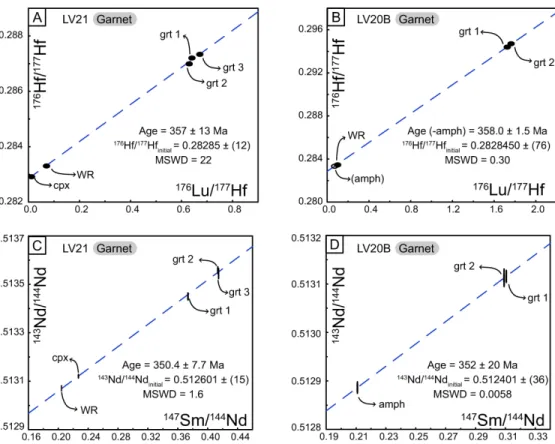
Lu-Hf dating
Lu and Hf contents from sample LV21 were low and practically the same in all analysed garnet fractions, with values in the range of 0.59-0.60 ppm and 0.13-0.14 ppm, respectively (Table 1). These contents are in a good agreement with the LA-ICP-MS measurements performed on garnet in thin section (see Garnet trace element chemistry above). The Hf contents determined by isotope dilution is low, and typical of metamorphic garnet, which suggests that no Hf-rich inclusions disturbed the analyses. The 176Lu/177Hf
ratios are low (0.629-0.670) but significantly higher than the ones from the WR or the clinopyroxene fractions (0.070 and 0.007 respectively). The isochron yields a date of 357 ± 13 Ma (MSWD = 22; Fig. 9a, Table 1), the low precision being linked to the low
176Lu/177Hf ratio and to the excess scatter among the analysed garnet fractions. The accuracy
of the results is discussed in the interpretation section below.
The Lu and Hf contents from sample LV20B were also low in all the isotope dilution analyses (Table 1), Lu ranging 0.9-1.3 ppm, and Hf 0.08-0.10 ppm. Similarly, the low Hf values suggest that no Hf-rich inclusion disturbed the analyses. 176Lu/177Hf ratios in garnet are
higher in this sample (1.74 and 1.76), and significantly different from the 176Lu/177Hf ratios of
WR and amphibole (0.08 and 0.07 respectively). The significant spread on an isochron allowed to define a date of 357.5 ± 4.0 Ma (MSWD = 16) with an initial
176Hf/177Hf = 0.282862 ± 56. The isochron age, calculated without the WR, is similar but
more precise at 356.9 ± 1.5 Ma (MSWD = 0.31), and the calculation including the WR and removing the amphibole fractions yields a date of 358.0 ± 1.5 Ma (MSWD = 0.30, initial
176Hf/177Hf = 0.2828450 ± 76; Fig. 9b).
Sm-Nd dating
The Sm and Nd contents in LV21 garnet, measured by isotope dilution, are low, ranging 0.63-0.69 ppm and 0.92-1.12 ppm, respectively (Table 1). 147Sm/144Nd ratios also
display very low values of 0.37-0.42. Analyses of Sm and Nd performed in situ on garnet via LA-ICP-MS directly in thin section were near or below detection limits; consequently, the comparison of Sm/Nd ratios obtained from LA-ICP-MS and dilution, to track possible contamination via unnoticed micro-inclusions, is not appropriate. All the garnet, clinopyroxene and WR fractions yield an isochron date of 350.4 ± 7.7 Ma (MSWD = 1.6) with an initial 143Nd/144Nd = 0.512601 ± 15 (Fig. 9c).
The Sm and Nd contents are similarly very low in LV20B garnet, displaying values of 0.60 and 0.64 ppm for Sm and 1.18 and 1.24 ppm for Nd (Table 1). The 147Sm/144Nd ratios of
the garnet aliquots are low, ranging 0.309-0.311. This ratio is also low for the amphibole and WR fractions, with values of 0.211 and 0.187, respectively. However low, the 147Sm/144Nd
ratios obtained by isotope dilution are high compared to those obtained by LA-ICP-MS, suggesting the possible contribution of unnoticed microscopic inclusions. The higher contents of Nd compared to Sm (1.18-1.24 and 0.60-0.64, respectively) also suggest the contribution from a Nd-bearing mineral. The two garnet fractions together with the WR and amphibole fractions define a date of 371 ± 12 Ma (MSWD = 2.8). Excluding the WR from the calculation yields a date of 352 ± 20 Ma (MSWD = 0.0058) (Fig. 9d), while excluding the amphibole fraction yields a date of 371 ±12 Ma (MSWD = 0.0095).
ZIRCON DATING AND TRACE ELEMENT CHEMISTRY
Zircon U-Pb dating
Sample LV20B was the only one to provide sufficiently large zircon grains. The crystals are colourless, mostly subhedral to euhedral and range in size from 40 to 350 µm (Fig. 10). A few metamict crystals were avoided during the picking stage. Zircon grains display oscillatory zonation (Fig. 10, zircon grains a and d), patchy zonation (Fig. 10, zircon grains b, e, f) and core and rim textures (Fig. 10c). Where possible, the rims were analysed. Sixty-six analyses were performed out of forty-five zircon grains. Three groups can be distinguished.
(i) A Cambrian group is composed of 11 analyses performed on 9 zircon grains. All analyses are concordant to slightly discordant, and 8 of them allowed us to calculate a Concordia date (as of Ludwig, 1998) of 511.5 ± 4.3 Ma (MSWD = 0.47, Fig. 11a, b). One concordant analysis displays an older date at ca. 570 Ma. Cambrian zircon grains display oscillatory zonation (e.g., Fig. 10, zircon grains a and d) and never exhibit patchy zonation. Their Th/U ratios vary from 0.3 to 0.9, while the U content varies from 28 to 570 ppm (supplementary table 2).
(ii) Ordovician grains define the second group, represented by 47 analyses obtained on 34 zircon grains. The analyses are concordant to discordant. Forty-four analyses provide a lower intercept date of 472.4 ± 1.7 (MSWD = 0.78, Fig. 11a, c, supplementary table 2), while the 32 most concordant analyses yield a Concordia date of 473.4 ± 2 Ma (MSWD = 1.3, Fig. 11c). The three remaining analyses (450 Ma, supplementary table 2, 40, 51 and zr-56) are sub-concordant to slightly discordant, and are best explained by variable Pbd loss and common Pb enrichment. The Ordovician zircon dates occurs either in zircon cores (e.g., Fig. 10, zircon c, spot zr-04), or in grains characterized by oscillatory or patchy zoning (e.g., Fig. 10, zircon e, spots zr-40, zr-41, zr-45; zircon f, spots zr-01, zr-02, zr-03). Their Th/U ratios are variable (0.3-1.0) with U contents highly variable between 63 and 799 ppm (supplementary table 2).
(iii) The last group yields Devonian dates, obtained on six analyses from five different zircon grains yielding a lower intercept date of 378.6 ± 5.7 Ma (MSWD = 0.96, Fig. 11a, d). The four concordant analyses yield a Concordia date of 382.3 ± 2.3 Ma (MSWD = 1.4, Fig. 11d, inset). Four analyses were obtained on zircon rims surrounding an Ordovician core (e.g., Fig. 10, zircon a, spot zr-53 and zircon c, spot zr-61), while two analyses correspond to different patchy zoning within a solely Devonian zircon (e.g., Fig. 10, zircon b, spot zr-17 and zr-18). Therefore, the Devonian dates do not correspond to a specific zircon texture. Their Th/U ratios are distributed from 0.4 to 0.6, with U contents ranging from 66 to 220 ppm (supplementary table 2). No correlation can be established between the ages and the U contents or the Th/U ratios.
Finally, in the whole set of analyses, there is no evident pattern linking the texture of the zircon crystals to their apparent ages. Similarly, no obvious link exists between the dates and the U contents (from 28 to 799 ppm) or the Th/U ratios (from 0.3 to 1.0) (supplementary table 2).
Zircon trace element chemistry
The three apparent age groups (Cambrian, Ordovician and Devonian) were also analysed for their trace elements contents, in different textural positions (core, rim, patchy and oscillatory zonation). All REE spectra are variably enriched in HREE (YbN/GdN =
13.25-78.59, Fig. 12a), and display various Eu anomalies (Eu/Eu* = 0.25-0.71, Fig.12b, supplementary table 6). They are hereafter described according to their measured apparent ages.
Devonian zones were too small to be systematically analysed and consequently only three spots were measured. They systematically display the lowest Ce/Ce* (1.6-6.08) and no or a weak negative Pr/Pr* (0.46-1.06). The Eu anomalies are variable (Eu/Eu* = 0.35-0.71), while HREE are enriched (YbN/GdN = 44.25-78.59; Fig. 12a). This group nevertheless
displays the lowest HREE contents (GdN = 8.42-28.66; LuN = 1138.98-1892.99). Yttrium
contents are also low in this dataset (Y = 211.46-582.05 ppm, Fig. 12b). This group displays the highest U/Yb ratios, ranging 0.72 to 2.78. Ce/Yb and Gd/Yb ratios are of 0.02 and 0.02-0.03, respectively.
Ordovician zones are homogeneous (Fig. 12), all analyses show high Ce anomalies (Ce/Ce* = 14.82-92.35), strongly negative Eu/Eu* (0.25-0.40) and Pr/Pr* (0.10-0.47) and a strong HREE enrichment (YbN/GdN = 13.25-38.05, av. 27.7). They show high Y (Y =
736.34-3838.82 ppm, Fig. 12) and HREE contents (GdN = 46.23-411.44; LuN = 2064.17-6764.17)
compared to the analyses done in the Devonian zones. This group displays U/Yb ratios ranging 0.41-0.99. Ce/Yb and Gd/Yb ratios are low, from 0.01 to 0.03 and 0.03 to 0.09 (Fig. 12c, d, e, f, supplementary table 6).
Cambrian zones (Fig. 12) display high Ce anomalies (16.62-51.85), low negative Eu anomalies (0.31-0.34), and an enrichment in HREE (YbN/GdN = 18.83-27.87, av. 21.58). The
Pr/Pr* anomaly is highly negative, ranging 0.20-0.28. The Y contents are also high (Y = 1188.14-3422.89 ppm, Fig. 12). This group displays U/Yb ratios from 0.58 to 0.87. Gd/Yb and Ce/Yb ratios are low, ranging 0.04-0.06 and 0.02, respectively (Fig. 12c, d, e, f, supplementary table 6).
Cambrian and Ordovician zones show similar U/Yb, Gd/Yb, Ce/Yb ratios. The few Devonian analyses display similar Gd/Yb and Ce/Yb ratios, but show a higher U/Yb. Despite a small variability, all the analyses fall within the “continental crust zircon” according to provenance diagrams of Grimes et al. (2007).
RUTILE GEOCHRONOLOGY
In sample LV21, the dated rutile grains are subhedral, reddish to orange, ranging from 80 to 230 µm in size (Fig. 3a). Seventeen analyses were performed on fourteen rutile crystals. Plotted in a Tera-Wasserburg diagram, all analyses are discordant because of the variable amounts of common Pb and rather low U contents (1.11-2.29 ppm). Nevertheless, all analyses spread on a Discordia and allow for calculation of a fairly well-constrained lower intercept date of 367.8 ± 9.1 Ma (MSWD = 1.5, Fig. 13a, supplementary table 2) with a 207Pb/206Pb
initial value at 0.891. The weighted average 207Pb-corrected date (calculated at 370 Ma using
the Stacey & Kramers (1975) terrestrial Pb evolution model) is equivalent within error at 365.6 ± 8.4 Ma (MSWD = 1.7).
The dated rutile grains from LV20B are reddish to dark, anhedral, with sizes ranging from 80 to 190 µm (Fig. 6a). Eighteen analyses were conducted on 18 rutile grains. All analyses are discordant because of the presence of variable amounts of common Pb. The U
contents in rutile are very low, mostly ranging from 0.9-3.6 ppm except for one analysis with an uranium content of 9.6 ppm. All analyses allow to calculate a lower intercept date of 354.9 ± 9.5 Ma (MSWD = 2.1, Fig. 13b), and a 207Pb-corrected date of 350.6 ± 7.3 Ma
(MSWD = 1.6).
APATITE GEOCHRONOLOGY
Apatite grains were found in both samples but were too small in sample LV21 to be analysed. Apatite grains from LV20B are colourless and rounded, ranging in size from 150 to 200 µm. Twenty-three analyses were performed on 23 apatite grains (supplementary table 2). The grains are very homogeneous in cathodoluminescence and characterized by low U (2.0-14.6 ppm) and Pb (0.8-4.2 ppm) contents. All the analysed apatite grains contain some common Pb and therefore plot in a discordant position in a Tera-Wasserburg diagram (Fig. 13c). The resulting Discordia allows to calculate a lower intercept date of 354.6 ± 8.6 Ma (MSWD = 0.44) with a 207Pb/206Pb initial value of 0.901. The weighted
average 207Pb-corrected date (calculated at 350 Ma using the Stacey and Kramers (1975)
terrestrial Pb evolution model) is equivalent within error at 351.8 ± 2.8 Ma (MSWD = 0.98, Fig. 13d).
INTERPRETATION AND DISCUSSION
From dates to ages
Zircon
Th/U ratios range from 0.33 to 1.01, a range that is much higher than the usual values expected for metamorphic zircon (<0.1, Rubatto, 2002). Nevertheless, the sample does not contain Th-rich minerals, such as, monazite or allanite, which could explain these higher Th/U ratios as suggested by Harley et al. (2007).
The Cambrian and Ordovician dates display true “magmatic-like” spectra (marked negative Eu anomaly and enrichment in HREE, e.g., Rubatto, 2002). The concordant date of 473.4 ± 2 Ma is well recorded by the majority of zircon grains from this sample and is equivalent to the emplacement age of the neighbouring orthogneisses (ca. 470 Ma, Lotout et
al., 2017). Accordingly, it is proposed that this date of 473.4 ± 2 Ma corresponds to the
emplacement and crystallization of the protolith of the metabasic rocks. The cluster of 9 zircon grains that recorded an older Cambrian date (grains free of any rims or cores) could correspond to xenocrysts (i.e., contamination) coming from the intruded rocks (not dated but considered Cambrian-Ordovician in the literature, e.g.,, quartzo-pelitic rocks from the PAU, considered Neoproterozoic to Lower Paleozoic, Nicollet (1978); the metarhyolites from the PAU considered Lower Cambrian, Collomb (1964)). Moreover, magma-crust interaction is highlighted in sample LV20B (see Whole rock geochemistry section and supplementary Fig. 2b), and therefore support the crustal contamination origin for the Cambrian zircon.
The 378.6 ± 5.7 Ma date is poorly recorded and obtained in zircon zones displaying less-enriched HREE patterns, lower Eu anomalies (0.4-0.8), lower Th/U ratios (0.34-0.59), and lower Y contents (~200-600 ppm). This chemistry, although different from that of magmatic zircon, is not characteristic of eclogitic zircon, which is expected to display no HREE enrichment, no Eu anomaly, and Th/U < 0.1 (Rubatto, 2002). This spectrum is likely to correspond to zircon growth or recrystallization during a metamorphic reaction on the prograde path, prior to the eclogite facies.
Garnet
The first profile from sample LV21 (Fig. 8a) shows, despite the low Lu contents, a depleted inner core surrounded by Lu highs and a rimward depletion. The second profile from the same sample does not show the Lu highs in the garnet core. Instead, it shows that the edges are apparently slightly enriched in Lu. All Lu profiles in garnet LV20B show a systematic classic Rayleigh fractionation (enriched core evolving to depleted rim).
Garnet grains, in the two samples, belong to the HP assemblage (peak estimated at 18-23 kbar, 680-800°C). The Lu-Hf results in both samples yield comparable dates around ~358 Ma. Three generations of amphibole are described in the retrogressed sample and despite a careful attention during the hand-picking procedure to select only the large greenish amphibole 1, possible contamination with amphibole crystals of the second or third generation cannot be excluded. Consequently, the use of garnet and WR aliquots to calculate an isochron appears more appropriate, and the corresponding date of garnet from LV20B is therefore 358.0 ± 1.5 Ma (MSWD = 0.30). Despite the low precision in LV21 (357 ± 13 Ma, MSWD = 22), Lu-Hf dates obtained on garnet from both the retrogressed and the fresh eclogitic samples are equivalent within error, suggesting that these dates are accurate and geologically meaningful. The Lu zoning in garnet grains from LV20B shows a typical core-enriched and rim-depleted pattern, which is consistent with a growth zoning. The age obtained from LV20B is therefore mostly controlled by the core and approximates the early growth of the garnet crystals. Garnet from the sample LV21 displays the opposite trend, with Lu-enriched rims, suggesting that the Lu-Hf garnet date is the best estimate for garnet crystallization at peak pressure. Even considering the highest T estimation modelled for the rocks (800°C), the
T necessary for an effective diffusion of Lu and Hf is higher (e.g., Anczkiewicz et al., 2007,
Smit et al., 2013), and consequently, this did not affect the calculated dates. The similarity between the two dates, despite the opposite Lu zoning trend (enriched cores vs. Lu-enriched rims), is then best explained by incipient crystallization and fast further growth of garnet at 358.0 ± 1.5 Ma.
In both samples, Sm and Nd show very low contents which, when successfully analysed, lead to incomplete profiles that are difficult to interpret. Nevertheless, in all profiles, Nd and Sm contents appear to be slightly higher in the rims, a feature typical of incompatible element behaviour. LV21 yields a Sm-Nd date of 350.4 ± 7.7 Ma, equivalent, within error, to the Lu-Hf date obtained in the same sample. The temperatures reached by the rocks are largely above the Sm-Nd closure temperature commonly accepted for garnet (ca. 650-700°C for the concerned grain size; e.g., Tirone et al., 2005; Smit et al., 2013), which suggests that the Sm-Nd date of 350.4 ±7.7 Ma corresponds to cooling during exhumation.
The LV20B Sm-Nd data, when all fractions are used in the calculation, yield a date of 371 ± 12 Ma, significantly older than the Lu-Hf date of 357 ± 4 Ma recorded on the same aliquots. Excluding the amphibole fraction from the calculation yields similar results, while excluding WR yields a poorly constrained date of 352 ± 20 Ma, similar to the one recorded in the fresh sample LV21. The low Sm/Nd ratios, the stability of epidote in the sample, and Nd contents higher than the Sm contents suggest a possible Nd-rich inclusion contamination in the dated garnet aliquots. This issue seems corroborated by the different ages calculated using (or not) the WR or amphibole aliquots. Therefore, the Sm-Nd date obtained from LV20B has to be disregarded to decipher the P–T–t evolution of the sample, and to discuss the large-scale evolution of the eclogitic terranes of the Lévézou massif.
Rutile
The recorded date of 367.8 ± 9.1 Ma (MSWD = 1.5, N = 16) in the fresh sample is analytically good (good spread, valid 207Pb/206Pb initial value) and is equivalent within error
to the date recorded in garnet from the same sample (Lu-Hf: 357 ± 13 Ma). Similarly, rutile analyses from the retrogressed sample provide a lower intercept date of 354.9 ± 9.5 Ma (MSWD = 2.1), which is equivalent within error to the recorded Lu-Hf garnet date (358.0± 1.5) and to the rutile date from the fresh sample. Petrographically, rutile from the retrogressed sample is not in equilibrium with the dominant (retrograde) assemblage and is interpreted as a relic of the HP paragenesis. Nevertheless, the closure temperature of the U-Pb system in rutile is strongly controlled by the grain size ( 600-650°C in crystals with size ranging from 100 to 200 µm; e.g., Cherniak, 2000; Vry & Baker, 2006) and is significantly lower than the maximum T attained during the metamorphic peak (680-800°C). Indeed, rutile is commonly used as a thermochronometer to constrain the cooling history of metamorphic terranes (e.g., Mezger et al., 1989, 1991; Zack et al., 2004, 2011; Kylander-Clark et al., 2008; Kooijman et al., 2010). Consequently, we interpret the rutile U-Pb dates as corresponding to cooling during exhumation. The similarity of these dates with the Lu-Hf ages (interpreted to date both the incipient crystallization and further growth of garnet) suggests that the entire process of subduction (and associated prograde garnet growth) and subsequent exhumation and cooling must have been quick.
Apatite
Apatite grains are dispersed in the matrix and cannot be attributed to any part of the metamorphic history based on petrographic observations. They could have crystallized during the magmatic stage and been re-equilibrated during the metamorphic history of the rock, or crystallized anywhere along the P–T path. U-Pb on apatite is commonly considered as a
medium temperature chronometer since its Pb closure temperatures (Tc) are generally
comprised between 375 and 500°C (e.g., Cherniak et al., 1991; Chamberlain & Bowring 2001; Harrisson et al., 2002; Schoene & Bowring 2007; Cochrane et al., 2014). Based on the results of this study, we calculated the apatite Tc of these grains using the equation of Dodson
(1973) and data from Cherniak et al. (1991). We used a radius of 75 to 100 µm, assuming a spherical form of the dated apatite crystals. Various cooling rates ranging 200°C/Myr to 5°C/Myr were used based on the results obtained in this study (Lu-Hf age of 357.5 ± 4 Ma, apatite age of 351.8 ± 2.8 Ma, modelling T estimates of 680-800°C during the metamorphic peak to the 620-600°C attained during the retrogression). The highest cooling rate of 200°C/Myr corresponds thus to a minimal Δt of 1 Myr and a maximal ΔT of 200°C, whereas the lowest cooling rate of 5°C/Myr corresponds to a maximal Δt of 12 Myr and a minimal ΔT of 60°C. The recalculated Tc of apatite then ranges from 510 to 590°C, consistent with the
higher range of the published data. In case of very fast processes, higher Tc values are indeed
expected, and already described in a study of dyke emplacement (Pochon et al., 2016; maximum Tc for apatite of 770-870°C). The temperature reached by the rocks is high
(680-800°C) and consequently we consider that the date of 354.6 ± 8.6 Ma (mean age at 351.8 ± 2.8 Ma) corresponds to the cooling during the exhumation of the terranes.
Eclogite protoliths: origin and emplacement setting
Both the basic character of the chemical compositions and the major elements discrimination diagrams (Fig. 2) suggest a basaltic or gabbroic protolith for both samples. Furthermore, the honeycomb texture observed in the fresh eclogite has already been interpreted as pseudomorphing a gabbroic texture (Lasnier, 1970, 1977). Finally, the presence
of tiny rutile needles in the core of omphacite crystals suggests that they are the result of the destabilisation of a magmatic Ti-rich clinopyroxene.
The zircon U-Pb age of 473.4 ± 2 Ma obtained in this study, similar to the age of the emplacement of the adjacent granite dated at 468.2 ± 2.7 (Lotout et al., 2017), provides new evidence of the bimodal character of this massive magmatic event recorded during the Ordovician (e.g., Iberian Massif – e.g., Sánchez-García et al., 2003, 2008; Villaseca et al., 2015; Del Grecco et al., 2016; Gutiérrez-Alonso et al., 2016; García-Arias et al., 2018; Armorican Massif – e.g.,, Ballèvre et al., 2012, Paquette et al., 2017; French Massif Central –
e.g.,, Pitra et al., 2012; Chelle-Michou et al., 2017; Lotout et al., 2017; Sardinia – e.g.,,
Helbing & Tieppolo, 2005; Oggiano et al., 2010; Caggero et al., 2012; Bohemian Massif –
e.g., Košler et al., 2004; Linnemann et al., 2008), related to the extreme stretching of the
lithosphere (e.g., Bard et al., 1980; Matte & Burg, 1981; Matte, 1986; Pin, 1990; Ribeiro et
al., 2007; Martínez Catalán et al., 2009; Lardeaux, 2014; Schulmann et al., 2014).
Tectonic fingerprinting based on major and trace elements discrimination diagrams is commonly used since the early 70s (e.g., Pearce & Cann, 1971; Wood, 1980). However, the use of major-element-based discrimination diagrams to characterize the tectonic setting of the protolith of metamorphosed rock is debatable due to major element mobility (e.g., Agrawal et
al., 2008). In this study, both major and trace element-based diagrams (geotectonic diagrams
following Verma et al., 2006, supplementary Fig.1, and Hollocher et al., 2012, supplementary Fig. 2a; REE normalized to chondrite spectra, trace elements normalized to NMORB spider diagrams, Fig 2a, c) highlight a depleted MORB signature and an island-arc tectonic setting. Following the Pearce (2008) Th/Yb vs. Nb/Yb diagram (supplementary Fig. 2b), the LV20B chemical composition highlights interaction between mafic magma and crust.
The zircon trace element content is widely used to interpret zircon ages in metamorphic rocks (e.g., co-eval growth of a HREE-bearing mineral as garnet, Rubatto, 2002; Whitehouse & Platt, 2003), to decipher magmatic processes (magma-chamber evolution –
e.g.,, Claiborne et al., 2006) or to identify the provenance of detrital grains (e.g., Belousova et al., 2002; Grimes et al., 2007, 2015). In the U/Yb vs Y or Hf diagrams (Fig. 12), the analysed
zircon crystals systematically fall within the “continental zircon” array, according to the provenance diagrams of Grimes et al. (2007), which could suggest a contamination of the mafic magma by surrounding crustal material.
By combining the results of whole-rock based major and trace element geotectonic diagrams with the zircon trace element provenance diagrams, all results suggest a crustal contamination (Fig. 2) and are in agreement with previous studies that suggested emplacement in a thinned continental crust in a spreading environment (e.g., Briand & Piboule, 1985; Briand et al., 1988; Bouchardon et al., 1989).
Validity of the P–T estimates
The P–T estimations obtained from numerical modelling and mineral chemical compositions in both the fresh and the retrogressed sample highlight a similar HP metamorphic peak at 18-23 kbar and 680-800°C (Figs 5, 7, 14). The P estimates from both samples are slightly higher than the previous estimations of Nicollet & Leyreloup (1978; 12.5-20 kbar and 750-840°C) and Bouchardon (1987; 16 kbar and 720 ± 30°C), whereas the T estimates are equivalent and in good accordance with these two previous studies.
Timing and duration of metamorphism: stages and rates
Geothermal gradient at the HP peak
Assuming lithostatic P and a maximum P of 21-23 kbar, there are three end-member possibilities to calculate the geothermal gradient. (i) First, it can be assumed that the increase in P is only the result of a crustal thickening. In this case, assuming a density (d) of 2.7-2.9 g/cm3, rocks would have reached a depth of 72-85 km. (ii) However, in a subduction-zone
setting, the contribution of both the crust and the mantle in the overlying rock column should be taken into account. A second way to calculate the geothermal gradient would then be to use a continental crust of 30 km (d = 2.7 g/cm3), which corresponds to 8.1 kbar. The remaining
12.9-14.9 kbar then relate to the P applied by the mantle-rock column (d = 3.3 g/cm3), which
corresponds to a depth of 39-45 km. In this scenario, rocks would have reached a depth of 69-75 km. (iii) Finally, in a context of an oceanic subduction below an extremely attenuated continental margin, the thickness of the continental crust can be neglected (e.g.,, subduction below an arc), so that rocks reached a depth of 63-69 km.
Consequently, considering a subduction-zone setting, the maximum depth reached by the rocks ranges 63-75 km. The T estimates vary from 680 to 800°C at the metamorphic peak, and therefore, the geothermal gradient ranges from 9.1°C/km to 12.7°C/km. P–T data from eclogites of the nearby Najac massif (Lotout et al., 2018) yield a similar gradient of ca. 8.5-12.4°C/km. These geothermal gradients are consistent with a Palaeozoic subduction zone (see the review of Brown, 2014).
Timing of the metamorphic events: eclogitic peak and retrogression
Garnet Lu-Hf and Sm-Nd, rutile U-Pb and apatite U-Pb dating yield similar ages within error (Fig. 14). Considering the temperature conditions at the peak metamorphic P, the grain size and the garnet zoning (Lu-enriched core), we infer that the Lu-Hf age obtained from LV20B at 358.0 ± 1.5 Ma is biased toward the core and reflects prograde garnet growth.
The comparable age of the LV21 garnet, which displays a distinct zoning with Lu-enriched rims, suggests fast garnet growth. Consequently, the Lu-Hf age at 358.0 ± 1.5 Ma is likely to well approximate the HP metamorphic peak at 18-23 kbar and 680-800°C. The results of garnet Sm-Nd (350.4 ± 7.7 Ma) and rutile U-Pb (354.9 ± 9.5 Ma), whose Tc are ca.
600-700°C, are then considered to date the cooling during the exhumation stage to 8-9.5 kbar and 600-620°C, conditions of the development of the dominant retrograde assemblage in LV20B. The consistency and similarity of all different ages and chronometers support this interpretation.
Rates of exhumation
Following the P-T estimates and radiometric results from this study, the drop in P from 18-23 kbar to 8-9.5 kbar started at ca. 358.0 ± 1.5 Ma (Lu-Hf garnet age) and was achieved before 351.8 ± 2.8 Ma, based on the Tc of apatite (510-590°C) being lower than the
T estimate at this P (600-620°C). The drop in P is then between 15 and 8.5 kbar, with an
average of 11.7 kbar. Assuming lithostatic P, this exhumation consequently started at mantle depths and the subducted material underwent an exhumation of 33-45 km, with an average of 39 km. Exhumation started at 358.0 ± 1.5 Ma and was achieved before 351.8 ± 2.8 Ma, lasting an average of 6.2 Myr; by taking maximum errors into account, the slowest and fastest exhumation processes lasted 10.5 Myr and 1.9 Myr, respectively. Consequently, exhumation rates for a vertical exhumation range from a minimum of 3.1 up to 23.7 mm/yr, with a median value of 6.3 mm/yr.
These rates are markedly faster than the mean erosion rates in mountain belts, estimated between 0.1 and 3 mm/yr for a long-lived thickened crust (e.g., Leeder, 1991; Avouac & Burov, 1996). Consequently, the calculated rates from this study suggest that exhumation was mostly driven by tectonic processes.
Tectonic implications
The Variscan orogeny in the French Massif Central
Our results question the previous models proposed for the tectonic evolution of the Lévézou massif (e.g., Burg & Teyssier, 1983; Burg et al., 1989; Duguet & Faure, 2004).
According to Duguet & Faure (2004), a top-to-the-South-West major nappe stacking occurred at around 380 Ma. It involved the emplacement of the LAC and resulted in a thickened continental crust. It was followed by a late top-to-the-North-West transpressive event at 360 Ma. This implies that the eclogite-facies metamorphism in the Lévézou massif developed prior to 380 Ma, as previously suggested (Pin & Lancelot, 1982; Burg et al., 1989; Duguet & Faure, 2004). Here we show that the eclogitic terranes were buried to depths of 63-75 km, then exhumed to a depth of 30 km at ca. 352 Ma. Considering (i) the inferred geothermal gradients (9.1-12.7°C/km) and the mafic character of the unit, and (ii) the timing of burial and exhumation, the burial of the eclogitic terranes in this area developed within a subduction zone, which is consistent with previous interpretations (e.g., Burg et al., 1989). We therefore conclude that crustal thrusting in the Lévézou massif did not occur prior to 352 Ma.
The age of the HP event in the Lévézou massif is significantly younger than the recent
HP age described in the neighbouring Najac massif, where the HP peak is estimated at
376 ± 3.3 Ma (Lotout et al., 2018; Fig. 15). This diachronism can be explained by either (i) the dating of rocks in distinct initial tectonic settings (terranes distal vs. proximal to the continental margin), (ii) closure of different oceanic domains, (iii) an oblique convergence inducing a diachronous closure of the ocean, or (iv) an active subduction zone where slices of buried crust are episodically exhumed.
(i) The first hypothesis implies that the older HP ages (Najac) reflect the subduction of oceanic terranes, while the younger recorded dates correspond to the subduction of more continental terranes. The Lévézou massif displays depleted tholeiitic MORB chemical compositions (Briand et al., 1988, this study) and has been described as a dismembered ophiolitic sequence (Nicollet, 1978). Moreover, if this scenario is correct, one would expect distinct prograde gradients between these two units, corresponding to the subduction of oceanic and continental material, which is not the case. Consequently, this hypothesis seems unlikely. (ii) Different oceanic domains would imply that different continental blocs are involved in the FMC architecture, i.e. that each HP unit corresponds to a specific subduction zone. Considering geodynamic reconstructions and paleomagnetic constraints (e.g., Edel et
al., 2018 and references therein), such a hypothesis suggesting numerous subduction zones
within the FMC is highly unlikely. (iii) A diachronous closure of an oceanic domain, i.e., an oblique convergence, could be plausible at the scale of the FMC, but this would imply the occurrence of major transfer faults, not yet identified. (iv) Finally, the episodic exhumation of
HP terranes in an active subduction setting could be a likely explanation for the record of
different HP ages. Indeed, the similarity of the geothermal gradients inferred in the Lévézou massif (9.1-12.7°C/km) and the nearby Najac massif (8.5-12.4°C/km) strongly suggests a common tectonic context and favours the hypothesis of an active subduction setting.
In the eastern part of the French Massif Central a protracted magmatic activity is well described, with ages younging from the N to S, from ca. 340 to 300 Ma. The chemical composition of the rocks suggests a coeval mantle- and crust-derived magmatism (Couzinié et
al., 2014, Laurent et al., 2017), interpreted as resulting from either a slab retreat or a
retro-delamination of the lithospheric mantle, during the collisional stage. The UGU in this eastern part of the FMC has experienced amphibolite- to granulite-facies metamorphism from 360 to 340 Ma, interpreted as resulting from the collisional stage (Chelle-Michou et al., 2017). This