HAL Id: hal-00296951
https://hal.archives-ouvertes.fr/hal-00296951
Submitted on 26 Sep 2006
HAL is a multi-disciplinary open access
archive for the deposit and dissemination of
sci-entific research documents, whether they are
pub-lished or not. The documents may come from
teaching and research institutions in France or
abroad, or from public or private research centers.
L’archive ouverte pluridisciplinaire HAL, est
destinée au dépôt et à la diffusion de documents
scientifiques de niveau recherche, publiés ou non,
émanant des établissements d’enseignement et de
recherche français ou étrangers, des laboratoires
publics ou privés.
Risk assessment and mapping of extreme floods in
non-dyked communities along the Elbe and Mulde
Rivers
K.-E. Lindenschmidt, U. Herrmann, I. Pech, U. Suhr, H. Apel, A. Thieken
To cite this version:
K.-E. Lindenschmidt, U. Herrmann, I. Pech, U. Suhr, H. Apel, et al.. Risk assessment and mapping of
extreme floods in non-dyked communities along the Elbe and Mulde Rivers. Advances in Geosciences,
European Geosciences Union, 2006, 9, pp.15-23. �hal-00296951�
Adv. Geosci., 9, 15–23, 2006 www.adv-geosci.net/9/15/2006/
© Author(s) 2006. This work is licensed under a Creative Commons License.
Advances in
Geosciences
Risk assessment and mapping of extreme floods in non-dyked
communities along the Elbe and Mulde Rivers
K.-E. Lindenschmidt1, U. Herrmann1, I. Pech1, U. Suhr2, H. Apel1, and A. Thieken1
1GFZ GeoForschungsZentrum Potsdam, Section 5.4 – Engineering Hydrology, Telegrafenberg, 14473 Potsdam, Germany 2UFZ – Centre for Environmental Research, Dept. Hydrological Modelling, Br¨uckstr. 3a, 39114 Magdeburg, Germany
Received: 23 January 2006 – Revised: 22 May 2006 – Accepted: 3 July 2006 – Published: 26 September 2006
Abstract. Assessing and mapping damage risk of floods for
large river basins is still in its infancy. Damage risk is un-derstood to be the combination of flood hazard and the vul-nerability of communities to a flood of a particular return period. Risk is calculated and mapped for two communities in which dykes are not located for flood protection: Meissen on the Elbe River and D¨obeln in the Mulde catchment. Dif-ferent methodologies for the computation of flood depth and inundation extent of varying flood return periods (hazard) are compared. Exposure and relative damage to the flood-ing (vulnerability) based on land-use coverages of different scale are also compared and discussed. A property asset cov-erage completes the data requirements for the construction of the risk maps. Recommendations for continued research on risk assessments of large river basins conclude the study.
1 Introduction
An important prerequisite for developing provision manage-ment concepts for the mitigation of damages from extreme flood events is to identify areas of potentially high risk to such events (Lindenschmidt et al., 2005). In this context, risk is defined as the probability that a given loss will occur. Thus, risk encompasses both, hazard and vulnerability. For a quan-titative risk analysis several events that cover a broad range of event probabilities should be investigated. Typical out-comes of a risk assessment are the expected annual damage or a more detailed risk curve that shows the exceedance prob-abilities and corresponding losses for different events (e.g. Merz and Thieken, 2004). Risk maps are extremely useful, however methodologies for very large river basins are still rare. Kron and Willems (2002) identify eight independent regional loss accumulation zones in Germany in which
prob-Correspondence to: K.-E. Lindenschmidt
able maximum losses are calculated for five different flood scenarios corresponding to return periods ranging from 10 to 200 years. Zoning is carried out, not of rivers alone, but of entire large catchment areas. The system has been used by a reinsurance company. Similar efforts for Germany have been carried out by Kleeberg (2001), who concentrated the zoning to the flood regions along rivers and who implemented the method in the software package Z ¨URS (Zoning System for Floods, Backwater and Heavy Rains) that has been used by insurance companies. In the UK, Rodda and Berger (2002) established differentiated risk zones in the flooded areas near the river itself, and Hall et al. (2003) and Sayers et al. (2002) have extended this approach to include the probabilities of dyke failures. The implementation of dyke fragility curves has also found application in the USA (USACE, 1996, 1999). These methods provide a rough orientation of where “hot spots” occur in terms of flood risk on very large (nationwide) scales. These have their justification for high-level strate-gic planning for entire countries and provide information on a scale that is valuable for re-insurance companies, which base their policies on probable maximum loss estimates. The downside of these methods is that the spatial resolution is generally too coarse and the results not differentiated enough to be applicable for the development of mitigation concepts. Additional efforts in quantifying risk at higher resolutions have been documented in an atlas for the River Rhine be-tween Lake Constance and Rotterdam (ICPR, 2001). Flood hazard is defined in categories of flood depth (0–12m, 12–2 m, 2–4 m, >4 m) and the number of persons at risk. Vulnerabil-ity is defined in five categories of possible damages due to extreme floods or dyke failures (in settlements less or greater than 50 EUR/m2; in regions of industry, trade, infrastruc-ture and transport less or greater than 25 EUR/m2; agricul-tural land surfaces less than 1 EUR/m2)and is based on the CORINE land-use classification. The aim of the atlas was to draw the attention of citizens at risk along the Rhine and to provide a basis for the Rhine Action Plan with the mandate
16 K.-E. Lindenschmidt et al.: Risk assessment and mapping of extreme floods
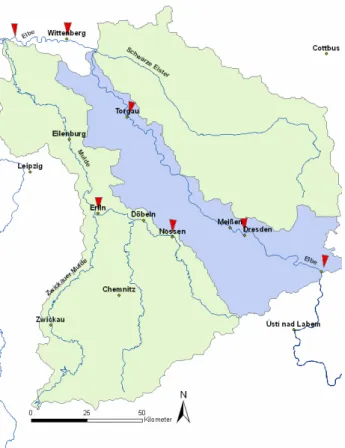
Figure 1: Risk map are presented for the communities of Meissen on the Elbe River and Döbeln in the Mulde catchment. Red triangles represent stream gauges.
13 Fig. 1. Risk map are presented for the communities of Meissen on
the Elbe River and D¨obeln in the Mulde catchment. Red triangles represent stream gauges.
of providing better protection of humans and material assets against flooding and improve the ecological state of the river and its floodplains. Only the extent of floods with return pe-riods of 10 and 100 years and an extreme flood were consid-ered. Risk calculations were not carried out.
Similar efforts were carried out for large rivers in Sax-ony and documented in an atlas (LfUG, 2005). Flood in-tensity is defined both as flood depth (same categories as Rhine atlas) and specific discharge (flow velocity × flood depth: 0–12m2/s, 12–2 m2/s, >2 m2/s), which is similar to the flood hazard specification developed in Switzerland (BWW, 1997; BWG, 2001). Vulnerability calculations are based on ATKIS land-use data and categorised into industrial (two classes: one less and the other greater than 10 EUR/m2), set-tlement (<10 EUR/m2, 10–50 EUR/m2, >50 EUR/m2)and agricultural and forestry regions (1 EUR/m2). Risk calcula-tions were not carried out however, points of high risk such as electrical generators and transformers, water supply fa-cilities, industries with high damage potential, hospitals and wastewater treatment plants are indicated.
In this study a similar methodology is pursued as that used for the Rhine atlas, with the addition of risk assessment for the city of Meissen on the Elbe River and the city of D¨obeln
in the Mulde catchment. The river sections at these commu-nities are of different Strahler stream order and were chosen to assess scale differences on risk assessment. The scale dif-ference is due to the difdif-ference in stream order of the com-munities investigated. The hazard × vulnerability approach is used for risk calculations and mapping for several flood events of varying return periods. Different methods are de-scribed and compared for the computation of flood depths and inundation extent for the construction of hazard maps. Vulnerability mapping based on land-use coverages of differ-ent resolution is compared. The implications of using land-use data of different scale on the subsequent risk calculations and mapping are discussed. Conclusions of the risk assess-ment and an outlook for future research close the paper.
2 Study areas
Risk maps are presented from two cities: Meissen on the Elbe River (Elbe-km ≈ 82) and D¨obeln on the Freiberger Mulde (F.Mulde-km ≈ 24), a tributary of the Mulde River (see Fig. 1). Both areas are situated in incised valleys and dykes for flood protection are not present in their vicini-ties. The Strahler order of the Elbe at Meissen and of the Freiberger Mulde at D¨obeln are 6 and 4, respectively. Dis-charge characteristics of the first gage upstream and the first gage downstream from the study sites are given in Table 1. All areas were heavily affected by the August 2002 flood.
3 Damage risk assessment
Risk is defined as the probability of the adverse effects of a natural process such as a flood exceeding a certain magni-tude (intensity) from which certain damages and losses occur (vulnerability) (Merz et al., 2006).
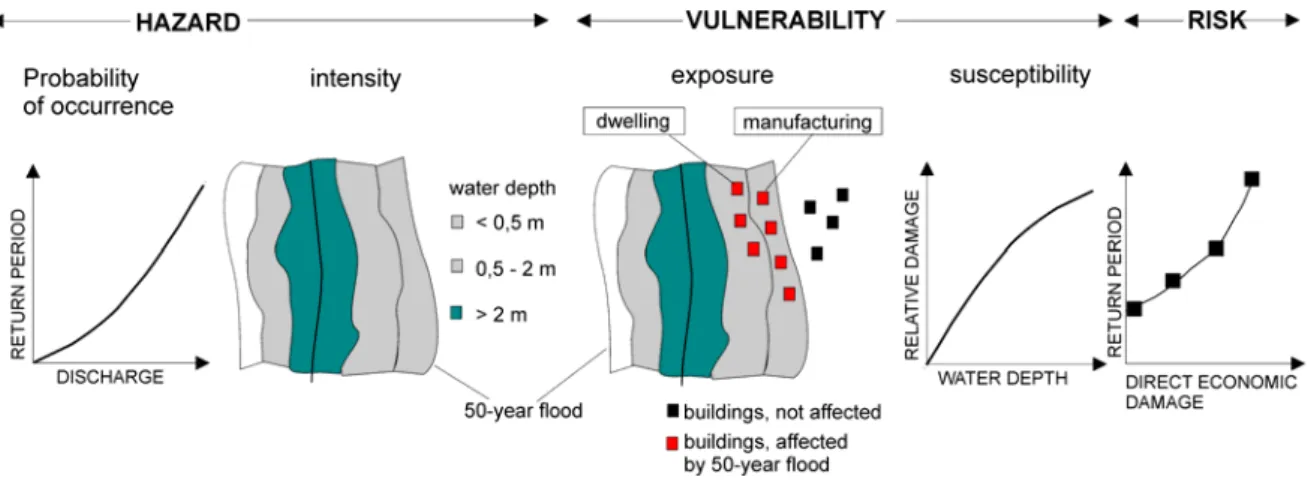
In damage risk assessment, hazard must first be deter-mined, which incorporates a frequency analysis of the inten-sity of the threatening occurrence (see Fig. 2). In our case, the occurrence is a flood event and the intensity of the event is measured by the depth and extent of the flooding. Damage occurs through flooding and increases with the intensity of the event. This is the basis for vulnerability. The vulnerabil-ity curve reaches an asymptote at high degrees of intensvulnerabil-ity since a point of maximum damage corresponding to the to-tal assets in the flooded area can theoretically be attained. (An asymptote can theoretically be attained for hazard, espe-cially in large river basins, in which the flood magnitude ap-proaches an upper limit called the probable maximum flood. However, this limit is not as easily defined as for vulnerabil-ity). Transferring damage costs to a probability of the dam-ages being attained or exceeded forms the risk curve. The area under this curve is the damage expectation for the stud-ied area.
To aid risk assessment risk can also be mapped for ar-eas of flooding. The probability of exceedance (expressed
K.-E. Lindenschmidt et al.: Risk assessment and mapping of extreme floods 17
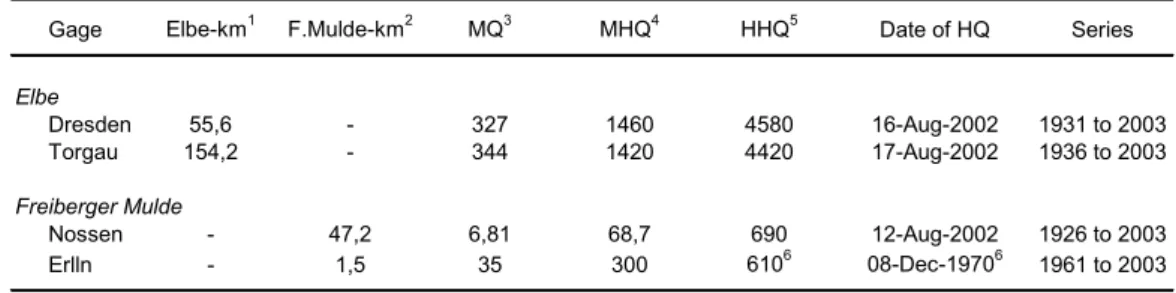
Table 1. Discharge characteristics of the gages immediately upstream and downstream from the study sites (see also Fig. 1).
Gage Elbe-km1 F.Mulde-km2 MQ3 MHQ4 HHQ5
Date of HQ Series Elbe Dresden 55,6 - 327 1460 4580 16-Aug-2002 1931 to 2003 Torgau 154,2 - 344 1420 4420 17-Aug-2002 1936 to 2003 Freiberger Mulde Nossen - 47,2 6,81 68,7 690 12-Aug-2002 1926 to 2003 Erlln - 1,5 35 300 6106 08-Dec-19706 1961 to 2003
1km ascending in flow direction 3mean discharge 5highest discharge recorded 2km descending in flow direction 4mean annual peak discharge 6no recording of Aug-2002 flood
also as a return period = 1/exceedance probability) together with the intensity of the event (usually expressed in terms of flood depth or inundation) establishes the hazard induced by the flood event (see Fig. 3). Using land-use information and damage costs as functions of water depth and perhaps other factors (i.e. flow velocities) the vulnerability of certain land-use types that are exposed to the flood and their susceptibility to damage by the flooding can be assessed. Both hazard and vulnerability are combined to calculate risk and can be used to establish risk maps. Once areas of exceptionally high risk (“hot spots”) have been identified scenarios can be run to test various management concepts for flood mitigation.
4 Risk mapping at Meissen (Elbe River)
Different methodologies were used to construct risk maps for the communities on the Elbe and Mulde Rivers, depending on the data and tools available. The steps taken to construct the risk maps at Meissen on the Elbe River are as follows (see also Fig. 4):
1. A flood frequency analysis of the maximum annual flood peaks was carried out for all the discharge gages along the upper German Elbe River. These include the gages at Schmilka, Dresden, Meissen, Torgau and Wit-tenberg. The return periods were estimated on the ba-sis of annual maximum discharge series and the gener-alised extreme value (GEV) distribution estimated using L-moments.
2. Using the hydraulic model QSIM the water levels along the Elbe between Schmilka and Wittenberg were sim-ulated every 500 m along the river stretch. QSIM (Quality Simulation) is a water quality model devel-oped by the Federal Institute of Hydrology, Germany (Kirchesch and Sch¨ol, 1999) with a focus on navigable rivers to analyse the environmental impacts of river con-trol measures and constructions on the rivers’ aquatic ecosystems. The hydraulic module uses the Kalinin-Miljukov technique to route flow hydrographs and to
Figure 2: Graphical representations of hazard and vulnerability in the computation of damage
flood risk.
Figure 3: Flood risk as interaction of hazard and vulnerability (adapted from Merz and
Thieken, 2004).
14
Fig. 2. Graphical representations of hazard and vulnerability in the
computation of damage flood risk.
subsequently calculate water levels, details of which are given in Plate et al. (1977) and Patt et al. (2001). 3. Using the Watershed Modelling System (WMS) (http:
//www.ems-i.com) the flood depths and extent were cal-culated based on digital elevation maps with a point res-olution every 5 m for the river corridor and every 25 m for the hinterland. WMS is a comprehensive graphical modelling environment for all phases of watershed hy-drology and hydraulics and includes tools to automate modelling processes such as basin delineation, geomet-ric parameter calculations, GIS overlay computations and floodplain delineation and mapping.
4. Exposition is calculated by overlaying the hazard map with either the ATKIS or CORINE digital land-use map. All mapping was carried out using ArcGIS (http: //www.esri.com/). ATKIS (Amtliches Topographisches Informationssystem) (http://www.atkis.de/) is a service by the German survey administration providing digital
18 K.-E. Lindenschmidt et al.: Risk assessment and mapping of extreme floods
Figure 2: Graphical representations of hazard and vulnerability in the computation of damage
flood risk.
Figure 3: Flood risk as interaction of hazard and vulnerability (adapted from Merz and
Thieken, 2004).
14
Fig. 3. Flood risk as interaction of hazard and vulnerability (adapted from Merz and Thieken, 2004).
Figure 4: Methodology in mapping hazard, vulnerability and risk for the city of Meissen on
the Elbe River.
Figure 5: Methodology in mapping hazard, vulnerability and risk for the city of Döbeln on the
Freiberger Mulde River.
15
Fig. 4. Methodology in mapping hazard, vulnerability and risk for
the city of Meissen on the Elbe River.
use, elevation and topography maps. The land-use map with the finest resolution (1:25 000) was land-used. The CORINE Land Cover project (http://www.corine. dfd.dlr.de) provides area-wide land use (from the years 1990 and 2000) and land-use change maps based on re-mote sensing data. Its scale is 1:100 000.
5. Relative damage functions for the land-use types of in-terest were used to map vulnerability. Examples of damage functions in which the percentage of damage degree y is a function of flood depth x are:
ATKIS land cover (MURL, 2000;
http://www.proaqua-gmbh.de/hws/hwsnrw/hws/) y =27√x(industry&services) y = a · x + b √ x 1.95583 (residential)
where a and b are coefficients depending if a basement is present or not.
CORINE land cover (http://www.rheinatlas.de/H)
y =2x2+2x(residential, real estate)
y =11.4x + 12.625(residential, household contents)
6. The vulnerability map from the previous step and a property asset value map (Kleist et al., 2004; Thieken et al., 2006) are overlain to map risk for the flood of a particular return period. The asset map contains es-timates of the asset values of residential buildings for each community in Germany on the basis of census data on the number of buildings per community provided by INFAS Geodaten GmbH, census data on the floor area in residential buildings per district provided by the Federal Statistical Office in Germany and standardised reconstruction costs per square meter published by the Ministry of Transport, Construction and Housing. The algorithm is outlined in Kleist et al. (2004). Thieken et al. (2006) show how the asset estimates per commu-nity can be disaggregated to CORINE land-use classes by the use of a disaggregation scheme (dasymetric map-ping). Assets from industrial areas are not mapped and were assumed to be 20% less than those of residential assets. This proportion was applied by LfUG (2005) for the construction of their vulnerability maps.
K.-E. Lindenschmidt et al.: Risk assessment and mapping of extreme floods 19
5 Risk mapping at D¨obeln (Mulde River)
Steps in constructing risk maps for D¨obeln on the Freiberger Mulde River are (see also Fig. 5):
1. A flood frequency analysis was carried out using self-programmed MatLab routines as described in Apel et al. (2004). There is no discharge gage at D¨obeln, hence data from the next upstream gage at Nossen was taken for the analysis. The series of annual maximum dis-charges for 76 continuous years from 1925 to 2003 was available to which the general extreme value probability distribution estimated using L-moments gave the best fit. The fit provided the discharges for flood return peri-ods of 10, 20, 50, 100, 200, 500 and 1000 years, which were used as input for the subsequent hydraulic simula-tions.
2. The LISFLOOD-FP program (Bates and De Roo, 2000) was used to simulate flood depths and inundation ex-tents. The program is a raster flood inundation model for simulating flood spreading, with output consisting of raster maps of water depth in each grid square at each time step and predicted stage and discharge hydro-graphs at the outlet of the reach. The kinematic approx-imation to the one-dimensional St. Venant equations is used to simulate the passage of a flood wave along a channel reach. Two dimensional flood spreading using the diffusion wave analogy of the St. Venant equations and storage cells applied over a raster grid simulates water movement from the channel to adjacent flood-plains. The spatial resolution in our inundation sim-ulations is 25 m. The synthetic flood waves were de-rived via characteristic normalized flood waves of the river extracted by a cluster analysis of the recorded an-nual maximum flood waves (see Apel et al., 2004). The mean daily flood peak discharges for the single return periods drawn from the GEV were further scaled to sub-daily flash flood discharges based on a regression rela-tion between mean daily flood peak discharges and the actual recorded peak discharges of the event.
3. The mapping of hazard and vulnerability and the subse-quent calculations and mapping of risk follow the same procedure already described above in Steps iv) to vi) for Meissen on the Elbe River.
6 Conclusions
Results and discussion
6.1 Risk mapping of Meissen (Elbe) for HQ100
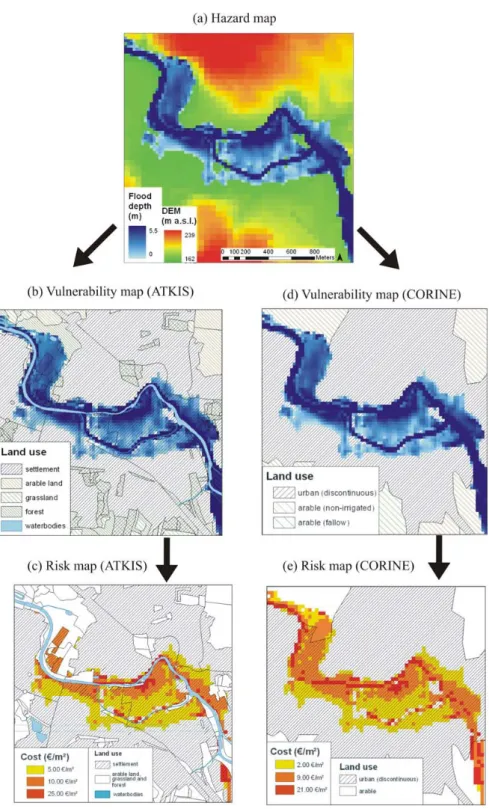
The flood extent for the flood of return period 100 years in the city of Meissen is given in Fig. 6a. At some points, the
Figure 4: Methodology in mapping hazard, vulnerability and risk for the city of Meissen on
the Elbe River.
Figure 5: Methodology in mapping hazard, vulnerability and risk for the city of Döbeln on the
Freiberger Mulde River.
15
Fig. 5. Methodology in mapping hazard, vulnerability and risk for
the city of D¨obeln on the Freiberger Mulde River.
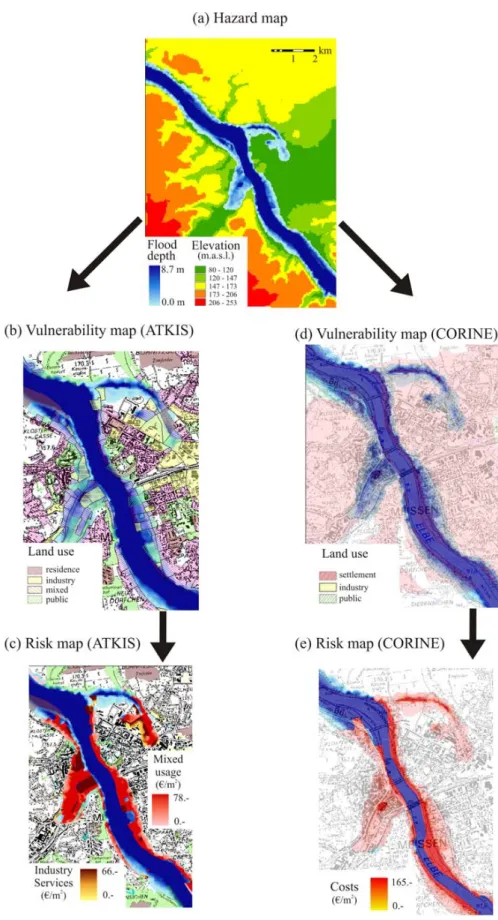
width of the flood extends over 1000 m across the river. This map is used as the hazard layer for risk constructs based on both ATKIS and CORINE land covers. Four classifica-tions are present in the area with ATKIS data (Fig. 6b) of which mostly residences are flooded by the event. The max-imum damage attained by this 100 year flood is 78 EUR/m2 for mixed usage which includes settlements) (Fig. 6c). The study area is partitioned by only three CORINE land-use classifications, as shown in Fig. 6d. Settlements are by far the most flooded by this event. Damage costs (see Fig. 6e) reach nearly 160 EUR/m2, which is twice that attained by the ATKIS data. The high costs occur along the banks of the river and are due to the coarse grained resolution of CORINE data. There is an overlap at some locations between land use near the river bank and the river geomorphology itself caus-ing an overestimation of flood depths. It is recommended that these areas of overestimated damage are filtered using a precise overlay coverage of the river bank. The extent of damage also covers a larger area than for the more land-use differentiated ATKIS data. Due to the low-grain resolution of the CORINE land cover, flood damage is allocated in areas where little damage is expected to occur.
A large uncertainty exists in the values used for the prop-erty assets. The asset values used here from Thieken et al. (2006) are only 40% of those values from LfUG (2005). Hence, there is a large discrepancy in the risk calculations by the same proportion.
6.2 Risk mapping of D¨obeln (Mulde) for HQ100
The extent and depths of the flood with a return period of 100 years are shown for D¨obeln in Fig. 7a. The river appears branched, however, the upper diversion is the actual river with the lower branch being a shallow ditch which fills with water during floods. In the branched section, the width of the
20 K.-E. Lindenschmidt et al.: Risk assessment and mapping of extreme floods
Figure 6: Hazards, vulnerability and damage risk maps for a flood with a return period of 100
years in the city of Meissen on the Elbe River.
16
Fig. 6. Hazards, vulnerability and damage risk maps for a flood with a return period of 100 years in the city of Meissen on the Elbe River.
K.-E. Lindenschmidt et al.: Risk assessment and mapping of extreme floods 21
Figure 7: Hazards, vulnerability and damage risk maps for the flood with a return period of 100 years in the city of Döbeln in the Mulde catchment.
17
Fig. 7. Hazards, vulnerability and damage risk maps for the flood with a return period of 100 years in the city of D¨obeln in the Mulde
catchment.
flooding extends 600 m across the river. The water course ap-pears only in the ATKIS land-use coverage (see Fig. 7b), not in the CORINE database (see Fig. 7d), due to the small scale of the river in this area. The former land-use map contains some forested areas that are flooded on the right river bank
in the top left corner of Fig. 7b. These areas are classified with very little relative flood susceptibility and no risk is as-signed to them in the risk maps in Fig. 7c. The forested area is too small for it to be registered as such in the CORINE land-use map in Fig. 7d. The area affected by the flooding is
22 K.-E. Lindenschmidt et al.: Risk assessment and mapping of extreme floods almost all urban, even those designated as forested in ATKIS.
Hence, the extent of damages in Fig. 7e is far greater than it should be. Damage costs are not as high as those for Meis-sen and are comparable for the two land-use databases. As was the case for Meissen, damages along the river bank are overestimated using the CORINE coverage due to the miss-ing water course. Filtermiss-ing out these high risk values is again advised using a precise overlay map of the river.
7 Conclusions
– As may have been expected, the more fine-grained
res-olution of the ATKIS land cover provides more accurate flood risk assessments than do the CORINE land cover data. Damage costs and the extent of flood damages are expected to be overestimated when using CORINE data. When using CORINE data, it is recommended that the extreme risk values along the river banks are filtered out using an overlay of an accurate designation of the river course.
– Two methods for constructing hazard maps were
exhib-ited: i) using a hydraulic model to simulate the water levels and delineating the water levels on a digital el-evation map to obtain flood depths and extent, and ii) using a hydraulic model which incorporates the flood-plain in its simulations. It is recommended to use the latter method since work steps are reduced for the flood delineation for the hydraulic/floodplain model which di-rectly provides the flood depths and extent as simulation output.
– Although the risk assessment of the two studied areas
are from rivers of different Strahler order (6 for Meis-sen and 4 for D¨obeln) scale effects can not be observed. This may be due to the limited number of areas investi-gated.
8 Outlook for future research
For future work, we wish to compare risk outcomes between water levels interpolated between actual gage measurements and those computed from model simulations. This com-parison may give an orientation on the magnitude of the uncertainty within hazard calculations and its propagation in risk calculations. If the data is available, a comparison with actual flow and inundation depths and extent would surely provide useful information on the uncertainties. The question as to how much hazard and vulnerability contribute to the overall uncertainty in risk assessments for varying extreme discharges still remains unanswered. The analysis should also be carried out on river reaches with dykes. Risk assessments of additional communities along the rivers will also be carried out in order to determine if patterns due to
scaling effects arise. A comparison with an analysis of the August 2002 flood is also to be carried out.
Edited by: R. Barthel, J. G¨otzinger, G. Hartmann, J. Jagelke, V. Rojanschi, and J. Wolf
Reviewed by: anonymous referees
References
Apel, H., Thieken, A. H., Merz, B., and Bl¨oschl, G.: Flood risk assessment and associated uncertainty, Nat. Hazards Earth Syst. Sci., 4, 295–308, 2004,
http://www.nat-hazards-earth-syst-sci.net/4/295/2004/.
Bates, P. D. and De Roo, A. P. J.: A simple raster-based model for floodplain inundation., J. Hydrol., 236, 54–77, 2000.
BWG: Hochwasserschutz an Fließgew¨assern – Wegleitungen des BWG (Flood protection at lotic waters – a guide from the Federal Institute of Water and Geology), Schweizer Bunde-sanstalt f¨ur Wasser und Geologie, http://www.bwg.admin.ch/ service/katalog/download/804801d.pdf, 2001.
BWW: Ber¨ucksichtigung der Hochwassergefahren bei raumwirk-samen T¨atigkeiten (Flood hazard in consideration of spatial activities), Schweizer Bundesanstalt f¨ur Wasserwirtschaft, http://www.bwg.admin.ch/service/katalog/download/pdf/ 804201d.pdf, 1997.
Hall, J. W., Dawson, R. J., Sayers, P. B., Rosu, C., Chatterton, J. B., and Deakin, R.: A methodology for nation-scale flood risk assessment, Water Mar. Eng., 156(WM3), 235–247, 2003. ICPR: Rhine-Atlas. International Commission for the Protection of
the Rhine., http://www.rheinatlas.de, 2001.
Kirchesch, V. and Sch¨ol, A.: Das Gew¨asserg¨utemodell QSIM – Ein Instrument zur Simulation und Prognose des Stoffhaushalts und der Planktondynamik von Fließgew¨assern (The water qual-ity model QSIM – an instrument for the simulation and forecast of the substance regime and plankton dynamics in rivers), Bun-desanstalt f¨ur Gew¨asserkunde, Koblenz, Germany, 1999. Kleeberg, H.-B.: Zur Hochwasser-Risikozonierung der deutschen
Versicherungwirtschaft (On flood zoning for the German in-surance industry), in: Hochwasser – Niedrigwasser – Risiken, N¨urnberger Wasserwirtschaftstage des ATV-DVWK Landesver-bandes Bayern, 9–10 May 2001, pp. 39–50, 2001.
Kleist, L., Thieken, A., K¨ohler, P., M¨uller, M., Seifert, I., and Werner, U.: Estimation of building values as a basis for a com-parative risk assessment, in: Disasters and Society - From Haz-ard Assessment to Risk Reduction, edited by: Malzahn, D. and Plapp, T., Logos-Verlag, Berlin, pp. 115–122, 2004.
Kron, W. and Willems, W.: Flood risk zoning and loss accumu-lation analysis for Germany, International Conference on Flood Estimation, 6–8 March 2002, Berne, Switzerland, pp. 549–558, 2002.
LfUG: Hochwasser in Sachsen – Gefahrenhinweisekarte (Floods in Saxony – flood impact maps). S¨achsisches Landesamt f¨ur Umwelt und Geologie, Zur Wetterwarte 11, 01109 Dresden, [email protected], 2005.
Lindenschmidt, K.-E., Fleischbein, K., Petrow, T., Vorogushyn, S., Theobald, S., and Merz, B.: Model system and scenario devel-opment for the provision management of extreme floods in large river basins, Adv. Geosci., 5, 99–104, 2005,
http://www.adv-geosci.net/5/99/2005/.
K.-E. Lindenschmidt et al.: Risk assessment and mapping of extreme floods 23 Merz, B. and Thieken, A. H. Flood risk analysis: concepts and
chal-lenges, ¨Osterreichische Wasser- und Abfallwirtschaft, 56(3–4), 27–34, 2004.
Merz, B., Thieken, A. H., and Gocht, M.: Flood risk mapping at the local scale: concepts and challenges, in: Flooding in Europe – Challenges and development in flood risk management, Ad-vances in Natural and Technological Hazards Research, Springer, in press, 2006.
MURL: Potentielle Hochwassersch¨aden am Rhein in NRW (Poten-tial flood damages on the Rhine River in North Rhine West-fahlia), Ministerium f¨ur Umwelt, Raumordnung und Land-wirtschaft des Landes Nordrhein-Westfalen, 2000.
Patt, H. (Ed.): Hochwasser-Handbuch – Auswirkungen und Schutz, (Flood Handbook – Effects and Protection), Springer Verlag, 2001.
Plate, E. J., Schultz, G. A., Seus, G. J., and Wittenberg, H.: Ablauf von Hochwasserwellen in Gerinnen (Succession of flood waves in channels), Schriftenreihe des Kuratoriums f¨ur Wasser und Kulturbauwesen, Heft 27, Parey, Hamburg, 1977.
Rodda, H. and Berger, A.: The application of flood modelling and mapping for managing flood risk in the UK, International Con-ference on Flood Estimation, 6–8 March 2002, Berne, Switzer-land, pp. 645–650, 2002.
Sayers, P., Hall, J., Dawson, R., Rosu, C., Chatterton, J., and Deakin, R.: Risk assessment of flood and coastal defences for strategic planning (RASP) – a high level methodology, DEFRA Conference of Coastal and River Engineering, Keele University, July 2002.
Thieken, A. H., M¨uller, M., Kleist, L., Seifert, I., Borst, D., and Werner, U.: Regionalisation of asset values for risk analyses, Nat. Hazards Earth Syst. Sci., 6(2), 167–178, 2006.
USACE: Engineering and design – risk-based analysis for flood damage reduction studies. Pub. # EM1110-2-1619, US Army Corps of Engineers, Washington, D.C., 20314-1000,http://www.usace.army.mil/inet/usace-docs/eng-manuals/ em1110-2-1619/toc.html, 1996.
USACE: Risk-based analysis in geotechnical engineering for support of planning studies, Pub. # ETL 1110-2-556, US Army Corps of Engineers, Washington, D.C., 20314-1000, http://www.usace.army.mil/inet/usace-docs/eng-tech-ltrs/ etl1110-2-556/toc.html, 1999.