HAL Id: hal-00317712
https://hal.archives-ouvertes.fr/hal-00317712
Submitted on 3 Jun 2005
HAL is a multi-disciplinary open access
archive for the deposit and dissemination of
sci-entific research documents, whether they are
pub-lished or not. The documents may come from
teaching and research institutions in France or
abroad, or from public or private research centers.
L’archive ouverte pluridisciplinaire HAL, est
destinée au dépôt et à la diffusion de documents
scientifiques de niveau recherche, publiés ou non,
émanant des établissements d’enseignement et de
recherche français ou étrangers, des laboratoires
publics ou privés.
radar
P. V. Ponomarenko, F. W. Menk, C. L. Waters, M. D. Sciffer
To cite this version:
P. V. Ponomarenko, F. W. Menk, C. L. Waters, M. D. Sciffer. Pc3-4 ULF waves observed by the
SuperDARN TIGER radar. Annales Geophysicae, European Geosciences Union, 2005, 23 (4),
pp.1271-1280. �hal-00317712�
Annales Geophysicae, 23, 1271–1280, 2005 SRef-ID: 1432-0576/ag/2005-23-1271 © European Geosciences Union 2005
Annales
Geophysicae
Pc3–4 ULF waves observed by the SuperDARN TIGER radar
P. V. Ponomarenko1, F. W. Menk1,2, C. L. Waters1,2, and M. D. Sciffer11University of Newcastle, Callaghan, NSW, Australia 2CRC for Satellite Systems, Australia
Received: 14 October 2004 – Revised: 10 March 2005 – Accepted: 4 April 2005 – Published: 3 June 2005
Abstract. Despite extensive research, the mechanisms for propagation of Pc3–4 energy from the generation region at the bow shock to the high-latitude ionosphere remain unre-solved. We used high temporal (6–12 s) and spatial (45 km) resolution data from the SuperDARN TIGER radar (Tas-mania) to examine Pc3–4 wave signatures at the F-region heights. We focus on a case study on 28 September 2000, when large-amplitude band-limited Pc3–4 oscillations were observed across 10–20 range gates in beam #4 (which points towards the CGM pole) for about four hours preceding MLT noon. These waves were detected in sea-scatter echoes re-flected from the ionospheric footprint of the plasmatrough. Nearby ground magnetometer data from Macquarie Island showed very similar variations in both the north-south and east-west components. The radar data revealed the occa-sional presence of quasi-FLR (field-line resonance) spatial structures with frequencies much higher than those of the lo-cal fundamental FLR modes. Detailed spectral analysis of the ionospheric and ground data shows that these structures most probably correspond to a 3rd-harmonic, poloidal-mode FLR. Such observations suggest that compressional Pc3–4 waves produced in the upstream solar wind travel earthward from the magnetopause in the magnetic equatorial plane de-positing energy into the Alfvenic modes, as either forced or 3rd-harmonic FLR that reach ionospheric heights along mag-netic field lines.
Keywords. Magnetospheric physics (Magnetosphere-ionosphere interactions; MHD waves and instabilities; Solar wind-magnetosphere interactions)
1 Introduction
The interaction between the solar wind and the geomag-netic field manifests itself in a variety of phenomena, in-cluding magnetohydrodynamic (MHD) ultra-low frequency (ULF, f ∼1–1000 mHz) waves observed on the ground as pulsations in the geomagnetic field. Band-limited variations
Correspondence to: P. V. Ponomarenko
(phpp@alinga.newcastle.edu.au)
in the Pc3–4 range (typically ∼15–50 mHz) are regularly ob-served during the daytime at all magnetic latitudes, including equatorial and polar cap regions, which makes them poten-tially a useful diagnostic tool for probing the magnetosphere. Due to their well-established dependence on solar wind and IMF parameters, it is widely believed that at least some of the daytime band-limited Pc3–4 MHD waves may be generated upstream of the Earth’s bow shock by the ion-cyclotron insta-bility in reflected proton beams (Fairfield, 1969; Paschmann et al., 1979; Hoppe and Russell, 1983).
Exactly how Pc3–4 energy propagates from the bow shock to the high-latitude (MLAT≥60◦) ionosphere is not clear. Statistical satellite-based studies have shown that inside the magnetosphere compressional Pc3–4 wave power is confined mostly to the magnetic equatorial plane (Cao et al., 1994), and the only Pc3–4 power observed at higher elevation angles relates to the shear Alfv´en mode, mostly 2nd toroidal and 3rd poloidal harmonics of local field line resonances (FLRs) (Takahashi and Anderson, 1992).
Both in the magnetosphere and on the ground, Pc3– 4 amplitude/power and occurrence maximize 1–2 h before 12 MLT (e.g. Engebretson et al., 1986; Takahashi and An-derson, 1992; Ponomarenko et al., 2002). On the ground, maximum Pc3–4 power occurs around auroral/cusp latitudes (Fraser-Smith, 1982; Bol’shakova and Troitskaya, 1984). Ground-based statistical studies (e.g. Ponomarenko et al., 2002) have revealed that at high latitudes Pc3–4 pulsations comprise two principal components: a band-limited en-hancement (“signal”) usually centered around 20–30 mHz; and a power-law background (“noise”) with power spectral density ∝f−p, where p'3−4. The signal spectrum prob-ably relates to the upstream source (Ponomarenko et al., 2002). Wave energy may reach the ground via fast mode waves propagating through the magnetosphere directly to the ionosphere, and via field-line guided Alfv´en waves that re-sult from the coupling of wave energy to FLRs (e.g. Yumoto et al., 1985). However, the resonant frequency at high lati-tudes is mostly in the Pc5 range, well below the frequency of Pc3–4 signals of interest here.
Another mechanism proposed by Engebretson et al. (1991) is based on ULF modulation of
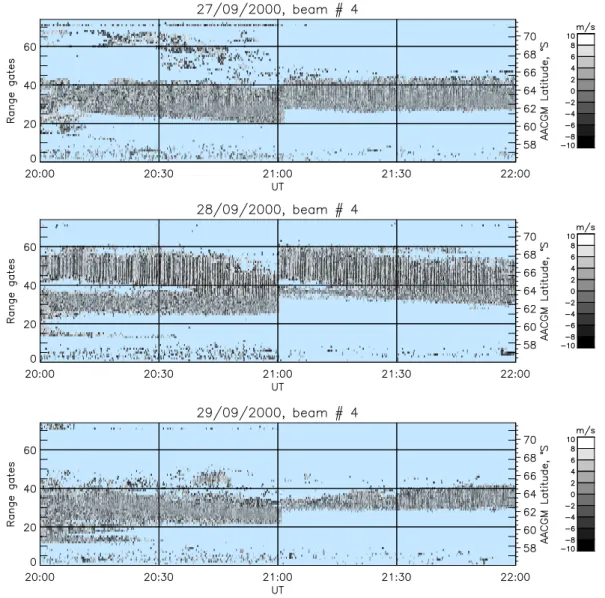
ionospheric-Fig. 1. Boundaries of TIGER field of view (solid line). Dotted lines correspond to geographic coordinates, and dashed lines depict CGM latitude. High-time-resolution data used in this paper were obtained with beam #4 (mesh area) pointing toward the CGM pole (+). Light gray shading corresponds to gates 35–55, where most of the sea-scatter echoes were observed during 20:00–24:00 UT on 28 September 2000 (interval analysed in detail in this paper). Dark gray shading corresponds to the ionospheric reflection regions for those gates (half the apparent range). The location of the Mac-quarie Island (MQI) magnetometer site is shown by a triangle. The light blue shading corresponds to a model plasmapause position at 12 MLT derived from Carpenter and Anderson (1992).
magnetospheric current systems, possibly via streams of pre-cipitating particles. A recent statistical study of high latitude, high coherence length Pc3–4 pulsations with the IMAGE magnetometer array (Howard and Menk, 2001) has shown that the apparent phase velocity of these pulsations is pre-dominantly directed poleward and rarely exceeds 100 km/s. The observed ground velocities were reconciled with the time of flight for a two-step model that combines the above isotropic and field-aligned mechanisms.
With respect to the noise component, it was established that its power increases with increasing southward Bz (Pono-marenko et al., 2002). However, the origin of this component is still unclear.
Further experimental evidence is required to clearly estab-lish the main mechanism(s) by which Pc3–4 waves reach the ground at high latitudes. However, this is difficult because in the polar regions closely-spaced ground magnetometer sta-tions map to widely separated volumes in the magnetosphere. Furthermore, ULF wave parameters obtained with magne-tometer arrays are distorted by the transition from the MHD into the electromagnetic mode at the bottom ionospheric boundary. Consequences include rotation of the polarization plane and spatial integration of the waveform (Hughes and Southwood, 1976). A further limitation is the physical avail-ability of station sites.
ULF waves can also be detected from the ground using HF-VHF radiowaves, either reflected by the regular iono-spheric layer (e.g. Rishbeth and Garriott, 1964), including
oblique sounding using sea/ground scatter (e.g. Bourdillon et al., 1989; Menk et al., 2003) or scattered by ionospheric irregularities (e.g. Walker et al., 1979). Doppler shift mea-surements of E×B drift directly probe the ULF wave electric field at ionospheric heights. However, radar data are strongly affected by constantly varying ionospheric conditions, such as multiple propagation modes, aspect conditions, D-region absorption, etc.
The advent of the HF Super Dual Auroral Radar Network (SuperDARN) (Greenwald et al., 1995), covering the high latitude regions in both hemispheres, has created another di-mension for ULF wave studies with radars. Using data from the TIGER SuperDARN radar in Tasmania it has recently been shown that such radars are capable of routine day-to-day monitoring of ULF wave fields over large areas of the Earth’s ionosphere (Ponomarenko et al., 2003). This was achieved by removing large-amplitude slowly-varying back-ground drifts from ionospheric scatter echoes and utilizing the sea-scatter component which is usually regarded as unim-portant. In this way Ponomarenko et al. (2003) observed sev-eral types of ULF waves in the high-latitude ionosphere, in-cluding band-limited Pc3–4 pulsations at local daytime. The present paper extends that previous work with a comparative ionosphere/ground study of daytime Pc3–4 waves recorded by the TIGER radar. The observations suggest that Pc3–4 energy propagates into and through the magnetosphere in the isotropic fast mode and couples to field-guided Alfv´en mode waves at harmonics of the local resonant frequency, hence conveying energy to the high-latitude ionosphere.
2 Data sources and processing details
This paper uses data from the TIGER (Tasman International Geospace Environment Radar) SuperDARN radar located at Bruny Island near Hobart, Tasmania. This radar probes lower magnetic latitudes compared with other SuperDARN radars, obtaining many of its returns from around the plasmapause region (Fig. 1).
In this work we analyzed special mode radar data obtained during the year 2000 using beam #4, which points toward the AACGM pole along 'AACGM 226◦E (MLT'UT+13:30, Fig. 1). The special scan mode involved beam #4 sampled at
ts'6 s (Nyquist frequency fN'83 mHz) while the remaining beams were sampled at ts'120 s (fN'4.17 mHz).
The closest available ground magnetometers were located at Macquarie Island (MQI, AACGM coordinates 64.39◦S, 248.08◦E, MLT'UT+11:50, L'5.9−6.1, ts=0.5 s) just east of the radar’s field of view (Fig. 1). We used MQI induction magnetometer records and integrated these point-by-point in the time domain to compensate for the ∂B/∂t∝f sensor re-sponse, and then calibrated the resultant to nanoTeslas.
We examined 28 days of high-time-resolution data ob-tained during the year. As we reported earlier (Ponomarenko et al., 2003), several types of ULF waves were observed, including band-limited daytime Pc3–4 oscillations. High coherence, band-limited variations in the 15–40 mHz range
P. V. Ponomarenko et al.: Pc3–4 ULF waves observed by the SuperDARN TIGER radar 1273 were routinely observed between 20:00–24:00 UT (∼08:00–
12:00 MLT) over 10–20 range gates accompanied by simi-lar variations in MQI magnetometer data whenever magnetic records were available.
For illustration, in Fig. 2 we show grey-scale summary plots of radar Doppler velocity, VD, over 20:00–22:00 UT for 27, 28 and 29 September 2000, produced with the FI-TACF routine and detrended with a 5-min box-car window. Further details on the data processing and visualization pro-cedures are given in Ponomarenko et al. (2003), who demon-strated that this representation facilitates the detection of short-period features such as ULF waves. Blue-shaded areas depict invalid or no data. Band-limited Pc3–4 variations in
VDwith amplitudes ∼10–100 m/s can be seen in each panel as vertical stripes of the same grey shade. The small mag-nitude of these Doppler shifts, narrow spectral widths (not shown) and interferometer angle of arrival information (also not shown) identify these returns as sea scatter (Baker et al., 1995). In contrast to the ionospheric scatter, the Doppler shift in sea/ground scatter echoes is mostly caused by a ver-tical bulk motion of the ionospheric layer in the vicinity of the reflection point of the HF wave (e.g. Bourdillon et al., 1989, this is discussed in more detail later). As a result, the apparent range of the echoes corresponds to approxi-mately twice the distance to the reflection point. For ex-ample, Pc3–4 oscillations on 28 September, 2000 were ob-served in gates #35–55 (light grey shading in Fig. 1, appar-ent range '1800−2600 km), but in reality HF signals were reflected from the ionosphere at 900–1300 km from the radar ('62−68◦ MLAT, dark grey shading in Fig. 1). This re-flection region covers ∼200–400 km, and the AACGM lat-itude for gate #43 approximately coincides with that of the MQI magnetometer site. However, the AACGM longitude for MQI is about 22◦east of the meridional beam #4,'1.5 h in MLT. Note that the effective magnetometer field of view covers '200 km (Hughes and Southwood, 1976), e.g. '8−9 range gates.
Around 21:00 UT on each day shown in Fig. 2 there was a routine increase in the radar frequency from '12 to
'14.5 MHz to account for diurnal variations in ionospheric parameters. This frequency shift resulted in an increase of the echo range. This is further evidence of the sea-scatter nature of the observed echoes, since for ionospheric scatter the echo range would essentially remain tied to the region exhibiting field-aligned irregularity structures. As the sea-scatter component is reflected from the regular ionospheric layer the apparent echo range is directly related to the skip distance.
Analysis of the whole 28-day data set revealed the daily presence of band-limited Pc3–4 oscillations around 8– 12 MLT, provided there was a consistent sea-scatter compo-nent. Ionospheric scatter returns were rarely seen at this time of day.
In this paper we present a detailed case study of the in-terval 20:00–24:00 UT recorded on 28 September 2000, partly shown in the middle panel of Fig. 2. Intense (PSD≥10 nT2/Hz) band-limited Pc3–4 waves were observed
on the ground at MQI and simultaneously in beam #4 sea-scatter radar returns, where the VD oscillations reached am-plitudes of 100–150 m/s.
In order to place the ground and ionospheric observations in context, we consider interplanetary data obtained from the ACE satellite, which was located near the Lagrangian point at XGSM'228 RE, YGSM'−30 RE, ZGSM'4−5 RE. The time-of-flight delay from this position to the ionosphere was estimated to be about 60 min. Solar wind conditions for the interval of interest are shown in Fig. 3.
The solar wind magnitude was relatively steady at
VSW'420 km/s. The IMF magnitude was |BI MF|'5 nT with predominantly negative Bx∼−4 nT, positive
By∼2−3 nT, and Bz varying within ±2 nT, except for a brief growth to 4 nT around 21:35–21:40 UT. The cone angle θxvaried around the Parker spiral angle of 140◦with a standard deviation of '10◦. The global K
p-index was between 1−−10. Data from the low resolution fluxgate magnetometer at MQI indicate substorm activity during 10:30–17:30 UT with the H component reaching −300 nT. This was accompanied by a prolonged interval of negative
Bz'−4 nT during 09:30–15:00 UT. Hence, the interval under study corresponds to the early recovery stage of the magnetosphere. We estimated the position of the plasma-pause (blue shading in Figure 1) using the empirical model from Carpenter and Anderson (1992) at 12:00 MLT based on the maximum KP value in the preceeding 24 h (KP max=4−) and average sunspot number (R=100). The inner boundary was most likely at L'4 ('−58.5◦ MLAT) and the outer boundary at L'4.5('−61◦MLAT).
Figure 4 presents four one-hour intervals of Doppler data over 20:00–24:00 UT after removing solitary spikes and de-trending with a 5-minute box-car window. The band-limited Pc3–4 oscillations are clearly seen throughout the time record. Part of this interval, 20:38:30–20:43:30 UT, is now examined in detail. A 5-min range-time plot (Fig. 5a) reveals features similar to those of field-line resonances (FLRs), in-cluding a spatially localized increase of wave amplitude and tangent-shaped latitudinal phase gradient. White arrows in Fig. 5a show the approximate alignment of the wave phase front, while Fig. 5b represents the 2-D spectral density of VD for the same interval. This is characterized by a main maxi-mum in gate #41 (L'6) at 23.3 mHz. The power-range pro-file for f =23.3 mHz is shown in Fig. 5c, together with the associated cross-phase profile. A local peak in power and the phase variation characteristic of FLRs is evident with a scale size of '5 range gates, i.e. 5(45/2)∼100 km for sea-scatter. These structures are seen only from time to time, probably because both the position of the quasi-FLR region and the range of radar echoes vary with time. Furthermore, the am-plitude increase is not always accompanied by a change in the phase gradient.
We also attempted to estimate the apparent meridional phase velocity from the radar data. This was not success-ful because the ionospheric phase profiles were either con-taminated by the apparent proximity of the FLR contour, or
Fig. 2. FITACF output Doppler velocity for beam #4 during 20:00–22:00 UT, 27–29 September 2000 (MLT'UT+13:30) after removing single spikes and detrending with a 5-min box-car window. Right axis corresponds to the AACGM latitude of ionospheric reflection region for sea-scatter echoes. Blue-shaded areas depict invalid or no data. AACGM latitude of MQI approximately corresponds to that of gate #43, but it is shifted from beam #4 in magnetic longitude by '22◦('1.5 h MLT) eastward.
the signal-to-noise level was rather low away from the reso-nance.
There are at least three different mechanisms that may contribute to Doppler shifts in HF signals reflected from the ionosphere (Poole et al., 1988), including changes in the re-fractive index below the electron density peak. However, Bourdillon et al. (1989), who used a very similar experimen-tal set-up in mid-latitudes, applied the Poole et al. (1988) approach to the oblique HF propagation path and found that for the sea-scatter component the observed variation in VDis caused mainly by a bulk vertical motion of the ionospheric layer. It is easy to show (e.g. Rishbeth and Garriott, 1964), that this motion is caused by the azimuthal component of the ULF wave electric field in the ionosphere, EEW:
VD=
EEW
B0
cos I, (1)
where B0 is the geomagnetic field magnitude, I its
incli-nation. This means that the observed vertical oscillations
VD∼10–100 m/s are caused by the electric field of a poloidal-mode ULF wave of amplitude ∼1–10 mV/m. As we will show later, at these latitudes, the daytime fundamental FLR frequencies usually do not exceed 8–10 mHz. Consequently, the structure observed in Fig. 5 might be interpreted as a higher harmonic of a poloidal resonance.
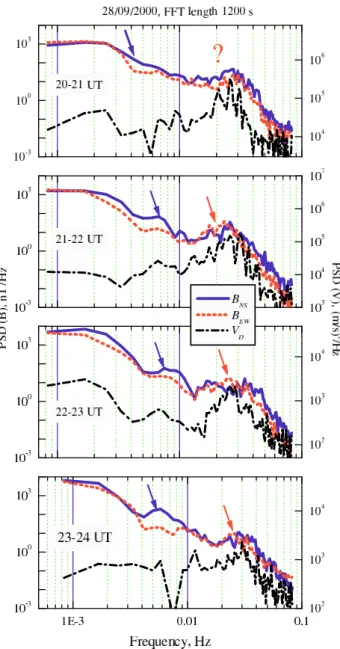
Next we compare averaged frequency spectra from the induction magnetometer at MQI with those from the radar for each hourly panel shown in Fig. 4. For this pur-pose we used radar gates corresponding to the centre of the range-time “strip” of valid radar data (gate #45 for 20:00–22:00 (L=6.3−6.7) and gate #35 for 22:00–24:00 UT (L=5.1−5.2), red lines in Fig. 4). Power spectra were cal-culated using a 50%-overlapping Hanning-windowed time
P. V. Ponomarenko et al.: Pc3–4 ULF waves observed by the SuperDARN TIGER radar 1275 series, and the radar data used for spectral analysis were
de-spiked. Figure 6 shows spectra with a frequency resolution
δf=3.33 mHz (FFT-length 300 s). Note that the vertical scale is different for magnetic and radar data (left and right axes, respectively). Both data sets exhibit coincident band-limited Pc3–4 enhancements within the ∼15–40 mHz band with a spectral density maximum at ∼25–30 mHz. This suggests that the same waves are being observed in the ionosphere and on the ground. In addition, the magnetometer spectra also show a steep power-law background S(f )∝f−(3.0−4.0), as discussed in detail by Ponomarenko et al. (2002). Fol-lowing them, we label the band-limited Pc3–4 component as signal and the power-law background as the noise.
Another interesting feature is the gradual change in ground spectra from the situation when spectral density for the east-west component of B, SEW, is less than that for the north-south component, SN S, across the whole frequency band (20:00–21:00 UT), to the situation when SEW>SN S (be-tween 20 and 30 mHz, 22:00–24:00 UT). The latter situation is characterized by a near-zero ellipticity and EW orienta-tion of the ULF wave magnetic field B at the ground (not shown). Assuming 90◦ azimuth rotation for B in the hor-izontal plane on passing through the ionosphere, the spec-tral enhancement in SEW corresponds to poloidal FLR har-monics observed by the radar. Model calculations by Cum-mings et al. (1969) show that under reasonable assumptions about the magnetospheric plasma distribution, the frequency of the n-th toroidal or poloidal FLR harmonic, fn, is 20– 30% larger than n-times the fundamental toroidal mode fre-quency, f1t. To be able to measure the fundamental FLR fre-quency f1 in Fig. 7 we calculated high resolution spectra (FFT-length 1200 s, 1f =0.83 mHz) for the same UT inter-vals as in Fig. 6. This allowed us to estimate f1'4–8 mHz over 20:00–24:00 UT (blue arrows). However, the higher frequency resolution inevitably led to an increase in statisti-cal fluctuations of the spectral density and made Pc3–4 en-hancements in SEW less apparent than in Fig. 6. In our case the harmonic ratio is fnt,p/f1t∼3−4, suggesting that we are seeing the third harmonic, in agreement with observations by Takahashi and Anderson (1992).
The lack of the Pc3–4 enhancement in SEW at 20:00– 21:00 UT (∼08:00–09:00 MLT) might be connected with a relatively low fundamental toroidal mode resonance fre-quency at MQI (f1t'4 mHz) during that interval. In this case the third poloidal harmonic frequency (f3p'12–16 mHz), on average, did not overlap the Pc3–4 signal band generated by the upstream ion-cyclotron process. Later in the day, possi-bly due to some diurnal variation in field line length and/or its mass loading, the fundamental frequency increased to
f1t'6–8 mHz, so that the third harmonic f3p≥20 mHz fell into the signal band, and the SEWenhancement became vis-ible at MQI.
In summary, our main experimental results are:
– Daytime band-limited Pc3–4 pulsations are often recorded simultaneously by ground magnetometers and in ground scatter Doppler velocity data with the TIGER
Fig. 3. Solar wind speed and IMF components from the ACE satel-lite for 19:00–23:00 UT on 28 September 2000.
HF radar, where they extend over hundreds of kilome-ters.
– The waves have similar frequency peaks in magnetome-ter and radar spectra, and are most likely generated by the same source. The ionospheric Doppler shifts relate to plasma drifts driven by azimuthal wave electric fields of the order of 1–10 mV/m.
– Ground data also exhibit a previously described steep power-law background with S(f )∝f−(3−4), but this component is absent in the ionospheric data.
– Both the ground and ionospheric Pc3–4 variations sometimes exhibit structures resembling a third-harmonic poloidal field line resonance. Radar data show that the characteristic meridional width of the resonant contour is ∼100 km.
Fig. 4. Consecutive one-hour intervals of Doppler data over 20:00–24:00 UT shown in the same format as in Fig. 2. The red horizontal line corresponds to gates #45 and 35 used for further spectral analysis (see Figs. 6, 7). The black horizontal arrow in the top panel shows a time interval with FLR features analysed in detail in Fig. 5.
3 Discussion and modelling
While Pc3–4 pulsations are observed on the ground during virtually every local morning, their occurrence and amplitude of magnetospheric Pc3–4 ULF waves is enhanced (i) near equinox, when magnetic activity is generally intensified, (ii) at low solar wind cone angle, and (iii) when the solar wind speed is large (e.g. Gul’elmi et al., 1973; Greenstadt et al., 1979; Takahashi et al., 1981; Hoppe and Russell, 1983). As we mentioned in the Introduction, their generation is com-monly attributed to the ion-cyclotron instability in the proton beams reflected from the Earth’s bow shock (e.g. Fairfield, 1969; Paschmann et al., 1979). Ponomarenko et al. (2002) showed that, through its dependence on solar wind param-eters, the signal component most likely originates from the upstream ion-cyclotron instability in reflected proton beams (e.g. Fairfield, 1969; Paschmann et al., 1979). From the
sim-ilarity in spectral shape, it is therefore reasonable to suggest that the Pc3–4 variations observed here in both the radar and magnetometer data sets may have an upstream origin.
Another possible source of the observed waves would be drift or drift-bouncing resonance (e.g. Yeoman and Wright, 1991). However, the particle-driven waves display nearly monochromatic spectral structure and large azimuthal wave numbers m, which make them hardly observed on the ground. In contrast, the Pc3–4 waves we have observed are relatively more broad band (e.g. Fig. 6), and they are con-fidently detected by the ground-based magnetometers sug-gesting their relatively low m-numbers. Furthermore, the ex-pected frequency for waves generated by the ion-cyclotron resonance in the upstream solar wind can be estimated using the formula given by Takahashi et al. (1984):
P. V. Ponomarenko et al.: Pc3–4 ULF waves observed by the SuperDARN TIGER radar 1277
Fig. 5. Example of FLR-like variations in VD over 20:38:30–
20:43:30 UT. (a) Range-time dependence for VD; white arrows
show approximate alignment of the phase front. (b) Power spec-tral density; vertical dashed line corresponds to PSD maximum at 23.3 mHz. (c) Latitudinal profile of PSD and cross-phase at 23.3 mHz.
Using ACE satellite data and taking into account '1-h propa-gation delay to the ionosphere, the estimated mean frequency over 20:00–24:00 UT on 28 September 2000 is '22 mHz with standard deviation '7 mHz. This agrees well with the experimentally observed signal frequency ('23 mHz) and spectral width.
Identification of the wave mode(s) at ionospheric heights is not straightforward because sea scatter only provides in-formation on one wave component (EEW) over a range of the order of 350–450 km. Furthermore, spatial integration “smears” the amplitude distribution and distorts spatial phase gradients observed on the ground. Also, the radar and mag-netometer fields of view are separated by '1.5 h in MLT. Nevertheless, the ground and radar data both suggest that at least part of Pc3–4 wave energy belongs to a higher-harmonic poloidal FLR. This conclusion agrees with a sta-tistical study of satellite data by Takahashi and Anderson (1992), who observed third-harmonic poloidal oscillations at
f '26 mHz across ±3 h around local noon in two regions: in the plasmatrough at L'6.0−6.5 and inside the plasmapause (L'3.5−4.0).
Fig. 6. Ionospheric (black) and ground (blue and red) power spec-tra obtained with frequency resolution δf =3.33 mHz (FFT-length 300 s). Red arrows show areas where PSD in the EW components exceeds that in the NS component, which we interpret as a signature of a poloidal FLR harmonic. The red vertical bar on the right side of the top panel shows 90% confidence interval for spectral density in the magnetometer data.
A statistical satellite-based study by Cao et al. (1994) showed that in the outer magnetosphere compressional Pc3– 4 power is confined to the magnetic equatorial plane and the pre-noon sector, while field-aligned wave modes are spread more evenly with magnetic latitude. The ground study by Howard and Menk (2001) found that the apparent merid-ional phase speed for Pc3–4 waves on the Earth’s surface is much smaller than the Alfv´en velocity Vph∼10–60 km/s
<VA, but the azimuthal speeds are much higher. This means that the wave phase front is propagating mostly poleward. In our case, the limited spatial span of radar data and the pres-ence of FLR-like structures does not allow us to confidently measure Vphat ionospheric heights.
Fig. 7. The same as in Fig. 6 but with higher frequency resolution
δf=0.83 mHz (FFT-length 1200 s), which resolves Pc4–5 compo-nents. Red arrows still identify a likely poloidal FLR harmonic, while blue arrows identify the fundamental toroidal resonance.
Our experimental results give support to the following propagation model previously proposed by other authors (e.g. Howard and Menk, 2001) and schematically illustrated in Fig. 8:
1. Waves in the Pc3–4 range are generated in the solar wind upstream of the bow shock due to ion-cyclotron resonance with reflected proton beams, and penetrate the bow shock and magnetosheath to reach the magne-topause.
2. Isotropic (fast-mode) Pc3–4 waves then propagate earthward from the magnetopause in the equatorial plane.
Fig. 8. Schematic of possible Pc3–4 energy propagation to the high-latitude ionosphere.
Fig. 9. Estimates of the meridional Pc3–4 wave phase velocity for the model in Fig. 8 (dipole magnetic field, magnetopause proton density Np=2.5–3.8 cm−3, Np(r)∝1/r4).
3. Due to inhomogeneity in the magnetosphere, part of the compressional energy mode converts to field-aligned (Alfv´enic) oscillations that propagate from the equato-rial plane to the high-latitude ionosphere.
4. Alfv´enic waves at the appropriate frequency reach iono-spheric heights as FLR harmonics, and at other frequen-cies as quasi-resonances or forced modes.
Further support for this scenario is given by the appar-ent absence of even (2nd, 4th, etc.) FLR harmonics, which have a node at the geomagnetic equator. Following the same logic, we may expect to observe progressively higher odd FLR harmonics at higher latitudes. We could not check this with the TIGER radar but this should be possible with other radars. Furthermore, the presence of Pc3–4 power in both the NS and EW components across the ground projection of the entire outer magnetosphere, as reported by Howard and Menk (2001), implies that most of the wave energy comes from a non-resonant conversion of the fast mode into the field-aligned mode.
P. V. Ponomarenko et al.: Pc3–4 ULF waves observed by the SuperDARN TIGER radar 1279 As a first-order check of the validity of the above scenario,
we modelled the latitudinal dependence of Vphusing time-of-flight calculations for fast mode ULF waves travelling earthward from the magnetopause in the geomagnetic equa-torial plane, then coupling to the field-guided shear Alfv´en mode. We assumed a dipolar magnetic field and proton density Np distribution in the outer magnetosphere propor-tional to r−4. Using the T96 01 model by Tsyganenko (http://nssdc.gsfc.nasa.gov/space/cgm/t96.html), for the pe-riod 20:00–24:00 UT on 28 September the plasma density at the magnetopause was estimated to be Np=2.5–3.8 cm−3, giving apparent phase velocities in the ionosphere Vph∼10– 100 km/h directed poleward. This is represented by the shaded region in Fig. 9. The arrowed bar depicts the range of latitudes over which the Pc3–4 waves were observed. The expected phase velocity agrees with the observations of Howard and Menk (2001).
4 Conclusions
Band-limited daytime Pc3–4 waves were routinely observed in the ground scatter component of SuperDARN TIGER radar during high-time-resolution operation modes. Com-parison of their experimental characteristics with those ob-served by a ground magnetometer at close magnetic latitude are seemingly consistent with a two-part scenario: upstream-generated isotropic waves propagating in the magnetic equa-torial plane convert part of their energy into field-line-guided Alfv´en waves, which carry Pc3–4 energy to the high lati-tude ionosphere. The combination of those two propaga-tion mechanisms would produce apparent poleward phase velocities ∼10–100 km/s, which are consistent with previous ground observations.
While much previous work has focused on the role of toroidal field line resonances, according to our observations in the ionosphere and on the ground, Pc3–4 waves regularly exhibit poloidal-mode 3rd FLR-harmonic structure.
Future experimental work should focus on multi-beam radar studies of Pc3–4 waves to resolve their longitudinal structure in the ionosphere. This might become possible by implementing the recently developed “stereo” mode of Su-perDARN operation. SuSu-perDARN ground-scatter data from higher latitudes should also be examined for higher-order FLR harmonics (5th, 7th, etc.). To obtain a more detailed qualitative and quantitative understanding of the proposed Pc3–4 propagation scenario, future effort will concentrate on 2-D–3-D modelling of Pc3–4 wave propagation in the Earth’s magnetosphere.
Acknowledgements. This work was supported by the Australian Antarctic Division and the Antarctic Science Advisory Commit-tee, the Australian Research Council, the University of Newcastle, and the Cooperative Research Centre for Satellite Systems through the Commonwealth of Australia CRC Program. We are grateful to the ACE Science Center team at Caltech for provided access to the solar wind and IMF data. We also thank P. Dyson, J. Devlin and M. Parkinson for operating and providing data from the TIGER
radar. We would like to thank B. Fraser for fruitful discussions and overall support of this work.
Topical Editor M. Lester thanks L. Baddeley and W. J. Hughes for their help in evaluating this paper.
References
Baker, K. B., Dudeney, J. R., Greenwald, R. A., Pinnock, M., Newell, P. T., Rodger, A. S., Mattin, N., and Meng, C.-I.: HF radar signatures of the cusp and low-latitude boundary layer, J. Geophys. Res., 100, 7671–7695, 1995.
Bol’shakova, O. V. and Troitskaya, V. A.: The relation of the high-latitude maximum of Pc3 intensity to the dayside cusp, Geo-magn. Aeron., 24, 633–635, 1984.
Bourdillon, A., Delloue, J., and Parent, J.: Effects of geomagnetic pulsations on the Doppler shift of HF backscatter radar echoes, Radio Sci., 24, 183–195, 1989.
Cao, M., McPherron, R. L., and Russell, C. T.: Statistical study of ULF wave occurrence in the dayside magnetosphere, J. Geophys. Res., 99, 8731–8753, 1994.
Carpenter, D. L. and Anderson, R. R.: An ISEE/whistler model of equatorial electron density in the magnetosphere, J. Geophys. Res., 97, 1097–1108, 1992.
Cummings, W. D., O’Sullivan, R. J., and Coleman, P. J.: Standing Alfv´en waves in the magnetosphere, J. Geophys. Res., 74, 778– 793, 1969.
Engebretson, M. J., Meng, C. I., Arnoldy, R. L., and Cahill, L. J.: Pc3 pulsations observed near the south polar cap, J. Geophys. Res., 91, 8909–8918, 1986.
Engebretson, M. J., Cahill, L. J., Arnoldy, R. L., Anderson, B. J., Rosenberg, T. J., Carpenter, D. L., Inan, U. S., and Eather, R. H.: The role of the ionosphere in coupling upstream ULF wave power into the dayside magnetosphere, J. Geophys. Res., 96, 1527–1542, 1991.
Fairfield, D. H.: Bow shock associated waves observed in the far upstream interplanetary medium, J. Geophys. Res., 74, 3541– 3553, 1969.
Fraser-Smith, A. C.: ULF/lower-ELF electromagntic field measure-ments in the polar caps, Rev. Geophys. Space Phys., 20, 497– 512, 1982.
Greenstadt, E. W., Singer, H. J., Russell, C. T., and Olson, J. V.: IMF orientation, solar wind velocity, and Pc3–4 signals: a joint distribution, J. Geophys. Res., 84, 527–532, 1979.
Greenwald, R. A., Baker, K. B., Dudeney, J. R., Pinnock, M., Jones, T. B., Thomas, E. C., Villain, J. P., Cerisier, J. C., Senior, C., Ha-niuse, C., Hunsucker, R. D., Sofko, G., Koehler, J., Nielsen, E., Pellinen, R., Walker, A. D. M., Sato, N., and Yamagishi, H.: DARN/SuperDARN: A global view of the dynamics of high-latitude convection, Space. Sci. Rev., 71, 761–795, 1995. Gul’elmi, A. V., Plyasova-Bakunina, T. A., and Shchepetov, R. V.:
Relations between the period of geomagnetic pulsations Pc3, 4 and the parameters of the interplanetary medium at the earth’s orbit, Geomagn. Aeron., 13, 331–334, 1973.
Hoppe, M. M. and Russell, C. T.: Plasma rest frame frequencies and polarizations of the low-frequency upstream waves: ISEE 1 and 2 observations, J. Geophys. Res., 88, 2021–2028, 1983. Howard, T. and Menk, F. W.: Propagation of 10–50 mHz ULF
waves with high spatial coherence at high latitudes, Geophys. Res. Lett., 28, 231–234, 2001.
Hughes, W. J. and Southwood, D. J.: The screening of micropulsa-tion signals by the atmosphere and the ionosphere, J. Geophys.
Res., 81, 3234–3240, 1976.
Menk, F. W., Yeoman, T. K., Wright, D., Lester, M., and Honary, F.: High latitude observations of impulse-driven ULF pulsations in the ionosphere and on the ground, Ann. Geophys., 21, 559–576, 2003.
Paschmann, G., Sckopke, N., Bame, S. J., Asbridge, J. R., Gosling, J. T., Russell, C. T., and Greenstadt, E. W.: Association of low-frequency waves with suprathermal ions in the upstream solar wind, Geophys. Res. Lett., 6, 209–212, 1979.
Ponomarenko, P. V., Fraser, B. J., Menk, F. W., Ables, S. T., and Morris, R. J.: Cusp-latitude Pc3 spectra: band-limited and power-law components, Ann. Geophys., 20, 1539–1551, 2002. Ponomarenko, P. V., Menk, F. W., and Waters, C. L.:
Visualiza-tion of ULF waves in SuperDARN data, Geophys. Res. Lett., 30, 1926–1929, 2003.
Poole, A. W. V., Sutcliffe, P. R., and Walker, A. D. M.: The rela-tionship between ULF geomagnetic pulsations and ionospheric Doppler oscillations: Derivation of a model, J. Geophys. Res., 93, 14 656–14 664, 1988.
Rishbeth, H. and Garriott, O. K.: Relationship between simultane-ous geomagnetic and ionospheric oscillations, Radio Sci., 68D, 339–343, 1964.
Takahashi, K. and Anderson, B. J.: Distribution of ULF energy (f<80 mHz) in the inner magnetosphere: a statistical analysis of AMPTE CCE magnetic field data, J. Geophys. Res., 97, 10 751– 10 773, 1992.
Takahashi, K., McPherron, R. L., Greenstadt, E. W., and Neeley, C. A.: Factors controlling the occurrence of Pc3 magnetic pul-sations at synchronous orbit, J. Geophys. Res., 86, 5472–5484, 1981.
Takahashi, K., McPherron, R. L., and Terasawa, T.: Dependence of the spectrum of Pc3–4 pulsations on the interplanetary magnetic field, J. Geophys. Res., 89, 2770–2780, 1984.
Walker, A. D. M., Greenwald, R. A., Stuart, W. F., and Green, C. A.: Stare auroral radar observations of Pc5 geomagnetic pulsations, J. Geophys. Res., 84, 3373–3388, 1979.
Yeoman, T. K. and Wright, D. M.: ULF waves with drift reso-nance and drift-bounce resoreso-nance energy sources as observed in artificially-induced HF radar backscatter, Ann. Geophys., 19, 159–170, 1991.
Yumoto, K., Saito, T., Akasofu, S. I., Tsurutani, B. T., and Smith, E. J.: Propagation mechanism of daytime Pc3–4 pulsations ob-served at synchronous orbit and multiple ground-based stations, J. Geophys. Res., 90, 6439–6450, 1985.