HAL Id: hal-02993459
https://hal.archives-ouvertes.fr/hal-02993459
Submitted on 6 Nov 2020
HAL is a multi-disciplinary open access
archive for the deposit and dissemination of
sci-entific research documents, whether they are
pub-lished or not. The documents may come from
teaching and research institutions in France or
abroad, or from public or private research centers.
L’archive ouverte pluridisciplinaire HAL, est
destinée au dépôt et à la diffusion de documents
scientifiques de niveau recherche, publiés ou non,
émanant des établissements d’enseignement et de
recherche français ou étrangers, des laboratoires
publics ou privés.
The Next Generation Virgo Cluster Survey. XXXIV.
Ultracompact Dwarf Galaxies in the Virgo Cluster
Chengze Liu, Patrick Côté, Eric Peng, Joel Roediger, Hongxin Zhang, Laura
Ferrarese, Ruben Sánchez-Janssen, Puragra Guhathakurta, Xiaohu Yang,
Yipeng Jing, et al.
To cite this version:
Chengze Liu, Patrick Côté, Eric Peng, Joel Roediger, Hongxin Zhang, et al.. The Next
Gener-ation Virgo Cluster Survey. XXXIV. Ultracompact Dwarf Galaxies in the Virgo Cluster.
Astro-physical Journal Supplement, American Astronomical Society, 2020, 250 (1), pp.17.
�10.3847/1538-4365/abad91�. �hal-02993459�
Typeset using L
ATEX twocolumn style in AASTeX63
The Next Generation Virgo Cluster Survey. XXXIV. Ultra-Compact Dwarf (UCD) Galaxies in the
Virgo Cluster.
Chengze Liu
,
1Patrick Cˆ
ot´
e
,
2Eric W. Peng
,
3, 4Joel Roediger
,
2Hongxin Zhang
,
5, 6Laura Ferrarese
,
2Ruben S´
anchez-Janssen
,
7Puragra Guhathakurta
,
8Xiaohu Yang
,
1Yipeng Jing
,
1Karla Alamo-Mart´ınez
,
9John P. Blakeslee
,
2Alessandro Boselli
,
10Jean-Charles Cuilandre,
11Pierre-Alain Duc
,
12Patrick Durrell
,
13Stephen Gwyn,
2Andres Jord´
an
,
14, 15Youkyung Ko
,
3Ariane Lanc
¸on
,
12Sungsoon Lim
,
2, 16Alessia Longobardi
,
10Simona Mei
,
17, 18J. Christopher Mihos
,
19Roberto Mu˜
noz,
9Mathieu Powalka
,
12Thomas Puzia
,
9Chelsea Spengler
,
2and
Elisa Toloba
201
Department of Astronomy, School of Physics and Astronomy, and Shanghai Key Laboratory for Particle Physics and Cosmology,
Shanghai Jiao Tong University, Shanghai 200240, China
2
Herzberg Astronomy and Astrophysics Research Centre, National Research Council of Canada, 5071 W. Saanich Road, Victoria, BC,
V9E 2E7, Canada
3
Department of Astronomy, Peking University, Beijing 100871, China
4
Kavli Institute for Astronomy and Astrophysics, Peking University, Beijing 100871, China
5
School of Astronomy and Space Science, University of Science and Technology of China, Hefei 230026, China
6
CAS Key Laboratory for Research in Galaxies and Cosmology, Department of Astronomy, University of Science and Technology of
China, Hefei, Anhui 230026, China
7
STFC UK Astronomy Technology Centre, Royal Observatory, Blackford Hill, Edinburgh, EH9 3HJ, UK
8
UCO/Lick Observatory, Department of Astronomy and Astrophysics, University of California Santa Cruz, 1156 High Street, Santa
Cruz, CA 95064, USA
9
Instituto de Astrofsica, Pontificia Universidad Cat´
olica de Chile, Av. Vicu˜
na Mackenna 4860, 7820436 Macul, Santiago, Chile
10Aix-Marseille Univ, CNRS, CNES, LAM, Marseille, France
11
AIM Paris Saclay, CNRS/INSU, CEA/Irfu, Universit´
e Paris Diderot, Orme des Merisiers, F-91191 Gif-sur-Yvette Cedex, France
12Universit´
e de Strasbourg, CNRS, Observatoire astronomique de Strasbourg, UMR 7550, F-67000 Strasbourg, France
13
Department of Physics and Astronomy, Youngstown State University, Youngstown, OH 44555, USA
14
Facultad de Ingenier´ıa y Ciencias, Universidad Adolfo Ib´
a˜
nez, Av. Diagonal las Torres 2640, Pe˜
nalol´
en, Santiago, Chile
15Millennium Institute for Astrophysics, Chile
16
University of Tampa, 401 West Kennedy Boulevard, Tampa, FL 33606, USA
17
Universit´
e de Paris, F-75013, Paris, France, LERMA, Observatoire de Paris, PSL Research University, CNRS, Sorbonne Universit´
e,
F-75014 Paris, France
18
Jet Propulsion Laboratory and Cahill Center for Astronomy & Astrophysics, California Institute of Technology, 4800 Oak Grove Drive,
Pasadena, California 91011, USA
19
Department of Astronomy, Case Western Reserve University, 10900 Euclid Ave, Cleveland, OH 44106, USA
20Department of Physics, University of the Pacific, 3601 Pacific Avenue, Stockton, CA 95211, USA
Submitted to The Astrophysical Journal Supplement
ABSTRACT
We present a study of ultra compact dwarf (UCD) galaxies in the Virgo cluster based mainly on
imaging from the Next Generation Virgo Cluster Survey (NGVS). Using ∼100 deg
2
of u
∗
giz
imag-ing, we have identified more than 600 candidate UCDs, from the core of Virgo out to its virial radius.
Candidates have been selected through a combination of magnitudes, ellipticities, colors, surface
bright-nesses, half-light radii and, when available, radial velocities. Candidates were also visually validated
from deep NGVS images. Subsamples of varying completeness and purity have been defined to explore
the properties of UCDs and compare to those of globular clusters and the nuclei of dwarf galaxies with
the aim of delineating the nature and origins of UCDs. From a surface density map, we find the UCDs
to be mostly concentrated within Virgo’s main subclusters, around its brightest galaxies. We identify
Corresponding author: Chengze Liu
czliu@sjtu.edu.cn
Liu et al.
several subsamples of UCDs — i.e., the brightest, largest, and those with the most pronounced and/or
asymmetric envelopes — that could hold clues to the origin of UCDs and possible evolutionary links
with dwarf nuclei. We find some evidence for such a connection from the existence of diffuse envelopes
around some UCDs, and comparisons of radial distributions of UCDs and nucleated galaxies within
the cluster.
Keywords: galaxies: clusters: individual (Virgo) — galaxies: evolution — galaxies: dwarf — galaxies:
nuclei — galaxies: star clusters: general
1.
INTRODUCTION
Roughly two decades ago, investigators reported the
discovery of a potentially new class of stellar system in
the Fornax cluster (
Hilker et al. 1999
;
Drinkwater et al.
2000
;
Phillipps et al. 2001
). These systems appeared to
bridge the gap between normal globular clusters (GCs)
and early-type galaxies (including the subset of compact
elliptical galaxies), and so were named as ultra-compact
dwarf galaxies (UCDs). Since then, such objects have
been identified around field galaxies (e.g.,
Norris &
Kan-nappan 2011
;
Jennings et al. 2014
) as well as in galaxy
groups and clusters: i.e., Virgo (
Ha¸segan et al. 2005
;
Jones et al. 2006
), Abell 1689 (
Mieske et al. 2005
),
Cen-taurus (
Mieske et al. 2007a
), Hydra (
Wehner &
Har-ris 2007
), Abell S0740 (
Blakeslee & Barber DeGraaff
2008
), Coma (
Madrid et al. 2010
), the NGC 1023 group
(
Mieske et al. 2007b
), the Dorado group (
Evstigneeva
et al. 2007a
), the NGC 5044 group (
Faifer et al. 2017
),
the NGC 3613 group (
De B´
ortoli et al. 2020
) and the
NGC 1132 fossil group (
Madrid 2011
).
While UCDs
have luminosities comparable to faint dwarf elliptical
(dE) galaxies, their sizes (∼10 to 100 pc) are smaller
than “normal” dEs and yet larger than typical GCs.
Due to their compact sizes and high stellar densities,
they pose significant challenges for standard models of
dwarf galaxy formation (see, e.g.,
Strader et al. 2013
).
UCD formation models, which remain mostly
quali-tative in nature, generally invoke one of two basic
sce-narios. The first posits that UCDs may simply be the
most massive members of the GC population,
associ-ated with the high-luminosity tail of the GC luminosity
function (e.g.,
Mieske et al. 2002
) or possibly arising
through mergers of massive star clusters (e.g.,
Fellhauer
& Kroupa 2002
). The second asserts that UCDs are
the surviving nuclear star clusters of nucleated dwarf
el-liptical galaxies (dE,Ns) whose surrounding low surface
brightness envelopes were removed via tidal stripping
(e.g.,
Bekki et al. 2001
). Of course, it is entirely possible
that UCDs are not a monolithic population: i.e., that
they are manifested through both scenarios (
Ha¸segan
et al. 2005
;
Hilker 2006
;
Mieske et al. 2006
;
Da Rocha
et al. 2011
).
In recent years, evidence has mounted in favor of a
tidal stripping origin for at least some of these objects.
Arguably the strongest evidence comes from studies of
the internal kinematics of UCDs: analyses of their
inte-grated light show that UCDs can have high
dynamical-to-stellar mass ratios (
Forbes et al. 2014
;
Janz et al.
2015
), while adaptive optics (AO) assisted integral-field
unit (IFU) spectroscopy has enabled the discovery of
supermassive black holes (SMBHs) in several systems
(
Seth et al. 2014
;
Ahn et al. 2017
,
2018
;
Afanasiev et al.
2018
). Concurrently, a kinematic study of the UCD
pop-ulation around M87 has shown that they follow
radially-biased orbits (
Zhang et al. 2015
). Meanwhile,
photo-metric studies have revealed the presence of UCDs with
asymmetric/tidal features (e.g.,
Jennings et al. 2015
;
Mihos et al. 2015
;
Voggel et al. 2016
;
Schweizer et al.
2018
), UCDs with diffuse envelopes, which populate an
apparent sequence in strength from dE,N to UCD (e.g.,
Drinkwater et al. 2003
;
Ha¸segan et al. 2005
;
Penny et al.
2014
;
Liu et al. 2015a
), and clustering of GCs around
UCDs (
Voggel et al. 2016
).
With regards to stellar
contents, investigators have found color-magnitude and
mass-metallicity relations (e.g.,
Cˆ
ot´
e et al. 2006
;
Brodie
et al. 2011
;
Zhang et al. 2018
), the absence of color
gradients (
Liu et al. 2015a
), and similarities in
stel-lar populations to nuclei (e.g.,
Paudel et al. 2010
;
Janz
et al. 2016
). Additionally, N-body simulations and
semi-analytic models have demonstrated the viability of tidal
stripping (within a cosmological framework) to
trans-form dE,Ns to UCDs (e.g.,
Bekki et al. 2003
;
Pfeffer
& Baumgardt 2013
;
Pfeffer et al. 2014
,
2016
, Mayes
et al. 2020, in prep.). From this it seems clear that
at least some portion of the population (e.g., massive
UCDs) represent the stripped remnants of nucleated
dwarf galaxies.
A prerequisite for the development and testing of any
quantitative UCD formation model is reliable data on
the physical properties of these objects, drawn from
surveys with well-understood selection functions. Such
data has proved elusive, though, and existing UCD
sam-ples are usually built from heterogeneous programs.
Al-though they have been across a wide range of
environ-ments, most UCDs are located in groups and clusters, or
NGVS XXXIV. Ultra-Compact Dwarfs in the Virgo Cluster
associated with massive galaxies (e.g.,
Liu et al. 2015a
).
As the richest concentration of galaxies near the Milky
Way (MW), the Virgo cluster is an ideal environment
for a comprehensive UCD survey. A handful of systems
were first discovered in Virgo by
Ha¸segan et al.
(
2005
)
through a combination of Keck spectroscopy and HST
imaging from the ACS Virgo Cluster Survey (
Cˆ
ot´
e et al.
2004
). Additional UCDs were later found in both
imag-ing and/or spectroscopic programs (e.g.,
Jones et al.
2006
;
Chilingarian & Mamon 2008
;
Brodie et al. 2011
;
Strader et al. 2013
;
Liu et al. 2015a
,
b
;
Sandoval et al.
2015
;
Zhang et al. 2015
;
Ko et al. 2017
). These studies
have tended to focus on UCDs associated with M87 or a
few other of the brightest galaxies in Virgo. Currently,
the largest UCD sample in this cluster contains ∼150
ob-jects, spread over the M87, M49 and M60 regions (
Liu
et al. 2015a
).
Given its enormous extent on the sky, a wide-field
imaging survey is essential for building a homogeneous
and complete sample of Virgo UCDs. The Next
Genera-tion Virgo cluster Survey (NGVS;
Ferrarese et al. 2012
)
is a deep, multi-band (u
∗
griz) imaging campaign of the
Virgo cluster carried out with the MegaCam instrument
on the Canada France Hawaii Telescope (CFHT). The
survey covers an area of 104 deg
2
and is typified by
ex-cellent image quality, with a median FWHM of 0.54
00
in the i-band (see their Figure 8). In principle, we can
use these NGVS images to measure half-light radii for
all compact Virgo objects brighter than g ∼ 21.5 mag
and larger than r
h
∼ 10 pc (see
Liu et al. 2015a
),
po-tentially producing the largest and the most complete
sample of UCDs in any environment. The analysis
pre-sented here builds on previous NGVS papers that have
focused on the photometric and kinematic properties of
UCDs (e.g.,
Liu et al. 2015a
,
b
;
Zhang et al. 2015
). It also
complements other papers in the NGVS series dealing
with other stellar systems in Virgo, including globular
clusters (i.e.,
Durrell et al. 2014
;
Powalka et al. 2016a
;
Longobardi et al. 2018
), galaxies (
Gu´
erou et al. 2015
;
S´
anchez-Janssen et al. 2016
;
Ferrarese et al. 2016
;
Roedi-ger et al. 2017
;
Ferrarese et al. 2020
), and their nuclei
(i.e.,
Spengler et al. 2017
;
S´
anchez-Janssen et al. 2019
).
This paper is structured as follows. In §
2
we provide
an overview of the NGVS and the data products used
in our analysis, while §
3
describes the methodology we
have used to identify UCD candidates. In §
4
we present
our results, including a new catalog of UCD candidates,
and draw attention to a number of particularly
interest-ing sub-samples therein. We discuss these findinterest-ings in §
5
,
and in §
6
, summarize our conclusions and outline
direc-tions for future work. Throughout this study, we adopt
a common distance to all UCDs (16.5 Mpc
Mei et al.
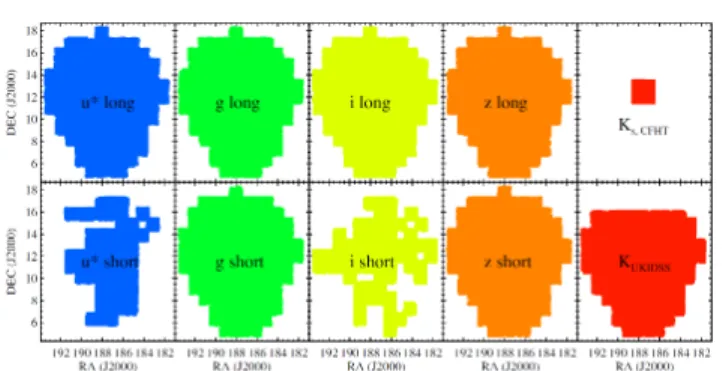
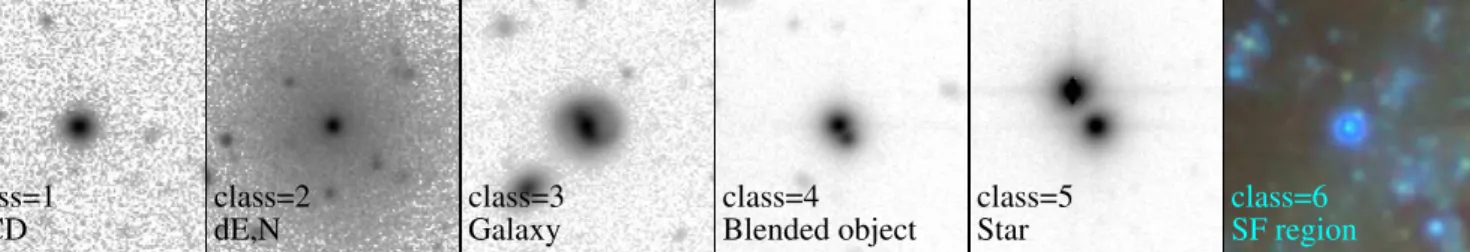
Figure 1.
The areal coverage of our optical and
near-infrared imaging, organized by exposure length (top: long,
bottom: short). The NGVS achieved 100% completeness for
the long exposures in the u
∗giz bands and in the gz bands for
the short exposures; short exposures in the u
∗i bands were
only partially completed. The NGVS-IR (K
s-band,
Mu˜
noz
et al. 2014
) imaging only covers the center of sub-cluster A,
while the UKIDSS (K-band,
Lawrence et al. 2007
) data cover
most of the NGVS footprint.
2007
;
Blakeslee et al. 2009
), corresponding to a distance
modulus of (m-M ) = 31.09 and physical scale of 80 pc
arcsec
−1
.
2.
DATA
2.1. Overview
The primary source of data used in this study is the
NGVS. The survey footprint covers the two main
sub-clusters of Virgo (A and B, centered on M87 and M49,
respectively) out to their virial radii (i.e., R
200
= 5.
◦
38
for Virgo A and 3.
◦
33 for Virgo B). As described in
Mu˜
noz et al.
(
2014
) and
Liu et al.
(
2015a
), the NGVS
is an ideal resource for the study of compact stellar
sys-tems, e.g., GCs, UCDs and dwarf nuclei. The NGVS
imaging consists of short and long exposures, where the
former can be used to find UCDs brighter than g ∼ 18.5
mag. Such objects are interesting given that they
de-fine the extreme of UCD formation (and, in some cases,
even host supermassive black holes;
Seth et al. 2014
,
Ahn et al. 2018
).
Figure
1
shows the final observing status of the NGVS,
organized by exposure length. We have excluded the
r-band since those observations had to be partially
sac-rificed due to CFHT’s dome shutter failure in 2012A.
For the long exposures, the survey is fully complete in
the remaining bands, while only partial areal coverage
was achieved for the short exposures in the u
∗
(∼ 50%
completeness) and i (∼ 57% completeness) bands.
Near-infrared imaging has proved to be a powerful
tool for UCD selection (
Mu˜
noz et al. 2014
;
Liu et al.
2015a
). As shown in the upper right corner of Figure
1
,
we have deep K
s
-band images in the central 4 deg
2
of
Liu et al.
Figure 2. Summary of the spatial dependence of the
multi-wavelength photometry used to select UCDs, divided by
ex-posure length (left: long exex-posure catalog, right: short
expo-sure catalog).
have previously used to select a high-purity UCD sample
around M87 (
Liu et al. 2015a
). Alternatively, as shown
in the bottom-right panel of Figure
1
, K-band
imag-ing from UKIDSS (
Lawrence et al. 2007
) covers a large
fraction of the NGVS footprint. About ∼ 70% of the
bright objects [g
0
< 21.5 mag, where g
0
is the
aperture-corrected magnitude measured within a 16-pixel
diame-ter (∼ 3
00
) and corrected for Galactic extinction] in the
NGVS have counterparts in the UKIDSS K-band. Thus,
although UKIDSS is much shallower than the NGVS-IR
(5σ limiting magnitude ∼18.4 and ∼24.4 mag,
respec-tively), it is nonetheless useful for separating UCDs from
background galaxies among the bright objects.
We summarize the combinations of imaging data at
hand, separated by exposure length, in Figure
2
. For
the case of the long exposures (left panel), the footprint
is simply divided into two areas depending on the
avail-ability of UKIDSS K-band imaging. The short
expo-sure map (right panel) is much more complicated owing
to the incompleteness in the associated u
∗
and i band
imaging.
Full details on the reduction of NGVS images can be
found in
Ferrarese et al.
(
2012
). To generate a
homo-geneous catalog of compact objects, we run SExtractor
(
Bertin & Arnouts 1996
) in double-image mode. We
de-tect objects in the g-band and then measure a set of
pa-rameters, including aperture magnitudes, in the u
∗
giz
bands. In this study, we measure the luminosity and
color of all detected objects with aperture magnitudes.
To minimize systematics, we apply aperture corrections
that account for PSF variations within, and between,
fields. Specifically, we use corrected 3.0
00
-diameter
aper-ture magnitudes to represent total magnitudes and
cor-rected 1.5
00
-diameter aperture magnitudes to estimate
colors.
For the catalog generation and magnitude correction,
we follow the method of
Liu et al.
(
2015a
), with one
ex-ception.
Liu et al.
(
2015a
) subtracted models of the
dif-fuse light from nearby massive galaxies (M87, M49, and
M60), whereas this is avoided in the current analysis to
have a homogeneous catalog. We generate independent
catalogs based on the short and long exposure images
and then merge them into one afterwards. We adopt
measurements from the short exposure catalog for those
objects which are saturated in the long exposures;
oth-erwise measurements are taken from the long exposure
catalog.
In addition to the imaging that forms the basis of
this study, there are many past spectroscopic programs
targetting the Virgo cluster that we can draw upon.
Ferrarese et al.
(
2012
) summarized the relevant
pro-grams for Virgo compact stellar systems (i.e., GCs,
UCDs and dE,Ns) as of 2012; these include radial
veloc-ity measurements from various MMT/Hectospec,
Mag-ellan/IMACS, VLT/VIMOS and AAT/AAOmega
pro-grams (see the paper for details). Since then, a number
of NGVS-motivated spectroscopic programs have been
undertaken (see, e.g.,
Zhang et al. 2015
,
2018
;
Toloba
et al. 2016
;
Spengler et al. 2017
;
Longobardi et al. 2018
).
We have collected radial velocities from these and other
previous works (
Binggeli et al. 1985
;
Hanes et al. 2001
;
Cˆ
ot´
e et al. 2003
;
Brinchmann et al. 2008
;
Strader et al.
2011
,
2012
;
Pota et al. 2013
;
Blom et al. 2014
;
Norris
et al. 2014
;
Li et al. 2015
;
Pota et al. 2015
;
Forbes et al.
2017
;
Ko et al. 2017
;
Toloba et al. 2018
), as well as from
the NASA/IPAC Extragalactic Database (NED)
1
, the
SIMBAD Astronomical Database
2
(
Wenger et al. 2000
)
and the Sloan Digital Sky Survey (SDSS,
Abolfathi et al.
2018
). In all, we have a total of 31,346 velocity
measure-ments for objects in the NGVS footprint brighter than
g
0
= 21.5 mag. This database includes foreground stars,
GCs, UCDs, galaxies in Virgo, and background
galax-ies. In what follows, we make use of this large velocity
catalog to eliminate contaminants from our photometric
UCD selection, as well as to recover UCDs that miss our
cuts.
2.2. Size Measurements
Size is the defining parameter of UCDs
3
. As shown
by
Liu et al.
(
2015a
), the excellent image quality of the
NGVS allows us to measure reliable sizes for compact
objects in Virgo (mainly GCs, UCDs, and galactic
nu-clei) larger than ∼10 pc (see their Section 2.3).
We
measure half-light radii using the KINGPHOT package
1
https://ned.ipac.caltech.edu/
2http://simbad.u-strasbg.fr/simbad/
3
Unless stated otherwise, we use the term “size” to refer to an
NGVS XXXIV. Ultra-Compact Dwarfs in the Virgo Cluster
10
20
30
40
r
h
(pc) (r
fit
=7 pixels, Liu et al. 2015)
10
20
30
40
r
h
(pc) (r
fit
=15 pixels)
M87 UCDs
M49 UCDs
M60 UCDs
10
20
30
40
r
h
(pc, previous studies)
10
20
30
40
r
h
(pc, this study)
Hasegan et al. 2005, ACSVCS, KingPhot
Ko et al. 2017, NGVS, ISHAPE
Figure 3. Left panel: Comparison of r
hmeasurements for UCDs based on different fitting radii, r
fit(7 vs 15 pixels), with
data taken from
Liu et al.
(
2015a
). Right panel: Comparison of r
hmeasured using different data (blue circles, ACSVCS data,
Ha¸segan et al. 2005
) or different methods (orange squares, ISHAPE software,
Ko et al. 2017
).
(
Jord´
an et al. 2005
), focusing on the g and i bands
be-cause of the former’s depth and the latter’s exquisite
seeing. Comparisons of the two sets of r
h
measurements
show that they are consistent with each other (see
Fig-ure 3 in
Liu et al. 2015a
).
Jord´
an et al.
(
2005
) show that
KINGPHOT r
h
measurements are biased to larger
val-ues when r
h
& r
fit
/2 (where r
fit
is fitting radius within
which we adopt KINGPHOT), which is ∼50 pc for an
r
fit
= 7 pixels (used in
Liu et al. 2015a
) at the distance
of Virgo. This choice of r
fit
is reasonable since
previ-ous works shows that most UCDs are smaller than 40
pc (
Brodie et al. 2011
;
Chiboucas et al. 2011
;
Strader
et al. 2011
;
Penny et al. 2012
). However, in the interests
of determining whether there are larger UCDs in Virgo,
we run KINGPHOT with r
fit
= 15 pixels in this study.
Thus, our KINGPHOT measurements would be biased
for objects with r
h
& 110 pc.
The left panel of Figure
3
compares our UCD r
h
mea-surements from
Liu et al.
(
2015a
) for the two values of
r
fit
above. We note that the larger r
fit
yields slightly
larger sizes when r
h
. 16 pc. Otherwise, the two sets
of r
h
measurements are statistically equivalent, so we
therefore adopt the KINGPHOT measurements made
with r
fit
= 15 pixels.
The right panel of this figure
shows a comparison between the r
h
measurements from
this work and those from previous studies. The blue
circles are taken from
Ha¸segan et al.
(
2005
), who
mea-sured r
h
using KINGPHOT and HST data (ACSVCS,
Cˆ
ot´
e et al. 2004
). The orange squares denote the r
h
measurements from
Ko et al.
(
2017
), who used ISHAPE
software and NGVS data. From this figure, we can see
that our r
h
measurements are consistent with the
mea-surements from previous studies, even though they used
different methodologies and/or data sets.
3.
UCD SELECTION
We
select
UCD
candidates
within
the
multi-dimensional parameter space of magnitude, ellipticity
(e ≡ 1 − b/a), color, surface brightness, and half-light
radius, which we now describe and justify
4
. We begin
by adopting simple magnitude cuts of 14.0 < g
0
< 21.5
mag, where the lower bound corresponds to the
satura-tion limit of our g-band short exposures and the upper
bound to the limit of accurate measurements of
half-light radii (see §2 in
Liu et al. 2015a
for details). We
also apply a simple cut on ellipticity, adhering to the
empirical result that most spectroscopically-confirmed
UCDs in Virgo (i.e., v
r
< 3500 km/s) have e < 0.3 (see,
e.g.,
Zhang et al. 2015
).
As we have previously shown (
Mu˜
noz et al. 2014
;
Liu
et al. 2015a
;
Powalka et al. 2016a
,
b
), the combination
of u
∗
giK
s
photometry proves to be a highly effective
tool for discriminating extragalactic GCs and UCDs
from background galaxies and foreground stars.
Un-4
It is worth bearing in mind that UCD selection criteria are often
driven as much by observational details, such as limiting
magni-tudes and angular resolution, as by considerations of formation
physics.
Liu et al.
10
15
20
25
〈µ
g
〉
e
(mag/arcsec
2
)
0.4
0.6
0.8
1.0
1.2
1.4
(g−z)
0
0
1000
2000
3000
4000
Radial Velocity (km/s)
0.0
0.1
0.2
0.3
Frac
v<0
0<v<3500
v>3500
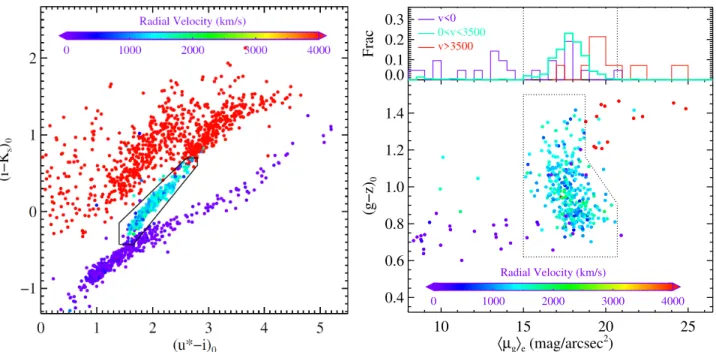
Figure 4. Left panel: The u
∗iK
scolor-color diagram. The solid polygon represents our GC+UCD selection box in this plane.
The points are colored by their associated radial velocity measurements, reflected in the color bar at top. Right panel: The
distribution of mean surface brightness, hµ
gi
e, (in broad bins of radial velocity; top) and (g − z)
0color as a function of hµ
gi
efor the objects lying within our selection region on the left. The dotted polygon shows the next layer of our selection, based on
surface brightness, and the points are colored by their associated radial velocities.
fortunately, Figure
1
shows that we only have K
s
-band
imaging for the central 4 deg
2
of sub-cluster A from the
NGVS-IR (see
Mu˜
noz et al. 2014
for details). Moreover,
in the u
∗
and i bands, only partial coverage is available
in the short exposure category. In an attempt to
bal-ance homogeneity and accuracy, we base the color
por-tion of our UCD selecpor-tion on our u
∗
, g, i, z and UKIDSS
K-band photometry. The UKIDSS data, although
shal-lower than that from NGVS-IR, is sufficient for our
pur-pose, i.e. to select UCD candidates with g
0
< 21.5 mag.
We will describe our u
∗
giK
s
- and u
∗
gizK-based
selec-tions and compare their results in the following two
sub-sections.
3.1. u
∗
giK
s
-Based Selection
In the left panel of Figure
4
, we show the cuts
em-ployed as part of our u
∗
giK
s
-based selection. There,
we plot in the (u
∗
− i) vs. (i − K
s
) plane, the ∼2000
objects from our spectroscopic catalog that satisfy our
magnitude and ellipticity cuts. The points have been
colored by their measured radial velocities and can be
di-vided into three main groups: background galaxies (red
dots; v & 3500 km/s), Virgo members (green and cyan
dots; 0 . v . 3500 km/s), and foreground stars (blue
and purple dots; v . 0 km/s)
5
. It is clear that Virgo
members can be readily distinguished from background
galaxies and foreground stars in the u
∗
iK
s
color-color
diagram. To isolate Virgo members, we therefore adopt
the following color cuts:
1.400 ≤ (u
∗
− i)
0
≤ 2.800;
− 0.427 ≤ (i − K
s
)
0
≤ 0.700;
(i − K
s
)
0
≤ −1.127 + 0.700 × (u
∗
− i)
0
;
(i − K
s
)
0
≥ −1.917 + 0.900 × (u
∗
− i)
0
.
(1)
which are indicated by the irregular polygon in the
fig-ure.
The right-hand panel of Figure
4
shows the (g − z)
0
color as a function of mean effective surface brightness,
hµ
g
i
e
, which is the average surface brightness measured
within the half-light radius. The points show those
ob-jects that passed our color cuts in the u
∗
iK
s
diagram
and, again, are colored according to their radial
ve-locities. It is clear from the distribution that we can
use surface brightness to further improve the purity of
our Virgo sample by removing background galaxies and
some foreground stars. The dotted polygon shows the
5
Note that this very basic redshift classification is not strictly
cor-rect; some Virgo members do indeed have negative radial
veloci-ties, such as objects belonging to the M86 group (see, e.g.,
Boselli
et al. 2018
;
Park et al. 2012
) and many stars have positive radial
velocities (
Katz et al. 2019
).
NGVS XXXIV. Ultra-Compact Dwarfs in the Virgo Cluster
exact cuts in surface brightness that we adopt, which
are described by the following functions:
0.620 ≤ (g − z)
0
≤ 1.500;
hµ
g
i
e
≥ 15.000 mag/arcsec
2
;
hµ
g
i
e
≤ 18.750 mag/arcsec
2
,
when 1.163 ≤ (g − z)
0
≤ 1.500;
hµ
g
i
e
≤ 27.692 − 7.692 × (g − z)
0
,
when 0.909 ≤ (g − z)
0
≤ 1.163;
hµ
g
i
e
≤ 20.700 mag/arcsec
2
,
when 0.620 ≤ (g − z)
0
≤ 0.909.
(2)
The combination of the cuts applied to this point
leaves us with a broad sample of Virgo members that
includes compact elliptical galaxies, galactic nuclei (in
low-mass galaxies), UCDs, and GCs.
To isolate the
UCDs within this sample, we apply one final set of cuts
based on our measured half-light radii, which are:
11 < hr
h
i < 100 pc;
|r
h,g
− r
h,i
|
hr
h
i
≤ 0.5;
r
h,g,error
r
h,g
≤ 15%;
r
h,i,error
r
h,i
≤ 15%.
(3)
where hr
h
i represents the weighted mean of the
half-light radii measured in the g and i bands. These cuts
mimic ones often used in previous studies to separate
UCDs and GCs (e.g.,
Brodie et al. 2011
;
Strader et al.
2011
;
Penny et al. 2012
). Though arbitrary, this is not
an unreasonable choice since the typical size of either
MW or extragalactic GCs is ∼3 pc and most GCs are
smaller than ∼ 10 pc (e.g.,
van den Bergh et al. 1991
;
Jord´
an et al. 2005
). Furthermore,
Liu et al.
(
2015a
) have
shown that r
h
measurements based on NGVS imaging
are reliable for bright objects (g
0
< 21.5 mag) larger
than r
h
∼ 10 pc (see §2.3 of their paper). The lower
limit on hr
h
i used in this study roughly matches the
limiting resolution of NGVS imaging.
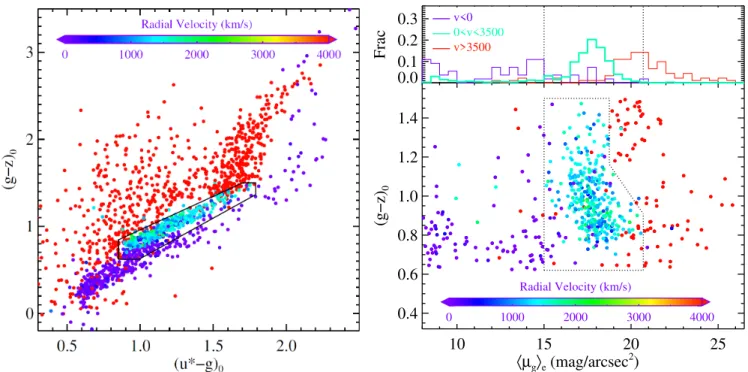
3.2. u
∗
giz- and u
∗
gizK-Based Selection
Given the lack of deep K
s
-band imaging over most
of the NGVS footprint, we have developed an
alterna-tive strategy for selecting UCDs based on the u
∗
, g, i,
z and (where available) K bands. As seen in Figure
1
,
the NGVS imaging is not fully complete in the u
∗
and
i bands for the short exposures. As argued in
Mu˜
noz
et al.
(
2014
), the u
∗
band is essential when selecting
UCDs due to its sensitivity to young/hot stellar
pop-ulations, which allows for the removal of background
star-forming galaixes. The left panel of Figure
5
shows
the u
∗
gz color-color diagram for the same spectroscopic
sample (following the same color-coding) as in Figure
4
.
In this case, we can see that the spaces occupied by
back-ground galaxies, Virgo members, and foreback-ground stars
more heavily overlap with each other. Nevertheless, the
Virgo members still form a relatively tight sequence in
this plane, such that we can select a sample of these
objects with high completeness, albeit with more
con-tamination. We adopt a color selection (represented by
the polygon) within this diagram of the form:
0.850 ≤ (u
∗
− g)
0
≤ 1.790;
0.620 ≤ (g − z)
0
≤ 1.500;
(g − z)
0
≤ 0.190 + 0.770 × (u
∗
− g)
0
;
(g − z)
0
≥ −0.300 + 0.930 × (u
∗
− g)
0
.
(4)
The objects that satisfy these cuts are plotted in the
plane of color versus surface brightness in the right-hand
panel of Figure
5
. Although many contaminants pass
our color-color cuts, it is possible to eliminate most of
these following the same cuts on surface brightness that
we applied to our u
∗
giK
s
sample (Equation
2
; dotted
polygon in this panel). These cuts are not as effective
as before, however, and leave behind a number of
back-ground galaxies (red dots). Fortunately, we can remove
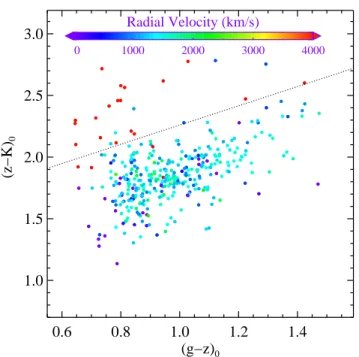
most of these residual contaminants wherever we have
K-band data. Figure
6
shows the gzK color-color
di-agram for those objects from our spectroscopic catalog
that satisfy our u
∗
gz and surface brightness cuts. For
a given (g − z)
0
color, background galaxies tend to be
redder in (z − K)
0
than Virgo members, and we use the
following relationship to isolate the latter:
(z − K)
0
≤ 1.480 + 0.780 × (g − z)
0
.
(5)
After this, we apply the same size cuts as before
(Equa-tion
3
) to arrive at our sample of UCD candidates.
3.3. Comparing our Selection Methods
In this section, we compare the UCD catalogs derived
from the two selection methods described above. For
this comparison, the best region within the NGVS
foot-print is the center of sub-cluster A, where we have u
∗
, g,
i, z, K
s
(NGVS-IR), and K (UKIDSS) band fluxes and
radial velocities for ∼2000 objects. Among this sample,
71 are spectroscopically-confirmed UCDs that were
al-ready known from previous work (mainly
Strader et al.
2011
and
Zhang et al. 2015
).
As described in §
3.1
, we divide these objects into three
groups according to their radial velocities: background
galaxies (v > 3500 km/s), Virgo members (0 < v < 3500
Liu et al.
10
15
20
25
〈µ
g
〉
e
(mag/arcsec
2
)
0.4
0.6
0.8
1.0
1.2
1.4
(g−z)
0
0
1000
2000
3000
4000
Radial Velocity (km/s)
0.0
0.1
0.2
0.3
Frac
v<0
0<v<3500
v>3500
Figure 5. As in Figure
4
but based on the u
∗gz color-color diagram instead.
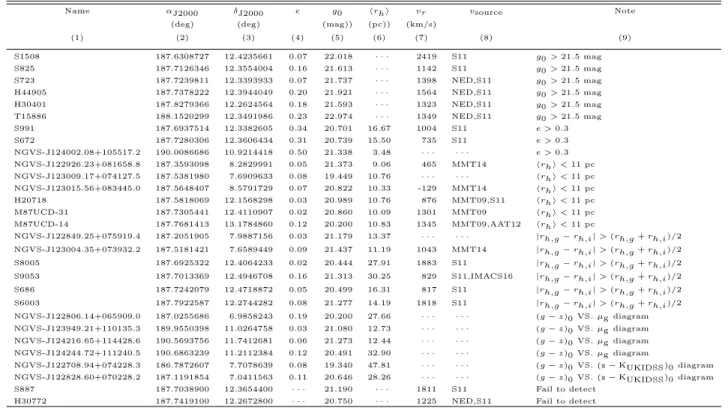
Table 1. Application of our Photometric UCD Selection Methods (u
∗giK
s, u
∗giz, u
∗gizK) to a Spectroscopic Training Set.
u
∗giK
su
∗giz
u
∗gizK
velocity
v < 0
0 < v < 3500
v > 3500
v < 0
0 < v < 3500
v > 3500
v < 0
0 < v < 3500
v > 3500
Obj. Type
Stars
UCDs
dE,Ns
BGs
Stars
UCDs
dE,Ns
BGs
Stars
UCDs
dE,Ns
BGs
g
0< 21.5 & e < 0.3
183
71
17
841
183
71
17
841
183
71
17
841
Color-Color Diagram
21
71
9
14
55
69
10
91
55
69
10
91
hµ
gi
e8
69
6
1
10
68
7
17
10
68
7
17
hr
hi
2
67
4
0
2
66
5
14
2
66
5
14
gzK
· · ·
· · ·
· · ·
· · ·
· · ·
· · ·
· · ·
· · ·
2
a66
b5
c1
a These two “stars” lie in the NGVS-1+1 field, where many Virgo members have negative radial velocities. We consider these two objects
as UCDs, in which case all three of our selection methods successfully cull the stars from our training set.
b Two of these objects are included in our final UCD catalog, while the remaining three have half-light radii of 0.0, 10.1 and 10.8 pc.
c These 5 objects are included in the Virgo Cluster Catalogue (VCC;
Binggeli et al. 1985
).
the “Virgo” group, we only consider two sub-classes
of objects: UCDs and galaxies classified in previous
or contemporaneous studies as nucleated dwarf
ellip-tical galaxies, which have identifiable point sources at
their centers (
Binggeli et al. 1985
;
S´
anchez-Janssen et al.
2019
;
Ferrarese et al. 2020
).
Diffuse, non-nucleated
dwarfs are explicitly excluded in our selection pipeline.
As listed in Table
1
, we have 183 stars, 71 UCDs, 17
dE,Ns, and 841 background galaxies (BGs) which satisfy
our magnitude and ellipticity criteria (i.e., 14.0 < g
0
<
21.5 mag and e < 0.3). Following this, we successively
apply our color, surface brightness, and size cuts, with
the choice of colors being the only variable. Table
1
presents the number of objects from each group that
survive each step of our selection functions.
For the u
∗
giK
s
-based selection, the color and surface
brightness cuts are quite effective at eliminating most of
the contaminants. In the end, we find 2 stars (∼ 1%),
67 UCDs (∼ 94%), 4 dE,Ns (∼ 24%) and zero BGs
sat-isfying all of the criteria
6
. For comparison, we find that
2 stars (∼ 1%), 66 UCDs (∼ 93%), 5 dE,N’s (∼ 29%)
6