HAL Id: hal-01417924
https://hal.univ-lorraine.fr/hal-01417924
Submitted on 29 Aug 2019HAL is a multi-disciplinary open access
archive for the deposit and dissemination of sci-entific research documents, whether they are pub-lished or not. The documents may come from teaching and research institutions in France or abroad, or from public or private research centers.
L’archive ouverte pluridisciplinaire HAL, est destinée au dépôt et à la diffusion de documents scientifiques de niveau recherche, publiés ou non, émanant des établissements d’enseignement et de recherche français ou étrangers, des laboratoires publics ou privés.
Dynamics of PAHs and derived organic compounds in a
soil-plant mesocosm spiked with 13C-phenanthrene
Johanne Cennerazzo, Alexis de Junet, Jean-Nicolas Audinot, Corinne Leyval
To cite this version:
Johanne Cennerazzo, Alexis de Junet, Jean-Nicolas Audinot, Corinne Leyval. Dynamics of PAHs and derived organic compounds in a soil-plant mesocosm spiked with 13C-phenanthrene. Chemosphere, Elsevier, 2016, 168, pp.1619-1627. �10.1016/j.chemosphere.2016.11.145�. �hal-01417924�
Dynamics of PAHs and derived organic compounds in a soil-plant
1
mesocosm spiked with
13C-phenanthrene.
2 3
Johanne Cennerazzoa,b, Alexis de Juneta,b, Jean-Nicolas Audinotc, Corinne Leyvala,b
4 5
aUniversité de Lorraine, Laboratoire Interdisciplinaire des Environnements Continentaux, UMR 7360,
6
Vandœuvre-lès-Nancy, F-54506, France
7
bCNRS, Laboratoire Interdisciplinaire des Environnements Continentaux, UMR 7360, Vandœuvre-lès-Nancy,
F-8
54506, France
9
cAdvanced Instrumentation for Ion Nano-Analytics,Materials Research and Technology Department,
10
Luxembourg Institute of Science and Technology, 41 rue du Brill , L-4422, Luxembourg
11 12 13
Abstract
14
Polycyclic Aromatic Hydrocarbons (PAHs) are ubiquitous and persistent soil pollutants. 15
Their fate and the influence of the plant rhizosphere on their dynamics has been extensively 16
studied, but studies mainly focused on their dissipation rate. We conducted a plant-soil 17
mesocosm experiment to study the fate and distribution of PAHs or derived compounds in the 18
extractable fraction, the residual soil, the shoot biomass and the root biomass. The experiment 19
was conducted for 21 days using ryegrass and a forest soil spiked with 13C-labeled phenanthrene
20
(PHE), using combined IRMS and NanoSIMS for analyses. Almost 90% of the initial 21
extractable PHE content was dissipated within 3 weeks, but no rhizospheric effect was 22
highlighted on PHE dissipation. More than 40% of 13C-PHE was still in the soil at the end of
23
the experiment, but not as PHE or PAH-derived compounds. Therefore it was under the form 24
of new compounds (metabolites) and/or had been incorporated into the microbial biomass. 25
About 0.36% of the initial 13C-PHE was recovered in the root and shoot tissues, representing
26
similar 13C enrichment (E13C) as in the soil (E13C ≈ 0.04 at.%). Using NanoSIMS, 13C was also
27
localized at the microscale in the roots and their close environment. Global 13C enrichment
28
confirmed the results obtained by IRMS. Some hotspots of 13C enrichment were found, with a
29
high 32S/12C14N ratio. Comparing the ratios, sizes and shapes of these hotspots suggested that
30
they could be bacteria. 31
32
Keywords: Polycyclic Aromatic Hydrocarbons; 13C-Phenanthrene; soil; rhizosphere; IRMS;
33 NanoSIMS 34 35 Highlights: 36
Ø A mesocosm experiment with 13C-PHE-spiked soil was analyzed by IRMS and
37
NanoSIMS 38
Ø 40% of 13C-PHE was still in the soil after 21 days but not as the parent compound
39
Ø Bacterium-like 13C-enriched hotspots were revealed by NanoSIMS close to the roots
40 41
1. Introduction
42
Polycyclic Aromatic Hydrocarbons (PAHs) are ubiquitous and persistent organic 43
compounds found in the soils of large brownfield areas in many former industrial regions. They 44
are composed of two or more benzene rings and result from the incomplete combustion by 45
pyrolysis of organic materials from natural or anthropogenic sources (Edwards, 1983). They 46
are persistent in soils due to their low water solubility and high adsorption on soil constituents 47
(Wilson and Jones, 1993). They are harmful to human and environmental health, and 16 of 48
them are listed as priority pollutants by the USEPA (Hartmann, 1996). 49
Many studies have addressed the fate and dynamics of PAHs in soils, where they can 50
undergo numerous processes such as plant uptake, stabilization by sorption on organic and 51
mineral phases, or transformation and degradation until total mineralization. Sorption and 52
degradation are key processes in the fate of PAHs in the environment (Magee et al., 1991). The 53
persistence of organic pollutants in soils has been attributed to sequestration mechanisms 54
including intra-organic matter and intra-particle diffusion of the parent compound and 55
transformation products (Doick et al., 2005). Plants seem to have a limited direct impact on 56
PAH dynamics in polluted soils (Fang et al., 2001; Günther et al., 1996; Rezek et al., 2008). 57
Gao and Zhu (2004) showed that uptake of phenanthrene and pyrene by plants accounted for 58
less than 0.01 and 0.23% of enhanced loss in vegetated versus non-vegetated soils. The low 59
water solubility of PAHs could prevent significant uptake by plant tissues (Binet et al., 2000; 60
Kipopoulou et al., 1999) and root-to-shoot translocation (Burken and Schnoor, 1998). However, 61
the indirect role of plants in PAH dynamics through their root systems is largely documented 62
(Rezek et al., 2008; Miya and Firestone, 2000; Liste and Alexander, 2000). The plant 63
rhizosphere is a favorable environment for high microbial diversity and activity, which permit 64
higher PAH dissipation in soils (Corgié et al., 2003; Anderson et al., 1993; Schwab, 1994; 65
Reilley et al. 1996). The main mechanisms involved in PAH dissipation in the soil and the 66
rhizosphere are biodegradation and biotransformation by an active microflora (Binet et al., 67
2000; Wilson and Jones 1993; Cerniglia, 1997). The soil heterotrophic microflora may use 68
organic pollutants as a source of carbon (C) and energy to grow, or for co-metabolism (Hwang 69
and Cutright, 2002). The C derived from PAHs (C-PAH) could be (i) incorporated into the 70
microbial biomass (Kästner et al., 1999), and/or (ii) transformed into other organic compounds 71
and thus form part of non-extractable PAHs (Richnow et al., 1998 and 1999). The newly formed 72
organic products could be more reactive than the parent compounds and therefore bind with 73
soil components more easily, but could also be more toxic (Sabaté et al., 2006). Cébron et al. 74
(2011) showed that 38% of the 13C from labeled PAH added into soil mesocosms was not
75
extractable after 12 days. C-PAH was still present but probably not under the form of parent 76
PAHs or extractable compounds. Some of these newly formed organic compounds may be more 77
soluble and more mobile than parent PAHs (Sabaté et al., 2006). However, most of the studies 78
led so far only considered the dissipation of PAHs in the soil and in the plant rhizosphere. Some 79
studies focused on the residual and newly formed organic compounds, especially on the 80
distribution and the dynamics of C-PAH in the soil (Doick et al., 2005; Eschenbach et al., 1998; 81
Kästner et al., 1999; Macleod and Semple, 2003; Northcott and Jones, 2001; Richnow et al., 82
1998), but no in soil-plant-microflora compartments. 83
An effective and relevant way to trace carbon compounds in soil-plant ecosystems is to 84
use 13C isotopic labeling. For example, Richnow et al. (2000, 1998) used [1-13C]-PAH to trace
85
the transformation of phenanthrene in a soil reactor. But it appears more relevant to monitor C-86
PAH using a molecule labeled on all its carbon atoms (Cébron et al., 2011). Another 87
complementary method to trace a labeled organic compound in soils, plants or bacteria is to 88
map isotopic distribution at a microscale through NanoSIMS analyses (high-resolution imaging 89
Secondary Ion Mass Spectrometry) (Hoppe et al., 2013). NanoSIMS analyses can map all the 90
elements (isotopes) of the periodic table with an ultimate lateral resolution (probe size) in the 91
50 to 150 nm range, high sensivity (a few ppm), and high mass resolution (Herrmann et al., 92
2007; Moore et al., 2012; Remusat et al., 2012; Vidal et al., 2016). 93
The objective of our study was to investigate the fate of C-PAH in planted and non-planted 94
soil by assessing (i) the distribution of C-PAH in the extractable fraction, the residual soil, the 95
shoot biomass and the root biomass, and (ii) the localization of C-PAH in different 96
compartments of the soil-plant system. We conducted a mesocosm trial using ryegrass, 13
C-97
phenanthrene (13C-labeled on all its carbon atoms) soil spiking, and coupling isotopic analyses
98
with NanoSIMS analyses. 99
2.
Materials & methods100
2.1. Soil-plant mesocosms 101
Planted and non-planted mesocosms were set up, with soil spiked with either unlabeled 102
12C-PHE (control) or labeled 13C-PHE. The soil was a Calcisol, sampled at 5-35 cm depth in a
103
temperate beech forest close to a former coking plant (49°14.163’N, 6°0.116’E, Homecourt, 104
Lorraine region, France). The soil horizon had a pHwater of 7.3; it contained 48% clay, 44% silt,
105
7% sand, had organic carbon and total nitrogen contents of 23.0 and 1.62 g kg-1 respectively,
106
and a low PAH content (13.4 mg kg-1). The soil sample was air-dried, ground and sieved to 2
107
mm, and then spiked with 300 mg PHE kg-1 of soil. Spiking modalities were as follows: one
108
with unlabeled PHE (12C-PHE, Sigma Aldrich >97%) and two with known 13C-PHE/12C-PHE
109
mixtures (13C-PHE, Sigma-Aldrich Isotec Stables Isotopes, Miamisburg, Ohio, USA). The 13
C-110
PHE/12C-PHE ratio was 1:8 for organic carbon analyses and 1:1 for NanoSIMS analyses. A
111
PHE-hexane solution was added to 1:10 of the total soil mass for spiking. Hexane was 112
evaporated under a fumehood, and then the spiked soil was homogenized with the remaining 113
9:10 of soil mass. 114
The planted and non-planted mesocosms were conducted in 50-mL glass jars with 40 g 115
of PHE-spiked soil. They were inoculated with 10 mL of soil suspension from a PAH-116
contaminated soil (200 g L-1 in 0.85% NaCl) to ensure that a PAH-degrading microflora was
117
present. Five ryegrass (Lolium perenne) seeds were added in each planted mesocosm. The 118
experiment was conducted in a growth chamber under controlled conditions (22°C/18°C with 119
16h/8h day/night, 250 µmol photons m-2 s-1, 80% relative humidity) for 21 days. Four replicates
120
were prepared for each planted and non-planted modality and each sampling time (0, 7, 14 and 121
21 days), and for each 12C-PHE- and 13C-PHE/12C-PHE- (1:8 ratio) spiked soil, except for 1:1
122
13C-PHE/12C-PHE-spiked soil (one replicate, and sampling after 7 and 14 days for NanoSIMS
123
microprobe analyses). At each sampling time, ryegrass shoots and roots were removed from 124
the soil and separated. The roots were washed with distilled water and dried with filter paper. 125
The fresh plant material and soil were oven-dried at 35 °C and then ground, and the soil was 126
sieved to 200 µm prior to analyses. The roots were prepared directly after sampling for 127
elemental mapping analyses. 128
129
2.2. Organic and isotopic analyses 130
PHE was extracted from 2 g of dry soil using dichloromethane (DCM) and a high-131
pressure and high-temperature DIONEX® 200 ASE (Accelerated Solvent Extractor) automated
132
extractor. Residual soil (after PAH extraction) was kept for organic analyses. DCM was 133
evaporated from the PAH extracts under N2 flow and replaced by acetonitrile for PAH analysis.
134
PAH extracts were analyzed using a reverse-phase chromatography UHPLC Ultimate 3000 135
RSLC system (Dionex) equipped with a Diode Array Detector and a Zorbax Eclipse PAH 136
RRHD column (100 mm x 2.1 mm, 1.8 µm – Agilent). The mobile phase was a mixture of 137
water/acetonitrile in gradient mode, with a flow rate of 0.420 mL min-1. The wavelength used
138
for detection was 254 nm. 139
140
Isotopic and elemental analyses were performed on bulk and residual soil (before and 141
after PAH extraction, respectively), and on ryegrass shoot and root biomass using EA-142
GC/IRMS (Elementary analyzer – Isotope Ratio Mass Spectrometry 100, IsoPrime, 143
Manchester. EA: IsotopeCube, Elementar, Hanau). Approximately 1.0 mg of the powdered 144
material of each sample was weighed and placed in 6x4 mm tin capsules (Elemental 145
Microanalysis Limited, Devon, UK). Analyses were carried out at the Technical Platform of 146
Functional Ecology (OC 081) at the INRA Forest Ecology and Eco-Physiology Unit. Isotopic 147
measurements were reported in the delta notation ( expressed in ‰) as: 148
13C (‰) = (( ) − 1) × 1000 Eq. 1
149
Where Rsample = 13Csample ⁄12Csample for labeled and control samples, and RRef refers to the Vienna
150
Pee Dee Belemnite (VPDB) standard, with RRef = 13CPDB ⁄12CPDB = 0.0112375.
151
Enrichment in 13C (E13C), expressed as excess % of atoms (at.%), was calculated relatively to
152
the unlabeled control in the soil and in the plant, as follows: 153
E13C (at.%) = (13C
labeled − 13Ccontrol) Eq. 2
154
Where 13C
labeled (at.%) = [Rlabeled⁄(Rlabeled +1)] × 100, 13Ccontrol (at.%) = [Rcontrol ⁄(Rcontrol+1)] × 100.
155
E13C was calculated for bulk soil, residual soil, and ryegrass shoot biomass and root biomass.
156
Soil and plant 13C concentrations (13C
conc) were also calculated (expressed as µg C g-1 of soil and
157
µg C g-1 of plant, respectively):
158
) × Cx Eq. 3
159
Where Cx refers to the Ccontent, expressed in µg C g-1 of soil or plant. 13C distribution (%) in
160
the mesocosms was deduced from the 13C concentrations and by considering that the percentage
161
of 13C initially added in the soil after PHE-spiking was 100% (T0). 13C distribution (%) was
162
calculated for the PAH extracts, the residual soil and the plants. The remaining 13C was
163
considered as 13C loss.
164
2.3. Elemental mapping analyses in the roots 165
The fresh ryegrass roots harvested after 7 and 14 days were rapidly cut into 0.5-cm 166
pieces and placed on adhesive film. The fine roots were cryofixed using a LEICA EM CPC 167
Universal Cryoworkstation. They were frozen at atmospheric pressure (105 °C s-1), and
168
slammed on copper mirrors (Printz et al., 2016). Then the cryofixed samples were lyophilized 169
(LEICA EM CFD) without using any solvent (1°C h–1 for 8 days down to –20 °C at 1.10–4 Pa)
170
(Printz et al., 2016). The root samples were finally embedded in Epoxy resin and coated with 171
gold prior to analyses by nano Secondary Ion Mass Spectrometry. 172
Elemental mapping was performed using a Cameca NanoSIMS 50 ion probe 173
(Gennevilliers, France) in the raster-imaging mode. The probe detects the secondary ions 174
generated from each pulverized sample surface by an energetic incident ion beam (Hoppe et 175
al., 2013). Ion images were obtained using a beam of Cs+ primary ions with an energy impact
176
of 16 keV and a beam current of 0.8 pA on the sample. The images were recorded in 256x256 177
pixels; under these conditions, a lateral resolution of 80-100 nm was expected. Negative 178
secondary ion signals for 12C-, 13C-, 12C14N-, 32S- ions and 12C14N-, 56Fe16O- clusters (Behrens et
179
al., 2008) were collected simultaneously using the multicollection system. Images were 180
acquired with a counting time of 30 ms/pixel. Mass resolution (M/DM) was above 4500 (e.g. 2 181
916 was required to resolve mass interference between 13C and 12C1H), and mass calibration
182
was achieved using standard iron oxide references. The isotope ratio of the two 12C and 13C
183
carbon isotopes allowed us to localize and quantify the 13C-labeled PHE. The quantitative data
184
acquired by NanoSIMS were calculated with Winimage software that directly processes image 185
data (CAMECA file format) and measures the d0/
00 isotopic deviation according to the d0/00
186
formula (Eq. 1) for each pixel. The deviation of the 13C/12C ratio was calculated based on a fixed
187
Rref value (commonly 1.107%, the natural isotope ratio for 13C). The isotopic ratio of 13C
188
determined by NanoSIMS was not compare to IRMS values because of the presence of the 189
epoxy resin which prevent a specific 13C signal of organic matter (Vidal et al., 2016). The scale
190
of all the images of isotopic map deviation was kept constant (0 to 300) to allow for a quick 191
comparison of intensity levels. 192
Carbon-to-nitrogen (12C/12C14N) and sulfur-to-nitrogen (32S/12C14N) ratio data were extracted
193
from regions of interest (ROIs) by using the freeware package Image J. Each ROI was drawn 194
at least twice for each group in order to obtain a mean ratio for any given area. Linescan 195
(=segments of variable length drawn on the ion image) data were also extracted using 196
OpenMIMS plugging with ImageJ software. Preparation and SIMS analyses were carried out 197
with a Cameca NanoSIMS 50 at the Luxembourg Institute of Science and Technology (LIST) 198 in Esch-sur-Alzette, Luxembourg. 199 200 2.4. Statistical analyses 201
Statistical analyses were performed using R software (version 3.1.3, 2015). All tests were 202
used with a 95% significant level. Parametric conditions were checked with Shapiro-Wilk’s 203
test for normality and with Bartlett’s test for homogeneity of variance. When normality 204
conditions were not met, a non-parametric statistical test was used for multiple comparisons of 205
means. Two-way analysis of variance (ANOVA 2) followed by Tukey’s post hoc test was used 206
for the comparison of PHE and 13C concentrations between sampling times and between
207
treatments. For NanoSIMS analysis, the relative abundance levels of 13C from ROI were
208
compared with a non-parametric analysis of variance (Kruskal-Wallis test). 209
210
3.
Results211
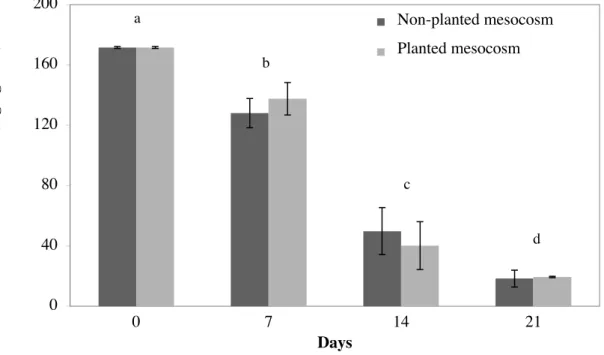
3.1. Phenanthrene concentrations in planted and non-planted mesocosms 212
The extractable PHE concentration immediately after soil spiking (T0) was 171.6 ± 0.7 213
mg kg-1 (Figure 1). After 7 days, PHE concentrations were 128.1 ± 9.7 and 137.6 ± 10.8 mg kg
-214
1 in the planted and non-planted mesocosms, respectively, indicating 20-25% PHE dissipation.
215
The main decrease in PHE concentration was noted after 14 days, with 49.8 ± 15.6 and 40.2 ± 216
15.9 mg kg-1 of PHE in the planted and non-planted mesocosms, respectively, i.e.
217
approximately 70% of PHE loss. Finally, after 21 days there remained less than 20 mg kg-1 of
218
PHE in each mesocosm. The PHE concentration decreased significantly over time: 90% of the 219
added PHE was dissipated after 21 days. No significant difference in PHE concentrations was 220
noted over time between the planted and non-planted mesocosms. 221
222
3.2. 13C-enrichment and distribution in the planted and non-planted mesocosms
223
13C-enrichment (E13C) values are summarized in Table 1 and Figure 2a. No significant
224
difference in E13C was noted between the planted and non-planted mesocosms. E13C of the bulk
225
soil decreased from 0.097 at.% at T0 down to 0.047 at.% after 21 days, while E13C of the
226
residual soil increased from 0.005 at.% to 0.044 at.% over the same time period. At the end of 227
the trial, there was no significant difference in 13C concentration between the bulk and residual
228
soils, indicating that 13C was mainly present in the residual soil under a non-extractable form
229
(Table 1). E13C in plant tissues was studied after 7 days. It reached 0.015 at.% and 0.017 at.%
230
in the roots and shoots, respectively. From 14 days, no significant difference was noted between 231
root and shoot E13C due to the high heterogeneity of values. After 21 days, E13C in residual soil
232
as well as in ryegrass shoots and roots was around 0.04 at.%. 233
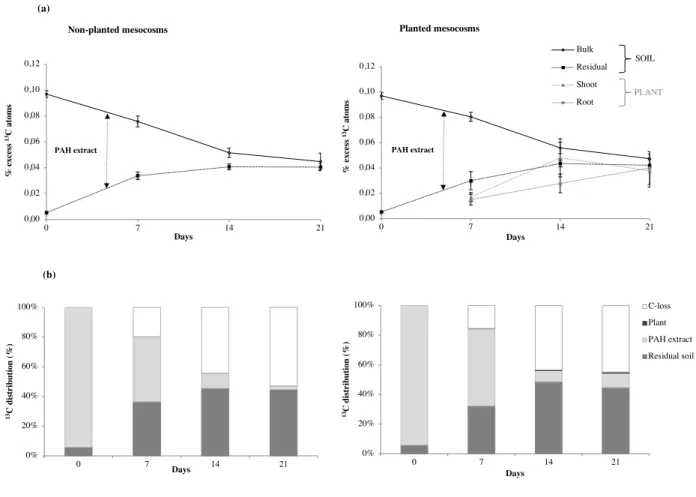
13C distribution was measured over time for the different compartments of the
234
mesocosms: residual soil, PAH extract, plant, and C loss (Figure 2b). At T0, 94% of the total 235
13C content was recovered in the PAH extract, and 6% in the residual soil. The 13C content of
236
the PAH extract decreased over time down to 3-11% of the total 13C content, while it increased
237
significantly in residual soil and reached 45-48% of the total 13C content after 21 days. The
238
ryegrass 13C content represented less than 1% of the total 13C content, mainly due to the very
239
low dry mass as compared to the total mass of soil (a few mg versus 40 g). The 13C loss from
240
mesocosms accounted for 19% after 7 days and up to 43% after 14 days. 241
3.3. Mapping of 13C enrichment in ryegrass roots
243
NanoSIMS analyses were carried out on unlabeled and labeled roots after 7 and 14 days. 244
The mean percentages of 13C atoms in the roots were 1.09in unlabeled (control) roots, 1.11 in
245
13C-labeled roots after 7 days, and 1.15 in 13C-labeled roots after 14 days. A significant 13
C-246
enrichment was noted in labeled roots after 14 days relatively to the control. 247
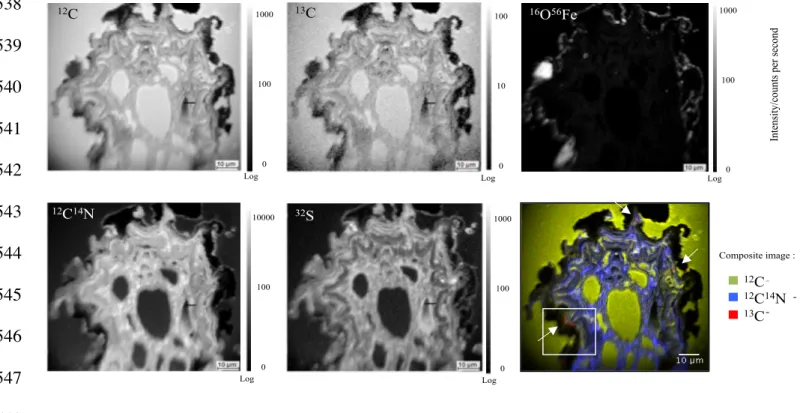
A mapping of 13C associated with 12C, 12C14N, 32S, 56Fe16O ion species was performed on
248
root cross sections after 14 days (Figure 3). The roots were clearly identified in association with 249
high 12C-, 12C14N- and 32S- signals. The resin was clearly visible with high 12C- levels but no
250
12C14N- or 32S- intensity, and was easily differentiated from the root tissue. Mineral particles
251
such as iron oxides, assimilated to soil particles, were highlighted by the 56Fe16O – signal and
252
they were only observed surrounding the root. The composite image resulting from the overlay 253
of 12C, 12C14N and 13C elements emphasized 13C enrichment localization. There was no visual
254
evidence of global 13C enrichment in the roots, but rather locally distributed hotspots. Three
255
zones were identified close to the root epidermis (Figure 4), but none close to the soil particles. 256
These hotspots were mainly oval-shaped, and 1 to 2 µm in diameter. 257
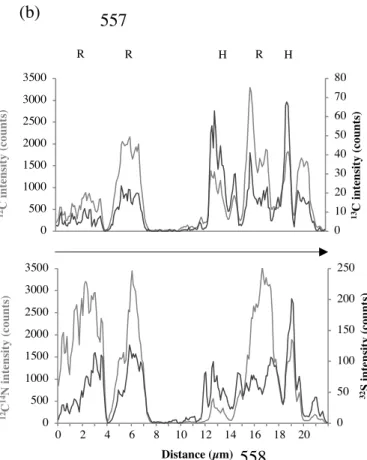
An area of interest, pinpointed by the white square in Figure 3, was enlarged and 258
presented in Figure 4.a) Hotspots (red), root (green and blue association), soil (white) and resin 259
(green) were well identified. The black zone between the resin and the root could be holes that 260
formed during sample preparation. The hotspots were adherent to the root epidermal cells but 261
not to the soil particles. A linescan was drawn through root and hotspots (Figure 4.b) to study 262
12C-, 13C-, 12C14N- and 32S- distribution. It showed that a higher 13C- signal as compared to 12C- was
263
correlated with a higher 32S- signal as compared to 12C14N-. This higher 32S- signal as compared
264
to 12C14N- was not observed in the root but only in the hotspot, so that the hotspots appeared to
265
be made of something else than root tissue. 12C/12C14N, 32S/12C14N and 56Fe16O/12C ratios were
266
also calculated for ROI selection in the hotspots, root tissue, soil particles and resin (Table 2). 267
Hotspots were easily discriminated from roots because they displayed significantly higher 268
12C/12C14N and 32S/12C14N ratios. They were not considered as soil particles because they had a
269
low 56Fe16O/12C ratio, or as resin because they contained less C than resin (12C/12C14N ratios
270
equivalent to 12.88 for resin and 1.02 for hotspots). 271
4. Discussion
272
4.1. Effect of the rhizosphere on phenanthrene degradation 273
The extractable PHE concentration decreased by 40% after spiking and by up to 90% 274
after 21 days in the planted and non-planted systems (Figure 1). This rapid dissipation of PHE 275
and its high rate are in part explained by experimental conditions, including the high 276
bioavailability of the freshly spiked pollutant and soil inoculation with adapted microflora. 277
Smith et al. (2011) showed that using a soil freshly spiked with pure PAH led to a greater loss 278
than using historically contaminated soils. Inoculation of a microflora extracted from PAH-279
contaminated soil had a priming effect in the first days following contamination and increased 280
PHE degradation (Joner et al., 2004, 2002). Low-molecular-weight PAHs such as PHE (3 rings) 281
can be used as primary substrates and be easily broken down in the soil by adapted microflora 282
commonly found in polluted soils (Cerniglia, 1997). This rapid PHE degradation could mask a 283
potential rhizospheric effect, even in a forest soil. No significant difference was noted in 13
C-284
dynamics between the planted and non-planted systems (Figure 2). Therefore there is no 285
evidence of an impact of the rhizosphere on PAH degradation in this type of plant-soil 286
mesocosm. 287
288
4.2. Dynamics of phenanthrene carbon in the plant-soil mesocosms 289
The dynamics of PHE degradation was studied by monitoring the increase in C loss 290
represented half of the spiked 13C (Figure 2.b). We hypothesized that a major part of the
292
PHE loss was mineralized as CO2. There was no significant difference in PHE degradation
293
between 14 and 21 days, which means that PHE degradation occurred during the first days 294
of contamination. 295
After 14 days, almost 40% of PHE carbon had been incorporated in the soil. This result 296
is in accordance with the 38% of 13C remaining in the soil after 12 days in comparable soil 297
mesocosms used to identify PAH-degrading bacteria (Cébron et al., 2011). No PHE metabolite, 298
like those identified by Käcker et al. (2002) and Richnow et al. (2000) for example, was 299
detected by GC-MS analysis of PAH extracts. The remaining 13C incorporated in the soil must 300
then have been present under the form of other organic compounds that were not extracted by 301
dichloromethane. Kästner et al. (1999) conducted a long-term experiment on the transformation 302
of 13C-labeled PAHs in soil bioreactors; they highlighted that the non-extractable residue had 303
a relatively high stability over time. These organic compounds, newly formed from PAHs, 304
become soil-bound residues (Binet et al., 2000) and/or a C source for microorganisms (Richnow 305
et al., 1998; 2000). For Richnow et al. (1999), the formation of these compounds most probably 306
depends on an intense microbial activity. Soil microorganisms may use organic pollutants like 307
PAHs as a C source and transform them into biomass through anabolic processes. Part of these 308
newly formed compounds can also be incorporated into organo-mineral complexes and be 309
protected against degradation depending on the nature of mineral phases (de Junet et al., 2013). 310
This could explain why these organic compounds remain non-available in the soil (Macleod 311
and Semple, 2003; Pignatello and Xing, 1996) and have a relative high stability (Richnow et 312
al., 1999). 313
Less than 1% of total PHE carbon was taken up by ryegrass roots and shoots. No 314
significant difference was noted between the two plant parts after 14 and 21 days. Plant 315
13C enrichment was similar to soil 13C enrichment, namely about 0.04 at.% (Figure 2a), and
the difference expressed in total amounts was only due to the difference in mass between 317
the soil and the plants. However, according to NanoSIMS analyses (Figure 4), there was 318
no evidence of direct PHE uptake by plant roots. A small part of PHE may have been 319
sorbed onto the root epidermis, more precisely near the suberized exodermis and 320
endodermis (Dupuy et al., 2016). Previous studies show preferential PAH incorporation in 321
shoots through atmospheric deposition, and low direct incorporation by roots (Binet et al., 322
2000a; Desalme et al., 2011; Schwab and Banks, 1994). If 13C was not taken up by the
323
roots under the form of PHE, it may have been taken up under the form of newly formed 324
organic compounds or 13C-CO
2. It could be absorbed or adsorbed from ambient air by the
325
shoots after PHE volatilization (Gao and Zhu, 2004) or through stomata under the form of 326
13C-CO
2 during the photosynthetic process. 13C enrichment was also noted in roots by SIMS,
327
confirming the excess 13C recovered in the roots (Figure 2.a).
328 329
4.3. Determination of 13C hotspots and localization of 13C in ryegrass roots
330
There was no correlation between the 56Fe16O and 13C signals close to the roots after 14
331
days, therefore SIMS analyses did not evidence any contribution of organic matter-mineral 332
associations to the 13C-PAH dynamics. However two types of enrichment were highlighted
333
in the plant rhizosphere: a global 13C enrichment and 13C hotspots. Hotspots were composed
334
of 12C
-, 12C14N- and 32S- ions species. Sulfur and nitrogen contents suggest the presence of
335
proteins (Eybe et al., 2008) that could originate from the plants or from microorganisms. 336
Hotspots were discriminated from root tissues based on their high 32S content as compared to
337
the roots (Figure 4 and Table 2). The 32S/12C14N ratio of the hotspots (0.11) was around five
338
times higher than the 32S/12C14N ratio of the ryegrass roots (0.02). This last value is in
339
accordance with the 32S/12C14N ratio of 0.027 found by Dijkshoorn and Van Wijk (1967) in
340
ryegrass shoots. The oval shape of the hotspots and their size (1 to 2 µm in diameter) are in 341
accordance with the shape and size of bacteria. Moreover, measurements were performed on 342
isolated bacteria (unpublished data) and showed similar ratios (0.1 for 32S/12C14N). There was
343
evidence of global 13C enrichment during plant growth, but no PAH uptake by the roots was
344
visualized by NanoSIMS analyses (Figure 4). The main 13C-PAH uptake could be attributed to
345
the bacteria present in the rhizospheric environment. 346
347
5.
Conclusion348
A mesocosm experiment was conducted using 13C-phenanthrene to monitor the
349
dynamics of PHE and derived compounds in the soil and in ryegrass. After 21 days, almost 350
90% of spiked PHE had been degraded. PHE was mainly mineralized under gas phase (up to 351
53%, corresponding to the 13C loss). But after 14 days, more than 40% of PHE carbon had been
352
transformed into newly formed organic compounds (metabolites) or incorporated into the 353
microbial biomass. No rhizospheric effect on PAH dynamics was noted due to the rapid 354
dissipation of PHE. Less than 1% of PHE carbon was also found in the root and shoot tissues 355
of ryegrass. The plant E13C was similar to the soil E13C (~ 0.04 at.%), suggesting a homogeneous
356
C-PAH distribution in the plant-soil mesocosm. 357
Global root C-PAH enrichment was also determined in the ryegrass rhizosphere at a 358
finer scale using NanoSIMS, based on 13C/12C ratio measurements on images obtained for
359
control (12C) and labeled samples after 7 and 14 days. There was no evidence of 13C-PAH
360
association to iron oxides in the close root environment. However, hotspots of 13C enrichment
361
close to the roots probably indicated the presence of bacteria, as suggested by their size, shape 362
and element composition. A part of PAH carbon was sorbed on the roots, but it was mainly 363
incorporated into the bacteria mentioned above. These bacteria probably degraded PHE and 364
incorporated PHE-derived 13C into their biomass.
The use of labeled contaminants and the coupling of IRMS and NanoSIMS is a relevant 366
and powerful tool for determining the dynamics of these contaminants. The dynamics of 13C
367
from labeled PAH was highlighted by 13C-partionning at a global level, but the transformation
368
of PAH 13C at a molecular level remains to be investigated. Complementary techniques such as
369
13C-NMR and pyGCMS could be used to further characterize the 13C-PAH metabolites.
370 371
Acknowledgements
372
This work was supported by a grant from the University of Lorraine and the Lorraine 373
Region. The authors thank David Billet for UHPLC analyses and Patrick Grysan for NanoSIMS 374 analyses. 375 376
References
377Anderson, T.A., Guthrie, E., Walton, B.T., 1993. Bioremediation in the rhizosphere. Environ. 378
Sci. Technol. 27, 2630–2636. doi:10.1021/es00049a001 379
Behrens, S., Lösekann, T., Pett-Ridge, J., Weber, P.K., Ng, W.O., Stevenson, B.S., Hutcheon, 380
I.D., Relman, D.A., Spormann, A.M., 2008. Linking microbial phylogeny to metabolic 381
activity at the single-cell level by using enhanced element labeling-catalyzed reporter 382
deposition fluorescence in situ hybridization (EL-FISH) and NanoSIMS. Appl. Environ. 383
Microbiol. 74, 3143–3150. doi:10.1128/AEM.00191-08 384
Binet, P., Portal, J.M., Leyval, C., 2000a. Fate of polycyclic aromatic hydrocarbons (PAH) in 385
the rhizosphere and mycorrhizosphere of ryegrass. Plant Soil 227, 207–213. 386
doi:10.1023/A:1026587418611 387
Binet, P., Portal, J.M., Leyval, C., 2000b. Dissipation of 3–6-ring polycyclic aromatic 388
hydrocarbons in the rhizosphere of ryegrass. Soil Biol. Biochem. 32, 2011–2017. 389
doi:10.1016/S0038-0717(00)00100-0 390
Burken, J.G., Schnoor, J.L., 1998. Predictive relationships for uptake of organic contaminants 391
by hybrid poplar trees. Environ. Sci. Technol. 32, 3379–3385. doi:10.1021/es9706817 392
Cébron, A., Louvel, B., Faure, P., France-Lanord, C., Chen, Y., Murrell, J.C., Leyval, C., 2011. 393
Root exudates modify bacterial diversity of phenanthrene degraders in PAH-polluted soil 394
but not phenanthrene degradation rates. Environ. Microbiol. 13, 722–736. 395
doi:10.1111/j.1462-2920.2010.02376.x 396
Cerniglia, C.E., 1997. Fungal metabolism of polycyclic aromatic hydrocarbons: past, present 397
and future applications in bioremediation. J. Ind. Microbiol. Biotechnol. 19, 324–33. 398
Corgié, S.C., Joner, E.J., Leyval, C., 2003. Rhizospheric degradation of phenanthrene is a 399
function of proximity to roots. Plant Soil 257, 143–150. doi:10.1023/A:1026278424871 400
de Junet, A., Basile-Doelsch, I., Borschneck, D., Masion, A., Legros, S., Marol, C., Balesdent, 401
J., Templier, J., Derenne, S., 2013. Characterisation of organic matter from organo-mineral 402
complexes in an Andosol from Reunion Island. J. Anal. Appl. Pyrolysis 99, 92–100. 403
doi:10.1016/j.jaap.2012.10.020 404
Desalme, D., Binet, P., Bernard, N., Gilbert, D., Toussaint, M.L., Chiapusio, G., 2011. 405
Atmospheric phenanthrene transfer and effects on two grassland species and their root 406
symbionts: a microcosm study. Environ. Exp. Bot. 71, 146–151.
407
doi:10.1016/j.envexpbot.2010.11.009 408
Dijkshoorn.W., Van Wijk.L., 1967. The sulphur requirements of plants evidenced by the 409
sulphur-nitrogen ratio in the organic matter a review of published data. Plant Soil 26, 129– 410
157. 411
Doick, K.J., Burauel, P., Jones, K.C., Semple, K.T., 2005. Distribution of aged 14C-PCB and 412
14C-PAH residues in particle-size and humic fractions of an agricultural soil. Environ. 413
Sci. Technol. 39, 6575–6583. doi:10.1021/es050523c 414
Dupuy, J., Leglize, P., Vincent, Q., Zelko, I., Mustin, C., Ouvrard, S., Sterckeman, T., 2016. 415
Effect and localization of phenanthrene in maize roots. Chemosphere 149, 130–136. 416
doi:10.1016/j.chemosphere.2016.01.102 417
Edwards, N.T., 1983. Polycyclic Aromatic Hydrocarbons (PAH’s) in the Terrestrial 418
Environment - A Review. J. Environ. Qual. 12, 427–441.
419
doi:10.2134/jeq1983.00472425001200040001x 420
Eschenbach, A., Wienberg, R., Mahro, B., 1998. Fate and stability of nonextractable residues 421
of [14 C] in contaminated soils under environmental stress conditions. Environ. Sci. 422
Technol. 32, 2585–2590. doi:10.1021/es9708272 423
Eybe, T., Audinot, J.N., Bohn, T., Guignard, C., Migeon, H.N., Hoffmann, L., 2008. NanoSIMS 424
50 elucidation of the natural element composition in structures of cyanobacteria and their 425
exposure to halogen compounds. J. Appl. Microbiol. 105, 1502–1510. doi:10.1111/j.1365-426
2672.2008.03870.x 427
Fang, C., Radosevich, M., Fuhrmann, J.J., 2001. Atrazine and phenanthrene degradation in 428
grass rhizosphere soil. Soil Biol. Biochem. 33, 671–678. doi:10.1016/S0038-429
0717(00)00216-9 430
Gao, Y., Zhu, L., 2004. Plant uptake, accumulation and translocation of phenanthrene and 431
pyrene in soils. Chemosphere 55, 1169–78. doi:10.1016/j.chemosphere.2004.01.037 432
Günther, T., Dornberger, U., Fritsche, W., 1996. Effects of ryegrass on biodegradation of 433
hydrocarbons in soil. Chemosphere 33, 203–215. doi:10.1016/0045-6535(96)00164-6 434
Hartmann, R., 1996. Polycyclic aromatic hydrocarbons (PAHs) in forest soils: Critical 435
evaluation of a new analytical procedure. Int. J. Environ. Anal. Chem. 62, 161–173. 436
doi:10.1080/03067319608027062 437
Herrmann, A.M., Ritz, K., Nunan, N., Clode, P.L., Pett-Ridge, J., Kilburn, M.R., Murphy, D. 438
V., O’Donnell, A.G., Stockdale, E.A., 2007. Nano-scale secondary ion mass spectrometry 439
- A new analytical tool in biogeochemistry and soil ecology: A review article. Soil Biol. 440
Biochem. 39, 1835–1850. doi:10.1016/j.soilbio.2007.03.011 441
Hoppe, P., Cohen, S., Meibom, A., 2013. NanoSIMS: technical aspects and applications in 442
cosmochemistry and biological geochemistry. Geostand. Geoanalytical Res. 37, 111–154. 443
doi:10.1111/j.1751-908X.2013.00239.x 444
Hwang, S., Cutright, T.J., 2002. Biodegradability of aged pyrene and phenanthrene in a natural 445
soil. Chemosphere 47, 891–899. doi:10.1016/S0045-6535(02)00016-4 446
Joner, E.J., Corgie, S.C., Amellal, N., Leyval, C., 2002. Nutritional constraints to degradation 447
of polycyclic aromatic hydrocarbons in a simulated rhizosphere. Soil Biol. Biochem. 34, 448
859–864. doi:10.1016/S0038-0717(02)00018-4 449
Joner, E.J., Hirmann, D., Szolar, O.H.J., Todorovic, D., Leyval, C., Loibner, A.P., 2004. 450
Priming effects on PAH degradation and ecotoxicity during a phytoremediation 451
experiment. Environ. Pollut. 128, 429–35. doi:10.1016/j.envpol.2003.09.005 452
Käcker, T., Haupt, E.T.K., Garms, C., Francke, W., Steinhart, H., 2002. Structural 453
characterisation of humic acid-bound PAH residues in soil by 13C-CPMAS-NMR-454
spectroscopy: Evidence of covalent bonds. Chemosphere 48, 117–131.
455
doi:10.1016/S0045-6535(02)00082-6 456
Kästner, M., Streibich, S., Beyrer, M., Richnow, H.H., Ka, M., 1999. Formation of bound 457
residues during microbial degradation of [ 14 C ] anthracene in soil. Appl. Environ. 458
Microbiol. 65, 1834–1842. doi:0099-2240/99/$04.00+0 459
Kipopoulou, A.M., Manoli, E., Samara, C., 1999. Bioconcentration of polycyclic aromatic 460
hydrocarbons in vegetables grown in an industrial area. Environ. Pollut. 106, 369–80. 461
Liste, H.H., Alexander, M., 2000. Plant-promoted pyrene degradation in soil. Chemosphere 40, 462
7–10. doi:10.1016/S0045-6535(99)00216-7 463
Macleod, C.J.A., Semple, K.T., 2003. Sequential extraction of low concentrations of pyrene 464
and formation of non-extractable residues in sterile and non-sterile soils. Soil Biol. 465
Biochem. 35, 1443–1450. doi:10.1016/S0038-0717(03)00238-4 466
Magee, B.R., Lion, L.W., Lemley, A.T., 1991. Transport of dissolved organic macromolecules 467
and their effect on the transport of phenanthrene in porous media. Environ. Sci. Technol. 468
25, 323–331. doi:10.1021/es00014a017 469
Miya, R.K., Firestone, M.K., 2000. Phenanthrene-degrader community dynamics in 470
rhizosphere soil from a common annual grass. J. Environ. Qual. 29, 584. 471
doi:10.2134/jeq2000.00472425002900020029x 472
Moore, K.L., Lombi, E., Zhao, F.J., Grovenor, C.R.M., 2012. Elemental imaging at the 473
nanoscale: NanoSIMS and complementary techniques for element localisation in plants. 474
Anal. Bioanal. Chem. 402, 3263–3273. doi:10.1007/s00216-011-5484-3 475
Northcott, G.L., Jones, K.C., 2001. Partitioning, extractability, and formation of non extractable 476
PAH residues in soil.2. Effects on compund dissolution bahaviour. Environ. Sci. Technol. 477
35, 1111–1117. doi:10.1021/es000072q 478
Pignatello, J.J., Xing, B., 1996. Mechanisms of slow sorption of organic chemicals to natural 479
particles. Environ. Sci. Technol. 30, 1–11. doi:10.1021/es940683g 480
Printz, B., Guerriero, G., Sergeant, K., Audinot, J.-N., Guignard, C., Renaut, J., Lutts, S., 481
Hausman, J.-F., 2016. Combining-omics to unravel the impact of copper nutrition on 482
Alfalfa (Medicago sativa) stem metabolism. Plant Cell Physiol. 57, 407–22. 483
doi:10.1093/pcp/pcw001 484
Reilley, K.A., Banks, M.K., Schwab, A.P., 1996. Dissipation of polycyclic aromatic 485
hydrocarbons in the rhizosphere. J. Environ. Qual. 25, 212.
486
doi:10.2134/jeq1996.00472425002500020002x 487
Remusat, L., Hatton, P., Nico, P.S., Zeller, B., Kleber, M., Derrien, D., 2012. NanoSIMS study 488
of organic matter associated with soil aggregates: advantages, limitations, and 489
combination with STXM. Environ. Sci. Technol. 46, 3943–3949. doi:10.1021/es203745k 490
Rezek, J., in der Wiesche, C., Mackova, M., Zadrazil, F., Macek, T., 2008. The effect of 491
ryegrass (Lolium perenne) on decrease of PAH content in long term contaminated soil. 492
Chemosphere 70, 1603–8. doi:10.1016/j.chemosphere.2007.08.003 493
Richnow, H.H., Annweiler, E., Koning, M., Lüth, J.C., Stegmann, R., Garms, C., Francke, W., 494
Michaelis, W., 2000a. Tracing the transformation of labelled [1-13C]phenanthrene in a 495
soil bioreactor. Environ. Pollut. 108, 91–101. doi:10.1016/S0269-7491(99)00205-5 496
Richnow, H.H., Eschenbach, A., Mahro, B., Kästner, M., Annweiler, E., Seifert, R., Michaelis, 497
W., 1999. Formation of nonextractable soil residues: A stable isotope approach. Environ. 498
Sci. Technol. 33, 3761–3767. doi:10.1021/es980927n 499
Richnow, H.H., Eschenbach, A., Mahro, B., Seifert, R., Wehrung, P., Albrecht, P., Michaelis, 500
W., 1998. The use of 13C-labelled polycyclic aromatic hydrocarbons for the analysis of 501
their transformation in soil. Chemosphere 36, 2211–2224. doi:10.1016/S0045-502
6535(97)10193-X 503
Sabaté, J., Viñas, M., Solanas, A.M., 2006. Bioavailability assessment and environmental fate 504
of polycyclic aromatic hydrocarbons in biostimulated creosote-contaminated soil. 505
Chemosphere 63, 1648–1659. doi:10.1016/j.chemosphere.2005.10.020 506
Schwab, A.P., Banks, M.K., 1994. Biologically mediated dissipation of polyaromatic 507
hydrocarbons in the root zone. Am. Chem. Soc. doi:10.1021/bk-1994-0563.ch012 508
Smith, M.J., Flowers, T.H., Duncan, H.J., Saito, H., 2011. Study of PAH dissipation and 509
phytoremediation in soils: comparing freshly spiked with weathered soil from a former 510
coking works. J. Hazard. Mater. 192, 1219–1225. doi:10.1016/j.jhazmat.2011.06.033 511
Vidal, A., Remusat, L., Watteau, F., Derenne, S., Quenea, K., 2016. Incorporation of 13C 512
labelled shoot residues in Lumbricus terrestris casts: A combination of transmission 513
electron microscopy and nanoscale secondary ion mass spectrometry. Soil Biol. Biochem. 514
93, 8–16. doi:10.1016/j.soilbio.2015.10.018 515
Wilson, S.C., Jones, K.C., 1993. Bioremediation of soil contaminated with polynuclear 516
aromatic hydrocarbons (PAHs): a review. Environ. Pollut. 81, 229–249. 517
doi:10.1016/0269-7491(93)90206-4 518
519 520
521
Figure 1. Extractable concentrations of phenanthrene (PHE, mg kg-1 of soil) in planted and
522
non-planted mesocosms at different time-points over a 21-day period. Means ± SD, n = 4. 523
Different letters indicate significant differences (p<0.05) between the sampling times. 524 525 (a) (b) SOIL PLANT 0% 20% 40% 60% 80% 100% 0 7 14 21 13C d is tr ib u ti on ( % ) Days 0% 20% 40% 60% 80% 100% 0 7 14 21 13C d is tr ib u ti on ( % ) Days C-loss Plant PAH extract Residual soil 0,00 0,02 0,04 0,06 0,08 0,10 0,12 0 7 14 21 % ex ce ss 13C at om s Days PAH extract 0,00 0,02 0,04 0,06 0,08 0,10 0,12 0 7 14 21 % ex ce ss 13C at om s Days Bulk Residual Shoot Root PAH extract
526
Figure 2. 13C dynamics after 13C-PHE spiking in non-planted (left) and planted (right)
527
mesocosms at different time-points over a 21-day period. (a) 13C enrichment (E13C, at.%) in the
528
plant and soil compartments. Means ± SD, n = 4. 13C enrichment was calculated from δ13C data
529
obtained by EA-IRMS. (b) 13C distribution in the mesocosm compartments (PAH extract,
530
residual soil, plant, and C loss). Results are expressed as percentages of the 13C-PHE
531
concentrations initially added in the soil. The plant compartment gathers root and shoot data. 532
PAH extract concentrations were calculated as the difference between bulk and residual soil 533 concentrations. 534 535 0 40 80 120 160 200 0 7 14 21 PH E con cen trat ion s (m g k g -1 so il) Days Unplanted Planted a b c d Non-planted mesocosm Planted mesocosm
536 537 538 539 540 541 542 543 544 545 546 547 548
Figure 3. NanoSIMS elemental maps of 12C-, 13C-, 12C14N-, 32S- and 56Fe16O- from labeled
549
ryegrass roots after 14 days. The 90*90-µm2 images are cross views of whole roots with
550
adherent soil particles. A composite image (bottom right) was obtained by overlaying the 12C-,
551
12C14N- and 13C- images. Three areas of interest (bordered in white) with higher 13C content were
552
identified. NanoSIMS data were analyzed using Winimage software. 553 554 - - - 12C Int ens ity/ count s pe r s ec ond 1000 100 0 13C 100 10 0 12C14N 10000 100 0 32S 1000 100 0 72OFe 16O56Fe 1000 100 0 δ13C
Log Log Log
Log Log
§
12C§
12C14N§
13C 12C 12C14N 13C Composite image :555 556 557 558 559 560
Figure 4. NanoSIMS composite image and linescan obtained from root tissue after 14 days.
561
The zone is located inside the white square of Figure 3. (a) Composite 25*25-µm2 image with
562
hotspots reflecting the 13C-enrichment (red) obtained by overlaying 12C-, 13C-, 12C14N- and
563
56Fe16O- (white) ion species images. (b) A white segment was drawn through these hotspots
564 565