HAL Id: hal-01582713
https://hal.archives-ouvertes.fr/hal-01582713
Submitted on 15 Apr 2020
HAL is a multi-disciplinary open access
archive for the deposit and dissemination of
sci-entific research documents, whether they are
pub-lished or not. The documents may come from
teaching and research institutions in France or
abroad, or from public or private research centers.
L’archive ouverte pluridisciplinaire HAL, est
destinée au dépôt et à la diffusion de documents
scientifiques de niveau recherche, publiés ou non,
émanant des établissements d’enseignement et de
recherche français ou étrangers, des laboratoires
publics ou privés.
Search for Extended Sources in the Galactic Plane Using
Six Years of F ermi-Large Area Telescope Pass 8 Data
above 10 GeV
M. Ackermann, M. Ajello, L. Baldini, J. Ballet, G. Barbiellini, D. Bastieri, R.
Bellazzini, E. Bissaldi, E.D. Bloom, R. Bonino, et al.
To cite this version:
M. Ackermann, M. Ajello, L. Baldini, J. Ballet, G. Barbiellini, et al.. Search for Extended Sources
in the Galactic Plane Using Six Years of F ermi-Large Area Telescope Pass 8 Data above 10 GeV.
Astrophys.J., 2017, 843 (2), pp.139. �10.3847/1538-4357/aa775a�. �hal-01582713�
Search for Extended Sources in the Galactic Plane Using Six Years of
Fermi-Large Area
Telescope Pass 8 Data above 10 GeV
M. Ackermann1, M. Ajello2, L. Baldini3, J. Ballet4, G. Barbiellini5,6, D. Bastieri7,8, R. Bellazzini9, E. Bissaldi10, E. D. Bloom11, R. Bonino12,13, E. Bottacini11, T. J. Brandt14, J. Bregeon15, P. Bruel16, R. Buehler1, R. A. Cameron11, M. Caragiulo10,17, P. A. Caraveo18, D. Castro14, E. Cavazzuti19, C. Cecchi20,21, E. Charles11, A. Chekhtman22, C. C. Cheung23, G. Chiaro8,
S. Ciprini19,20, J. M. Cohen14,24, D. Costantin8, F. Costanza10, S. Cutini19,20, F. D’Ammando25,26, F. de Palma10,27, R. Desiante12,28, S. W. Digel11, N. Di Lalla3, M. Di Mauro11, L. Di Venere10,17, C. Favuzzi10,17, S. J. Fegan16, E. C. Ferrara14, A. Franckowiak1, Y. Fukazawa29, S. Funk30, P. Fusco10,17, F. Gargano10, D. Gasparrini19,20, N. Giglietto10,17, F. Giordano10,17, M. Giroletti25, D. Green14,24, I. A. Grenier4, M.-H. Grondin31, L. Guillemot32,33, S. Guiriec14,56, A. K. Harding14, E. Hays14,
J. W. Hewitt34, D. Horan16, X. Hou35,36,37, G. Jóhannesson38,39, T. Kamae40, M. Kuss9, G. La Mura8, S. Larsson41,42, M. Lemoine-Goumard31, J. Li43, F. Longo5,6, F. Loparco10,17, P. Lubrano20, J. D. Magill24, S. Maldera12, D. Malyshev30,
A. Manfreda3, M. N. Mazziotta10, P. F. Michelson11, W. Mitthumsiri44, T. Mizuno45, M. E. Monzani11, A. Morselli46, I. V. Moskalenko11, M. Negro12,13, E. Nuss15, T. Ohsugi45, N. Omodei11, M. Orienti25, E. Orlando11, J. F. Ormes47, V. S. Paliya2,
D. Paneque48, J. S. Perkins14, M. Persic5,49, M. Pesce-Rollins9, V. Petrosian11, F. Piron15, T. A. Porter11, G. Principe30, S. Rainò10,17, R. Rando7,8, M. Razzano9,57, S. Razzaque50, A. Reimer51,11, O. Reimer51,11, T. Reposeur31, C. Sgrò9, D. Simone10,
E. J. Siskind52, F. Spada9, G. Spandre9, P. Spinelli10,17, D. J. Suson53, D. Tak14,24, J. B. Thayer11, D. J. Thompson14, D. F. Torres43,54, G. Tosti20,21, E. Troja14,24, G. Vianello11, K. S. Wood55, and M. Wood11
1
Deutsches Elektronen Synchrotron DESY, D-15738 Zeuthen, Germany
2
Department of Physics and Astronomy, Clemson University, Kinard Lab of Physics, Clemson, SC 29634-0978, USA
3
Università di Pisa and Istituto Nazionale di Fisica Nucleare, Sezione di Pisa I-56127 Pisa, Italy
4
Laboratoire AIM, CEA-IRFU/CNRS/Université Paris Diderot, Service d’Astrophysique, CEA Saclay, F-91191 Gif sur Yvette, France
5
Istituto Nazionale di Fisica Nucleare, Sezione di Trieste, I-34127 Trieste, Italy
6
Dipartimento di Fisica, Università di Trieste, I-34127 Trieste, Italy
7Istituto Nazionale di Fisica Nucleare, Sezione di Padova, I-35131 Padova, Italy 8
Dipartimento di Fisica e Astronomia“G. Galilei,” Università di Padova, I-35131 Padova, Italy
9
Istituto Nazionale di Fisica Nucleare, Sezione di Pisa, I-56127 Pisa, Italy
10
Istituto Nazionale di Fisica Nucleare, Sezione di Bari, I-70126 Bari, Italy
11
W. W. Hansen Experimental Physics Laboratory, Kavli Institute for Particle Astrophysics and Cosmology, Department of Physics and SLAC National Accelerator Laboratory, Stanford University, Stanford, CA 94305, USA
12
Istituto Nazionale di Fisica Nucleare, Sezione di Torino, I-10125 Torino, Italy
13
Dipartimento di Fisica, Università degli Studi di Torino, I-10125 Torino, Italy
14
NASA Goddard Space Flight Center, Greenbelt, MD 20771, USA;[email protected],[email protected]
15Laboratoire Univers et Particules de Montpellier, Université Montpellier, CNRS/IN2P3, F-34095 Montpellier, France 16
Laboratoire Leprince-Ringuet, École polytechnique, CNRS/IN2P3, F-91128 Palaiseau, France
17
Dipartimento di Fisica“M. Merlin” dell’Università e del Politecnico di Bari, I-70126 Bari, Italy
18
INAF-Istituto di Astrofisica Spaziale e Fisica Cosmica Milano, via E. Bassini 15, I-20133 Milano, Italy
19
Agenzia Spaziale Italiana(ASI) Science Data Center, I-00133 Roma, Italy
20
Istituto Nazionale di Fisica Nucleare, Sezione di Perugia, I-06123 Perugia, Italy
21
Dipartimento di Fisica, Università degli Studi di Perugia, I-06123 Perugia, Italy
22
College of Science, George Mason University, Fairfax, VA 22030, resident at Naval Research Laboratory, Washington, DC 20375, USA
23
Space Science Division, Naval Research Laboratory, Washington, DC 20375-5352, USA
24
Department of Physics and Department of Astronomy, University of Maryland, College Park, MD 20742, USA
25
INAF Istituto di Radioastronomia, I-40129 Bologna, Italy
26Dipartimento di Astronomia, Università di Bologna, I-40127 Bologna, Italy 27
Università Telematica Pegaso, Piazza Trieste e Trento, 48, I-80132 Napoli, Italy
28
Università di Udine, I-33100 Udine, Italy
29
Department of Physical Sciences, Hiroshima University, Higashi-Hiroshima, Hiroshima 739-8526, Japan
30
Erlangen Centre for Astroparticle Physics, D-91058 Erlangen, Germany
31
Centre d’Études Nucléaires de Bordeaux Gradignan, IN2P3/CNRS, Université Bordeaux 1, BP120, F-33175 Gradignan Cedex, France;[email protected],[email protected]
32Laboratoire de Physique et Chimie de l’Environnement et de l’Espace—Université d’Orléans / CNRS, F-45071 Orléans Cedex 02, France 33
Station de radioastronomie de Nançay, Observatoire de Paris, CNRS/INSU, F-18330 Nançay, France
34University of North Florida, Department of Physics, 1 UNF Drive, Jacksonville, FL 32224, USA 35
Yunnan Observatories, Chinese Academy of Sciences, 396 Yangfangwang, Guandu District, Kunming 650216, China
36
Key Laboratory for the Structure and Evolution of Celestial Objects, Chinese Academy of Sciences, 396 Yangfangwang, Guandu District, Kunming 650216, China
37
Center for Astronomical Mega-Science, Chinese Academy of Sciences, 20A Datun Road, Chaoyang District, Beijing 100012, China
38
Science Institute, University of Iceland, IS-107 Reykjavik, Iceland
39
Nordita, Roslagstullsbacken 23, SE-106 91 Stockholm, Sweden
40
Department of Physics, Graduate School of Science, University of Tokyo, 7-3-1 Hongo, Bunkyo-ku, Tokyo 113-0033, Japan
41
Department of Physics, KTH Royal Institute of Technology, AlbaNova, SE-106 91 Stockholm, Sweden
42
The Oskar Klein Centre for Cosmoparticle Physics, AlbaNova, SE-106 91 Stockholm, Sweden
43
Institute of Space Sciences(IEEC-CSIC), Campus UAB, Carrer de Magrans s/n, E-08193 Barcelona, Spain
44
Department of Physics, Faculty of Science, Mahidol University, Bangkok 10400, Thailand
45Hiroshima Astrophysical Science Center, Hiroshima University, Higashi-Hiroshima, Hiroshima 739-8526, Japan 46
Istituto Nazionale di Fisica Nucleare, Sezione di Roma“Tor Vergata,” I-00133 Roma, Italy
47
Department of Physics and Astronomy, University of Denver, Denver, CO 80208, USA
48
Max-Planck-Institut für Physik, D-80805 München, Germany
49
Osservatorio Astronomico di Trieste, Istituto Nazionale di Astrofisica, I-34143 Trieste, Italy
50Department of Physics, University of Johannesburg, PO Box 524, Auckland Park 2006, South Africa 51
Institut für Astro- und Teilchenphysik and Institut für Theoretische Physik, Leopold-Franzens-Universität Innsbruck, A-6020 Innsbruck, Austria
52
NYCB Real-Time Computing Inc., Lattingtown, NY 11560-1025, USA
53
Department of Chemistry and Physics, Purdue University Calumet, Hammond, IN 46323-2094, USA
54
Institució Catalana de Recerca i Estudis Avançats(ICREA), E-08010 Barcelona, Spain
55
Praxis Inc., Alexandria, VA 22303, Resident at Naval Research Laboratory, Washington, DC 20375, USA Received 2017 January 24; revised 2017 June 1; accepted 2017 June 1; published 2017 July 13
Abstract
The spatial extension of aγ-ray source is an essential ingredient to determine its spectral properties, as well as its potential multiwavelength counterpart. The capability to spatially resolveγ-ray sources is greatly improved by the newly delivered Fermi-Large Area Telescope (LAT) Pass 8 event-level analysis, which provides a greater acceptance and an improved point-spread function, two crucial factors for the detection of extended sources. Here, we present a complete search for extended sources located within 7° from the Galactic plane, using 6 yr of
Fermi-LAT data above 10 GeV. We find 46 extended sources and provide their morphological and spectral
characteristics. This constitutes thefirst catalog of hard Fermi-LAT extended sources, named the Fermi Galactic Extended Source Catalog, which allows a thorough study of the properties of the Galactic plane in the sub-TeV domain.
Key words: catalogs– gamma rays: general
1. Introduction
Several surveys of the Galaxy have been undertaken at TeV γ-ray energies (e.g., Aharonian et al. 2006a) by the current
Instrument Atmospheric Cherenkov Telescopes (IACTs)
revealing different classes of astrophysical sources such as supernova remnants(SNRs), pulsar wind nebulae (PWNe), and molecular clouds(MCs; see Hewitt & Lemoine-Goumard2015,
for a review on SNRs and PWNe). Many are observed as
spatially extended with respect to the angular resolution of the instruments. These sources produce γ-ray photons through inverse Compton(IC) scattering off highly relativistic leptons, through bremsstrahlung radiation, or by hadrons interacting with interstellar matter. In many sources, this population of high-energy particles emits GeVγ-rays detectable by the Large Area Telescope (LAT), the primary instrument on the Fermi Gamma-Ray Space Telescope (Atwood et al. 2009). Indeed,
since its launch in 2008, the Fermi-LAT has detected a growing number of spatially extended sources across the sky thanks to its wide field of view (∼2.4 sr) and (primarily) sky-survey operation mode. The Second Fermi-LAT Point Source Catalog (2FGL; Nolan et al.2012) contained 12 extended sources. The
number of extended sources increased to 22 in the First Fermi-LAT Hard Source Catalog, covering nearly 3 yr of data in the range 10–500 GeV (1FHL; Ackermann et al.2013a); then to 25
in the Third Fermi-LAT Point Source Catalog, with 48 months of data in the range 100 MeV–300 GeV (3FGL; Acero et al.
2015); and to 31 in the Second Fermi-LAT Hard Source
Catalog, with 80 months of data above 50 GeV (2FHL;
Ackermann et al.2016). The addition of data and, in the case of
the hard source catalogs, the focus on higher energies where photons are better localized and backgrounds are reduced have amplified the excellent capability of the Fermi-LAT to spatially resolve GeVγ-ray sources.
Accurately estimating the spatial morphology of a γ-ray source is important for several reasons. Finding a coherent source extension across different energy bands can help to associate a Fermi-LAT source with a potential counterpart.
Such multiwavelength studies can also help to determine the emission mechanisms producing these high-energy photons. Due to the energy dependence of the Fermi-LAT point-spread function (PSF), the spatial and spectral characterization of a source cannot be decoupled. An incorrect spatial model will bias the spectral model of the source and vice versa, and it can also skew the spectra of point sources in the vicinity of the extended source.
The 2FHL Catalog analyzed data from 50 GeV to 2 TeV and served to bridge the energy gap between ground-based γ-ray telescopes and the Fermi-LAT. Of the 31 spatially extended sources found in 2FHL, 5 were detected as extended for the first time. The 2FHL showed that several of the extended sources previously identified by the Fermi-LAT using lower-energy data sets displayed a potential change in their best-fit extension and centroid(i.e., the centroids and/or extensions of the 2FHL sources were not compatible within the errors to the corresponding 3FGL source).
In this paper we use 6 yr of Pass 8 data to produce a catalog of extended sources detected by the Fermi-LAT at energies between 10 GeV and 2 TeV at low Galactic latitude(±7° of the Galactic plane). Lowering the energy threshold with respect to 2FHL to 10 GeV maintains a PSF width< and a reduced0 . 2 level of confusion from Galactic diffuse emission while increasing the number of γ-rays available for analysis. The lower energy threshold increases the number of detectable sources compared to 2FHL and permits a more robust
measurement of morphology than (1) lower-energy
Fermi-LAT data selections in regions where diffuse systematics are large and (2) higher-energy Fermi-LAT data selections for sources with fewer detected photons. This paper is the first catalog of extended sources produced with the Fermi-LAT
data, named the Fermi Galactic Extended Source (FGES)
catalog, allowing a thorough study of the properties of the Galactic plane in the sub-TeV domain. The paper is organized
as follows: Section 2 describes the Fermi-LAT and the
observations used, Section3 presents our systematic methods for analyzing spatially extended Fermi-LAT sources in the plane, Section4 discusses the main results, and a summary is provided in Section5.
56
NASA Postdoctoral Program Fellow, USA.
57
Funded by contract FIRB-2012-RBFR12PM1F from the Italian Ministry of Education, University and Research(MIUR).
2.Fermi-LAT Description and Observations 2.1. Fermi-LAT
The Fermi-LAT is aγ-ray telescope that detects photons by conversion into electron–positron pairs in the energy range from 20 MeV to higher than 500 GeV, as described in Atwood et al.(2009). The LAT is composed of three primary
detector subsystems: a high-resolution converter/tracker (for direction measurement of the incident γ-rays), a CsI(Tl) crystal calorimeter (for energy measurement), and an antic-oincidence detector to identify the background of charged particles. Since the launch of the spacecraft in 2008 June, the LAT event-level analysis has been periodically upgraded to take advantage of the increasing knowledge of how the Fermi-LAT functions, as well as the environment in which it operates. Following the Pass 7 data set, released in 2011 August, Pass 8 is the latest version of the Fermi-LAT data. Its development is the result of a long-term effort aimed at a comprehensive revision of the entire event-level analysis and comes closer to realizing the full scientific potential of the
Fermi-LAT (Atwood et al. 2013). Compared to previous
iterations of the Fermi-LAT event-level analysis, Pass 8 provides a greater acceptance and an improved PSF58(with a 68% containment radius smaller than 0°.2 above 10 GeV that is nearly constant with increasing energy), which are two crucial factors for the detection of extended sources.
2.2. Data Selection
We used 6 yr (from 2008 August 4 to 2014 August 4) of Pass 8 SOURCE photons with reconstructed energy in the 10 GeV–2 TeV range. Photons detected at zenith angles larger than 105° were excised to limit the contamination from γ-rays generated by cosmic-ray(CR) interactions in the upper layers of the atmosphere. Moreover, data werefiltered, removing time periods when the instrument was not in sky-survey mode. Fermi Science Tools v10r01p01 and instrument response
functions (IRFs) P8R2_SOURCE_V6 were used for this
analysis. In addition, the analysis was restricted to regions within 7° from the Galactic plane. Figure1shows a count map of the Galactic plane observed by the Fermi-LAT above 10 GeV highlighting large structures with a Gaussian smooth-ing radius of 0°.5. The bright remnants IC 443 (l=189°.06) andγ Cygni (l=78°.15) stand out clearly, but a large number of other sources are also apparent. Several are coincident with higher-energy sources detected by ground-basedγ-ray experi-ments, such as the Kookaburra complex(l=313°.38), and will be discussed in Section4. The large number of sources visible in the map highlights the excellent sensitivity and angular resolution of the Fermi-LAT at high energies afforded by the new Pass 8 data.
3. Detection of New Extended Sources 3.1. Input Source Model Construction
The analysis of the full data set was divided into smaller regions of the sky, each of which must be represented by a spectral and spatial model. For each region, we start with a sky model that includes all pointlike and extended Fermi-LAT sources listed in the 3FGL catalog, the Galactic diffuse and
Figure 1.Smoothed count map in the 10 GeV–2 TeV band represented in Galactic coordinates and Cartesian projection. The image has been smoothed with a Gaussian kernel with a size of 0°.5. The color scale is square root, and the units are counts per (0°.1)2
. White circles indicate the position and extension of the 46 extended sources described in this work. White plus signs mark the location of point sources.
58http://www.slac.stanford.edu/exp/glast/groups/canda/lat_
isotropic emission, and pulsars from the Second Fermi LAT Pulsar Catalog(Abdo et al.2013), as well as from 3FGL. The
energy range used in this work prevents a reasonable fit of a pulsar spectral component modeled by a power law with an exponential cutoff. The bulk of the pulsar emission and the cutoff energy of the pulsar, typically a few GeV, lie below 10 GeV. Therefore, we decided to fit only the normalization and index for pulsars while keeping the cutoff energy as afixed parameter. The Galactic diffuse emission was modeled by the standard Fermi-LAT diffuse emission ring-hybrid model gll_iem_v06.fits (Acero et al. 2016a), and the residual
back-ground and extragalactic radiation were described by a single isotropic component with the spectral shape in the tabulated model iso_P8R2_SOURCE_V6_v06.txt. The models are available from the Fermi Science Support Center (FSSC).59 In the following, we fit the normalizations of the Galactic diffuse and isotropic components.
3.2. Analysis Method
Two different software packages for maximum likelihood fitting were used to analyze Fermi-LAT data: pointlike and gtlike. These tools fit Fermi-LAT data with a parameterized model of the sky, including models for the instrumental, extragalactic, and Galactic components of the background. The
tool pointlike is a software package (Kerr 2010)
validated by Lande et al. (2012) that we used to fit the
positions of pointlike sources in the region of interest (ROI) and fit the spatial parameters of spatially extended sources presented in Section 3.3. The tool gtlike is the standard maximum likelihood method distributed in the Fermi Science Tools by the FSSC. We apply it in binned mode, combining the four P8R2_SOURCE_V6 PSF event types in a joint likelihood function.
In the following analysis, we used pointlike to evaluate the best-fit position and extension, as well as preliminary spectral values, for each new source added in our model. Using those morphologies, we subsequently employed gtlike to obtain the best-fit spectral parameters (initializing spectra at the pointlike-determined values) and statistical significances
(see Section 3.4). Both methods agree with each other for all
derived quantities, but all spectral parameters and significances quoted in the text were obtained using gtlike.
Since the pointlike and gtlike analyses use circular and square ROI geometries, respectively, we included photons within a radius of 10° when using pointlike to characterize the whole ROI and within a 10 ´10 square region centered on the extended source of interest when using gtlike to perform the spectral analysis. Both analyses use an energy binning of 8 bins per decade and the MINUIT60optimizer for likelihoodfitting.
3.3. Localization and Extension
We developed an analysis pipeline, similar to that used in the 2FHL catalog. We describe here this pipeline and present an alternate analysis implemented as a cross-check in the
Appendix. Our pipeline was launched over 216 ROIs of radius 10°, centered on b=0° and ±5° with overlapping neighboring ROIs separated by 5°.0 in Galactic longitude (Figure 2). To
homogenize the analysis, extended sources were all fit
assuming a uniform disk shape. The pipeline included extended sources from the 3FGL catalog, which were initialized at their best-fit disk extension. If the source was previously modeled with a Gaussian shape in the 3FGL catalog, we initialized the disk radius at 1.85sGaussianas suggested by Lande et al.(2012).
If the source was previously modeled with a multiwavelength template, we used the average between the semimajor and semiminor axes, reported in the 3FGL catalog, to initialize the disk radius. In each region the procedure tofind all point and extended sources proceeded as follows usingpointlike.
1. Using the initial sky model defined above, the first step of our pipeline aims tofind the best spectral parameters for all free sources in the region using pointlike. All sources within 5° of the center were set free. The significance of each source was evaluated using the test statisticTS=2 ln( 1-ln0), where and0 are the1
likelihoods of the background (null hypothesis) and the hypothesis being tested (source plus background). The formal statistical significance of this test can be
Figure 2.Schematic representations of the arrangement of the analysis regions for the two pipelines used for localization and extension. Left: description of the main pipeline, defined in Section3.3; each ROI(solid blue circle) of radius 10° is centered on b= and ±5° and separated from its neighboring ROIs (orange circles) by0 5° in Galactic longitude; all sources within 5° of the center (dashed circle with the same color) were set free for the primary pipeline. Right: details of the secondary pipeline described in theAppendix: each ROI(marked by a solid blue circle) of radius 10° is centered on b= and separated from its neighbors (orange circles) by0 5° in Galactic longitude.
59
http://fermi.gsfc.nasa.gov/ssc/
60
For more information about MINUIT seehttp://lcgapp.cern.ch/project/ cls/work-packages/mathlibs/minuit/doc/doc.html.
obtained from Wilks’s theorem (Wilks1938). In the null
hypothesis, TS follows ac distribution with n degrees of2
freedom, where n is the number of additional parameters in the model. At each step in the procedure, sources with TS<16 were removed from the model.
2. Due to the 6 yr of integration time for our analysis compared to the 4 yr for the 3FGL catalog, we expected tofind new statistically significant sources (TS > 16). To
detect these new sources, we generated a TS map for a point source with a power-law spectral index of 2.0 including all significant 3FGL sources in the background model. The TS map covered 7 ´ length with 07 °.1 pixels. We added a source at the location of every peak with TS above 16 that was separated by more than 0°.2 from another peak in the TS map(or source in the region) and then fit them iteratively for extension starting from
Table 1
Best-fitting Morphological Parameters of the Extended Sources Detected above 10 GeV
FGES Name TS TSext TS2pts R.A. Decl. Extensionσ
(deg) (deg) (deg)
J0427.2+5533 192 160 21 66.822±0.043 55.552±0.053 1.52±0.03±0.08 J0537.6+2751 35 17 9 84.407±0.057 27.859±0.056 1.39±0.02±0.09 J0617.2+2235 831 572 177 94.309±0.008 22.584±0.008 0.34±0.01±0.01 J0619.6+2229 68 49 21 94.653±0.040 22.484±0.028 0.96±0.03±0.05 J0822.1−4253 374 198 193 125.545±0.016 −42.888±0.019 0.44±0.01±0.01 J0830.3−4453 80 23 7 127.588±0.041 −44.885±0.025 0.22±0.03±0.02 J0832.0−4549 69 41 0 128.008±0.044 −45.813±0.046 0.61±0.04±0.05 (6/8) J0851.9−4620 808 728 394 132.987±0.021 −46.342±0.016 0.98±0.01±0.01 J1023.3−5747 144 41 20 155.828±0.021 −57.794±0.024 0.28±0.02±0.06 J1036.3−5834† 281 265 18 159.094±0.049 −58.563±0.042 2.47±0.06±0.06 J1109.4−6115† 141 134 24 167.362±0.046 −61.259±0.042 1.27±0.03±0.08 J1213.3−6240 105 66 34 183.346±0.014 −62.688±0.032 0.33±0.03±0.05 J1303.5−6313 93 30 15 195.876±0.021 −63.224±0.023 0.33±0.02±0.01 J1355.1−6420 84 41 11 208.802±0.026 −64.345±0.023 0.41±0.02±0.01 J1409.1−6121† 237 152 23 212.285±0.020 −61.355±0.022 0.73±0.02±0.06 J1420.3−6047 77 32 26 215.082±0.013 −60.782±0.011 0.12±0.01±0.01 J1443.2−6227 122 85 18 220.797±0.025 −62.460±0.024 0.37±0.02±0.01 J1507.6−6228 104 34 17 226.984±0.031 −62.467±0.024 0.36±0.02±0.03 J1514.3−5910 517 233 135 228.572±0.014 −59.163±0.012 0.24±0.01±0.01 J1552.9−5610 435 142 39 238.219±0.014 −56.166±0.015 0.25±0.01±0.01 J1553.8−5325† 192 154 17 238.456±0.024 −53.424±0.026 0.52±0.02±0.09 J1615.4−5153 302 242 79 243.849±0.021 −51.881±0.024 0.41±0.02±0.06 J1617.3−5054 294 214 37 244.328±0.021 −50.909±0.019 0.48±0.02±0.01 J1631.7−4756 31 16 9 247.925±0.023 −47.944±0.022 0.26±0.02±0.08 J1633.0−4746 181 146 17 248.259±0.018 −47.771±0.025 0.61±0.02±0.12 J1636.3−4731 71 17 8 249.080±0.020 −47.522±0.022 0.14±0.02±0.02 J1652.2−4633† 255 212 68 253.055±0.025 −46.556±0.022 0.72±0.02±0.04 J1655.6−4738† 46 27 2 253.886±0.030 −47.638±0.031 0.33±0.03±0.13 J1713.7−3945 321 255 48 258.433±0.018 −39.760±0.019 0.55±0.02±0.01 J1714.3−3823 139 46 44 258.569±0.021 −38.391±0.017 0.26±0.02±0.01 J1745.8−3028† 96 78 26 266.453±0.031 −30.475±0.028 0.53±0.02±0.26 (4/8) J1800.6−2343 723 588 140 270.144±0.022 −23.716±0.018 0.64±0.01±0.03 J1804.8−2144 463 351 96 271.197±0.017 −21.732±0.017 0.38±0.02±0.01 J1825.2−1359 240 235 30 276.296±0.035 −13.992±0.033 1.05±0.02±0.25 J1834.8−0848 133 76 24 278.694±0.020 −8.798±0.022 0.29±0.02±0.01 J1834.1−0706 110 59 29 278.529±0.018 −7.109±0.018 0.21±0.02±0.01 J1836.5−0652 251 207 50 279.143±0.032 −6.866±0.034 0.54±0.05±0.06 J1839.0−0704 117 99 45 279.745±0.027 −7.067±0.032 0.52±0.02±0.02 J1839.4−0554 115 104 20 279.856±0.024 −5.908±0.025 0.41±0.02±0.05 J1841.4−0514 157 126 15 280.347±0.027 −5.235±0.025 0.47±0.02±0.01 J1856.3+0122 232 127 68 284.066±0.023 1.369±0.021 0.38±0.02±0.03 J1857.8+0246 86 65 12 284.449±0.027 2.774±0.042 0.61±0.03±0.06 J1923.3+1408 349 222 67 290.825±0.012 14.139±0.014 0.29±0.01±0.01 J2020.8+4026 338 263 51 305.204±0.020 40.443±0.018 0.58±0.01±0.02 J2026.1+4111 134 125 36 306.534±0.041 41.190±0.036 1.37±0.02±0.26 (6/8) J2302.0+5855 54 26 16 345.494±0.026 58.920±0.023 0.25±0.02±0.01 Note.Results of the maximum likelihood spatialfits for LAT-detected extended sources. Column (2) lists the TS of the source assuming that it is spatially extended with a disk spatial model whose position and extension are provided in columns(5), (6) (in equatorial coordinates in J2000 epoch), and (7). Column (3) provides the TSextvalue, which is twice the logarithm of the likelihood ratio of an extended to a point source, as defined in Section3.3. Thefirst error on the disk extension σ is
statistical, and the second is systematic. The systematic errors of three sources were computed using only a fraction of the eight alternate IEMs since the likelihood maximization had convergence problems for the other IEMs. The number of alternate diffuse models used is given in parentheses in column(7). Sources flagged with † are confused or contaminated by the diffuse background in complex regions.
the brightest one. This means that all extended sources detected by our pipeline must befirst detected as a point source with a TS higher than 16. This is a limit of the method employed here, and we can expect that very extended sources where the surface brightness is too faint will not be detected here. If the TS of an added source became smaller than 16 during the iterative process, the source was removed and the localization, extension, and spectrum of all sources located within 0°.5 were refit
(including the localization of 3FGL sources). The threshold to define a source as extended is set as TSext16, where TSext=2 ln(ext ps) (Lande et al.
2012), i.e., twice the logarithm of the likelihood ratio of
an extended to a point source. The choice of a threshold TSextset to 16 corresponds to a formal 4s significance.61 Table 2
Best-fit Spectral Parameters for the Extended Sources Detected above 10 GeV
FGES Name TScurve Spectral Flux Spectral
Form (× 10−10cm−2s−1) Index J0427.2+5533 1 PL 6.67±0.64±0.20 1.91±0.09±0.02 J0537.6+2751 2 PL 3.15±0.62±0.60 2.10±0.17±0.05 J0617.2+2235 1 PL 23.43±1.18±0.20 2.55±0.08±0.03 J0619.6+2229 3 PL 4.30±0.69±0.09 2.08±0.15±0.08 J0822.1−4253 1 PL 6.59±0.57±0.09 2.40±0.12±0.02 J0830.3−4453 1 PL 1.89±0.34±0.09 2.80±0.30±0.08 J0832.0−4549 1 PL 2.72±0.48±0.12 1.80±0.14±0.13 J0851.9−4620 8 PL 17.23±1.14±1.10 1.83±0.03±0.07 J1023.3−5747 1 PL 4.23±0.50±0.32 2.26±0.15±0.02 J1036.3−5834† 11 PL 29.11±1.88±1.77 2.08±0.06±0.07 J1109.4−6115† 2 PL 10.58±1.02±0.63 2.14±0.09±0.04 J1213.3−6240 1 PL 3.37±0.45±0.07 2.53±0.20±0.02 J1303.5−6313 5 PL 3.52±0.50±0.51 1.81±0.11±0.04 J1355.1−6420 4 PL 1.78±0.32±0.20 1.44±0.12±0.29 J1409.1−6121† 2 PL 16.45±1.24±1.02 2.38±0.10±0.02 J1420.3−6047 3 PL 3.19±0.43±0.68 1.92±0.12±0.03 J1443.2−6227 2 PL 2.46±0.30±0.09 1.75±0.08±0.10 J1507.6−6228 1 PL 2.28±0.28±0.36 1.98±0.09±0.17 J1514.3−5910 3 PL 7.69±0.50±0.17 1.97±0.05±0.06 J1552.9−5610 2 PL 5.95±0.51±0.03 2.44±0.12±0.04 J1553.8−5325† 4 PL 11.75±1.01±0.24 2.45±0.12±0.01 J1615.4−5153 5 PL 9.88±0.79±1.26 2.02±0.08±0.03 J1617.3−5054 2 PL 14.70±1.06±0.32 2.08±0.07±0.01 J1631.7−4756 2 PL 4.19±0.84±0.37 1.74±0.12±0.12 J1633.0−4746 2 PL 18.51±0.14±0.37 2.25±0.01±0.10 J1636.3−4731 1 PL 4.30±0.17±1.44 2.73±0.04±0.05 J1652.2−4633† 1 PL 11.95±0.97±1.74 2.07±0.08±0.03 J1655.6−4738† 6 PL 2.11±0.41±0.11 2.31±0.22±0.16 J1713.7−3945 10 PL 11.69±0.91±0.86 1.85±0.07±0.02 J1714.3−3823 2 PL 6.08±0.68±0.70 2.41±0.15±0.08 J1745.8−3028† 2 PL 7.53±0.92±0.71 2.09±0.13±0.03 J1800.6−2343 2 PL 27.47±1.08±0.71 2.42±0.04±0.03 J1804.8−2144 7 PL 15.55±0.62±0.60 1.99±0.04±0.05 J1825.2−1359 21 LogP 19.59±0.14±0.22 1.30±0.10±0.40 J1834.8−0848 4 PL 7.43±0.79±0.12 2.04±0.09±0.03 J1834.1−0706 1 PL 5.37±0.66±0.78 2.28±0.14±0.04 J1836.5−0652 9 PL 17.98±1.31±1.72 2.10±0.07±0.03 J1839.0−0704 11 PL 9.02±0.99±0.39 1.90±0.08±0.07 J1839.4−0554 1 PL 8.39±0.94±0.81 1.98±0.09±0.04 J1841.4−0514 4 PL 9.48±0.91±0.92 2.03±0.09±0.06 J1856.3+0122 1 PL 10.44±0.92±1.33 3.17±0.20±0.14 J1857.8+0246 2 PL 7.83±1.01±1.39 2.02±0.11±0.26 J1923.3+1408 1 PL 12.52±0.97±0.97 2.46±0.11±0.17 J2020.8+4026 1 PL 13.22±0.81±0.29 2.15±0.07±0.02 J2026.1+4111 7 PL 15.80±1.32±5.73 2.38±0.10±0.10 J2302.0+5855 1 PL 1.26±0.25±0.04 2.03±0.20±0.04 Note.Results of the maximum likelihood spectralfits for LAT-detected extended sources. These results are obtained assuming the best disk parameters reported in Table1. Columns(2), (4), and (5) report TScurve, the integratedflux, and the photon index of the source fit in the energy range from 10 GeV to 2 TeV. The first error
on the integratedflux and photon index is statistical, and the second is systematic. Column (3) lists the spectral form used (PL= power law, LogP=LogParabola). J1825.2−1359 is the only source modeled with a LogP, and its associated beta value is 0.27 ± 0.05 ± 0.07. Sources flagged with † are confused or contaminated by the diffuse background in complex regions.
61
Using 20,000 statistically independent simulations, Lande et al. (2012) showed that the cumulative density of TSextfollows ac distribution with one2
If this threshold was met, then the disk-modeled source was kept in the ROI. We stopped adding sources when the source TS was less than 16.
3. Again, due to the different integration time and energy range, we might see variations in morphology for already-detected extended sources. The spatial and spectral parameters of all 3FGL sources are therefore refit once these new point sources and extended sources are added in the source model of each region.
4. As a last step, to address the ambiguity of detecting a source as spatially extended as opposed to a combination of point sources, we utilized the algorithm detailed in Lande et al. (2012) to simultaneously fit the spectra and
positions of two nearby point sources. To help with convergence, it begins by dividing the extended source into two spatially coincident pointlike sources and then fitting the sum and difference of the positions of the two sources without any limitations on thefit parameters. We
Table 3
Best-fitting Morphological and Spectral Parameters for the Systematic Study Using a Gaussian Fit
FGES Name R.A. Decl. σ Flux Spectral Index
(deg) (deg) (deg) (× 10−10cm−2s−1)
J0427.2+5533 66.95±0.11 55.35±0.10 0.92±0.03 8.16±0.76 1.93±0.08 J0537.6+2751 84.41±0.18 27.76±0.15 0.71±0.09 2.74±0.53 2.03±0.09 J0617.2+2235 94.31±0.01 22.57±0.01 0.18±0.01 24.05±1.26 2.56±0.08 J0619.6+2229 94.56±0.07 22.53±0.07 0.54±0.05 4.45±0.85 2.01±0.15 J0822.1−4253 125.65±0.03 −42.88±0.02 0.24±0.02 6.97±0.58 2.38±0.06 J0830.3−4453 127.65±0.04 −44.88±0.04 0.17±0.03 2.14±0.54 2.85±0.06 J0832.0−4549 127.97±0.07 −45.81±0.07 0.48±0.04 4.12±0.57 1.90±0.05 J0851.9−4620 132.86±0.05 −46.34±0.05 0.72±0.03 20.29±1.51 1.85±0.02 J1023.3−5747 155.84±0.02 −57.75±0.02 0.16±0.02 4.86±0.53 2.23±0.10 J1036.3−5834† 158.94±0.06 −58.77±0.06 1.57±0.06 36.27±2.57 2.10±0.04 J1109.4−6115† 166.90±0.08 −61.20±0.07 0.88±0.05 14.46±1.17 2.17±0.04 J1213.3−6240 183.28±0.03 −62.69±0.03 0.18±0.02 3.83±0.50 2.60±0.16 J1303.5−6313 195.84±0.03 −63.20±0.03 0.19±0.02 4.02±0.55 1.81±0.10 J1355.1−6420 208.75±0.03 −64.44±0.03 0.22±0.03 1.80±0.24 1.44±0.03 J1409.1−6121† 212.37±0.030 −61.31±0.03 0.51±0.02 20.63±1.52 2.36±0.09 J1420.3−6047 215.07±0.02 −60.77±0.02 0.11±0.02 4.54±0.26 1.99±0.08 J1443.2−6227 220.80±0.03 −62.41±0.03 0.19±0.02 2.46±0.21 1.72±0.04 J1507.6−6228 226.92±0.04 −62.44±0.04 0.25±0.04 2.41±0.27 2.03±0.03 J1514.3−5910 228.55±0.01 −59.17±0.01 0.13±0.01 7.68±0.51 1.97±0.02 J1552.9−5610 238.18±0.02 −56.18±0.02 0.14±0.01 6.01±0.51 2.43±0.11 J1553.8−5325† 238.50±0.03 −53.44±0.03 0.35±0.02 15.43±1.22 2.41±0.10 J1615.4−5153 243.77±0.03 −51.86±0.03 0.34±0.03 12.72±0.98 2.00±0.07 J1617.3−5054 244.27±0.03 −50.93±0.02 0.30±0.01 17.22±1.22 2.12±0.07 J1631.7−4756 247.96±0.03 −47.98±0.03 0.14±0.03 5.61±0.34 1.82±0.12 J1633.0−4746 248.40±0.03 −47.71±0.03 0.44±0.03 22.13±1.77 2.28±0.03 J1636.3−4731 250.16±0.04 −46.57±0.04 0.05±0.01 5.22±0.45 2.02±0.02 J1652.2−4633† 253.09±0.01 −46.50±0.01 0.48±0.03 15.32±1.02 2.08±0.02 J1655.6−4738† 253.93±0.06 −47.65±0.06 0.29±0.06 2.48±0.45 2.31±0.07 J1713.7−3945 258.39±0.03 −39.82±0.03 0.41±0.01 14.11±1.14 1.91±0.06 J1714.3−3823 258.57±0.02 −38.42±0.02 0.14±0.02 6.46±0.71 2.42±0.11 J1745.8−3028† 266.52±0.04 −30.43±0.04 0.26±0.02 7.29±0.87 2.09±0.06 J1800.6−2343 270.17±0.02 −23.73±0.02 0.37±0.02 30.55±1.17 2.41±0.04 J1804.8−2144 271.20±0.02 −21.74±0.02 0.24±0.02 17.76±0.96 2.01±0.02 J1825.2−1359 276.33±0.05 −13.97±0.05 0.79±0.04 29.45±1.99 1.54±0.08 J1834.8−0848 278.67±0.02 −8.78±0.03 0.15±0.02 8.15±0.84 2.04±0.06 J1834.1−0706 278.53±0.02 −7.11±0.02 0.15±0.02 5.10±0.77 2.39±0.11 J1836.5−0652 279.10±0.03 −6.87±0.03 0.38±0.02 23.30±1.73 2.12±0.05 J1839.0−0704 279.75±0.04 −7.04±0.04 0.37±0.03 9.13±1.18 1.94±0.06 J1839.4−0554 279.90±0.03 −5.90±0.03 0.25±0.02 9.02±1.05 2.03±0.06 J1841.4−0514 280.31±0.04 −5.22±0.03 0.31±0.03 10.90±1.09 2.04±0.07 J1856.3+0122 283.99±0.02 1.42±0.02 0.21±0.02 11.17±0.98 3.17±0.20 J1857.8+0246 284.40±0.04 2.80±0.04 0.32±0.03 8.25±0.98 2.02±0.07 J1923.3+1408 290.81±0.01 14.14±0.01 0.17±0.01 13.17±1.05 2.54±0.12 J2020.8+4026 305.21±0.02 40.46±0.02 0.35±0.01 16.34±1.03 2.21±0.03 J2026.1+4111 307.16±0.07 41.45±0.07 1.29±0.06 35.95±2.59 2.40±0.03 J2302.0+5855 345.53±0.03 58.89±0.03 0.14±0.02 1.32±0.27 2.05±0.17 Note. Results of the maximum likelihood spatial and spectralfits for LAT-detected extended sources using a Gaussian spatial model. The position and extension of the Gaussian are provided in columns(2), (3) (in equatorial coordinates in J2000 epoch), and (4). The error quoted is only statistical. The sigma value for a disk is expected to be a factor of 1.85 larger than the sigma for a 2D Gaussianfit to the same source (Lande et al.2012). J1825.2−1359 is the only source modeled with a LogP, and its associated beta value is 0.23±0.05. Sources flagged with † are confused or contaminated by the diffuse background in complex regions.
only considered a source to be extended if TSext>TS2pts
(improvement when adding a second point source defined as TS2pts =2 ln(2pts ps)). If an extended source did not
meet this criterion, it was then replaced by two point sources located at the best positions found by the above algorithm. It should be noted that TS2pts cannot be
quantitatively compared to TSextusing a simple likelihood
ratio test to evaluate which model is preferred because the models are not nested. As an alternative, we can consider the Akaike information criterion test(AIC; Akaike1974).
The AIC is defined asAIC=2k-2 ln , where k is the number of parameters in the model. In this formulation, the best hypothesis is considered to be the one that minimizes the AIC. The two pointlike sources hypothesis has three more parameters than the single extended source hypoth-esis (two more spatial parameters and two more spectral parameters compared to one extension parameter), so the comparison AICext<AIC2pts is formally equivalent to
TSext +6>TS2pts. This means that our criterion is more
restrictive than the AIC test. It was extensively tested in Lande et al. (2012) using simulations showing that
TSext >TS2ptsis a powerful test to avoid cases of simple
confusion of two pointlike sources. But it could always be
the case that an extended source is actually the super-position of multiple pointlike or extended sources that could be resolved with deeper observations of the region. 5. When the sky model was complete, all new sources were tested for spectral curvature using a lognormal model (referred to as LogParabola or LogP with a curvature noted β). We assessed the significance of the spectral curvature for a given source by TScurve=2 ln(LogP PL). Since
the power law is a special case of LogParabola (with β=0) and β=0 is inside the allowed interval, we expect that TScurve is distributed as c with one degree of2
freedom. We switched to LogParabola and refit the ROI if TScurve >16, corresponding to 4σ significance for the curvature. Only one extended source shows such curvature.
6. To complete the construction of the source model of the region, we take the output of the previous steps for the four surrounding ROIs plus the ROI of interest as defined in color in the left panel of Figure2 using a 10° radius centered on a Galactic latitude of b=0°. Sources
appearing in multiple ROIs are defined using the
parameters obtained in the closest ROI center. We refit the spatial parameters of any previously added extended sources within 5° of the center (starting from the highest
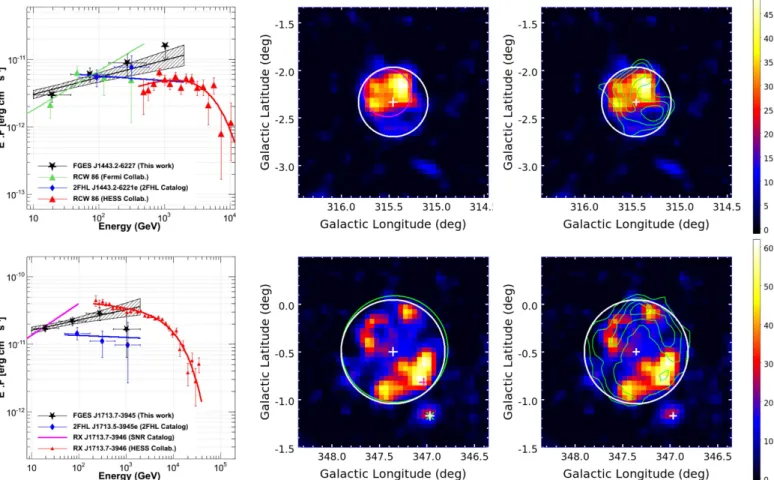
Figure 3.Spectral(left) and spatial (middle and right) properties of the extended sources associated with W41 (top) and the SNR Vela Junior (bottom). Left: SEDs with data points from this analysis(black stars and dashed butterfly), from the SNR catalog (purple line; Acero et al.2016b), from the 2FHL catalog (blue diamonds and line), from a previous Fermi-LAT publication (green line; H.E.S.S. Collaboration et al.2015), and from IACT data (red triangles and line; H.E.S.S. Collaboration et al.2015; Aharonian et al.2007c, for W41 and Vela Junior, respectively). Middle: background-subtracted TS map with the Galactic diffuse and isotropic emission and surrounding point sources included in the model to highlight the location of emission coming from the extended source. White circles and central plus signs indicate the disk extension and centroid asfit in this work, respectively. Green and purple markings present the position of pointlike and extended sources published in the 3FGL and 2FHL catalogs, respectively. The yellow dashed circle in the bottom left corner of the top middle panel illustrates the PSF size of the instrument for the analysis carried out in this article. Right: same TS map, but with IACT contours(green, from the above-quoted references) overlaid.
TS value), as well as the spectra of sources in this region, while all other sources in the ROI werefixed. This allows a direct comparison of the two pipelines since the size, location, and free radius of the regions are then identical. This analysis detected 51 sources with TSext> 16, TS > 25,
and TSext > TS2pts. Spectral and spatial parameters for the
detected extended sources are compatible in both the analysis described above and the secondary pipeline described in the
Appendix, in most cases. Only two detected sources were rejected: one undetected by the main pipeline, and another one undetected by the secondary pipeline. They are discussed
in the Appendix. The morphological results derived by
pointlike for the 46 sources that also pass the same TS criteria as gtlike (see below) are presented in Table 1. It should be noted that thefinal list of point sources detected by our two pipelines agrees perfectly with that reported by the
3FHL catalog in the latitude range 7 (Fermi LAT
Collaboration 2017) using 27 spatial templates derived in this
analysis (either when the extended source is newly detected here or when the model provides a better representation of the source). The point sources not detected by our pipeline (less than 10%) are all low-TS sources (close to our threshold of 25) and can be explained by the reduced data set and binned analysis used here.
3.4. Spectra
The Fermi-LAT spectra of the detected extended sources
were derived by gtlike assuming the best uniform disk
extension found bypointlike in Section3.3. Thegtlike analysis was used tofit the spectral parameters of each source, but also its associated TS, TSext, TS2pts, and TScurve. Since
gtlike makes fewer approximations in calculating the likelihood, spectral parameters found withgtlike are slightly more accurate, and this cross-check is extremely useful. Only three sources were rejected at this step because they did not meet the threshold in terms of TS, TSext, or TS2pts:
1. The Crab Nebula, which is detected with a TSextof 30 for
an extension of 0°.03 with pointlike and 0 with
gtlike. This discrepancy can be explained by the complexity of fitting the nebula simultaneously to its associated pulsar. In this case, the extension found by pointlike is not preferred by gtlike over a simple point source.
2. HESS J1640−465, which is detected with a TSext of 18
for an extension of 0°.08±0°.02 with pointlike and only 10 withgtlike; Lemoine-Goumard et al. (2014)
reported a Gaussian size for this source of 0°.07 (with a TSext value of only 6), equivalent to a disk size of 0°.13
above 3 GeV. This radius is larger than the disk size
Figure 4.Extended sources associated with the SNR RCW 86(top) and RXJ1713.7−3946 (bottom) following conventions of Figure3and identical references for the 2FHL and SNR catalogs. Left: SEDs of the extended sources with data points from this analysis(black stars and dashed butterfly), from the SNR catalog (purple line), from the 2FHL catalog (blue diamonds and line), from a previous Fermi-LAT publication (green triangles and line; Ajello et al.2016), and from IACT data (red triangles and line; Aharonian et al.2009,2007b, for RCW 86 and RX J1713.7−3946, respectively). Middle and right: background-subtracted TS maps using the same conventions as in Figure3and above-quoted references for the IACT contours shown in green. White circles and central plus signs indicate the disk extension and centroid asfit in this work, respectively. In the top middle panel, the gray circle corresponds to the extension found in Ajello et al. (2016).
reported here using pointlike and may explain the low TS value obtained in ourgtlike analysis since we fixed the extension value obtained with pointlike. 3. An unidentified source detected at (l, b)=(292°.05,
2°.66) for which the gtlike calculated TS2ptsis greater
than TSext.
All TS values for the remaining 46 sources are presented in Table1, while their spectral parameters are listed in Table2. In addition to performing a spectral fit over the entire energy range, we computed a spectral energy distribution (SED) by fitting the flux of the source independently in four energy bins spaced uniformly in log space from 10 GeV to 2 TeV. During thisfit, we fixed the spectral index of the source at 2, as well as the model of background sources to the bestfit obtained in the whole energy range except the Galactic diffuse background and the prefactor of sources closer than 5°. We defined a detection in an energy bin when TS and otherwise computed a 95%4 confidence level flux upper limit. The upper limit is obtained by looking for 2Δln(likelihood)=4 when increasing the flux from the maximum likelihood value if the TS value of the source is larger than 1. Whenever TS< 1, we switched to the Bayesian method proposed by Helene(1983).
3.5. Systematic Errors
Three main systematic uncertainties can affect the extension fit and the spectra of the detected extended sources:
uncertainties in our model of the Galactic diffuse emission, uncertainties on the shape of the extended source, and uncertainties in our knowledge of the Fermi-LAT IRFs. This last contribution was estimated using custom IRFs chosen to maximize and minimize effective area and PSF within their systematic uncertainty bands.62Then, to explore the systematic effects on our sources’ fitted properties caused by interstellar emission modeling, we have followed the prescription devel-oped in Acero et al.(2016b). Each extended source was refit
using eight alternate interstellar emission models(IEMs), and for each fitted parameter P (namely, the disk extension, the integrated flux above 10 GeV, and the spectral index), we obtained a set of eight values Pithat we compared to the value obtained with the standard model PSTDfollowing Equation(5) in Acero et al.(2016b). The corresponding systematic error for
each source and for these three parameters is reported in Tables 1 and 2. We encountered convergence issues when fitting the extension of three sources with a fraction of the eight alternate diffuse models: the source at the Galactic center FGES J1745.8−3028, the Cygnus cocoon FGES J2026.1+4111, and FGES J0832.0−4549 in the region of Vela-X. The number of alternate diffuse models used is written in parentheses in column (7) of Table1 for these three cases. Finally, as noted
Figure 5.Extended sources associated with the PWNe HESSJ1303−631 (top) and MSH 15−52 (bottom) following conventions of Figure3. Left: SEDs of the extended sources with data points from this analysis(black stars and dashed butterfly), from the 2FHL catalog (blue diamonds), and from IACT data (red line; H.E.S. S. Collaboration et al.2012; Aharonian et al.2005, for HESS J1303−631 and MSH 15−52, respectively). Middle and right: background-subtracted TS maps using the same conventions as in Figure3and above-quoted references for the IACT contours shown in green. White circles and central plus signs indicate the disk extension and centroid asfit in this work, respectively.
62
Seehttps://fermi.gsfc.nasa.gov/ssc/data/analysis/LAT_caveats.html. The uncertainty in the IRFs does not affect the spectra by more than 5% and can be safely neglected in this study.
above, the imperfect knowledge of the true γ-ray morphology introduces a last source of error. To provide a feeling of the influence of the assumed source shape, we refitted all sources using a 2D Gaussian model. This spatial model does not offer a good representation for shell-type SNRs such as RX J1713.7 −3946 but is well adapted to PWN-type sources for which the γ-ray signal is expected to be visible up to large distances. Table3gives the morphological and spectral parameters of this Gaussianfit. Please note that all errors are statistical only since this table is only provided as a cross-check. It is clear from this table that the majority of the extended sources are very stable with respect to the assumed shape except confused sources and/or very large sources.
4. Discussion
We detected 46 statistically significant spatially extended Fermi-LATγ-ray sources, as well as 162 pointlike sources in the latitude range, as can be seen in Figure7 1. The results of the spatial and spectral analyses for the extended sources are shown in Tables 1 and 2. Among these extended sources, 16 are new, 13 are in agreement with previous publications, and 17 have a different morphology (we defined the criterion for significant difference with respect to previously published
values as FGES Published 2 FGES
2
Published 2
s s
D - > ( + ) , σ being
the uncertainty on the parameter of interest). In the latitude interval covered by our search, only four Galactic sources
already detected as significantly extended in previous works are not detected in this work: HB21, HB3, HB9, and W3. These four sources are also not detected in the 3FHL catalog(Fermi LAT Collaboration2017) using their associated morphological
templates.
4.1. Agreement with Previous Publications
The 13 sources in agreement with previous publications are as follows.
1. FGES J0617.2+2235 (associated with the SNR IC 443),
2. FGES J0851.9−4620 (associated with the SNR Vela
Junior),
3. FGES J0822.1−4253 (associated with Puppis A), 4. FGES J1303.5−6313 (associated with HESS J1303−631),
5. FGES J1355.1−6420 (associated with the PWN HESS
J1356−645),63
6. FGES J1443.2−6227 (associated with the SNR RCW 86), 7. FGES J1514.3−5910 (associated with MSH 15−52), 8. FGES J1552.9−5610 (associated with MSH 15−56), 9. FGES J1615.4−5153 (associated with HESS J1614−518),
10. FGES J1713.7−3945 (associated with the SNR
RX J1713.7−3946),
Figure 6.Extended sources associated with the PWN HESSJ1356−645 (top) and the SNR γ Cygni (bottom) following conventions of Figure3. Left: SEDs with data points from this analysis(black stars and dashed butterfly), from the 2FHL catalog (blue diamonds and line), from a previous Fermi-LAT publication (in green; Acero et al.2013), and from IACT data (red triangles and line; H.E.S.S. Collaboration et al.2011a; Aliu et al.2013, for HESS J1356−645 and γ Cygni, respectively). Middle and right: background-subtracted TS maps using the same conventions as in Figure3and above-quoted references for the IACT contours shown in green and SNR catalog disk size in gray(bottom). White circles and central plus signs indicate the disk extension and centroid as fit in this work, respectively.
63
A typo was recently discovered in the disk extension value reported in Table 5 of Ackermann et al.(2016) and in its associated fits file. An erratum is being prepared quoting a value of 0°.41 for this source.
11. FGES J1834.8−0848 (associated with W41),
12. FGES J1834.1−0706 (associated with the SNR G24.7+0.6), 13. FGES J2020.8+4026 (associated with γ Cygni).
Figures 3–6 (top) provide the background-subtracted TS
maps(i.e., TS maps with all components other than the source included in the model) and SEDs for eight that are detected at TeV energies, showing an excellent agreement with the results obtained by the H.E.S.S. experiment. The complete shells of RX J1713.7−3946 and Vela Junior appear in the background-subtracted TS maps, while RCW 86 presents a brighter emission on the northern part of the remnant where fast shocks and a low-density medium have been measured by Vink et al. (2006), Helder et al. (2009), and Yamaguchi et al. (2008). The
GeV extension of the PWN HESS J1303−631 seems to be in slight disagreement with the previously published value; however, it is consistent within the large uncertainties of 0 . 09 stat 0 . 10syst derived at that time with only 45 months of
data. The region including FGES J1834.1−0706 (close to the
H.E.S.S. source HESS J1837−069) is described in
Section 4.2.4, while the region of the SNR IC 443 and its surroundings is discussed in Section4.3.
1. The SNRγ Cygni (FGES J2020.8+4026): γ Cygni (SNR G78.2+2.1) is a nearby (∼1.7 kpc) middle-aged SNR already detected by Fermi-LAT in different energy bands (Ackermann et al.2016; Acero et al.2016b). Our analysis
is in perfect agreement with previous publications of the SNR. It still shows a much higherflux in comparison to the TeV signal detected by VERITAS from VER J2019 +407 above 300 GeV, as can be seen in Figure6(bottom
left). The TeV signal is more compact (Figure5, middle and right) and coincides with the brightest part of the northern radio shell, opposite to molecular material locations(Aliu et al. 2013). VER J2019+407ʼs nature
and relationship to the emission detected by Fermi-LAT
Figure 8.Left: SEDs of the pulsar wind nebula Vela-X with data points from this analysis(black stars and dashed butterfly), from the 2FHL catalog (blue diamonds and line), from a previous Fermi-LAT publication (green triangles and line; Grondin et al.2013), and from IACT data (dotted red and dashed pink lines for the inner and outer emissions, respectively; Abramowski et al.2012). Middle and right: background-subtracted TS maps of Vela-X using the same conventions as in Figure3 and above-quoted references for the TeV contours shown in green. Middle: the extent of Vela-X(fit as an elliptical Gaussian) presented in the previous publication is shown with a yellow dashed ellipse. Right: the contours of the radio and IACT emission are shown in cyan(Grondin et al.2013) and green, respectively. White circles and plus signs indicate the disk extension and centroidfit in this work, respectively, for Vela-X (FGES J0832.0−4549 labeled as A), as well as for the nearby source FGES J0830.3−4453 (labeled as B).
Figure 7.Left: SEDs of the unidentified source HESSJ1841−055 with data points from this analysis (black and gray dashed butterflies for FGES J1839.4−0554 and FGES J1841.4−0514, respectively), from the 2FHL catalog (blue diamonds and line), and from IACT data (red line; Aharonian et al.2008). The black stars represent the sum of the emission of the two coincident extended sources obtained from this analysis. Middle and right: background-subtracted TS maps of HESSJ1841−055 using the same conventions as in Figure3and above-quoted references for the IACT contours shown in green. White circles and central plus signs indicate the disk extension and centroid as fit in this work, respectively. The letters A, B, C, and D indicate the FGES sources FGES J1841.4−0514, FGES J1839.4−0554, FGESJ1836.5−0652, and FGES J1839.0−0704, respectively.
thus remain unclear and extremely puzzling since VERITAS should in principle see emission from the majority of the SNR according to the new spectrum derived in this analysis for a uniform disk encompassing the whole shell, as already stated by Weinstein (2015).
Interestingly, a recent publication by Fraija & Araya
(2016) shows that the Fermi-LAT spectrum on VER
J2019+407 alone is harder than the rest of the shell, with indices 1.8 below a break energy of 71 GeV and 2.5 above the break. A detailed spectrally resolved morpho-logical analysis of the Fermi-LAT emission is required to better constrain the model parameters and the nature of the radiation.
4.2. Differences with Previous Publications
Differences between this work and previous publications can be explained in four ways: use of a different morphological template to model the extended source, use of a different energy threshold, improvements in analysis methods and/or increased statistics, and ambiguities from source confusion and contamination.
4.2.1. Effect of the Morphological Template
Previous publications on Fermi-LAT sources used various spatial templates other than a uniform disk: Gaussian, elliptical disk, elliptical Gaussian, or templates derived from multi-wavelength data. For this reason, it is not a surprise that the results presented in this work differ for such sources.
1. HESS J1841−055 (FGES J1839.4−0554 and FGES J1841.4 −0514): The highly extended TeV source HESS J1841 −055, discovered during the H.E.S.S. Galactic Plane Survey (Aharonian et al. 2008), was previously analyzed assuming
the published morphology, an elliptical Gaussian with extensions of 0°.41 and 0°.25 (Acero et al. 2013). In this
new work, it is detected as two separate disks whose origin and real separation remain unclear since both γ-ray components present the same spectral shape as can be seen in Figure7(left). One of these two components, FGES J1841.4
−0514, is in very good agreement with the source named Fermi J1841.1−0458 by Yeung et al. (2017). The H.E.S.S.
source shows possibly three peaks, suggesting that the emission is composed of more than one source. Several counterparts have been proposed, such as the high-mass X-ray binary system composed of AX J1841.0−0536, PSR J1841−0524, and PSR J1838−0549, but none of them could solely power the whole H.E.S.S. source. More recently, the blind search detection of the newγ-ray pulsar PSR J1838 −0537 with Fermi-LAT (Pletsch et al. 2012) provided the
only potential counterpart sufficiently energetic to power the whole H.E.S.S. source with a conversion efficiency of 0.5%, similar to other suggested pulsar/PWN associations. How-ever, the spectra derived in this analysis are relatively soft in comparison to other PWNe detected at GeV energies by Fermi-LAT, suggesting that part of the low-energy emission could have another origin. Even if the two components remain unidentified, it should be noted that the sum of their individual spectra is in very good agreement with the spectrum derived by the H.E.S.S. experiment.
2. The region of Vela-X(FGES J0830.3−4453 and FGES
J0832.0−4549): The detection of the Vela-X PWN was reported by Fermi-LAT in the first year of the mission and then re-investigated using 4 yr of data, showing that it is best described by an elliptical distribution(Gaussian or disk; Grondin et al.2013). This analysis also reported
the detection of a significant energy break at ∼2 GeV in the Fermi-LAT spectrum, as well as a marginal spectral difference between the northern and the southern sides of the elliptical Gaussian. In our new analysis two sources are detected in coincidence with Vela-X(FGES J0830.3 −4453 and FGES J0832.0−4549), as can be seen in Figure8 (right). FGES J0832.0−4549, which is close to
the cocoon as seen by H.E.S.S., has a harder spectrum consistent with the TeV points, while FGES J0830.3 −4453 has a softer spectrum, in agreement with the spectrum derived for the whole elliptical Gaussian in the former Fermi-LAT study.
3. W44 (FGES J1856.3+0122): Several analyses of the
middle-aged remnant W44 were performed in the GeV energy range by Fermi-LAT and AGILE. First, using 1 yr of Fermi-LAT data, Abdo et al.(2010a) showed that the
γ-ray source is best fit by an elliptical ring in perfect coincidence with the shell, implying that the emission is
Figure 9.Left: SEDs of the star-forming region W30 by combining data from this analysis(black stars and dashed butterfly), from the 2FHL catalog (blue diamonds and line), from the SNR catalog (purple line), and from IACT (red triangles and line; Aharonian et al.2006a). Middle and right: background-subtracted TS maps of W30 using the same conventions as in Figure3and above-quoted references for the IACT contours shown in green. The white circle indicates the disk extensionfit in this work.
produced by particles accelerated there. Then, Uchiyama et al. (2012) announced the detection of significant
emission, from the surrounding MC complex, produced by CRs that have escaped from W44. Finally, Giuliani et al. (2011) and Ackermann et al. (2013b) detected the
characteristic pion-decay feature in the γ-ray spectra of W44, providing thefirst direct evidence that CR protons are accelerated in this shell. The use of a uniform disk in our analysis is therefore a clear simplification with respect to previous work. However, the spectrum derived is in good agreement with previous measurements showing that the bulk of the γ-ray emission is well taken into account.
4. W51C(FGES J1923.3+1408): W51C is another middle-aged remnant known to be interacting with an MC. The γ-ray emission is spatially extended and best fit with an elliptical disk in agreement with the radio and X-ray extent of SNR W51C(Abdo et al.2009). Recently, Jogler
& Funk(2016) re-investigated the spectrum of the source
down to 60 MeV and revealed a clear break at 290 MeV associated with the energy threshold of p production.0
This result makes W51C the third unambiguously identified CR accelerating SNR. Although the uniform disk does not perfectly reproduce theγ-ray morphology from this SNR, the spectrum is in good agreement with the previously published values.
5. Cygnus cocoon (FGES J2026.1+4111): Using 2 yr of
Fermi-LAT data, Ackermann et al.(2011a) found a large
excess of hard emission extending far beyond the sizes of
Cyg OB2 and γ Cygni, and following the regions
bounded by photon-dominated regions as in a cocoon. The γ-ray emission peaks toward massive-star clusters and toward the southernmost MC and is well fit by a Gaussian of 2°.0 width. Such a complex and highly extended region cannot be well reproduced by a simple disk.
6. The SNR S147 (FGES J0537.6+2751): This SNR,
located toward the Galactic anticenter, is one of the most evolved SNRs in our Galaxy. No X-ray emission has been reported to date from this region, nor any TeV emission. Using 31 months of Fermi-LAT data, Katsuta et al.(2012) reported the detection of a spatially extended
Figure 10.Left: SEDs of the SNR G150.3+4.5 with data points from this analysis (black stars and dashed butterfly) and from the 2FHL catalog (blue diamonds and line). Middle and right: background-subtracted TS maps of SNR G150.3+4.5 using the same conventions as in Figure3. The white circle and central plus sign indicate the disk extension and centroid asfit in this work, respectively. Right: the radio extent of the SNR is shown in cyan (Gao & Han2014).
Figure 11.Left: SEDs of the SNR W28 with data points from this analysis(black stars and dashed butterfly), from the 2FHL catalog (blue and purple diamonds and lines for 2FHL J1801.3−2326e and 2FHL J1801.7−2358, respectively), and from IACT data (orange and pink triangles and lines for HESS J1800−240 and HESS J1801−233, respectively, the sum being represented in red; Aharonian et al.2008). Middle and right: background-subtracted TS maps of SNR W28 using the same conventions as in Figure3and above-quoted references for the IACT contours shown in green. The white circle and central plus sign indicate the disk extension and centroid asfit in this work, respectively.
γ-ray source coinciding with the SNR, with an apparent spatial correlation with prominent Hα filaments of S147. Again, a simple disk might not be ideal to reproduce perfectly the morphology of this source, or the difference
could be due to energy dependence as for W30 (see
below).
4.2.2. Energy Dependence
1. The star-forming region W30 (FGES J1804.8−2144):
The case of the middle-aged SNR G8.7−0.1 located
within the star-forming region W30 very well highlights the effect of energy dependence. Using 23 months of Fermi-LAT data, Ajello et al. (2012) detected an
extended source with most of its emission in positional coincidence with the SNR G8.7−0.1 and a lesser part located outside the western boundary of G8.7−0.1. The
best fit of the source morphology above 2 GeV was
obtained for a disk of radius 0°.37 with a reasonable correlation with the VLA radio data at 90 cm but poor correlation with the TeV data of the nearby unidentified TeV source HESS J1804−216. In our new analysis, the
best-fit disk has a similar radius of 0°.38, but its centroid is now exactly coincident with the TeV source, providing thefirst evidence of an association between the GeV and TeV emissions, as can be seen in Figure9 (middle and
right). It could well be that the morphological change is due to the different energy thresholds employed(2 GeV versus 10 GeV here). However, the question of the origin of the source is still unsolved. Thefirst possibility is that the GeV and TeV emissions arise from the IC scattering of the relativistic electrons in a PWN powered by the pulsar PSR J1803−2137. However, the relatively soft GeV spectrum(Figure9, left) and large spatial extent are unusual for a PWN; the only other similar case so far
is Vela-X. This would make HESS J1804−216 an
excellent case to investigate further since the associated X-ray PWN J1804-2140 detected by Suzaku(Kargaltsev et al. 2007) is not well studied so far. The second
possibility would be that GeV and TeV emissions originate from the interaction of CRs that have escaped from G8.7−0.1 with nearby MCs. Such a scenario was proposed by Ajello et al.(2012) to constrain the diffusion
coefficient of the particles.
Figure 12.Left: SEDs of the TeV source HESSJ1616−508 with data points from this analysis (black stars and dashed butterfly), from the 2FHL catalog (blue diamonds and line), and from IACT data (red line and stars; Aharonian et al.2006a). Middle and right: background-subtracted TS maps of HESSJ1616−508 using the same conventions as in Figure 3and above-quoted references for the IACT contours shown in green. A white circle indicates the extent of thefit disk of FGESJ1617.3−5054 (A) and FGESJ1615.4−5153 (B). Right: X-rays contours (from the ROSAT All-Sky Survey) of SNR RCW103 are overlaid in magenta.
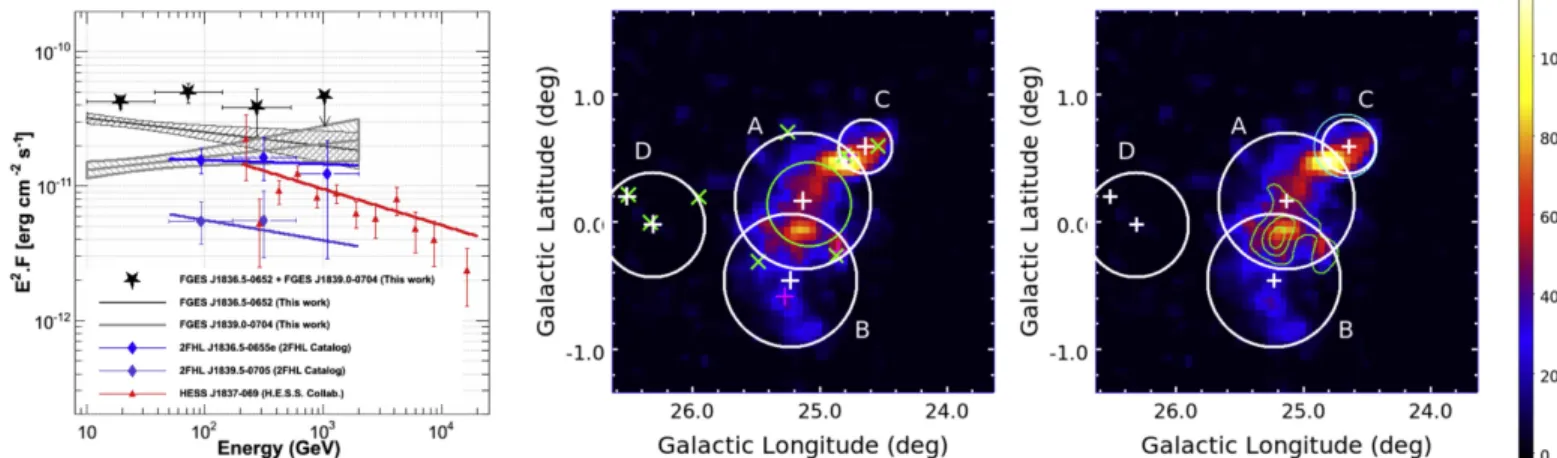
Figure 13.Left: SEDs of the pulsar wind nebula HESSJ1837−069 with data points from this analysis (black and gray dashed butterflies for FGES J1836.5−0652 and FGES J1839.0−0704, respectively), from the 2FHL catalog (blue and purple diamonds and lines for 2FHL J1836.5−0655e and 2FHL J1839.5−0705, respectively), and from IACT data(red line; Aharonian et al.2006a). Middle and right: background-subtracted TS maps of HESSJ1837−069 using the same conventions as in Figure3and above-quoted references for the IACT contours shown in green. White circles and plus signs indicate the disk extensions and centroids, respectively,fit in this work for FGESJ1836.5−0652 (A) and FGESJ1839.0−0704 (B), as well as nearby extended sources FGESJ1834.1−0706 (C) and FGESJ1839.4−0554 (D).