HAL Id: insu-03007465
https://hal-insu.archives-ouvertes.fr/insu-03007465
Submitted on 16 Nov 2020
HAL is a multi-disciplinary open access
archive for the deposit and dissemination of
sci-entific research documents, whether they are
pub-lished or not. The documents may come from
teaching and research institutions in France or
abroad, or from public or private research centers.
L’archive ouverte pluridisciplinaire HAL, est
destinée au dépôt et à la diffusion de documents
scientifiques de niveau recherche, publiés ou non,
émanant des établissements d’enseignement et de
recherche français ou étrangers, des laboratoires
publics ou privés.
Multi-instrument study of the upstream region near
Mars’ The Phobos 2 observations
E. Dubinin, K. Sauer, M. Delva, R. Grard, S. Livi, R. Lundin, A. Skalsky, K.
Schwingenschuh, K. Szego, Jean-Gabriel Trotignon
To cite this version:
E. Dubinin, K. Sauer, M. Delva, R. Grard, S. Livi, et al.. Multi-instrument study of the upstream
region near Mars’ The Phobos 2 observations. Journal of Geophysical Research, American Geophysical
Union, 2000, 105 (A4), pp.7557-7571. �10.1029/1999JA900400�. �insu-03007465�
JOURNAL OF GEOPHYSICAL RESEARCH, VOL. 105, NO. A4, PAGES 7557-7571, APRIL 1, 2000
Multi-instrument
study of the upstream region near
Mars'
The Phobos
2 observations
a S Livi x R. Lundin 4
E. Dubinin,
• K. Sauer,
• M. Delva,
2 R. Grard, .
,
,
A. Skalsky,
s K. Schwingenschuh,
2 K. Szego,
• and J.-G. Trotignon
7
Abstract.
Multi-instrument data analysis of the observations
made by the
Phobos
2 spacecraft
in the upstream
Martian environment
shows
that the solar
wind deceleration
observed
in elliptical and circular
orbits and previously
referred
to as mass
loading
by planetary
exosphere
occurs
mainly in the foreshock
region.
Variations
of the bulk speed
are accompanied
by strong
magnetic
field perturbations.
The flow and field perturbations
are well correlated,
indicating
their Alfven wave
origin. The data suggest
that the observed
disturbances
are caused
by large-
amplitude
Alfven
waves
propagating
in the solar
wind as well as by waves
generated
locally at the foreshock.
It is shown
that the foreshock
boundary
is not just
a topological
boundary
separating
the regions
either magnetically
connected
or
disconnected
with the bow shock. The transition across
the tangent line is often
accompanied
with a sharp
rotation
of the magnetic
field, decrease
of the magnetic
field value, and increase
of the proton
number
density
and temperature.
Although
variations
of the solar wind speed
at R _>6000
km are mainly controlled
by Alfven
waves,
at closer
distances
to the planet, where
the solar
wind slows
down at 150-200
km s -•, perturbations
of the field and velocity
do not follow
the relation
common
for Alfven waves. This strong deceleration
can be attributed to mass loading on
oxygen atmosphere.
1. Introduction
The measurements made by the Phobos 2 spacecraft provided us with a lot of information concerning the solar wind/Mars interaction, although many questions remain open. One of such critical questions is a prob-
lem of mass
loading
near Mars. Pedersen
et al. [1991],
Verigin et al. [1991],
and Barabash
et al. [1991]
have
reported that interaction of the solar wind with Mars starts far upstream from the bow shock as a conse- quence of extended neutral corona. This feature pro-
vides a certain resemblance of Mars with comets. Prob-
• Max-Planck Institut f/u: Aeronomie, Katlenburg-Lindau, Germany.
2Institut flit Weltraumforschung, •stereichischen Acade-
mik der Wissenschaften, Graz, Austria.
3Space Sciences Department, European Space Agency,
Noordwijk, The Netherlands.
4Swedish Institute of Space Physics, Kiruna, Sweden. 5Space Research Institute, Moscow, Russia.
6KFKI Research Institute for Particle and Nuclear Physics, Hungarian Academy of Sciences, Budapest, Hungary.
7Laboratoire de Physique et de Chimie de l'Environment, Orleans, France.
Copyright 2000 by the American Geophysical Union.
Paper number 1999JA900400.
0148-0227 / 00 / 1999 J A900400509.00
ably, the most abundant neutral component at large distances is molecular and atomic hydrogen, which can reach very high altitudes as the consequence of the weak gravitational attraction of Mars. Electron dissociative
recombination
of 02
+ might
be a source
of hot atomic
oxygen atoms which can also escape far away [Nagy and Cravens, 1988; Ip, 1988; Ip, 1990; Lainruer and Bauer, 1991; Kim et al., 1998]. The Phobos 2 observations were made during solar maximum activity when the density of hydrogen constituents (H and H2) is expected to de- crease, although the upper atmosphere and the iono-
sphere
dominated
by molecular
oxygen
ions
02
+ should
extend to higher altitudes. Although the existence of
hot oxygen
corona
near Mars was not confirmed,
it is
expected
that the corona
is denser
than near Venus,
where it was observed by the Pioneer Venus Orbiter
(PVO) spacecraft
[Kim et al., 1998].
A hot hydrogen
population
produced
by the photodissociation
of molec-
ular hydrogen has also been recorded at Venus, but not at Mars. It was believed that hot hydrogen and oxy-
gen coronas,
if they exist, are rare not affecting
the
solar
wind to any major degree [Nagy
et al., 1990]. If
coronas are not very rare the ionization and subsequent
pickup
of the exosphere
matter by the solar wind may
provide a mass loading effect similar to one near comets
[Neugebauer,
1990].
The observations
of wave
emissions
at the proton gyrofrequency is an indirect sign of pickup
ions,
protons
or oxygen
ions [Russell
et al., 1990;
Sauer
et al., 1999]. Barabash
et al. [1991]
attributed
the sec-
7558 DUBININ ET AL.' UPSTREAM REGION NEAR MARS
ondary peaks in the spectrograms of proton fluxes up- stream from the bow shock to picked-up protons. Re- searchers estimated the number density of the plane- tary protons of • 0.01nsw. Small intensities of oxygen
ions (_< 10
-4 cm
-3) were
also
recorded
[Kirsch
et al.,
1991]. On the contrary,
Pedersen
et al. [1991]
reported
about a much higher growth rate of the plasma density with decreasing distance from the planet by measuring a gradual decrease of the spacecraft floating potential.
Under some assumptions, researchers derived the elec-
tron number density along the orbit and found that a distinct increase of the plasma number density starts far upstream from the Martian bow shock. The elec-
tron number
density
increased
by I- 2 cm
-a between
the undisturbed solar wind and the outer limit of theshock foot. However, on two of five elliptical orbits a
gradual decrease of the floating potential was not ob- served that provided problems in the interpretation in terms of "standard" MHD mass loading. Verigin et al. [1991] have observed the essential solar wind de- celeration upstream of the bow shock and attributed these measurements to mass loading on the hot oxy- gen corona. Assuming an instantaneous assimilation of planetary ions to the solar wind, Verigin et al. [1991]
suggested that the oxygen corona near Mars is 5 times
denser
than predicted
by the model of Ip [1988]. Since
the model [Ip, 1988] overestimated the number density in the hot oxygen corona for solar maximum conditions at a factor of 2 - 3 [see Ip, 1990], the value given by [Verigin et al., 1991] far exceeds even the "extreme" number density. Kotova et al. [1997] made a statistical study of the solar wind deceleration near Mars. They se-
lected inbound and outbound passes of Phobos 2 on the circular orbits at 2.SRM, making the assumption that
for the averaged interplanetary magnetic field (IMF) configuration quasi-perpendicular shocks are mostly in inbound legs while quasi-parallel shocks are met in out- bound legs. They found that the solar wind deceler- ation turned to be approximately dawn-dusk symmet- ric and suggested that it is caused by mass loading on a hot oxygen corona with number density of neutrals at • 3 times higher than the values from the extreme model. Recent reexamination of the population of hot oxygen atoms at Mars for the high solar cycle values made by [Kim et al., 1998] gives the hot oxygen den- sity nearly an order of magnitude less than estimates
by [Kotova et al., 1997]. Ip [1990] argued
that mass
loading by oxygen ions was unlikely to be the cause of
the solar wind deceleration because reported decelera-
tion requires a much more massive oxygen corona than can be expected from the models. Ip [1992] suggested that the reflection at the bow shock of H + ions originat- ing from the extended atomic hydrogen atmosphere of
Mars could cause the slowdown of the solar wind. The
importance of pickup ion reflection is motivated by the significant fraction of pickup protons with small nor- mal velocity components at the bow shock that prevent their overcoming the electrostatic barrier. A fraction
of reflected
ions
is mass-dependent
--• (tr•p/tr•pick)
1/2,
where rr•p and rr•pick are masses of protons and pickup ions, respectively [Zank et al., 1996], and heavy pickup
ion species
(He
+, O +) less
effectively
participate
in this
process. Analyzing the measurements made by the sen- sor looking in the antisunward direction with field of view 72 ø x 5 ø, Barabash and Lundin [1993] have esti- mated the density of reflected protons in front of the bow shock foot as _<5% nsw. Dubinin et al. [1994a] have simulated the dynamics of pickup protons and have shown that the reflected pickup protons essentially cont ribute to the background of planetary ions upstream of the bow shock. A redistribution of pickup protons due to their reflection at the bow shock (ions occupy mainly the foreshock region) qualitatively explained the differ- ence in the electron number density derived from the floating potential measurements on different elliptical orbits. An enhancement of mass loading was observed when the spacecraft encountered a bunch of reflected photoions [Dubinin and Lundin, 1995].
On the other hand, it is known that the decelera-
tion of the solar wind is also effective in the Earth's
foreshock [Bonifazi et al., 1980; Zhang et al., 1995, 1997], and a problem to distinguish between typical foreshock features and mass loading effects appears in
the Mars case. Observations made on the Phobos 2
spacecraft suggested a large developed foreshock, which is similar to that known from wave and plasma obser- vations at Earth. The electron foreshock adjacent to the tangent line was identified from the observations of bursts of electron plasma waves accompanied by the fluxes of backstreaming electrons [Skalsky et a1.,1992, 1993]. At farther distances from the tangent line, a
broadband electric field noise and ULF waves charac-
teristic of the ion foreshock were observed [Grard et al., 1991; Delva and Dubinin, 1998]. Barabash and Lundin [1993] found typical foreshock signatures such as gyrat- ing reflected ions and field-aligned beams. Otherwise,
Brecht [1997a,b]
argued
that because
of small size of
Mars, effects of the ion gyroradii can strongly influence not only the bow shock structure but the Martian at-
mosphere too.
As will be shown in this paper, the position of the spacecraft with respect to the foreshock strongly varies along the orbit ( the spacecraft often makes short tours
into the undisturbed solar wind and back to the fore-
shock) that provides significant variations in the solar wind velocity. Therefore identification of foreshock or mass loading signatures becomes ambiguous without reliable awareness of the foreshock geometry and the spacecraft position. The solar wind/foreshock inter- face is also characterized by significant perturbations. The onset of electric field emissions (-,• 100 Hz) at the leading edge of the electron foreshock was reported by [$kalsky et al., 1998] as the unique feature of the Mar- tian upstream wave environment. Noticeable bending of the magnetic field lines near the tangent line was no- ticed by [Dubinin et al., 1998a]. Bipolar variations of
DUBININ ET AL.' UPSTREAM REGION NEAR MARS 7559
the magnetic field were centered at the plane, which is normal to the tangent surface and intersects the bow shock at tangent points.
Thus a rather complex picture emerges from the data provided by different plasma instruments on board the Phobos 2 spacecraft. The purpose of the paper is to get a more detailed and less controversial picture of up- stream region near Mars using the database of different plasma instruments. In this paper, we show that the disturbed structure of the upstream region is driven by time-varying perturbations in the solar wind (propagat- ing large-amplitude Alfven waves) as well as by local processes within foreshock. The relevance of these re- sults to the problem of mass loading in the upstream region of Mars is also discussed.
2. Instrumentation
Parameters of the solar wind plasma were measured by the ion spectrometer (TAUS), which was well adapted to solar wind monitoring. The instrument has field of view 40 ø x 40 ø along the sunward direction, divided at 8 x 8 sectors [Rosenbauer et at., 1990]. The energy range was 30 eV to 6 keV, but most of the data were obtained in range 150 eV to 6 keV. The location of the space- craft with respect to the foreshock is determined from the magnetic field measurements and the model of the bow shock. The magnetic fields near Mars (MAGMA) experiment was the three-axial fluxgate magnetometer with time sampling 1.5 or 45 s [Riedter et at., 1989]. The three-dimensional geometry of the foreshock could be evaluated from the magnetic field data because the motion of the backstreaming particles is guided by the magnetic field lines, and therefore magnetic connection to the bow shock is bounded by the magnetic field line tangent to the bow shock. We use the coordinate sys- tem with the X axis positive to the Sun (antiparal- lel to Vsw) and the (VswB) plane as the (XY*) ref- erence plane, where the Y* axis is taken positive in the direction of the cross-flow component of B (and
thus always
By. _> 0), and the Z* axis perpendicular
to (X, Y*) completes the system. The bow shock was approximated by a half ellipsoid of revolution around the X axis, in the (X, Y*) magnetic equatorial plane
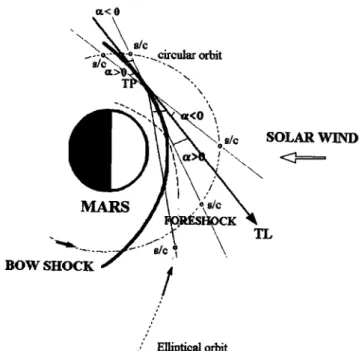
[Trotignon et at., 1991; Detva and Dubinin, 1998], and the angle a between the tangent line and the direction to the spacecraft from the tangent point was evaluated. Positive values of angle a (0 ø- 180 ø) correspond to the location of the spacecraft in the foreshock. Negative values of a (-180 ø- 0 ø) give the position in the solar wind (Figure 1).
The foreshock geometry may be also traced by an appearance of electron plasma oscillations measured by the wave instrument. The Plasma Wave System (PWS) on board the Phobos 2 spacecraft consisted of bank of filters in frequency range 0.2 Hz to 150 kHz [Grard et at., 1989a]. In this paper we use only the data collected in the high-frequency channels (6-38 kHz), which were
s/c
.._•c•cular
orbit
\ ß <0 s/c SOLAR WIND MARS•- ....
s/c
•,1
,
BOW
SHOCK
ß/
ß , , , , ,: Elliptical orbitFigure 1. Projections of the elliptical and circular or- bits of Phobos 2 onto the XY Mars solar orbital (MSO) plane and the average IMF configuration. The angle a determines the position of the spacecraft with respect to the tangent line. Positive/negative values of the angle a correspond to the foreshock region and the undisturbed solar wind, respectively.
attributed to the electron plasma waves [Grard et at., 1989b; Skatsky et at., 1992; Trotignon et at., 1992], and low frequency emissions at frequencies between 0.2 and 10 Hz. The electron plasma oscillations are generated by the electrons, which are reflected at the bow shock and streaming sunward along the interplanetary mag-
netic field connected to the shock. Thus the observation
of electron plasma oscillations is a very sensitive indica- tor of the magnetic field geometry. They appear to be close to the tangent line and mark the upstream edge of the electron foreshock. ULF waves are generated when ions backstreaming from the bow shock or ions of plan- etary origin interact with oncoming solar wind.
The foreshock geometry is also determined from in- spection of antisunward/sunward anisotropy of electron heat fluxes. The Automatic Space Plasma Experiment with a Rotating Analyzer (ASPERA) contained the
electron
spectrometer
(1 eV to 50 keV) and fluid elec-
tron parameters were calculated on board [Lundin et
at., 1989]. However,
in contrast
to ions, calculation
of
the moments of electron distribution function is very sensitive to the spacecraft potential and to photoelec- trons. The standard procedure used to account for these effects is to adjust the electron number density ne and electron bulk velocity V• in such way that they were in reasonable agreement with the proton number density and proton bulk velocity, respectively, assuming quasi- neutrality. The on board calculations usually do not
7560 DUBININ ET AL.: UPSTREAM REGION NEAR MARS
take these factors into account. To avoid a contribution
from photoelectrons the external grid of the electron spectrometer was biased at -12 V and a part of a core of the distribution near Ve was missed. Then, the sec- ond moment of the electron distribution function M,
which is related to the measured differential directional
flux j (M = fj(E, 0, •)dE H(0, •)), where
0, •, and H
are the elevation angle determined by the sensors, the azimuth (scan) angle, and trigonometric vector, respec-
tively), primarily
gives
information
about asymmetry
in
wings of the electron distribution functions. An asym- metry could be supplied by solar wind halo electrons carrying the heat flux from the solar corona. Dubinin
et el. [1994b]
have applied
the measurements
of elec-
trons in wings as tracers of the Martian tail topology because streaming electrons replicate field line kinks as- sociated with draping of the IMF around Mars. This
approach
[Dubinin
et el., 1994b]
provides
us with a very
sensitive tool for the study of the magnetosphere topol- ogy. Planetary bow shocks give rise to another source of electron heat flux propagating in the opposite, sunward direction. Therefore a sign of Mx is determined by a relative contribution of both sources. Negative values of Mx correspond to electron heat flux from the solar corona carried by electrons along the IMF. In the elec- tron foreshock, heat fluxes in the sunward direction, as-
sociated with electrons accelerated and reflected at the
bow shock, can dominate the anisotropy in the wings
and change its sign.
The measurements of the difference potential between a conductive surface of the spacecraft at floating poten- tial and electric field probe, negatively biased in rela- tion to the spacecraft, were used to determine electron
number
density [Pedersen
et el., 1991]. The probe
was biased with a current limited to 50 nA by a high impedance current source that drives the probe poten- tial more negative in relation to the positive spacecraft by an amount A V. This quantity, measured as a po- tential difference between a floating spacecraft and a
biased
probe, is inversely
proportional
to the electron
number
density.
Uncertainty
of this technique
is related
to the absence of information about the electron energy
also affecting
the floating
potential. Nevertheless,
the
AV- ne relation is very sensitive to variations in n• and can be used as indicator of mass loading features
[Dubinin
et el., 1994a].
There were two main types of Phobos 2 orbits around
Mars (Figure
1). During
the first stage
of the mission,
the orbit spacecraft
was elliptical
with a periapsis
al-
titude of 850 km and a period of 76.5 hours. Most observations were done when the spacecraft was settled
on the circular
orbit (R -• 2.8RM). In some
orbits
the
spacecraft
was three axis stabilized,
while in other
or-
bits, Phobos
2 was in a spinning
mode
with the axis
of rotation intended to be pointing to the Sun. How-
ever,
the axis
of rotation
was
really
deviating
from this
direction,
and the additional
despun
processing
of the
magnetic
field
data was
done [Delve
et el., 1993].
A1-
though
the bulk velocity
of the solar
wind could
be reli-
ably evaluated
even when the spacecraft
was spinning,
fine details of variations of plasma number density was
acquired
only from stabilized
orbits or from the mea-
surements of the floating potential.
3. Observations 3.1. Elliptical Orbits
Figure
2 shows
the measurements
made
by the differ-
ent experiments
along the elliptical
orbit on February
4-5, 1989. Figure 2a gives
variations
of the proton
bulk
velocity.
Despinning
magnetic
field data were used
to
determine
the position
of the spacecraft
relative
to the
foreshock.
Figure 2b presents
the angle c• between
the
magnetic
field line tangent
to the bow shock
and the
direction
to the spacecraft
from tangent point. Gaps
indicate when the magnetic field does not intersect the
shock.
Figure
2c shows
the amplitude
of high-frequency
(6-38
kHz) and
low-frequency
(0.2-10
Hz) waves.
Figure
2d contains the second moment of the electron distribu-tion function Mx divided by the electron number den-
sity. Entry of the spacecraft
into the foreshock
was at
2240 UT. Subsequent variations of sign 6f the angle c• in-
dicate
that the spacecraft
makes
often excursions
to the
solar wind. The spikes of the electron plasma emissions
(6-38 kHz) clearly
mark the crossings
of the electron
d FEBRUARY 4,1989 -575 ... • ... • ... •
6o
* -••'•'•'•••••••••1
...
0.o, i
....
• : '--.: • . • . . .• 0.•I'
-. " • ' .'7•'
0.01.
•
'..o.24øm... . ...
..•-.
15 -150- 22 2.•.5 • 23.5 24 • 5.58 4,6 3,62 2.55 1.51 •2.
wi=d vdoity,(b)
(c) amplitudes
of electron
plasma
oscillations
(scale
is
on the le• side)
and
low-frequency
waves
(scale
is on the
right side), and (d) the second
moment
of the electron
diaibtion fnaion divided by
dnity (I
1500
km s -•) during
the elliptical
orbit on February
5, lg8g. Planetocentric
distance
R is in Mars
radii
DUBININ ET AL.' UPSTREAM REGION NEAR MARS 7561
foreshock. The foreshock geometry and position of the spacecraft with respect to the foreshock were also de- termined from the inspection of antisunward/sunward anisotropy of fluxes of suprathermal electrons. Neg-
ative values of Mx in the upstream solar wind point
out that the prevalent electron heat flux from the solar corona is mostly carried by electrons along the inter- planetary magnetic field. When the spacecraft arrives at the electron foreshock, heat fluxes in the sunward
direction associated with electrons accelerated and re-
flected at the bow shock begin to dominate and change sign of the anisotropy (Mx > 0). It is seen that the sun- ward fluxes of suprathermal electrons mostly dominate
over fluxes related to the solar wind halo electrons af-
ter 2240 UT. At 2320-2325 UT and 2332-2340 UT, the
spacecraft was outside the foreshock in the solar wind (a < 0). Clear dropouts of plasma emissions and sig- natures of halo electrons (M• < 0) are observed. It is also seen that identification of the foreshock/upstream region based on the model bow shock and the local mag- netic field measurements is not always perfect. For ex- ample, according to the model calculations, the space- craft was in the solar wind at 2245-2252 UT, although
the observations of electron plasma waves and fluxes of
backstreaming electrons indicate a magnetic connection with the bow shock. Although, in most cases the model predictions are in a reasonable agreement with the ob- servations, only negative values of the angle a associ- ated with disappearance of the electron plasma emis- sions and, to a lesser extent, change of the anisotropy
of the halo electrons are discriminators of back excur-
sion to the solar wind. In Figure 3 the observations of
electron plasma waves and backstreaming electrons are
plotted versus the angle a. A general trend, showing that electron plasma oscillations and sunward fluxes of
FEBRUARY 4, 1989, 2300-2350UT 0.01 , 6-38kHz :<• :_q9o
SW o 'q•. FS
0.001
.o
.... , .•. 0.cp.m,
.c0.
.., ... , ...
1 -10Hz
:
o.oo1+ ... ,.. +..., ... -F• .... , ... , ...400-•
,
-200•
400• , , , , -180 -120 -60 0 60 120 180Figure 3. Amplitude of electron plasma and ULF waves, and the flux of the suprathermal electrons versus the angle c• (February 4, 1989).
> -800!
...
FEBRUARY 1,1989, 1520-1810UT2.51
-0.5 -1.5 ... 4 i ... I .... '' I ... I I 4•
d
120 4 60 3 I ... I ... I ... I ... I ... , - 180 - 120 -60 0 60 120 180 or-angle, degFigure 4. Dependence of the solar wind velocity and the magnetic field on the angle c• in the upstream region for the orbit on February 1, 1989. (a) The solar wind
velocity
V, (b) the Bx and (c) By. components
of the
magnetic
field, (d) the magnetic
field magnitude
B, (e)
the cone angle •, and (f) vectors of the magnetic field in the XY* plane are given.
suprathermal electrons (M• > 0)-appear close to the tangent line crossing (c• = 0), justifies the use of the
model position of the bow shock. In accordance with
expectations, low-frequency waves prevail at larger dis- tances from the tangent line in the ion foreshock where the density of high-intensity points is greater.
A remarkable feature of Figure 2 is that the solar
wind deceleration
starts
close
to the foreshock
boundary
(2240 UT). While the spacecraft
made excursions
into
the solar wind, excepting the interval between 2332 and 2340 UT, the proton velocity was recovered to its "nom- inal" upstream value of the velocity computed from an
upstream
time interval in the solar wind (horizontal
dashed
line). After 2345 UT, when the spacecraft
ap-
proached the bow shock at the distance less than • 1700 km, deceleration of the solar wind becomes evi-
dent. Strong
increase
of the ULF turbulence
(0.2-10
Hz) marks this region well. The bow shock was crossed at 0003 UT on February 5.
In Figure 4 the solar
wind velocity
and the magnetic
field are plotted versus the angle c• for the orbit on
February
1, 1989. The solar
wind velocity
V (Fig-
ure 4a), the B• and By. components
of the magnetic
field (Figures
4b and 4c), the magnetic
field magnitude
7562 DUBININ ET AL.- UPSTREAM REGION NEAR MARS
B, (Figure 4d) the cone angle ½ (the angle between X axis and the magnetic field vector B) (Figure 4e). Figure 4f presents the projection of the magnetic field onto the XY* plane versus the angle c•. The velocity decreases with increase of the angle c• in the foreshock region (c• > 0) without visible speed variations in the undisturbed solar wind (c• < 0). A gradual rotation of the magnetic field vector is also clearly observed. This rotation is not surprising because the angle c• is determined from the magnetic field measurements. If, for example, the magnetic field vector turns toward the X axis, an observer in the foreshock occurs farther from the tangent line, at larger c• angles. The interesting
point is, however, that rotation of the field lines arises
at the border of the foreshock. A distinct discontinuity
at c• = 0 is seen in all curves. Another noticeable fea-
ture is a small decrease of the magnetic field magnitude with increase of the angle c•. A similar trend of rotation of the magnetic field and a gradual decrease of the mag- netic field value with increase of the c• angle (c• > 0) was observed on the third elliptical orbit (February 8, 1989) when the spacecraft approached Mars inside the ion foreshock [Dubinin et al., 1999]. Amplitude of speed
variations
was small (10-15
km s -1) and significant
de-
celeration of the solar wind was recorded only at • 1500
km from the bow shock.
a b FEBRUARY 11,1989 2 180 ... -'---••'.
.180
-]
40010.01,
0.005
0 10 10.5 11 4.03 3 2.26Figure 5. (a) The electron
number
density
derived
from the potential
measurements,
(b) the angle
c•, (c)
the second moment of the electron distribution functiondivided
by the density
(I Ve I_>
1500
km s-1), and am-
plitudes
of (d) the electron
plasma
oscillations
and (e)
low-frequency
waves
in the elliptical
orbit on February
11, 1989. MARCH 9, 1989
-410
i
;>"
-4501
!
-470q
.i. '""
' ...
' •:'
'""
'""
'"
'"
...
' ' ' ' ...
' •
...
•
u -120
- 180-::-• i ! { i • ... :'1 "i' i I :• 3.5 4 4.5 5 5.5 6 6.5 7 7.5 •RCH 25, 1989 -700 ... . -720• -740
>- -760
-780 • ... ..• • . ... _ ... . ... ....:... ... 4• 20
...
...
,•,'"• ...
•
•
-20
0.• '•::d•:
::•i•
• •:::g•'J)
"•
'•
'
.•-'
'
• -40
• -60::,
•1.5 2 2.5 3 3.5 4Figure 6. Variations
of the plasma
flow (V), the mag-
netic field (B•), and the angle a in the upstream region of circular orbits on March 9 and 25, 1989.
On February
11, 1989, the spacecraft
approached
the
planet outside the foreshock. The TAUS instrument did not operate and signatures of the solar wind mass load- ing could be identified only from the measurements of
the floating
potential
[Pedersen
et al., 1991].
The elec-
tron number density derived from the potential mea- surements is shown in Figure 5a. Increase of the elec- tron number density is observed when the spacecraft
crosses
the tangent
line (• 1047
UT). The crossing
and
entry into the electron
foreshock
is clearly
seen
from ap-
pearance
of the electron
plasma
oscillations
(6-38
kHz)
and backstreaming
electrons
(Mx > 0). Then, Phobos
2 travels in the region adjacent to the bow shock that is confirmed by significant enhancement of the ULF tur-
DUBININ ET AL.' UPSTREAM REGION NEAR MARS 7563
stream of the tangent line might be of the solar wind origin or be generated by pickup protons that originated from the extended hydrogen corona. It is worth not- ing that Barnbash [1991] have detected appearance of pickup protons at 1024 UT.
3.2. Circular Orbits
Most of the measurements in the solar wind/foreshock were made on circular orbits (R -• 2.8RM). The circular orbit was close to the ecliptic plane and provided a good coverage of the region upstream of the bow shock (Fig- ure 1). The observations made on the circular orbits eliminate effects of dependence of plasma and field vari- ations on the planetocentric distance. Figure 6 shows two typical examples of the measurements of the solar wind velocity V, the component of the magnetic field Bx, and the angle c•. It is seen that the magnetic field configuration varies significantly and a formal distinc- tion between quasi-perpendicular/quasi-parallel shocks on inbound /outbound legs is ambiguous. The space- craft is traveling near the tangent line, with frequent
excursions from the foreshock to the solar wind. Some
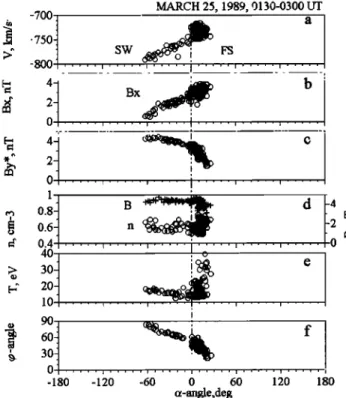
transitions are accompanied by distinct increase of the solar wind speed. Correlation between perturbations in flow and magnetic field is obvious. In Figure 7 the solar wind velocity and the magnetic field are plotted versus the angle c• for the orbit on March 25, 1989. The space- craft was three-axis stabilized, and the reliable measure-
-700, MARCH 25, 1989, 0130-0300 LIT -750- -800 ... i ...
SW
•
{ ... { ...FS
! ... i ... 1 '0.81
B
•
d
0.6 n ,0.4
'
'
] o
, 20 , ot-angle,degFigure 7. Dependence of the plasma and the magnetic field versus the angle c• for the orbit on March 25, 1989. (a) The bulk velocity of the solar wind V, (b and c)
the components
BI, By., (d) the magnetic
field value
B and the proton number density n, (e) the proton temperature T, and (f) the cone angle •o.
ments of the density variations are available. The ve- locity decreases with increase of the angle a. A gradual rotation of the magnetic field vector is observed not only
in the foreshock but also in the undisturbed solar wind
(c• < 0), although a distinct fracture at c• = 0 in the curves of the magnetic field components and the cone angle T is seen. The magnitude of the magnetic field and the plasma density do not vary significantly in the
solar wind with a trend toward decrease
(increase)
of
the magnetic field magnitude (the proton number den- sity) across the foreshock boundary. All these features give a hint that the foreshock boundary is not simply a topological boundary, which separates the regions ei- ther magnetically connected or disconnected with the bow shock. An increase of the proton temperature at factor of two also supports this conclusion.
4. Discussion
4.1. Mass loading?
Addressing the question concerning probable mass loading features, we compare the observations of the electron number density, derived from the PWS differ-
ential potential measurements on the elliptical orbits
when the experiment has operated in the biased mode, to the density of pickup ions evaluated from the model assumptions. Figure 8 (bottom) shows the measured electron number density ne calculated in the assump- tion that the mean kinetic energy of the electrons Te -
I eV [Pedersen
et al., 1991]. Figure
8 (bottom
middle)
presents
the product
n - nexosp'
(1/sin•), where
nexosp
is the number density of hydrogen atoms according to the Chamberlain's [1963] model for solar maximum con- ditions, and •o is the cone angle of the interplanetary
magnetic
field ( nexosp
= noexp(H/R- H/Ro)•(R),
where H - GMmmH/kT, G is gravitation constant, Mm and mH are the masses of Mars and hydrogen atom, T is the exosphere temperature (T=350 K), ((R)
is the partition function,
no - 3 104 cm
-3 is the num-
ber density at R- Ro-250 kin), which is proportional to the number density of pickup ions. Indeed, assum- ing that pickup protons leave a site of their origin by the E x B drift, we can estimate their residence time as q-res r• L/V•wsin%o, where L is the characteristic scale and V•osin•o is the escape velocity. Then, the number density of pickup protons npickup • nexospTres/Tio n ,'0
nL/(V•orion), where
Zion
is the ionization
time (Zion
"•
3 106 s), and n - nexosp/Sin%o.
Therefore
variations
in the IMF direction
will cause
variations
in npickup.
A comparison
between
the observations
(n•) and the
"model" reveal a similar trend of a gradual increase with some similarities in details that give a hint that the variations in the electron number density derived from floating potential are related to a newly ionized matter of the planetary origin. However, we meet with the obvious problems of getting a quantitative agree- ment. The residence time rres "• L/V•o has to be of -• 2 orders greater than the derived value for L • 6000
7564 DUBININ ET AL' UPSTREAM REGION NEAR MARS
FEBRUARY 1, 1989 FEBRUARY 4, 1989 FEBRUARY 8, 1989
.•7--]
-500•
TAUS
/'[
-440_..•T-AUS
/\
-.
f•
-675
i TAUS
•x•,
,.
,
[ -550& ••*• I•d•t
,
...
; ...
v--,
....
; ... 4o!
v I -460
• v •/' V '
,
,
•
l•SIMULKI'IONS
• • ....
, 0 ]]
SIN•LNFIONS y•- 1
•I•LATION•'--
J
0.00i!
,
0.001]
....
• ?'•'.., ...
.. ß 0.0v "'
,
,
I MODEL
0,000 10,000 1,000 , '0
i PWS
,
11'7
175
1'8 185 I
1,0001 . , , , ... , ,,101
PWS
--
10,000
MODEL
.,
,•
2,000'1•'4•"
•
' ' 1
22.5 23 23.5 24 4:20 4:50 5:20 UTFigure 8. (top) Proton bulk velocity, (top middle) the number density of pickup protons derived
in the test particle
simulations
(curves
labeled
as "simulations"),
(bottom
middle)
the "effective"
number
density
of hydrogen
atoms
(curves
labeled
as "model"),
and (bottom)
the electron
number
density evaluated from the difference potential measurements (February 1, 4, and 8, 1989).
km, V,•o •0 500 km s -•. The agreement
can be im-
proved by a factor of 10 if we take into consideration a specular reflection of pickup ions at the bow shock. Reflection of protons leads to a their redistribution con- trolled by the magnetic field orientation. The bunch of reflected pickup protons guided by the IMF is localized in the foreshock and provides a distinct asymmetry in
the density
of pickup
protons [Dubinin
et al., 1994a].
The curves
shown
in Figure 8 (top middle)
give the dis-
tribution of pickup protons from the test particle model. In the simulations, ion trajectories of 50,000 test parti-
cles
in the external
electric
(E - -1/cVswxB) and the
magnetic field B taken from the measurements were calculated. Test particles are weighted in accordance to the exosphere profile of hydrogen atoms. The fam- ily of distributions of the proton number density was evaluated for different cone angles to get the number density along the real spacecraft trajectory. It is seen that the "memory" about original %o angles of pickup
ions is conserved
and therefore
variations
in ni ("sim-
ulation" curves)
replicate
many features
in n (model
curves).
An additional
factor
of 10 can be found
by as-
suming a denser hydrogen atmosphere. It is worth not- ing that Dubinin et al. [1994a] have used the value no
= 2 105 cm
-3 to get a better agreement
with the PWS
measurements. However, according to the model by [Krasnopolsky and Gladstone, 1996], such values corre- spond to mean solar activity. The calculated hot oxygen densities are also smaller and do not contribute signif- icantly to the number density of pickup ions [Kim et el., 1998]. From this point of view, a significant growth in the electron number density n• while approaching the planet, which is a by-product of the differential potential measurements, remains a puzzle. Probably,
electrons accelerated and reflected at the bow shock in-
crease the mean energy of electrons collected by the electric probe and modify the floating potential.
Figures 9a-9c show the bulk speed versus the "effec- tive" number density n (the number density of neutral
hydrogen
atoms
nexosp
multiplied
by factor
of 1/sinT)
for three elliptical
orbits. Figure 9d presents
the plane-
tocentric distance R evaluated from the effective num-
ber density
according
to the equation
n = no exp(H/R-
H/Ro). In other words, to adjust the data to similar
IMF conditions
in the solar wind (T = 90ø), variations
in n caused by changes in the cone angle T are trans-
formed
to the dependence
on R. As seen
from figure
9a (February
1, 1989), a gradual
deceleration
starts
at
distance of 0• 9000 km. The decrement reaches 25-30
km s -• at 0• 6000
km. Then, the efficiency
of deceler-
etlon strongly increases. The decrease in speed reaches
0• 200 km s
-• at 0• 4700- 5000
km. On February
4,
1989 (Figure 9b), the solar wind slightly
slows
down
at R --• 6000 km with significant braking at --• 5000
km. In the third orbit, deceleration
is visible
only at
R 0• 6000 km with a peculiar splitting on two curves with small and large slopes. A splitting is also seen in the curves for the orbits on February 1 and 4. Dif- ferent values of the velocity are observed for the same number density of thermal hydrogen corona and the
same
inferred
distance
R. The splitting
in the velocity
curves appears because the points come from different locations along the spacecraft orbit in accordance to
different
cone
angles
and residence
times of newly born
ions. Then, two different sources of neutral populations
(e.g. hydrogen
and oxygen)
might provide
a peculiar
splitting of mass loading efficiency. The curves with a lower decrement of the velocity could be related to mass loading on hydrogen corona, whereas the curves with a
DUBININ ET AL.' UPSTREAM REGION NEAR MARS 7565
]•50001
FEBRUARY
1,1989
1700_183
ø _•o a
•55o•1 -7oo-•-7o]
...
...
-8001 , , •--350]
FEBRUARY
4,1989
2200-2400
00
b
- 450-]
o o
-55o
I ...
_--•7•,½•---•.•:,•---•--•---9-
...
- 650• ...- 400
FEBRUARY
8 1989
0400-0530
•
o
- 450-.
...
att•[•••_•...•.?_
...
- 500. 3,0001 . 1,000 10,000 n(H), cm-3 lOO,OOO;• lO,OOO:
d' 1,000'3 10
4
2 103
n(O*)
xl
6 ...
jn(O)xl
6
, ,
4 10 R, kmFigure 9. (a-c) Dependence
of the bulk speed
ver-
sus the effective number density n (the number density
of hydrogen
atoms
nexosp
multiplied
by factor 1/sinT).
Dashed horizontal lines are given for the reference. (d) The distance R to the planet, which corresponds to the values of the effective number density. (e) The num- ber density of hydrogen and oxygen atoms versus the distance R. The solid curve is the number density of hy- drogen atoms. Dashed lines at R > 4000 km show the density of hot oxygen (O*) atoms multiplied by factor of 16. The upper and lower dashed lines correspond to
the extreme
and solar maximum
conditions
[Ip, 1990].
The dashed line at R < 4000 km is the number density
(x 16) of "cold" oxygen atoms.
gen atmosphere.
Indeed, according
to the models,
at
the distances of • 5000- 6000 km the mass density of atmospheric oxygen begins to dominate over hydrogen.
Figure
9e presents
the mass
number
density
of hydrogen
and oxygen
atoms
versus
the planetocentric
distance
R.
Solid line shows the mass number density of hydrogen atoms. Dashed lines at R > 4200 km give the mass
density
of oxygen
(O*) atoms,
originated
from hot oxy-
gen corona
(the number
density
multiplied
by factor
of
16). The upper and lower
dashed
lines
correspond
to
the extreme
and solar
maximum
conditions
[Ip, 1990].
Dashed line at R < 4200 km gives the number density
(x 16) of "cold"
atmosphere
oxygen
atoms.
A fracture
in the curve of the total mass number density of neutrals
(not shown
in Figure
9) is easily
recognized.
Although the mass loading mechanism
of the solar
wind deceleration seems to be attractive, we meet with several serious observational and theoretical problems.
Unlike the comet case, there is not enough room near Mars for quick assimilation of pickup ions and effective mass loading. The characteristic scale of pitch angle diffusion of exospheric protons (the scale of assimila- tion into the solar wind flow due to scattering on low-
frequency
wave turbulence)
is • 15RM [Barabash
et
al., 1991]. For oxygen ions with gyroradius of • 8RM, we even meet with more serious problems applying the •MHD approach for description of mass loading. A kinetic approach, which is more appropriate for the Mars conditions, assumes that the momentum trans-
fer is most efficient in the case where the IMF is in
the perpendicular direction with respect to the X axis (qo • 90ø). However, the observations show that decel- eration becomes stronger with decrease of the cone an- gle qo. One may expect also that solar wind mass load- ing should be accompanied by increase of the cross-flow component of the magnetic field in the subsolar region. On the contrary, increase of the Bx component and de- crease of the cross-flow By. component with decrease of the solar wind speed is observed. One might expect that mass loading result in at least a weak enhancement of the field value. On the contrary, the observations in- dicate the opposite trend.
4.2. Alfven Waves
Correlation between perturbations in flow and mag- netic field indicate at a transient origin of the deceler- ation events. For example, in large-amplitude Alfven waves perturbations of the velocity v and the magnetic field b are closely related and follow Walen's relation
v - +b/(47rp)
1/2 - +KAb, where
p is the plasma
mass
density,
KA=l/(47rp)
1/2. Addressing
the question
of
whether the observed events are transient and causedby Alfven waves propagating in the solar wind, we com- pared the field and the velocity variations. In most cases, the perturbations in the Vx and B• components are well correlated. Figure 10 shows a relationship be- tween the vx and b• components measured upstream of the bow shock on three elliptical orbits (February 1, 4, and 8, 1989). It is worth noting that we neglect the
solar wind aberration and assume that V• = V. A lin-
ear dependence of v• - Kbx with K - 15 km nT -1
s -1 and 16.7 km nT -1 s -1 is observed
in the elliptical
orbits on February 1 and 4, respectively. The factor
K• - 22/n
1/2 km nT -1 s -1 (n is the plasma
num-
ber density) expected
for Alfven waves [Belcher
and
Davis, 1971] is well fitted with the observations
(K•
-15.6 (n - 2 cm
-a) and K• =16.9 (n- 1.7 cm-a),
respectively). Perturbations in the solar wind speed oc- cur more at random on February 8, and identification of Alfven waves seems rather ambiguous although the values of K and K• are nearly equal (K - 14.6, KA -- 16.9). The important point is that in all elliptical or- bits, perturbations in flow and magnetic field observed
at planetocentric distances R <_ 6000 km do not follow
the Walen relation. In Figure 11 a relationship between the perturbations of velocity and magnetic field on two
7566 DUBININ ET AL.' UPSTREAM REGION NEAR MARS 75 50 25 0 -25 FEBRUARY 1, 1989, 1520-1810 UT -3 4O bx, nT FEBRUARY 4, 1989, 2100-2350 UT o o o o ß I ' I I I
-•
-2
-1
0
1
bx, nT FEBRUARYS, 1989 0355-0515 UT10
,q•o%o.•i•
•o•
ø
• 0 - " o • 0> -10
....o-•'"•
I I -1 0 1 bx, nTFigure 10. Relationship between the v• and b• com- ponents of the perturbations measured upstream of the bow shock on three ellipticM orbits (February 1, 4, and
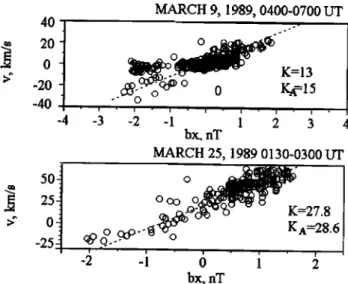
circular orbits is plotted. A linear dependence between the perturbations with the coefficient of K - 13 close
Alfven wave factor (KA -- 15) suggests
the wave
origin
of the variations observed on March 9, 1989. The rela-
tionship between vx and bx perturbations on March 25, 1989, is also close to the linear one with K - 27.8 (KA - 28.9).
In Walen's relation a plus (minus) sign is taken as
sign of the product (-kBo) and varies
in dependence
on the wave propagation vector k with respect to the ambient magnetic field Bo. The in-phase relationship between perturbations in velocity and magnetic field observed in all previous events suggests an antisunward direction of wave propagation. An Alfven wave travel- ing in the antisunward direction, opposite to the IMF, perturbs the field and the solar wind velocity with an in- phase relationship between v and b. If the perturbation bx > 0, the tangent line turns from its nominal position shown by the solid arrow TL and appears in the loca-
tion 1 (Figure 12). Then, an observer
at point O occurs
in the foreshock and records a decrease of the solar windvelocity (I Vo + v I<l Vo I, Vo < o, v > 0). For the
perturbation
with b• < 0 (v• < 0) the tangent
line goes
to the location 2 and the observer arrives in the solarwind (a < 0). The perturbed
velocity
I Vo +v I>l Vo I
increases. Thus the observations in the undisturbedsolar wind (a < 0) of ascending
tones
in the B•(a ) di-
agrams
(see,
for example,
Figure 7) are easily
explained
by large-amplitude Alfven waves propagating in the so- lar wind. The magnitude of the magnetic field and the plasma density do not vary significantly in the solar wind, which also supports our suggestion that the vari- ations in the field direction and the solar wind velocity are controlled by Alfven waves.
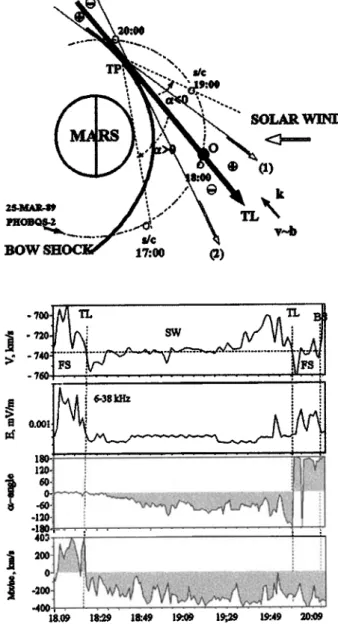
A similar pattern could be expected if large-amplitude Alfven waves are generated at or near the foreshock boundary. The only difference is that disturbances would be localized in the region adjacent to the tan- gent line. The scheme shown in Figure 12(top) illus- trates appearance of acceleration/deceleration events near the tangent line. The interesting effect is that the sign of perturbations is opposite near the foreshock boundary located downstream with respect to the tan- gent point. Figure 12 (bottom) gives the example of the measurements made near both segments of the tan- gent line, upstream and downstream relative to the tan- gent point. The solar wind speed, the amplitude of electron plasma emissions, the angle c•, and antisun- ward/sunward anisotropy of fluxes of suprathermal elec- trons are shown. The upstream edge of the electron foreshock is clearly identified at 1823 UT by the onset of electron plasma waves, change of signs of the angle c•, and anisotropy of electron fluxes. A crossing of the tangent line downstream with respect to the tangent point occurs at -• 1959 UT. At the upstream crossing, the plasma accelerates upstream of the tangent line and decelerates downstream. The opposite sequence of the events is observed at the second crossing, downstream of the tangent point. Slow down of the solar wind at 1930-2000 UT is followed by plasma acceleration. Sim- ilar acceleration/deceleration events accompanying by bipolar variations of the magnetic field are often ob-
served
near the tangent line [Dubinin et al., 1999].
Bipolar variations of the magnetic field centered at the
MARCH 9, 1989, 0400-0700 UT 40 20 o
0
K=13-20
bx, nT MARCH 25, 1989 0130-0300 UT• 50
2•
Oco
o
o
?•
..•
<•
•q&.o
=27.8
•s
o _c:•"•'•o
-
KA=28'6
e o...-
I re , ' I-2
-1
6 '
i
' ' 5
bx, nTFigure 11. Relationship between the vx and b• com- ponents measured upstream of the bow shock on two