HAL Id: hal-00302286
https://hal.archives-ouvertes.fr/hal-00302286
Submitted on 21 Nov 2006HAL is a multi-disciplinary open access
archive for the deposit and dissemination of sci-entific research documents, whether they are pub-lished or not. The documents may come from teaching and research institutions in France or abroad, or from public or private research centers.
L’archive ouverte pluridisciplinaire HAL, est destinée au dépôt et à la diffusion de documents scientifiques de niveau recherche, publiés ou non, émanant des établissements d’enseignement et de recherche français ou étrangers, des laboratoires publics ou privés.
Estimating a relationship between aerosol optical
thickness and surface wind speed over the ocean
P. Glantz, D. E. Nilsson, W. von Hoyningen-Huene
To cite this version:
P. Glantz, D. E. Nilsson, W. von Hoyningen-Huene. Estimating a relationship between aerosol optical thickness and surface wind speed over the ocean. Atmospheric Chemistry and Physics Discussions, European Geosciences Union, 2006, 6 (6), pp.11621-11651. �hal-00302286�
ACPD
6, 11621–11651, 2006Estimating a relationship between AOT and wind speed
P. Glantz et al. Title Page Abstract Introduction Conclusions References Tables Figures ◭ ◮ ◭ ◮ Back Close
Full Screen / Esc
Printer-friendly Version
Interactive Discussion
EGU Atmos. Chem. Phys. Discuss., 6, 11621–11651, 2006
www.atmos-chem-phys-discuss.net/6/11621/2006/ © Author(s) 2006. This work is licensed
under a Creative Commons License.
Atmospheric Chemistry and Physics Discussions
Estimating a relationship between aerosol
optical thickness and surface wind speed
over the ocean
P. Glantz1, D. E. Nilsson2, and W. von Hoyningen-Huene2 1
Dept. of Applied Environmental Science (ITM), Stockholm University, Stockholm, Sweden
2
Institute of Environmental Physics (IUP), University of Bremen, Bremen, Germany
Received: 24 October 2006 – Accepted: 13 November 2006 – Published: 21 November 2006 Correspondence to: P. Glantz (paul.glantz@itm.su.se)
ACPD
6, 11621–11651, 2006Estimating a relationship between AOT and wind speed
P. Glantz et al. Title Page Abstract Introduction Conclusions References Tables Figures ◭ ◮ ◭ ◮ Back Close
Full Screen / Esc
Printer-friendly Version
Interactive Discussion
EGU
Abstract
Retrieved aerosol optical thickness (AOT) based on data obtained by the Sea viewing Wide Field Sensor (SeaWiFS) is combined with surface wind speed, obtained at the European Centre for Medium-Range Weather Forecasts (ECMWFs), over the North Pacific for September 2001. In this study a cloud screening approach is introduced
5
in an attempt to exclude pixels partly or fully covered by clouds. The relatively broad swath width for which the nadir looking SeaWiFS instrument scanned over the North Pacific means that the AOT can be estimated according to relatively large range of wind speeds for each of the scenes analyzed. The sensitivity in AOT due to sea salt and hygroscopic growth of the marine aerosols has also been investigated. The validation
10
of the results is based on previous parameterization in combination with the environ-mental quantities wind speed, RH and boundary layer height (BLH), estimated at the ECMWF. In this study a factor of 2 higher mean AOT is obtained for a wind speed up to about 13 m s−1for September 2001 over remote ocean areas. Furthermore, a factor
of 2 higher AOT is more or less supported by the validation of the results.
Approxi-15
mately, 50% of the enhancement seems to be due to hygroscopic growth of the marine aerosols and the remaining part due to increase in the sea salt particle mass concen-trations, caused by a wind driven water vapor and sea salt flux, respectively. Reason-able agreement occurs also between satellites retrieved aerosol optical thickness and AOT observed at several AERONET (Aerosol Robotic NETwork) ground-based remote
20
sensing stations. Finally, possible reasons why relatively large standard deviations occur around the mean values of AOT estimated for a single scene are discussed.
1 Introduction
In addition to an increase of greenhouse gases (e.g., carbon dioxide, ozone, methane and nitrous oxide, among others) it has also been shown that human activities (for
25
ACPD
6, 11621–11651, 2006Estimating a relationship between AOT and wind speed
P. Glantz et al. Title Page Abstract Introduction Conclusions References Tables Figures ◭ ◮ ◭ ◮ Back Close
Full Screen / Esc
Printer-friendly Version
Interactive Discussion
EGU aerosol particles (IPCC, 1995, 2001). Aerosol particles can influence the Earth’s
radi-ation balance directly by scattering or absorbing incoming solar radiradi-ation, or indirectly by influencing the properties of the clouds that are formed on the particles (Charlson, et al., 1992; Twomey, 1977; Twomey et al., 1984). A global mean anthropogenic total forcing is estimated to be of the same order in magnitude (but opposite in sign) as that
5
of greenhouse gases (Charlson et al., 1992; Kiehl and Briegleb, 1993).
The sea salt aerosol has a large influence on the atmospheric sulfur cycle (Chamiedes and Stelson, 1992), and it influences the climate effects of the natural and anthropogenic sulfate aerosol (O’Dowd et al., 1999). It has also been suggested that climate changes may change the primary marine aerosol production significantly
10
either through changes in surface water temperature (M ˚artensson et al., 2003), or wind speed (Latham and Smith, 1990). In addition, sea salt is an important tracer in the cli-mate record of Arctic and Antarctic snow and ice cores. In addition, a seldom quantified fraction of the primary marine aerosol consists of organic carbon, rather than sea salt. In biologically productive areas this fraction may be up to 80–90% (e.g. Cavalli et al.,
15
2004) and mainly of natural biogenic origin, but it may also consists of pollutants or have been influenced by eutrophication in polluted waters, or be more or less absent in remote oceans with low biological productivity. Thereby, though its source is basically a natural source, the sea salt production can be altered by anthropogenic emissions or climate changes and it must be understood and quantified in order to predict the
ra-20
diative forcing by anthropogenic aerosols. Naturally, this uncertainty is important when considering the climate effects of these aerosol particles, especially for the indirect effects, where also the degree of internal or external mixing between sea salt and or-ganics plays a role. However, large part of the oceans has low biological productivity, and there sea salt is probably the dominant component.
25
Approximately 70% of the Earth is covered by ocean. With the possible exception of soil dust, sea salt aerosol from the global oceans is the largest single source of aerosol mass injected into the atmosphere. Sea salt particles are generated by various physical processes, especially the bursting of entrained air bubbles during whitecap formation
ACPD
6, 11621–11651, 2006Estimating a relationship between AOT and wind speed
P. Glantz et al. Title Page Abstract Introduction Conclusions References Tables Figures ◭ ◮ ◭ ◮ Back Close
Full Screen / Esc
Printer-friendly Version
Interactive Discussion
EGU (Blanchard, 1963, 1983; Monahan et al., 1986; M ˚artensson et al., 2003), thus, they
are highly dependent on wind speed (e.g. Nilsson et al., 2001). By using the eddy covariance method Nilsson et al. (2001) found that the measured aerosol number flux increased exponentially with the wind speed. Several model studies show also that the sea-salt particle number and mass concentrations in the marine boundary layers
5
are highly wind dependent (Glantz et al., 2004; Pierce and Adams, 2006). Sea salt aerosol plays an important role in radiative transfer both directly and indirectly, and hence is important for climate change and long-range prediction models (Charlson et al., 1992). This aerosol may be the dominant contributor to light scattering in the cloud-free atmosphere in those regions of the marine atmosphere where wind speeds are
10
high and/or other aerosol sources are weak (O’Dowd et al., 1997; Murphy et al., 1998; Quinn et al., 1998). Predicted sea salt emissions were 3340 Tg in 2000 and increased to 5880 Tg in 2100 (IPCC, 2001). This aerosol source could also potentially be the dominant source of cloud condensation nucleus, especially in remote areas with high wind speed and low water temperature, as was recently predicted by Pierce and Adams
15
(2006) in global simulations using the emission parameterizations by M ˚artensson et al. (2003). Thus, an important negative climate feedback is expected.
Normally, marine boundary layer (MBL) aerosols are hygroscopic and grow to larger sizes at high ambient RHs, which increase their scattering coefficients (Charlson et al., 1984; Hegg et al., 1993; and Covert et al., 1994). The determination of the direct
20
effects of sea salt aerosol (as well as other aerosols) on the earth radiation balance requires, therefore, quantitative information on the optical properties of atmospheric aerosols, with the more geographic resolution the better. If full global surveillance is to be achieved, the effects of sea salt aerosols and humidity (Quenzel and Kaestner, 1980; Durke et al., 1986; Boucher and Anderson, 1995) upon remote sensing of the
25
ocean surface and the lower atmosphere need to be considered.
An example of humidity effect on aerosol properties was shown by Hegg et al. (1997) who found that the contribution of water absorbed by aerosols off the East Coast of the United States can make up to 50% of the total aerosol optical thickness (AOT).
ACPD
6, 11621–11651, 2006Estimating a relationship between AOT and wind speed
P. Glantz et al. Title Page Abstract Introduction Conclusions References Tables Figures ◭ ◮ ◭ ◮ Back Close
Full Screen / Esc
Printer-friendly Version
Interactive Discussion
EGU The question if this contribution can be detected by satellite measurements is raised.
Durkee et al. (1986) showed that variations in upwelling radiance observed by satellite detectors could be related to variations in particle size, which in turn were caused by changes in ambient relative humidity. They reached this conclusion after a study of collocated and simultaneous aerosol measurements from satellites and aircraft off the
5
coast of Monterey, CA, USA. No attempt to derive aerosol hygroscopicity was made because of the limited spectral and angular information available from the detectors used.
In perspective to the above studies the ultimate objective is to investigate the rela-tionship between aerosol optical properties and wind speed and better understand the
10
individual influences from sea salt particles and humidity. The main objectives with this study are the following:
1. Estimate the relationship between aerosol optical thickness and wind speed over remote ocean areas and develop a parameterization of the aerosol optical thick-ness as a function of wind speed.
15
2. Determine the individual role of sea salt aerosol and relative humidity on the en-hanced aerosol optical thickness.
3. Comparing satellite retrieved aerosol optical thickness with measurements ob-tained at AERONET (Aerosol Robotic NETwork) ground-based remote sensing stations.
20
2 Data
2.1 SeaWiFS
The Sea viewing Wide Field Sensor (SeaWiFS) nadir looking instrument is mounted on the SeaStar spacecraft, which was launched on the 1 August 1997. SeaWiFS consists
ACPD
6, 11621–11651, 2006Estimating a relationship between AOT and wind speed
P. Glantz et al. Title Page Abstract Introduction Conclusions References Tables Figures ◭ ◮ ◭ ◮ Back Close
Full Screen / Esc
Printer-friendly Version
Interactive Discussion
EGU of an optical scanner and an electronics module and produce data in 8 channels in the
visible and near infrared wavelengths (402–885 nm). The SeaStar orbit is synchronous at 705 km and the equator crossing occurs around noon +20 min corresponding to an orbital period of 99 min. In this study data with a spatial resolution of 1.1 km (local average covering (LAC)) has been analyzed. The swath width of the LAC scenes is
5
2801 km (58.3 degrees). SeaWiFS has been constructed with a scanner tilt mecha-nism, which enables the instrument to be oriented in the long-track direction to +20 or –20 degrees to avoid sun glint effects from the sea surface. Tilting the entire scanner, rather than only a section of the optical train, assures that the SeaWiFS calibration, polarization, and angular scanning characteristics will be identical for all tilt positions
10
and, thereby, simplifies the ground processing of in-flight data. 2.2 Meteorology parameters
Operational meteorological data, with a spatial resolution of 0.25 degrees (∼17 km), produced daily at the European Centre for Medium-Range Weather Forecasts (ECMWFs) Meteorological Archival and Retrieval System (MARS) has been analyzed
15
in this study. Particularly, assimilated fields of 10 m wind speed and relative humidity (RH) as well as the diagnosed boundary layer height (BLH) are used here. In the ex-pression to estimate the BLH the critical Richardson number is included. To identify air mass origin 3-dimensional back trajectories from the NOAA HYSPLIT model has also been investigated.
20
3 Meteorology
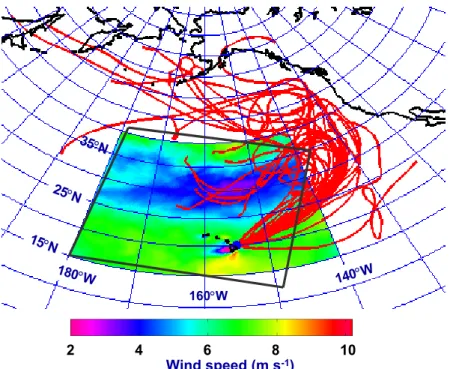
The weather conditions over the North Pacific in summer are highly influenced by a persistent sub tropical high pressure system. Figure 1 shows mean surface wind field over the North Pacific obtained at the ECMWF for September 2001. The figure sug-gests that higher wind speeds seem to have occurred at higher latitudes as well as
ACPD
6, 11621–11651, 2006Estimating a relationship between AOT and wind speed
P. Glantz et al. Title Page Abstract Introduction Conclusions References Tables Figures ◭ ◮ ◭ ◮ Back Close
Full Screen / Esc
Printer-friendly Version
Interactive Discussion
EGU at latitudes lower than about 25◦N during September 2001. The scenes analysed in
this study is shifted somewhat in the west-east direction, while in any case more or less within the operation area denoted by the black rectangle shown in Fig. 2. Further-more, 2-dimensional 10 days back trajectories, with a starting height of 400 m, obtained based on the NOAA HYSPLIT model for each of the days in September 2001, are also
5
shown in the figure. The back trajectories suggest that the air masses at the lower latitudes in the operation area were highly influenced by the sub tropical high pressure system during September 2001. The aerosols near Hawaii can be summarized as “clean marine” most of the year with the exception of spring-time Asian dust-pollution episodes and occasional Hawaii volcano events (Porter et al., 2000). The presence
10
of a pure marine aerosol near Hawaii is, with the exception for one day, supported by retrieved AOT at the AERONET ground-based remote sensing stations, discussed in Sect. 5.3. Furthermore, the back trajectories shown in Fig. 1 suggest that the air in the marine boundary layer near Hawaii in September 2001 within the last 10 days originated from the North Pacific, without any continental influences. Finally, the full
15
operation area shown in Fig. 1 is located relatively far away from continental sources.
4 Method
4.1 Retrieval approach for SeaWiFS data
Aerosol remote sensing requires techniques enabling the determination of AOT. The AOT has been retrieved over ocean surfaces from top-of-atmosphere (TOA) radiance
20
using the nadir looking instrument SeaWiFS. This instrument measures the upwelling or top-of-atmosphere (TOA) radiance ρ(λ) and the solar extraterrestrial irradiance E0(λ). The retrieval approach is based on lookup tables (LUT) describing relation-ship between the measuredρ(λ) and AOT. This requires an adequate set of LUT tak-ing into account all factors which influence the radiative transfer in the atmosphere:
25
ACPD
6, 11621–11651, 2006Estimating a relationship between AOT and wind speed
P. Glantz et al. Title Page Abstract Introduction Conclusions References Tables Figures ◭ ◮ ◭ ◮ Back Close
Full Screen / Esc
Printer-friendly Version
Interactive Discussion
EGU reflectance (different vegetation cover over land), the surface elevation with its surface
pressure conditions (land), and finally the aerosol parameters: aerosol phase function, aerosol optical thickness etc.
The algorithm used in the retrieval of AOT has been developed at the institute of Envi-ronmental Physics (IUP), University of Bremen. The aerosol retrieval method has been
5
tested and validated with SeaWiFS data and with aerosol properties of the closure ex-periment LACE-98 (Lindenberg Aerosol Characterization Exex-periment). For short wave channels (0.412–0.510µm) an agreement between the retrieved and ground-based data within 20% is achieved (von Hoyningen-Huene et al., 2003). For more details about the retrieval method see von Hoyningen-Huene et al. (2003).
10
4.2 Combining retrieved AOT with ECMWF surface wind speed
The comparisons between retrieved AOT, estimated based on SeaWiFS data, and sur-face wind speeds, obtained at the ECMWF, have been performed according to the latter horizontal resolution (∼17 km). Furthermore, to exclude pixels partly or fully covered with clouds a cloud screening approach has been introduced in this study.
15
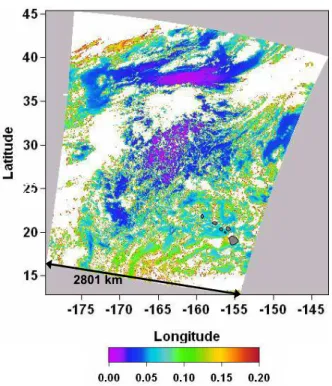
Figure 2 shows an example of retrieved AOT, based on SeaWiFS LAC data, over the North Pacific for 11 September 2001. The white colour shown in the figure denotes areas covered with clouds. A pixel is determined as a cloud pixel ifρTOA>0.2.
Further-more, in order to exclude pixels partly covered with clouds grid boxes with a resolution of 4×4 LAC pixels have been analyzed. If the standard deviation of the AOT divided
20
by the mean AOT is lower than 0.5 for each of these grid boxes and the number of aerosol pixels with AOT<0.15 is larger than 8 the grid box is classified as cloud-free and assumed to contain pure marine aerosols.
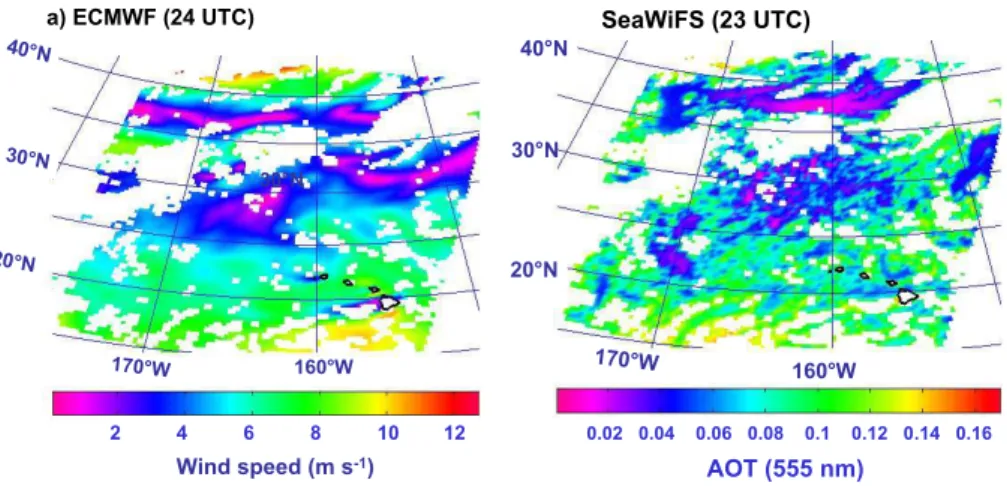
Figure 3a shows surface wind field estimated over the North Pacific at 24:00 UTC for the 11 September by the ECMWF model. Furthermore, calculated mean AOT,
25
according to the ECMWF spatial resolution (∼17 km), over the same area and for the same day (∼23:00 UTC) is shown in Fig. 3b. The figures show a striking resemblance, which suggests that the retrieved AOT was sensitive to the surface wind speed over
ACPD
6, 11621–11651, 2006Estimating a relationship between AOT and wind speed
P. Glantz et al. Title Page Abstract Introduction Conclusions References Tables Figures ◭ ◮ ◭ ◮ Back Close
Full Screen / Esc
Printer-friendly Version
Interactive Discussion
EGU large areas of the North Pacific, although weak or no correlations occur between the
two quantities over some areas.
4.3 Estimating AOT according to environmental quantities
In an attempt to validate the present results the sensitivity in AOT due to increased sea salt particle mass concentrations and hygroscopic growth of the marine aerosols
5
has been investigated. These two latter quantities are both highly influenced by the surface wind speed. In this study their individual role on AOT has been investigated. To estimate the absolute changes in AOT due to increased sea salt particle mass concentrations, without hygroscopic growth, the following expressions are used:
AOTampSS(Ui) = MampSS(Ui) ∗ ke∗ BLH1, i = 1, 2. . .13 (1)
10
MampSS(Ui) = 0.1 ∗ 3.4e0.21∗Ui ∗ [GF(RH1)/GF(RH = 80%)]3
AOTcmpSS(Ui) = McmpSS(Ui) ∗ ke∗ 0.5 ∗ BLH1, i = 1, 2. . .13 (2)
McmpSS(Ui) = 0.9 ∗ 3.4e0.21∗Ui∗ [GF(RH1)/GF(RH = 80%)]3
where Ui is the 10 m wind speed obtained at the ECMWF in the range 0 to 13 m s−1
(with an increment of 1 m s−1), M
ampSS and McmpSS are the accumulation-mode and
15
coarse-mode sea salt particle mass concentrations (µg m−3), respectively, related to
observed local wind speed near Hawaii for a RH of 80% (Gong et al., 1997), RH1and BLH1are the mean relative humidity and boundary layer height, respectively, estimated by the ECMWF model for the lowest wind speed range 0 to 1 m s−1, GF is the growth
factor (Seinfeld and Pandis, 1998), and ke is the specific extinction (m2g−1). For the 20
latter quantity values of 8.7 and 1.9 m2g−1are used for the submicron and supermicron
sea salt particle sizes, respectively, corresponding to a RH of 70% (Quinn and Coffman, 1999). Several studies suggest that the major fraction of sea salt mass is distributed in the coarse-mode particle size range and that relatively strong vertical gradients appear
ACPD
6, 11621–11651, 2006Estimating a relationship between AOT and wind speed
P. Glantz et al. Title Page Abstract Introduction Conclusions References Tables Figures ◭ ◮ ◭ ◮ Back Close
Full Screen / Esc
Printer-friendly Version
Interactive Discussion
EGU in the boundary layer for these particle sizes (Glantz et al., 2004; Gong et al., 1997).
Thus, here we assume that 90% of the total sea salt particle mass concentrations were associated with coarse-mode particles over the North Pacific, while the remaining 10% was associated with accumulation-mode particles. Furthermore, we assume also that latter particles were well mixed in the marine boundary layers while the former particles
5
had scale heights corresponding to 50% of the BLHi estimated by the ECMWF model. The total change in AOT, caused by increased sea salt particle mass concentra-tions and hygroscopic growth of the sea salt and ammonium sulfate aerosols, can be calculated by the following expression:
AOTTot(Ui, RHi) =nAOTobsNH
4SO4(U1) ∗ [GF(RHi)/GF(RH1)] 2 + 10 AOTampSS(Ui) ∗ [GF(RHi)/GF(RH1)]3+ AOTcmpSS(Ui) ∗ [GF(RHi)/GF(RH1)]3 o ∗ [BLHi/BLH1], i = 1, 2..13 (3)
where AOTobsNH
4SO4(U1) is aerosol optical thickness associated with ammonium
sul-fate corresponding to the wind speed range 0 to 1 m s−1, and where the last term
BLHi/BLH1 is the relative change in the boundary layer height. For the ammonium
15
sulfate particles it is only a relative change in AOT that is estimated and the first term in (3) is based on a work by Charlson et al. (1978).
Thus, this study assumes that the MBL over the North Pacific contained mainly am-monium sulfate particles during the low wind speed conditions and the hygroscopic growth occurred for an external mixture of ammonium sulfate and sea salt aerosols.
20
The latter means that the sea salt and ammonium sulfate aerosols are considered consequently with separated optical identities.
ACPD
6, 11621–11651, 2006Estimating a relationship between AOT and wind speed
P. Glantz et al. Title Page Abstract Introduction Conclusions References Tables Figures ◭ ◮ ◭ ◮ Back Close
Full Screen / Esc
Printer-friendly Version
Interactive Discussion
EGU
5 Results
In this section results of AOT as a function of wind speed over the North Pacific are presented both for a case study (11 September 2001) and also as averaged values ac-cording to 26 days of September 2001. Unfortunately for three days 3/9, 12/9 and 15/9 no data has been obtained over the North Pacific by SeaWiFS and for the remaining
5
day 17/9 there is problem to run the corresponding LAC field. In this section validation of the results will also be presented as well as comparisons with AERONET data. 5.1 Retrieved AOT as a function of surface wind speed
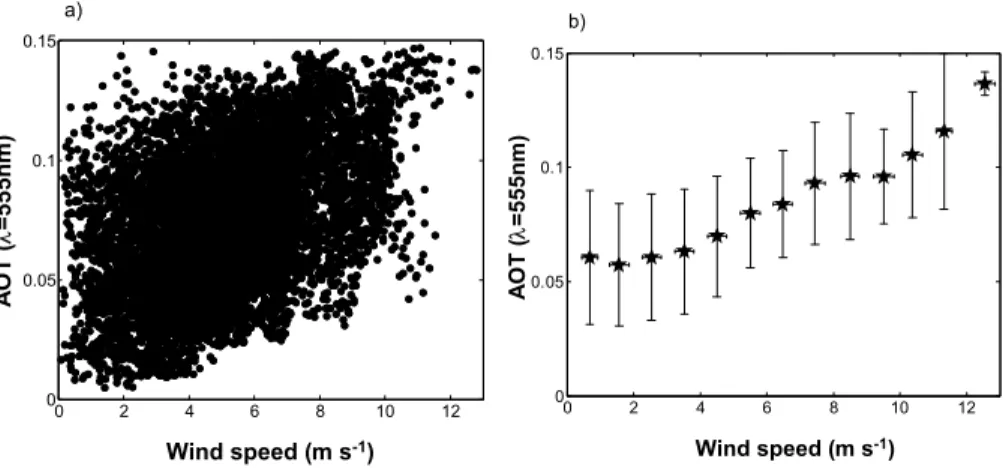
Figure 4a shows a scatter plot of AOT as a function of surface wind speed based on the fields corresponding to the 11 September 2001 shown in Figs. 3a and 3b. Furthermore,
10
Furthermore, Fig. 4b shows calculated mean AOT and corresponding one standard deviation as a function of the surface wind speed based on the results shown in Fig. 4a. These results show a relatively strong relationship between mean AOT and surface wind speed, while the variability around the mean values is large. Note that the mean AOT is less sensitive to wind speed in the lowest wind speed range up to about 4 m s−1, 15
which is the wind speed when ocean surface waves typically begin to break and white cap formation start.
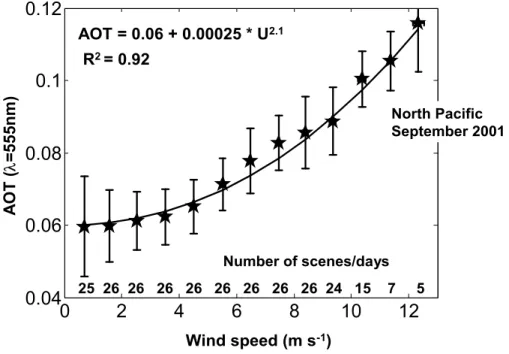
Figure 5 shows mean AOT and corresponding one standard deviation for the wave-length 0.555µm (SeaWiFS, channel 5) as a function of 10 m wind speed (ECMWF), based on retrieved scenes over the North Pacific for September 2001. The numbers of
20
days/scenes that are included in the analyses are also shown in the figure. The solid line is a power fit AOT=0.06+0.00025*U2.1with a correlation coefficient R2of 0.92. The figure shows clearly that the retrieved mean AOT were sensitive to changes in the wind speed over the North Pacific. A difference in AOT with nearly a factor of 2 between high and low wind speed conditions over the North Pacific for the days in September
25
ACPD
6, 11621–11651, 2006Estimating a relationship between AOT and wind speed
P. Glantz et al. Title Page Abstract Introduction Conclusions References Tables Figures ◭ ◮ ◭ ◮ Back Close
Full Screen / Esc
Printer-friendly Version
Interactive Discussion
EGU 5.2 Validation of the results: AOT estimated according to environmental quantities
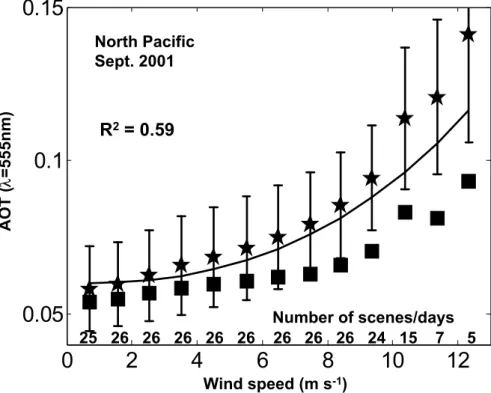
Figure 6 shows estimated AOT obtained based on Eq. (1) to Eq. (3) (Sect. 4.3) and the ECMWF parameters; relative humidity, boundary layer height and surface wind speed. The total change in AOT, according to increased sea salt particle mass concentrations and hygroscopic growth of the marine aerosol is denoted by the stars in the figure.
5
The squares describe the changes that are associated only by hygroscopic growth of the sea salt and ammonium sulfate particles. A correlation coefficient R2=0.59 is ob-tained according to the values denoted by the stars and the power fit shown in Fig. 6, where the latter curve is the same as the one shown in Fig. 5. This curve, representing the satellite retrieved AOT, falls within the one standard deviation of the data used to
10
validate our results, although the validation overshoot slightly below 10 m/s and more over this wind speed. Note that the vertical distributions of the coarse-mode particles assumed in this study are in some sense arbitrary (see Sect. 4.3), and could be ques-tioned. In any case assuming a scale height of 30% instead of 50% reduces the total change in AOT (stars in Fig. 6) only with about 6% for the highest wind speed values
15
and even less for the remaining values. Thus, the difference in retrieved AOT with a factor of 2 increase obtained between the lowest and highest wind speed values shown in Fig. 5 is more or less supported by the results shown in Fig. 6. Furthermore, the re-sults suggest that approximately up to 50% of the enhanced AOT seems to be caused by the hygroscopic growth of the marine aerosols and the remaining part due to
in-20
crease in sea salt particle mass concentrations. Finally, lower aerosol optical thickness retrieved in this study compared with the estimated values, shown in Fig. 6 for wind speeds above 10 m s−1, may at least partly be due the criteria of only including pixels
with AOT<0.15 in the analyses (see Sect. 4.2).
5.3 Satellite retrieved AOT compared with AERONET data
25
The retrieved aerosol optical thickness obtained in the present study is in this sec-tion compared with AOT obtained at several AERONET (AEronet RObotic
NET-ACPD
6, 11621–11651, 2006Estimating a relationship between AOT and wind speed
P. Glantz et al. Title Page Abstract Introduction Conclusions References Tables Figures ◭ ◮ ◭ ◮ Back Close
Full Screen / Esc
Printer-friendly Version
Interactive Discussion
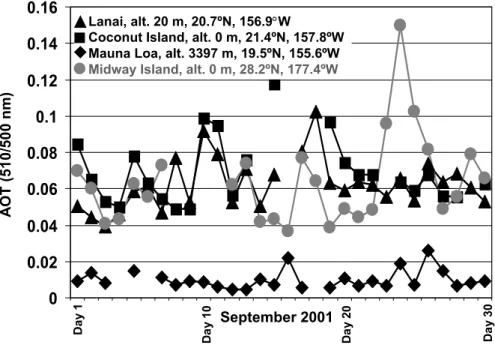
EGU work) ground-based remote sensing stations; Mauna Loa (altitude 3397 m, 19.5◦N,
155.6◦W), Lanai (altitude 20 m, 20.7◦N, 156.9◦W), Coconut Island (altitude 0m,
21.4◦N, 157.8◦W) and Midway Island (altitude 0 m, 28.2◦N, 177.4◦W). The three first
stations are located at Hawaii and Midway Island somewhat west of the present opera-tion area. Figure 7 shows daily averaged AOT obtained at these staopera-tions for September
5
2001. At the AERONET ground-based stations a cloud screening approach has been included in the estimations of AOT. We see that the AOT estimated over the Mauna Loa station indicate that aerosol scattering of direct radiation was relatively low in the free troposphere during September 2001. Furthermore, the figure shows that similar variability in AOT occurred occasionally at the Lanai and Coconut stations and that the
10
ratio between the highest and lowest values is about a factor of 2.
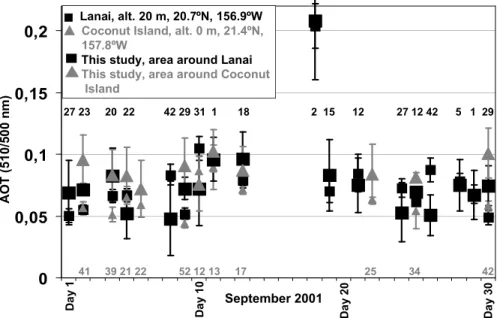
Figure 8 shows satellite retrieved aerosol optical thickness compared with AOT ob-tained at the Lanai and Coconut Island AERONET ground-based remote sensing sta-tions for days in September 2001. For the latter two stasta-tions the AOT shown in the figure have been averaged around the time when the SeaWiFS satellite passed over
15
Hawaii and the error bars correspond to one standard deviation. The satellite retrieved AOT with corresponding one standard deviation shown in Fig. 8 have been estimated over ocean areas in connection to these islands and not particularly for the pixels cor-responding to the two station areas. This is because the AOT retrieved over the land areas were significant higher than over the ocean for the scenes analyzed here. This
20
could be due to uncertainties in the surface characteristics of the islands, described in the model, which causes errors in the retrieved AOT. Furthermore, for some of the days no values have been estimated. This is because during these days extensive cloud decks were presented over the islands as well as the surrounding ocean or no results are reported from the AERONET stations. Figure 8 shows that the agreement
25
between satellite and ground retrieved AOT is approximately within 50% for both Lanai and Coconut Island for the days in September 2001, and actually much better on most of the days. The overall variability is also catched by the comparison.
ACPD
6, 11621–11651, 2006Estimating a relationship between AOT and wind speed
P. Glantz et al. Title Page Abstract Introduction Conclusions References Tables Figures ◭ ◮ ◭ ◮ Back Close
Full Screen / Esc
Printer-friendly Version
Interactive Discussion
EGU 5.4 Discussion
By analysing a relatively large area over the North Pacific and calculate average values according to all scenes analyzed this study seems to capture a strong relationship between mean AOT and surface wind speed for the month of September 2001. From empirically derived parameterizations, we know that the emissions of both sea salt and
5
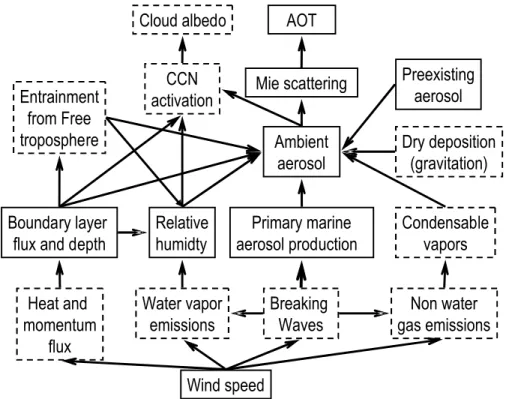
water vapor over the oceans are dependent on the surface wind speed, see Fig. 9. In most cases, the water vapor fluxes (or in many applications the latent heat flux) have been shown to be linearly dependent on the wind (through the drag coefficient), see for example Subrahamanyan and Ramachandran (2003) and Zang and Perrie (2006). Considering previous parameterized source fluxes of sea salt (for example Monahan
10
et al., 1986; M ˚artensson et al., 2003; Clarke et al., 2006) most of them follows the relationship with wind speed U3.41, or similarly, from any of the many formulations of the white cap fraction (e.g. Monahan and O’Muircheartaigh, 1980). It should be noted that the bubble mediated aerosol production in breaking waves as well as the spume drops thorn from wave crests are not only a sea salt source, but also a source
15
of humidity as part of them evaporates, as indicated by the arrow that connects the “breaking waves” -box with the “water vapor emissions”-box in Fig. 9. Finally, vertical transport fluxes as well as the boundary layer height will be increased by increasing wind speed, which will dilute the produced aerosol and water vapor concentrations, see Fig. 9. Even the entrainment of free tropospheric aerosols into the marine boundary
20
layer will partly depend on the wind speed, as may the available condensable vapor concentration (through for example the sources of Dimethylsulfide) that may contribute to the ageing of the aerosol and modify its cloud condensation nuclei (CCN) properties, see Fig. 9. It is however reasonable to assume given our results that the salt and vapor emissions are the dominant wind driven factors behind the AOT-wind relationship. The
25
wind relationship obtained in this study between AOT and wind speed (∼2.1), see Fig. 5, are in between those most commonly found in literature for water vapor (∼1) and sea salt (∼3.4). This is reasonable as the AOT-wind relationship must be a mixture
ACPD
6, 11621–11651, 2006Estimating a relationship between AOT and wind speed
P. Glantz et al. Title Page Abstract Introduction Conclusions References Tables Figures ◭ ◮ ◭ ◮ Back Close
Full Screen / Esc
Printer-friendly Version
Interactive Discussion
EGU of these processes.
The humidity is expected to be vertically well mixed in the MBL (Svensson et al., 2000; Glantz et al., 2004), while sea salt is influenced by several processes that seem to create vertical gradients in the concentrations (Gong et al., 1997; Glantz et al., 2004). Gravitational settling and dry deposition have strong influence on the supermicron
par-5
ticles and will counteract the vertical turbulent transport, see Fig. 9. In any case, there is no doubt that sea salt particles seems to be the dominant aerosol fraction in the MBL when higher wind speeds occur and/or other aerosol sources are weak (O’Dowd et al., 1997; Murphy et al., 1998; Quinn et al., 1998; Hoell et al., 2000; Glantz et al., 2004). The sea salt as well as ammonium sulfate aerosols rapidly grow to particle sizes that
10
are dependent on the relative humidity in the MBL, see Fig. 9. As noted above, the available water vapor depends also on that higher wind speeds increase the emissions of water vapor into the MBL, but could on the other hand increase the boundary layer height as a result of more efficient vertical mixing and then entrain dry free tropospheric air, which would tend to decrease the humidity. In any case, the assumption that the
15
marine aerosols grow to larger particle sizes due to water uptake and consequently influence the direct radiation back to space significantly is supported by the validation of the present result. Evidently, the column relative humidity is increasing due to higher wind speeds, despite that we use both wind speed and boundary layer height from the ECMWF model. If the height of the boundary layer increases the sea salt aerosol is
di-20
luted in a larger volume, resulting in lower concentration, but not less AOT as the same aerosol mass will remain in the boundary layer although distributed over a deeper col-umn. Hence, it is reasonable to assume that the wind influence on the boundary layer height is a) minor and b) have been incorporated in our parameterization. Considering entrainment, the free troposphere aerosols that may be entrained in such conditions
25
could also grow rapidly according to the higher RH in the marine boundary layer and, therefore, contribute to the increased scattering of short-wave radiation back to space. It is therefore not obvious that the wind-entrainment influence is positive or negative. We have not specifically included entrainment in the validation of our parameterization,
ACPD
6, 11621–11651, 2006Estimating a relationship between AOT and wind speed
P. Glantz et al. Title Page Abstract Introduction Conclusions References Tables Figures ◭ ◮ ◭ ◮ Back Close
Full Screen / Esc
Printer-friendly Version
Interactive Discussion
EGU so it remains an open question if that effect has somehow modified our results.
Even as a relatively strong relationship is obtained between mean aerosol optical thickness and surface wind speed based on the scenes/days analysed in this study (Fig. 5) the variability around the mean AOT obtained for each of these days is large (not shown), similar to the results shown in Fig. 4a and Fig. 4b. There could be several
5
explanations for this. First of all the relationship between sea salt and surface wind speed may not be strong locally due to the relatively long turn over time for the submi-cron particles (Gong et al., 1997). Even so, the supermisubmi-cron particles as well as the hygroscopic growth and boundary layer height are all expected to be highly sensitive to the local surface wind speed. Secondly, the fields of wind speed, relative humidity
10
and boundary layer height, respectively, calculated at the ECMWF may be associated with relatively large uncertainties, and may not be able to catch all local and temporal variability. For the third the present approach to estimate AOT probably also induces uncertainties that could be significant. One affect that is not included in the present re-trieval approach is bright foam from whitecaps, which could cause spurious backscatter
15
that could be interpreted as aerosol. In any case, several studies do not show substan-tially increased AOT for conditions when whitecaps coverage are expected to be higher (Erickson et al., 1986; Ignatov et al., 1995). Based on an analyses of Koepke (1984) and Monahan and O’Muircheartaigh (1980), the latter study concluded that foam has a small effect on the retrieval of aerosol optical thickness; according to channel 1 of the
20
advanced very high resolution radiometer (AVHRR) product and wind speeds of 5 to 8 m s−1increased the AOT by less than 0.005.
6 Summary and conclusions
In this study we have combined retrieved AOT, based on data obtained by the SeaWiFS satellite instrument, and surface wind speed, obtained at the ECMWF, over the North
25
Pacific for September 2001. During this season the continental aerosols are expected to have minor influences on the air masses over the investigated area, middle part
ACPD
6, 11621–11651, 2006Estimating a relationship between AOT and wind speed
P. Glantz et al. Title Page Abstract Introduction Conclusions References Tables Figures ◭ ◮ ◭ ◮ Back Close
Full Screen / Esc
Printer-friendly Version
Interactive Discussion
EGU of the North Pacific. Furthermore, in summer the North Pacific is to a less extent
covered with clouds compared to other seasons and also compared to other ocean areas. In this study we have introduced a cloud screening approach used in an attempt to exclude pixels partly or fully covered by clouds. The relatively broad swath width for which the nadir looking SeaWiFS instrument scanned over the North Pacific means
5
that the AOT can be estimated according to a relatively large range of wind speeds (ECMWF), 0 to 10 m s−1, for most of the days in September 2001. Additionally, for 5
of the days analyzed here AOT has been estimated according to a wind speed up to 13 m s−1. It should be mentioned that even higher wind speeds seems to have been
occurred over the North Pacific in September 2001, estimated by the ECMWF model.
10
Even so, during these higher wind speeds clouds are presented, determined by the present cloud screening approach.
In this study the sensitivity in AOT due to sea salt and hygroscopic growth has also been investigated. The validation of the results is based on previous parameterization in combination with the environmental quantities wind speed, RH and BLH, estimated
15
at the ECMWF. Furthermore, the satellite retrieved aerosol optical thickness, presented in this study, has been compared with AOT obtained at several AERONET ground-based remote sensing stations.
The following conclusions can be established based on the present study:
1) Nearly a factor of 2 higher AOT is obtained for a wind speed up to about 13 m s−1 20
over remote ocean areas.
2) A factor of 2 higher AOT is more or less supported by the validation of the results. 3) Approximately, up to 50% of the enhanced AOT seems to be due to hygroscopic growth of the marine aerosols and the remaining part due to increase in sea salt particle mass concentrations (without hygroscopic growth).
25
3) Reasonable agreement occurs between satellite retrieved aerosol optical thick-ness and AOT observed from ground
The results presented in this study suggest a significant direct radiative effect over the North Pacific. However, the radiative effect could be lower over oceans where
ACPD
6, 11621–11651, 2006Estimating a relationship between AOT and wind speed
P. Glantz et al. Title Page Abstract Introduction Conclusions References Tables Figures ◭ ◮ ◭ ◮ Back Close
Full Screen / Esc
Printer-friendly Version
Interactive Discussion
EGU organic species, with lower hygroscopicity, are internal mixed with sea salt. One
exam-ple could be over North Atlantic during summer when relatively strong phytoplankton bloom occurs (O’Dowd et al., 2004). In any case, since approximately 70% of the Earth is covered by ocean this study suggests a significant global direct radiative effect. Fur-thermore, the results of a correlation between AOT and wind speed is very promising
5
in the meaning that the latter quantity is associated with relatively small uncertainties in climate model calculations. Additionally, it has been suggested that wind speed may change significantly due to climate changes. Thus, estimating a relationship between AOT and wind speed in the remote marine atmosphere accurately allow a very simple but powerful and direct way to incorporate climate forcing in climate predictions. For
10
this purpose the fit in Fig. 5,
AOT = 0.06 + 0.00025 ∗ U2.1 (4)
may serve as a first one-line parameterization of the whole complex chain of steps from breaking waves to aerosol backscatter.
Having worked for some time with different parts of the complex processes involved,
15
see Fig. 9, when primary marine aerosol particles are emitted, transformed and trans-ported, influenced by boundary layer dynamics and preexisting aerosol particles, to finally perhaps have a direct or indirect effect on the radiation balance, we were initially astonished and surprised by the good agreement between the local wind speed and the local AOT. The AOT is of course more scattered in regard to the wind speed, see
20
Fig. 4a, than the aerosol number emissions (see Nilsson et al., 2001; and Geever et al., 2005) or number concentration usually are. Considering how distant the wind speed and the AOT are in the very opposite ends of a long chain of interactions, the agree-ment is still surprisingly good. Whenever we operate aerosol sampling over oceans we find a nice relationship between the aerosol number or mass and the local wind speed
25
over a wide range of sizes. The actual aerosol number emissions are also always re-lated to the local wind with an exponential behavior over all seas studied so far: The Greenland sea, Barents sea and Arctic Ocean (Nilsson et al., 2001), the North Atlantic (Geever et al., 2005), the Pacific Ocean and the Baltic Sea (yet unpublished material).
ACPD
6, 11621–11651, 2006Estimating a relationship between AOT and wind speed
P. Glantz et al. Title Page Abstract Introduction Conclusions References Tables Figures ◭ ◮ ◭ ◮ Back Close
Full Screen / Esc
Printer-friendly Version
Interactive Discussion
EGU It remains to see how generalized the relationship between the local wind speed and
the AOT can be, but in view of the world-wide well behaved number or mass behavior, we should perhaps dare to be optimistic also on this point.
Having now accepted that the local wind speed can be directly related to an important climate parameter such as AOT, it appears that it may be possible to skip many complex
5
steps when evaluating the climate effects of the primary marine sea salt aerosol and go directly from the local wind speed to the aerosol-radiation impact, even though it is to early to say if the Eq. (4) must somehow be modified to apply to other oceans, seasons or similar.
Acknowledgements. The work has been financed through research grants from the Swedish 10
Research Council for Environment, Agricultural Sciences & Spatial Planning (FORMAS), the European Union project MAP (Marine Aerosol Production by natural sources) and the Swedish Research Council.
References
Blanchard, D. C.: The electrification of the atmosphere by particles from bubbles in the sea, in
15
Progress in Oceanography, 1, 71–2002, Pergamon, New York, 1963.
Blanchard, D. C.: The production, distribution and bacterial enrichment of the sea-salt aerosol, in: The Air-Sea Exchanges of Gases and Particles, edited by: Liss, P. S. and Slinn, W. G. N., 407–454, D. Reidel Norwell, Mass., 1983.
Boucher, O. and Anderson, T. L.: General circulation model assessment of the sensitivity of
20
direct climate forcing by anthropogenic sulfate aerosols to aerosol size and chemistry, J. Geophys. Res., 100, 26 117–26 134, 1995.
Cavalli, F., Facchini, M. C., Decesari, S., et al.: Advances in characterization of size-resolved organic matter in marine aerosol over the North Atlantic, J. Geophys. Res., 109, D24215, doi:10.1029/2004JD005137, 2004.
25
Charlson, R. J., Covert, D. S., and Larson, T. V.: Observations of the effect of humidity on light scattering by aerosols, Hygroscopic aerosols, edited by: Ruhnke, T. H. and Deepak, A., Hampton, VA: A. Deepak, 1994, 35–44, 1984.
ACPD
6, 11621–11651, 2006Estimating a relationship between AOT and wind speed
P. Glantz et al. Title Page Abstract Introduction Conclusions References Tables Figures ◭ ◮ ◭ ◮ Back Close
Full Screen / Esc
Printer-friendly Version
Interactive Discussion
EGU
Charlson, R. J., Schwartz, S. E., Hales, J. M., Cess, R. D., Coakley, J. A., Hansen, J. E., and Hofmann, D. J.: Climate Forcing by Anthropogenic Aerosols, Science, 255, 423–430, 1992. Chamiedes, W. L. and Stelson, A. W., Aqueous phase chemical processes in deliquescent
sea-salt aerosol: a mechanism that couples the atmospheric cycles of S and sea-salt, J. Geophys. Res., 97, 20 565–20 580, 1992.
5
Clarke, A. D., Owens, S. R., and Zhou, J. C.: An ultrafine sea-salt flux from breaking waves: Implications for cloud condensation nuclei in the remote marine atmosphere, J. Geophys. Res., 111(D6), D06202, doi:10.1029/2005JD006565, 2006.
Covert, D. S., Charlson, R. J., and Ahlquist, N. C.: A study of the relationship of chemical composition and humidity to light scattering by aerosols, J. Appl. Meteorol., 11, 968–976,
10
1994.
Durke, P. A., Jensen, D. R., Hindman, E. E., and Von der Haar, T. H.: The relationship between marine aerosol particles and satellite-detected radiance, J. Geophys. Res., 91, 4063–4072, 1986.
Geever, M., O’Dowd, C. D., van Ekeren, S., Flanagen, R., Nilsson, D. E., de Leeuw,
15
G., and Rannik, U.: Submicron sea spray fluxes, Geophys. Res. Lett., 32(15), L15810, doi:10.1029/2005GL023081, 2005
Glantz, P., Svensson, G., Noone, K., and Osborne, S.: Sea-salt aerosols over the north-east Atlantic: Model simulations of the ACE-2 Second Lagrangian experiment, Q. J. R. Meteorol. Soc., 130, 2191–2215, 2004.
20
Gong, S. L., Barrie, L. A., and Blanchet, J. P.:, Modeling sea-salt aerosols in the atmosphere 1. Model development, J. Geophys. Res., 102, 3805–3818, 1997.
Hegg, D. A., Larson, T. L., and Yuen, P. F.: A theoretical study of the effect of relative humidity on light scattering by tropospheric aerosols, J. Geophys. Res., 98, 18 435–18 439, 1993. Hegg, D. A., Livingston, J. M., Hobbs, P. V., Novakov, T., and Russel, P. B.,: Chemical
appor-25
tionment of aerosol column optical depth off the mid-Atlantic coast of the United States, J. Geophys. Res., 102, 25 293–25 303, 1997.
Hoell, C., O’Dowd, C., Osborne, S. R., and Johnson, D.: Time-scale analysis of marine bound-ary layer aerosol evolution: Lagrangian case studies under clean and polluted cloudy condi-tions, Tellus, 52B, 423–438, 2000.
30
IPCC, 1995: Climate change: The science of climate change, edited by: Houghton, J. T., Meria Filho, L. G., Callander, B. A., Harris, N., Kattenberg, A., and Maskell, K., Cambridge University Press, Cambridge, UK, 1995.
ACPD
6, 11621–11651, 2006Estimating a relationship between AOT and wind speed
P. Glantz et al. Title Page Abstract Introduction Conclusions References Tables Figures ◭ ◮ ◭ ◮ Back Close
Full Screen / Esc
Printer-friendly Version
Interactive Discussion
EGU
IPCC, 2001: Climate change: The scientific basis, edited by: Houghton,, J. T., Ding, Y., Griggs, D. J., Noguer, M., van der Linden, P. J., and Xiaosu, D., Cambridge University Press, Cam-bridge, UK, 2001.
Kiehl, J. T. and Briegleb, B. P.: The relative role of sulfate aerosols and greenhouse gases in climate forcing, Science, 260, 311–314, 1993.
5
Latham, J. and Smith M. H.: Effect on global warming of wind-dependent aerosol generation at the ocean surface, Nature, 347(6291), 372–373, 1990.
Monahan, E. C. and O’Muircheartaigh, I.: Optimal power-law description of oceanic whitecap coverage dependence on wind speed, J. Phys. Oceanogr., 10, 2094–2099, 1980.
Monahan, E. C., Spiel, D. E., and Davidson, K. L.: A model of marine aerosol generation via
10
whitecaps and wave disruption, Oceanic Whitecaps, edited by: Monahan, E. C. and Mac Niocaill, G., 167–174, D. Reidal, Norwell, Mass, 1986.
Murphy, D. M., Thomson, D. S., and Mahoney, T. M. J.: In situ measurements of organics, meteoritic material, mercury, and other elements in aerosols at 5 to 19 kilometers, Science, 282, 1664–1669, 1998.
15
M ˚artensson, M. E., Nilsson, D. E., de Leeuw, G., Cohen, L. H., and Hansson, H. -C.: Laboratory simulations and parameterization of the primary marine aerosol production, J. Geophys. Res., 108(D9), 4297–4308, 2003.
Nilsson, E. D., Rannik, ¨U., Swietliccki, E., Leck, C., Aalto, P. P., Zhou, J., and Norman, M.: Tur-bulent aerosol fluxes over the Arctic Ocean: 2. Winddriven sources from the sea, J. Geophys.
20
Res., 106, 32 111–32 124, 2001.
O’Dowd, C., Smith, M. H., Consterdine, I. E., and Lowe, J. A.: Marine aerosol, sea-salt, and the marine sulphur cycle: A short review, Atmos. Environ., 31, 73–80, 1997.
O’Dowd, C. D., Lowe, J. A., and Smith M. H.: Coupling sea-salt and sulphate interactions and its impact on cloud droplet concentration predictions, Geophys. Res. Lett., 26(9), 1311–1314,
25
1999.
O’Dowd, C. D., Facchini, M. C., Cavalli, F., Ceburnis, D., Mircea, M., Decesari, S., Fuzzi, S., Yoon, Y. J., and Putaud, J.-P.: Biogenically driven organic contribution to marine aerosol, Nature, 431, 676–680, 2004.
Pierce, J. R. and Adams, P. J.: Global evaluation of CCN formation by direct emission of sea salt
30
and growth of ultrafine sea salt, J. Geophys. Res., 111, D06203, doi:10.1029/2005JD006186, 2006.
ACPD
6, 11621–11651, 2006Estimating a relationship between AOT and wind speed
P. Glantz et al. Title Page Abstract Introduction Conclusions References Tables Figures ◭ ◮ ◭ ◮ Back Close
Full Screen / Esc
Printer-friendly Version
Interactive Discussion
EGU
obtain calibrated aerosol scattering coefficients from coastal lidar in Hawaii, J. Atmos. Ocean. Techn., 17, 1445–1454, 2000.
Charlson, R. J., Covert, D. S., Larson, T. V., and Waggoner, A. P.: Chemical properties of tropospheric sulfur aerosols, Atmos. Environ., 12, 39–53, 1978.
Quenzel, H. and Kaestner, M.: Optical properties of the atmosphere: calculated variability and
5
application to satellite remote sensing of phytoplankton., Appl. Opt., 19, 1338–1344, 1980. Quinn, P. K., Coffman, D. J., Kapustin, V. N., Bates, T. S., and Covert, D. S.: Aerosol optical
properties in the marine boundary layer during the First Aerosol Characterization Experiment (ACE 1) and the underlying chemical and physical aerosol properties, J. Geophys. Res., 103, 16 547–16 563, 1998.
10
Quinn, P. K. and Coffman, D. J.: Comment on “Contribution of different aerosol species to the global aerosol extinction optical thickness: Estimates from model results” by Tegen et al., J. Geophys. Res., 104, 4241–4248, 1999.
Seinfeld, J. H. and Pandis, S. N.: Atmospheric chemistry and physics, John Wiley & Sons, Inc., New York, USA, 1998.
15
Subrahamanyam, D. B. and Ramachandran, R.: Wind speed dependence of air-sea exchange parameters over the Indian Ocean during INDOEX, IFP-99, Ann. Geophys., 21, 1667–1679, 2003.
Svensson, G., Tjernstr ¨om, M., and Koracin, D.: The sensitivity of a stratocumulus transition: Model simulations of the ASTEX first Lagrangian, Bound.-Layer Meteorol., 95, 57–90, 2000.
20
Twomey, S.: The Influence of Pollution on the Shortwave Albedo of Clouds, J. Atmos. Sci., 34(7), 1149–1152, 1977.
Twomey, S. A., Piepgrass, M., and Wolfe, T. L.: An assessment of the impact of pollution on global cloud albedo, Tellus, 36, 356–366, 1984.
von Hoyningen-Huene, W., Freitag, M., and Burrows, J. B.: Retrieval of aerosol optical
thick-25
ness over land surface from top-of-atmosphere radiance, J. Geophys. Res., 108(D9), 4260, doi:10.1029/2001JD002018, 2003.
Zang, W. and Perrie, W.: Impacts of waves and sea spray on midlatitude storm structure and intensity, Monthly Weather Rev., 134, 2418–2442, 2006.
ACPD
6, 11621–11651, 2006Estimating a relationship between AOT and wind speed
P. Glantz et al. Title Page Abstract Introduction Conclusions References Tables Figures ◭ ◮ ◭ ◮ Back Close
Full Screen / Esc
Printer-friendly Version Interactive Discussion EGU 140W 35N 15N 180W 25N 160W 2 4 6 8 10 Wind speed (m s-1)
Fig. 1. Mean surface wind field for September 2001 obtained at the ECMWF. The solid red lines denote 10 days back trajectories with a starting height of 400 m at 24:00 UTC obtained by the NOAA HYSPLIT model. The black rectangle denotes the present operation area.
ACPD
6, 11621–11651, 2006Estimating a relationship between AOT and wind speed
P. Glantz et al. Title Page Abstract Introduction Conclusions References Tables Figures ◭ ◮ ◭ ◮ Back Close
Full Screen / Esc
Printer-friendly Version Interactive Discussion EGU 2801 km 0.00 0.05 0.10 0.15 0.20 La tit u de
Fig. 2.Retrieved AOT, based on SeaWiFS LAC data (channel 5), over the North Pacific on the 11 September 2001.
ACPD
6, 11621–11651, 2006Estimating a relationship between AOT and wind speed
P. Glantz et al. Title Page Abstract Introduction Conclusions References Tables Figures ◭ ◮ ◭ ◮ Back Close
Full Screen / Esc
Printer-friendly Version Interactive Discussion EGU 40°N 30°N 20°N a) ECMWF (24 UTC) 2 4 6 8 10 12 Wind speed (m s-1) 30°N 160°W 170°W AOT (555 nm) 40°N 30°N 160°W 170°W 20°N SeaWiFS (23 UTC) 0.02 0.04 0.06 0.08 0.1 0.12 0.14 0.16
Fig. 3. (a)surface wind speed and (b) retrieved AOT obtained by the ECMWF model and based on SeaWiFS data, respectively, for the 11 September 2001.
ACPD
6, 11621–11651, 2006Estimating a relationship between AOT and wind speed
P. Glantz et al. Title Page Abstract Introduction Conclusions References Tables Figures ◭ ◮ ◭ ◮ Back Close
Full Screen / Esc
Printer-friendly Version Interactive Discussion EGU 0 2 4 6 8 10 12 0 0.05 0.1 0.15 Wind speed (m s-1) A O T ( = 5 5 5 n m ) a) 0 2 4 6 8 10 12 0 0.05 0.1 0.15 A O T ( = 5 5 5 n m ) Wind speed (m s-1) b)
Fig. 4. (a)scatter plot of AOT, and (b) mean AOT and corresponding one standard deviations as a function of wind speed, respectively, obtained for the 11 September 2001.
ACPD
6, 11621–11651, 2006Estimating a relationship between AOT and wind speed
P. Glantz et al. Title Page Abstract Introduction Conclusions References Tables Figures ◭ ◮ ◭ ◮ Back Close
Full Screen / Esc
Printer-friendly Version Interactive Discussion EGU
0
2
4
6
8
10
12
0.04
0.06
0.08
0.1
0.12
25 26 26 26 26 26 26 26 26 24 15 7 5 North Pacific September 2001 Wind speed (m s-1) A O T ( = 5 5 5 n m ) AOT = 0.06 + 0.00025 * U2.1 R2 = 0.92 Number of scenes/daysFig. 5. Retrieved mean AOT and corresponding one standard deviations, for the wavelength 0.555µm (SeaWiFS channel 5), as a function of 10 m wind speed (ECMWF), estimated over
ACPD
6, 11621–11651, 2006Estimating a relationship between AOT and wind speed
P. Glantz et al. Title Page Abstract Introduction Conclusions References Tables Figures ◭ ◮ ◭ ◮ Back Close
Full Screen / Esc
Printer-friendly Version Interactive Discussion EGU
0
2
4
6
8
10
12
0.05
0.1
0.15
A O T ( = 5 5 5 n m ) Wind speed (m s-1) 25 26 26 26 26 26 26 26 26 24 15 7 5R
2= 0.59
North Pacific Sept. 2001 Number of scenes/daysFig. 6. AOT estimated according to Eq. (1) to Eq. (3) in the text and the ECMWF parame-ters; relative humidity, wind speed and boundary layer height. Stars are mean AOT and cor-responding one standard deviation estimated according to increase in sea salt particle mass concentrations and hygroscopic growth of sea salt and ammonium sulfate particles. Squares are mean AOT estimated according to hygroscopic growth of sea salt and ammonium sulfate particles only.
ACPD
6, 11621–11651, 2006Estimating a relationship between AOT and wind speed
P. Glantz et al. Title Page Abstract Introduction Conclusions References Tables Figures ◭ ◮ ◭ ◮ Back Close
Full Screen / Esc
Printer-friendly Version Interactive Discussion EGU 0 0.02 0.04 0.06 0.08 0.1 0.12 0.14 0.16 0 1 /0 9 /0 1 0 2 /0 9 /0 1 0 3 /0 9 /0 1 0 4 /0 9 /0 1 0 5 /0 9 /0 1 0 6 /0 9 /0 1 0 7 /0 9 /0 1 0 8 /0 9 /0 1 0 9 /0 9 /0 1 1 0 /0 9 /0 1 1 1 /0 9 /0 1 1 2 /0 9 /0 1 1 3 /0 9 /0 1 1 4 /0 9 /0 1 1 5 /0 9 /0 1 1 6 /0 9 /0 1 1 7 /0 9 /0 1 1 8 /0 9 /0 1 1 9 /0 9 /0 1 2 0 /0 9 /0 1 2 1 /0 9 /0 1 2 2 /0 9 /0 1 2 3 /0 9 /0 1 2 4 /0 9 /0 1 2 5 /0 9 /0 1 2 6 /0 9 /0 1 2 7 /0 9 /0 1 2 8 /0 9 /0 1 2 9 /0 9 /0 1 3 0 /0 9 /0 1 A O T ( 5 1 0 /5 0 0 n m ) Lanai, alt. 20 m, 20.7ºN, 156.9W
Coconut Island, alt. 0 m, 21.4ºN, 157.8ºW Mauna Loa, alt. 3397 m, 19.5ºN, 155.6ºW
Midway Island, alt. 0 m, 28.2ºN, 177.4ºW
September 2001 D a y 1 D a y 1 0 D a y 2 0 D a y 3 0
Fig. 7. Daily averaged AOT (λ=500 nm) obtained at several AERONET ground-based remote
ACPD
6, 11621–11651, 2006Estimating a relationship between AOT and wind speed
P. Glantz et al. Title Page Abstract Introduction Conclusions References Tables Figures ◭ ◮ ◭ ◮ Back Close
Full Screen / Esc
Printer-friendly Version Interactive Discussion EGU 0 0,05 0,1 0,15 0,2 September 2001 D a y 3 0 D a y 2 0 D a y 1 0 D a y 1 41 39 21 22 52 12 13 17 25 34 42 27 23 20 22 42 29 31 1 18 2 15 12 27 12 42 5 1 29 A O T ( 5 1 0 /5 0 0 n m ) Lanai, alt. 20 m, 20.7ºN, 156.9ºW Coconut Island, alt. 0 m, 21.4ºN, 157.8ºW
This study, area around Lanai This study, area around Coconut
Island
Fig. 8. SeaWiFS satellite retrieved aerosol optical thickness (λ=510 nm) compared with AOT λ=500 nm) obtained at AERONET ground-based remote sensing stations located on Hawaii for
September 2001. The numbers above and below the symbols correspond to differences in % between satellite and AERONET retrieved AOT for Lanai and Coconut Island, respectively.
ACPD
6, 11621–11651, 2006Estimating a relationship between AOT and wind speed
P. Glantz et al. Title Page Abstract Introduction Conclusions References Tables Figures ◭ ◮ ◭ ◮ Back Close
Full Screen / Esc
Printer-friendly Version Interactive Discussion EGU Wind speed Primary marine aerosol production Water vapor emissions Boundary layer
flux and depth
Breaking Waves Entrainment from Free troposphere Ambient aerosol Mie scattering AOT CCN activation Cloud albedo Heat and momentum flux Non water gas emissions Relative humidty Condensable vapors Preexisting aerosol Dry deposition (gravitation)
Fig. 9. Schematic overview of processes involved in the climate forcing by primary marine aerosol particles. Boxes with full line borders are steps studied in the present work, and boxes with dashed borders are outside the scope of the current study, but have connections that feed back to the main path that goes from wind speed to AOT.