HAL Id: hal-00301955
https://hal.archives-ouvertes.fr/hal-00301955
Submitted on 24 Nov 2005HAL is a multi-disciplinary open access
archive for the deposit and dissemination of sci-entific research documents, whether they are pub-lished or not. The documents may come from teaching and research institutions in France or abroad, or from public or private research centers.
L’archive ouverte pluridisciplinaire HAL, est destinée au dépôt et à la diffusion de documents scientifiques de niveau recherche, publiés ou non, émanant des établissements d’enseignement et de recherche français ou étrangers, des laboratoires publics ou privés.
The North Atlantic Marine Boundary Layer Experiment
(NAMBLEX). Overview of the campaign held at Mace
Head, Ireland, in summer 2002
D. E. Heard, K. A. Read, J. Methven, S. Al-Haider, W. J. Bloss, G. P.
Johnson, M. J. Pilling, P. W. Seakins, S. C. Smith, R. Sommariva, et al.
To cite this version:
D. E. Heard, K. A. Read, J. Methven, S. Al-Haider, W. J. Bloss, et al.. The North Atlantic Marine Boundary Layer Experiment (NAMBLEX). Overview of the campaign held at Mace Head, Ireland, in summer 2002. Atmospheric Chemistry and Physics Discussions, European Geosciences Union, 2005, 5 (6), pp.12177-12254. �hal-00301955�
ACPD
5, 12177–12254, 2005 Overview of NAMBLEX D. E. Heard et al. Title Page Abstract Introduction Conclusions References Tables Figures J I J I Back Close Full Screen / EscPrint Version Interactive Discussion
EGU Atmos. Chem. Phys. Discuss., 5, 12177–12254, 2005
www.atmos-chem-phys.org/acpd/5/12177/ SRef-ID: 1680-7375/acpd/2005-5-12177 European Geosciences Union
Atmospheric Chemistry and Physics Discussions
The North Atlantic Marine Boundary Layer
Experiment (NAMBLEX). Overview of the
campaign held at Mace Head, Ireland, in
summer 2002
D. E. Heard1, K. A. Read1, J. Methven2, S. Al-Haider1, W. J. Bloss1,
G. P. Johnson1, M. J. Pilling1, P. W. Seakins1, S. C. Smith1, R. Sommariva1,*, J. C. Stanton1, T. J. Still1, B. Brooks3, G. De Leeuw13, A. V. Jackson3,
J. B. McQuaid3, R. Morgan3, M. H. Smith3, L. J. Carpenter4, N. Carslaw4,
J. Hamilton4, J. R Hopkins4, J. D. Lee4, A. C. Lewis4, R. M. Purvis14, D. J. Wevill4, N. Brough5, T. Green5, G. Mills5, S. A. Penkett5, J. M. C. Plane5, A. Saiz-Lopez5, D. Worton5, P. S. Monks6, Z. Fleming6,**, A. R. Rickard6,1, M. Alfarra7, J. D. Allan7, K. Bower7, H. Coe7, M. Cubison7, M. Flynn7, G. McFiggans7, M. Gallagher7, E. G. Norton7, C. D. O’Dowd12, J. Shillito7, D. Topping7, G. Vaughan7,
P. Williams7, M. Bitter8, S. M. Ball8, R. L. Jones8, I. M. Povey8, S. O’Doherty9, P. G. Simmonds9, A. Allen10, R. P. Kinnersley10, D. C. S. Beddows10,
M. Dall’Osto10, R. M. Harrison10, R. J. Donovan11, M. R. Heal11, S. G. Jennings12, C. Noone12, and G. Spain12
1
School of Chemistry, University of Leeds, Leeds, LS2 9JT, UK
ACPD
5, 12177–12254, 2005 Overview of NAMBLEX D. E. Heard et al. Title Page Abstract Introduction Conclusions References Tables Figures J I J I Back Close Full Screen / EscPrint Version Interactive Discussion
EGU
2
Department of Meteorology, University of Reading, Whiteknights, P.O. Box 217, Reading, Berkshire, RG6 6AH, UK
3
School of Earth and Environment, University of Leeds, Leeds, LS2 9JT, UK
4
Department of Chemistry, University of York, Heslington, York, YO10 5DD, UK
5
School of Environmental Sciences, University of East Anglia, Norwich, Norfolk, NR4 7TJ, UK
6
Department of Chemistry, University of Leicester, Leicester, LE1 7RH, UK
7
School of Earth, Atmospheric and Environmental Sciences (SEAES), University of Manch-ester, ManchManch-ester, M60 1QD, UK
8
University Chemical Laboratory, Cambridge University, Cambridge, UK
9
School of Chemistry, University of Bristol, Cantock’s Close, Bristol BS8 1TH, UK
10
School of Geography, Earth and Environmental Sciences, University of Birmingham, Depart-ment of Physics, Birmingham, B15 2TT, UK
11
School of Chemistry, University of Edinburgh, West Mains Rd, Edinburgh EH9 3JJ, UK
12
National University of Ireland, Galway, University Road, Galway, Ireland
13
TNO, P.O. Box 96864, 2509 JG, The Hague, The Netherlands
14
Facility for Airborne Atmospheric Measurement (FAAM), Cranfield University, Cranfield, MK43 0AL, UK
*now at: Aeronomy Laboratory, National Oceanic and Atmospheric Administration, Boulder, CO, USA
**now at: Department of Environmental Science and Technology, Imperial College of Science, Technology and Medicine, Prince Consort Road, South Kensington, London, SW7 2AZ, UK Received: 16 August 2005 – Accepted: 12 September 2005 – Published: 24 November 2005 Correspondence to: D. E. Heard (d.e.heard@leeds.ac.uk)
ACPD
5, 12177–12254, 2005 Overview of NAMBLEX D. E. Heard et al. Title Page Abstract Introduction Conclusions References Tables Figures J I J I Back Close Full Screen / EscPrint Version Interactive Discussion
EGU
Abstract
The North Atlantic Marine Boundary Layer Experiment (NAMBLEX), involving over 50 scientists from 12 institutions, took place at Mace Head, Ireland (53.32◦N, 9.90◦W), between 23 July and 4 September 2002. A wide range of state-of-the-art instrumenta-tion enabled detailed measurements of the boundary layer structure and atmospheric
5
composition in the gas and aerosol phase to be made, providing one of the most comprehensive in situ studies of the marine boundary layer to date. This overview paper describes the aims of the NAMBLEX project in the context of previous field cam-paigns in the Marine Boundary Layer (MBL), the overall layout of the site, a summary of the instrumentation deployed, the temporal coverage of the measurement data, and
10
the numerical models used to interpret the field data. Measurements of some trace species were made for the first time during the campaign, which was characterised by predominantly clean air of marine origin, but more polluted air with higher levels of NOx originating from continental regions was also experienced. This paper provides a summary of the meteorological measurements and Planetary Boundary Layer (PBL)
15
structure measurements, presents time series of some of the longer-lived trace species (O3, CO, H2, DMS, CH4, NMHC, NOx, NOy, PAN) and summarises measurements of other species that are described in more detail in other papers within this special issue, namely oxygenated VOCs, HCHO, peroxides, organo-halogenated species, a range of shorter lived halogen species (I2, OIO, IO, BrO), NO3radicals, photolysis frequencies,
20
the free radicals OH, HO2 and (HO2+ΣRO2), as well as a summary of the aerosol measurements. NAMBLEX was supported by measurements made in the vicinity of Mace Head using the NERC Dornier-228 aircraft. Using ECMWF wind-fields, calcula-tions were made of the air-mass trajectories arriving at Mace Head during NAMBLEX, and were analysed together with both meteorological and trace-gas measurements. In
25
this paper a chemical climatology is presented to interpret the distribution of air-mass origins and emission sources, and to provide a convenient framework of air-mass clas-sification that is used by other papers in this issue for the interpretation of observed
ACPD
5, 12177–12254, 2005 Overview of NAMBLEX D. E. Heard et al. Title Page Abstract Introduction Conclusions References Tables Figures J I J I Back Close Full Screen / EscPrint Version Interactive Discussion
EGU variability in levels of trace gases and aerosols.
1. Introduction and background to NAMBLEX
The hydroxyl radical (OH), formed from the photolysis of ozone at wavelengths be-low 340 nm in the presence of water vapour, initiates the oxidation of almost all trace gases released into the marine boundary layer. Peroxy radicals (RO2) produced by
5
this oxidation chemistry are responsible for ozone production or ozone destruction, de-pending upon the level of nitrogen oxides co-present. The oxidizing capacity of the troposphere is a combination of the above processes and others involving halogen and nitrate radicals. NOx(NO+NO2) plays a crucial role in the free-radical oxidation chem-istry associated with OH and HO2radicals, halogen radical species (e.g. IO, BrO) and
10
NO3. NOx is emitted directly into the atmosphere from various sources, both natural and anthropogenic, and is also formed in the atmosphere from the decomposition of other oxidised nitrogen compounds such as peroxy acetyl nitrate (PAN) and other or-ganic nitrates. The source of NOxin the remote MBL is uncertain, one possibility being long-range transport of pollution, emissions from shipping, emissions from the ocean,
15
or injection from the free troposphere either directly or in the form of reservoir com-pounds, many of which are associated with pollution. Increasing evidence suggests that the oxidizing capacity has been perturbed in recent years due to anthropogenic activity through emission of methane, carbon monoxide, non-methane hydrocarbons (NMHCs) and NOx. These perturbations may be causing changes in the natural
atmo-20
spheric composition, for instance increasing tropospheric concentrations of the green-house gas ozone, which has important implications for climate and human health. Any change in the oxidizing capacity of the atmosphere has many consequences for the long-term stability of the Earth’s climate.
The MBL has been the venue for a large number of field campaigns, largely as it
25
represents a location where pristinely clean air can be sampled that has had little or no perturbation due to anthropogenic activity, and the chemistry of the “natural”
atmo-ACPD
5, 12177–12254, 2005 Overview of NAMBLEX D. E. Heard et al. Title Page Abstract Introduction Conclusions References Tables Figures J I J I Back Close Full Screen / EscPrint Version Interactive Discussion
EGU sphere can be interrogated. A summary of some of these campaigns can be found
in Brasseur et al. (1999, 2002), Heard and Pilling (2003), and Holton et al. (2003). In addition Heard and Pilling (2003) provide a detailed list of a sub-set of field campaigns in the MBL that have included OH and HO2 measurements, together of course with a wide range of supporting measurements. The majority of observations have been
5
made using ground-based instrumentation located at coastal sites, but measurements using instrumented ships or aircraft flying in the MBL above the open ocean in remote areas provide in situ measurements of atmospheric composition over a wider region. Recently, instruments on satellites combined with new retrieval methods have enabled the composition of the global troposphere to be determined from space for a limited
10
number of species, for example for CO, O3, NO2, HCHO, SO2, BrO, CH4 and some aerosol parameters, albeit averages over large footprints rather than point measure-ments.
Networks of instrumented ground-based sites in the remote MBL have been es-tablished by the World Meteorological Organisation Global Atmospheric Watch
pro-15
gramme, the NOAA Climate Monitoring and Diagnostics Laboratory, and the At-mospheric Lifetime Experiment/Advanced Global AtAt-mospheric Gases Experiment (ALE/AGAGE). These surface measurements have revealed distinctive seasonal and latitudinal patterns, as well as long-term trends, for several species, for example, CO, CO2, CH4, N2O, O3, hydrocarbons, halogenated VOCs, aerosols and radiation. The
20
AGAGE monitoring sites are Mace Head (Ireland, 53◦N, 10◦W), Cape Grim (Tasma-nia, 41◦S, 145◦E), Trinidad Head (California, 41◦N, 124◦W), Ragged Point (Barbados, 13◦N, 59◦W) and Cape Matatula (American Samoa, 14◦S, 171◦W). These sites of-fer the best opportunity to sample air which is free from anthropogenic emissions, and in addition to the long-term monitoring programmes, short intensive field
cam-25
paigns have been hosted by these sites using significant additional instrumentation to measure a large number of trace gas, aerosols and radiative parameters, to enable a detailed investigation of the underlying chemistry. Examples include the Southern Ocean Atmospheric Photochemistry Experiments (SOAPEX) at Cape Grim (Monks et
ACPD
5, 12177–12254, 2005 Overview of NAMBLEX D. E. Heard et al. Title Page Abstract Introduction Conclusions References Tables Figures J I J I Back Close Full Screen / EscPrint Version Interactive Discussion
EGU al., 1998; Sommariva et al., 2004), the Eastern Atlantic Summer/Spring Experiments
(EASE)(Carslaw et al., 2002, 1999a) and the New Particle Formation and Fate in the Coastal Environment (PARFORCE) campaign (O’Dowd et al., 2002b, 2004) at Mace Head. However, even at remote sites, the background chemistry is perturbed, with cal-culated air mass back trajectories showing encounters with sources of anthropogenic
5
emission several days prior to arrival. During long-range transport to the site oxida-tion of primary emissions into a variety of secondary species, for example, oxygenated VOCs, O3and aerosols, can significantly modify the chemistry of shorter-lived species, for example, the hydroxyl radical, at the measurement site. One also has to be careful of local anthropogenic emissions, that may become problematic under certain
meteoro-10
logical conditions. Hence intensive field campaigns are usually of 1–2 months duration in the hope that for some of the time, at least, local sources do not influence, and the trajectory of the sampled air is relatively free from anthropogenic input. During a pe-riod of 1–2 months, a range of air-masses is usually encountered, allowing the effect, for example, of changing NOx or hydrocarbons, and the underlying chemistry, to be
15
investigated (Carslaw et al., 2002).
The North Atlantic Marine Boundary Layer Experiment (NAMBLEX), funded by the UK Natural Environment Research Council, took place at Mace Head during the sum-mer of 2002, with the aim of studying the detailed chemistry of the MBL. This special issue of Atmospheric Chemistry and Physics contains a series of papers dedicated
20
to field measurements and model comparisons from NAMBLEX. The full list of pa-pers can be found in Appendix A of this paper. The campaign, which ran from 23 July until 4 September 2002, involved approximately 50 scientists from 13 institutions: The Universities of Leeds, York, East Anglia (UEA), Leicester, Aberystwyth, Manch-ester, Cambridge, Bristol, Birmingham, Edinburgh and Reading from the UK, and The
25
National University of Ireland (NUI), Galway and TNO Physics and Electronics, The Netherlands. The project is an extension of the UK consortium that had previously mounted field campaigns in the MBL during the Eastern Atlantic Summer Experiment 1996 (EASE96) (Allan et al., 1999; Carslaw et al., 2000, 1999b; Evans et al., 2000;
ACPD
5, 12177–12254, 2005 Overview of NAMBLEX D. E. Heard et al. Title Page Abstract Introduction Conclusions References Tables Figures J I J I Back Close Full Screen / EscPrint Version Interactive Discussion
EGU Grenfell et al., 1999; Lewis et al., 1999) the Eastern Atlantic Spring Experiment 1997
(EASE97) (Creasey et al., 2002; Salisbury et al., 2001, 2002; Savage et al., 2001; Monks et al, 2000; Rickard et al., 2002), and the Southern Ocean Atmospheric Pho-tochemistry Experiments (SOAPEX-1, 2) at Cape Grim, Tasmania (Carpenter et al., 1997; Creasey et al., 2003; Haggerstone et al., 2005; Lewis et al., 2001; Monks et
5
al., 1998, 1996; Sommariva et al., 2004). During these campaigns, measurements were made of the free radicals OH, HO2, RO2, NO3, IO and OIO over a wide range of NOx, together with continuous multi-species NMHC measurements at the ≥1 pptv level for alkanes, alkenes and aromatics, including diurnal profiles, and source identifi-cation. Short-lived reactive halogenated hydrocarbons were found to act as sources of
10
halogen radicals, and co-measurements of OH, DMS and a wide-range of aerosol pa-rameters were used to suggest a preliminary mechanism for the formation of ultrafine particles.
Although the previous campaigns were highly successful, they raised further ques-tions, including the factors responsible for determining the oxidizing capacity. For
ex-15
ample, discrepancies were observed between modelled and measured OH and HO2 concentrations, perhaps due to chemical links between the hydrogen (HOx/ROx) and halogen (XOx) families of radicals included in mechanisms used to model the chem-istry. The source of NOx, the role of night-time oxidants, the nature of aerosols and their role in mediating heterogeneous chemistry, the internal mixture of particles making up
20
the marine atmospheric aerosol and the processes which give rise to new particle cre-ation were also outstanding questions.
There were several objectives of the NAMBLEX campaign.
(1) To compare concentration measurements of a wide range of short-lived free-radicals (OH, HO2, RO2, NO3) with the calculations of a zero-dimensional model, that
25
used the detailed Master Chemical Mechanism (Jenkin et al., 2003), to test quanti-tatively the basic understanding of oxidation processes in clean and moderately pol-luted air in the MBL. The number of free-radical sources and sinks measured during NAMBLEX and used to constrain the model was considerably larger than for previous
ACPD
5, 12177–12254, 2005 Overview of NAMBLEX D. E. Heard et al. Title Page Abstract Introduction Conclusions References Tables Figures J I J I Back Close Full Screen / EscPrint Version Interactive Discussion
EGU campaigns at Mace Head. Examples of new measurements include oxygenated
hy-drocarbons beyond HCHO, which have a relatively long lifetime and can be transported to the site, and the measurement of a very wide range of photolysis frequencies, e.g. j-(HCHO), rather than just j-(O1D) and j-(NO2).
(2) To study extensively the chemistry of halogen species in the MBL, and the links
5
with HOx, through observation of reactive intermediates and their sources and sinks, and comparison with model calculations. This was facilitated by a number of new measurements, for example molecular iodine, I2, and BrO radicals, as well as IO, OIO, organic halogenated species, and halogens in the aerosol phase.
(3) To study the reactive nitrogen budget over the Atlantic Ocean, through highly
10
detailed measurements of NOx, NOy (NO, NO2, HNO3, NO3, alkyl nitrates, PAN all measured) and nitrate observed in the particulate phase as a function of aerosol diam-eter.
(4) To examine the origins and role of reactive hydrocarbons in the MBL. Distinct diurnal cycles had previously been observed at Mace Head for reactive hydrocarbons,
15
for example, isoprene and other alkenes.
(5) To investigate the size-distributed composition, internal mixing and hygroscopic-ity of aerosols and the processes involved in new particle creation and the production of sea spray aerosol. Atmospheric aerosols, through their radiative properties and ef-fect on cloud formation, play a key role in moderating the global warming expected to
20
result from increases in greenhouse gases, and hence a clear understanding of their formation, evolution and fate is essential. Composition measurements were made as a function of particle size in real time using two aerosol mass spectrometric meth-ods. These instruments made qualitative mass spectral analysis of individual particles and quantitative mass distributions of individual components within the ensemble
par-25
ticle population, at vastly greater time resolution than is possible with bulk sampling methods. Bursts of nanoparticles were observed during the EASE and PARFORCE campaigns (O’Dowd et al., 1999, 2002a), but the mechanism of production was still unclear, and additional measurements of halogen intermediates, e.g. OIO, a potential
ACPD
5, 12177–12254, 2005 Overview of NAMBLEX D. E. Heard et al. Title Page Abstract Introduction Conclusions References Tables Figures J I J I Back Close Full Screen / EscPrint Version Interactive Discussion
EGU nucleating species, and I2, were used in NAMBLEX to assemble a new model of
par-ticle production. Investigations on the primary production of sea spray aerosol were made using a flux package consisting of a sonic anemometer, condensation particle counter (CPC) and an optical particle counter with a heated inlet, following methods described in Nilsson et al., (2001) and De Leeuw et al., (2003).
5
The design of the 2002 NAMBLEX campaign took into account lessons learned dur-ing the previous EASE 96 and 97 campaigns held at Mace Head. The instruments whose measurements were required to constrain the zero-dimensional model were co-located in five instrumented shipping containers, or permanent buildings, all at the shore site (see Sect. 2 below), so that differences in air mass composition between
10
different parts of the site were no longer a valid reason to explain poor agreement between measured and modelled free radicals. Other distinguishing features of NAM-BLEX compared with previous deployments were the close interaction between atmo-spheric physicists, who made highly detailed measurements of boundary layer struc-ture, and atmospheric chemists making composition measurements, and the sustained
15
exposure to westerly winds, ensuring that very clean air was sampled for the majority (80%) of the campaign. Several species were measured using more than one instru-ment, enabling intercomparisons to be performed.
The remainder of the overview paper is organised as follows. Section 2 contains a description of the site, a summary of the meteorological conditions encountered and
20
the boundary layer structure measurements, and contains a detailed listing of the in-strumentation and models used. Section 3 gives an overview of the data and shows time-series for measurements of the longer-lived species measured, for example O3, CO, H2, DMS, CH4, NMHC, NOx, NOy, PAN, which are not discussed in detail in other papers. A summary is also given of the measurement methods used for other species
25
whose measurements are covered in detail in other papers within this special issue, namely oxygenated VOCs, HCHO, peroxides, organo-halogenated species, a range of shorter lived halogen species (I2, OIO, IO, BrO), NO3radicals, photolysis frequencies, the free radicals OH, HO2 and (HO2+ΣRO2), as well as a summary of the aerosol
ACPD
5, 12177–12254, 2005 Overview of NAMBLEX D. E. Heard et al. Title Page Abstract Introduction Conclusions References Tables Figures J I J I Back Close Full Screen / EscPrint Version Interactive Discussion
EGU measurements and the supporting aircraft campaign. In Sect. 4 the meteorological
cli-matology is summarised, and in Sect. 5 a trajectory analysis of sampled air masses is presented. In Sect. 6 a chemical climatology is presented to rationalise the distribution of air mass origins and emission sources, and to provide a convenient framework of air mass classification that is used by other papers in this issue for the interpretation
5
of observed variability in levels of trace gases and aerosols. In Sect. 7 the conditions during NAMBLEX are compared with those encountered in other campaigns at Mace Head. This paper does not attempt to summarise the major scientific results from the campaign, rather these are discussed in a separate summary paper at the end of the special issue (Heard, 20051).
10
2. Site and meteorological description
Remotely situated on the Atlantic coast of Ireland (53.32◦N, 9.90◦W) about 90 km west of Galway (Fig. 1a), the Mace Head Atmospheric Research Station (referred to simply as Mace Head in this paper) is ideally positioned to receive air from a wide range of sources (Cape et al., 2000). The site is mainly characterised by conditions of
ex-15
ceptionally clean air which has source regions extending as far south as the Azores and as far north as Greenland. Contrastingly however, air originating in continental Europe and west/northwest America although more infrequent (Derwent et al., 1998), has allowed investigation into the long-range transport of anthropogenic precursors to pollutant species observed at the site and the subsequently enhanced ozone
lev-20
els (Methven et al., 2001; Simmonds et al., 1997). The prevailing wind direction is from 180◦–300◦ (52% of the time (Jennings et al., 2003)) during which the air has of-ten travelled over the Atlantic Ocean for the five days before its arrival at Mace Head and so can be considered representative of background conditions for the Northern
1
Heard, D. E.: A summary of the major results from the NAMBLEX campaign, Atmos. Chem. Phys. Discuss., to be submitted, 2005.
ACPD
5, 12177–12254, 2005 Overview of NAMBLEX D. E. Heard et al. Title Page Abstract Introduction Conclusions References Tables Figures J I J I Back Close Full Screen / EscPrint Version Interactive Discussion
EGU Hemisphere. The climate is mild and moist (Relative Humidity on average 80–85%
and average summer temperature (June–September) of 15◦C), in line with its coastal position, with the months of October through to January suffering from the most rainfall. Mace Head is one of several stations which make up the Global Atmosphere Watch (GAW) program of the World Meteorological Organisation (http://www.wmo.ch/web/
5
arep/gaw/gawhome.html) and the AGAGE (Advanced Global Atmospheric Gases Ex-periment) program (http://agage.eas.gatech.edu/) (Derwent et al., 1994; Simmonds et al., 1997). Continuous measurements of trace gases such as CFCs, CCl4, CH4, N2O, CO, and O3 have been made since 1987 contributing to the European Tropospheric Ozone Research (TOR) network, in addition to a long-term flask sampling network
10
which has been established in collaboration with NOAA Climate Monitoring and Diag-nostics Laboratory (CMDL) specifically for the measurement of CO2and isotopes.
The shore site consists of two permanent instrumented buildings (A and B, panel b, Fig. 1, roofed structures in Fig. 2), two walk-up towers (23 m and 10 m) situated 100 m from the shoreline at high tide (10 m above sea level (a.s.l.)), and a third instrumented
15
building at the top site 300 m from the shoreline at high tide (25 m a.s.l.), from which the photograph in Fig. 2b was taken. In contrast to the EASE96 and 97 campaigns, where instruments were split between the shore and top site (separated by 200 m), (Carslaw et al., 2000, 2002) during NAMBLEX the majority of instruments were positioned within a radius of 10–20 m of the common tower sampling points, either inside the shore
20
buildings or within a variety of newly commissioned containers (panel b, Fig. 1, and Fig. 2b). The surrounding area consists of moorland with areas of exposed granite rock and little vegetation except for grasses, heather, ferns, rushes and gorse (as shown in Fig. 2a). The ground is generally wet and boggy (annual rainfall 1200 mm) and mainly made up of shallow peaty soils. At low tides there are exposed seaweed beds
25
which act as a significant source of halogenated species (Carpenter et al., 2003, 1999; McFiggans et al., 2004).
ACPD
5, 12177–12254, 2005 Overview of NAMBLEX D. E. Heard et al. Title Page Abstract Introduction Conclusions References Tables Figures J I J I Back Close Full Screen / EscPrint Version Interactive Discussion
EGU 2.1. Wind speed and direction
Local wind direction and wind speed measurements were made at Mace Head by the National University of Ireland (NUI), Galway, the University of Leeds and the Uni-versity of Leicester using standard meteorological stations (including wind vanes and anemometers). The first of these took measurements from the top of the 10 m tower
5
whilst the latter two were positioned on the top of their respective containers (5 m height) (Figs. 1, 2) and so suffered some minor interference from the permanent build-ings. Time-series of wind speed and wind direction data from the first of these mea-surements are presented in Fig. 3. For the most part the local wind direction was between 180◦and 300◦except for a north easterly period from 31 July to 5 August, and
10
a north westerly period between the 24 to 26 August. These periods are addressed in more detail in the discussion of trajectories in Sect. 6. The wind speed during the campaign varied from 0.5 to 15 ms−1, with the highest wind speeds observed on the 11 August during a period of north westerly conditions.
2.2. Relative humidity and temperature
15
Both relative humidity and air temperature measurements were made by NUI, Galway from the 10 m tower (panel b, Fig. 1) using a Vaisala HMD-30YB humidity sensor. Figure 4 shows time-series of temperature and relative humidity during NAMBLEX for which the campaign averages ±1σ were 15.2±1.3◦C and 85.7±8.7%, respectively. These are consistent with the average measurements for relative humidity of between
20
80–85% and summer temperature of 15◦C for Mace Head (http://macehead.physics. nuigalway.ie/).
2.3. Planetary boundary layer (PBL) structure
The height of the PBL over land displays a diurnal cycle due to changes in surface heating by the sun, and typically is characterised by a maximum during the day and a
ACPD
5, 12177–12254, 2005 Overview of NAMBLEX D. E. Heard et al. Title Page Abstract Introduction Conclusions References Tables Figures J I J I Back Close Full Screen / EscPrint Version Interactive Discussion
EGU minimum, stable value at night. An Ultra High Frequency (UHF) wind profiler, four
3-axis sonic anemometers and a Doppler Sodar (Sonic Detection and Ranging) provided vertically resolved measurements of wind direction and wind speed from the surface to 3 km, which were used to derive a number of parameters, for example the degree of turbulence and the diurnal variation of the boundary layer height. Although
teth-5
ered balloons and radiosondes have previously been used at Mace Head to determine boundary layer height (Carslaw et al., 2002), this was the first time a wind profiler had been deployed at Mace Head to make continuous measurements. During NAMBLEX the PBL structure at Mace Head was “typical” only on a few select days, with evidence of coastal features, for example sea-breezes and the formation of an internal boundary
10
layer, which could impact on the interpretation of the chemical measurements. These measurements are presented in detail in the next paper (Norton et al., 2005, this issue), which highlights any differences in the local wind direction and that of the synoptic flow and trajectories calculated using ECMWF analyses, which must be considered care-fully when interpreting the observed concentrations of trace species.
15
2.4. Species measured during NAMBLEX and data coverage
Trace gas measurements included OH, and HO2, and total peroxy (hydro and organic) radicals HO2+ΣRO2, NO3, IO, OIO, BrO, I2, O3, NO, NO2, ΣNOy (NO+NO2+NO3, HONO+HNO3+HO2NO2+N2O5+PAN+organic nitrates), alkyl nitrates, PAN, speciated peroxides, HCHO, CO, CH4, H2O, NMHC, and some selected o-VOCs. Measurements
20
of spectrally-resolved actinic flux using a spectral-radiometer were used to calculate photolysis frequencies. In addition, several of these species (O3, HCHO, NMHC, halocarbons, and peroxides) were measured by more than one technique/group al-lowing intercomparisons to be made. Prior to this study little was known of the role of aerosols in modifying the oxidative capacity through heterogeneous uptake of free
25
radicals, and detailed measurements were made of aerosol size distribution, chemical composition and condensation nuclei (CN) using state-of-the-art techniques. Table 1 lists all the species measured during NAMBLEX, including radiation and boundary
ACPD
5, 12177–12254, 2005 Overview of NAMBLEX D. E. Heard et al. Title Page Abstract Introduction Conclusions References Tables Figures J I J I Back Close Full Screen / EscPrint Version Interactive Discussion
EGU layer structure, and the corresponding technique(s) used, with detection limits and
integration periods. Figure 5 summarises the temporal coverage of the measure-ments for each individual species throughout the campaign. Full data is available from http://badc.nerc.ac.uk/data/namblex/.
2.5. Modelling activities
5
A key NAMBLEX objective was to compare measured concentrations of the short-lived free radicals, for example OH, HO2, HO2+ΣRO2, NO3, IO and BrO, as well as longer-lived but photochemically generated species, for example HCHO, with the predictions of zero-dimensional models that considered only in situ chemistry and no transport processes. The model was constrained with a large number of trace species and
ra-10
diative parameters, co-measured during NAMBLEX, which are either sources or sinks for these species, and therefore define their budget. In this manner the accuracy of any chemical mechanisms could be tested. For the calculation of HOx, ROx and NO3, a number of “campaign tailored” mechanisms of varying chemical complexity, were de-rived from the Master Chemical Mechanism (MCM) (Jenkin et al., 1997), which in its
15
full form consists of ∼13 500 reactions and ∼5600 species and describes the oxidation of 135 VOCs by OH, NO3 and O3 all the way through to CO2 and H2O vapour. The mechanism is explicit and does not lump species together, using structural activity re-lationships where kinetic data are not available. The MCM has been used previously for field campaigns in the MBL (Carslaw et al., 2002, 1999b; Sommariva et al., 2004).
20
The mechanisms used vary from a simple mechanism considering only CO and CH4 oxidation, all the way through to the oxidation of all measured hydrocarbons and o-VOCs, including the chemistry of halogen monoxides (IO and BrO). (Sommariva et al., 2005a and 2005b2, this issue; Fleming et al., 2005, this issue). A detailed and rigorous methodology was developed to calculate the heterogeneous loss rates, which made
25 2
Sommariva, R., Ball, S. M., Bitter, M., Bloss, W. J., Fleming, Z. L., Heard, D. E., Jones, R. L., Lee, J. D., Monks, P. S., Pilling, M. J., Plane, J. M. C., and Saiz Lopez, A.: Night-time radical chemistry during the NAMBLEX campaign, Atmos. Chem. Phys. Discuss., to be submitted,
ACPD
5, 12177–12254, 2005 Overview of NAMBLEX D. E. Heard et al. Title Page Abstract Introduction Conclusions References Tables Figures J I J I Back Close Full Screen / EscPrint Version Interactive Discussion
EGU full use of the aerosol size-distribution and composition measurements (Sommariva et
al., 2005a). The free radical chemistry during both the night and daytime is discussed. The MCM was embedded into a trajectory model and used to investigate the con-tribution of secondary production of o-VOCs to the concentrations observed at Mace Head during NAMBLEX. The precursor NMHCs were initialised with anthropogenic
5
emissions representative of a continental landmass and allowed to chemically evolve over a period of 10 days simulating the transport across the Atlantic (Lewis et al., 2005, this issue). In this manner the fraction of the observed o-VOCs from in situ oxidation at Mace Head compared with long-lived transport could be investigated, although no efforts were made to reproduce actual concentrations.
10
Through the use of the gas-phase measurements of DMS and methanol, in conjunc-tion with their respective wind-induced turbulent gas transfer velocities calculated from a resistance model within a photochemical box model, an estimation for the uptake of methanol to the ocean was also established (Carpenter et al., 2004).
A much simpler approach was used by Smith et al. (2005, this issue) to rationalise
15
the observed concentrations of OH and HO2radicals. A number of analytically explicit steady state expressions were constrained by co-measured sources and sinks and used to calculate OH and HO2concentrations. This meant that the effect of individual species, for example reactions of halogen oxides with HO2 or heterogeneous uptake of HO2onto aerosols could be investigated.
20
A gas and aerosol phase model of halogen chemistry is described in Saiz-Lopez et al. (2005a and b, this issue), and used to calculate the gas phase concentration of a number of halogen intermediates for comparison with field measurements. The model considers the impact of coastal emissions of molecular iodine on O3 concentrations, and calculates the rate of nucleation of iodine oxide nanoparticles and their subsequent
25
growth by condensation and coagulation.
ACPD
5, 12177–12254, 2005 Overview of NAMBLEX D. E. Heard et al. Title Page Abstract Introduction Conclusions References Tables Figures J I J I Back Close Full Screen / EscPrint Version Interactive Discussion
EGU
3. Measurements of atmospheric composition
Figure 1 (panel b) shows the sampling positions of the measured species. The sam-pling inlet for the measurement of VOCs, aerosol, and reactive halocarbons was at the top of the 23 m tower (panel b, Fig. 1). The Department of the Environment, Food and Rural Affairs (DEFRA) measurements of O3, and AGAGE measurements of CO, CH4
5
and H2, were collected from the top of the 10 m tower along with the CN and meteoro-logical data. Both towers were within 100 m of the ocean at high tide (Fig. 1). Measure-ments of short-lived free radicals were all made at the shoreline site via, custom-made inlets localised at respective containers (see Fig. 1). The inlet for the Leeds perox-ide instrument was also at the top of the 10 m tower. Some measurements, HCHO
10
(Leeds), alkyl nitrates (UEA) and large-chain (>C7) VOCs (York), were made in a third laboratory (Building C) situated 200 m east of the other measurements.
The Differential Optical Absorption Spectrometer (DOAS) instrument was housed in Building A and an 8.4 km path length was achieved by positioning a retro-reflector on Croaghnakeela Island, 4.2 km west of the site (panel a, Fig. 1). The light path ran
15
mostly over the ocean, at a height of between 4 and 10 m (Saiz-Lopez et al., 2005a and b, this issue). The Broad Band Cavity Ringdown Spectrometer (BBCRDS) sampled via a similar (10 km) effective absorption path length, but was achieved with a spatial reso-lution of 2 m via an open-path ringdown cavity positioned 90 cm above the Cambridge container (Bitter et al., 2005a and b3, this issue).
20
3.1. O3
As O3 is such a central tropospheric species, three independent measurements were made during NAMBLEX and these are shown in Fig. 6. (1) DEFRA used a Monitor Labs
3
Bitter, M., Ball, S. M., Povey, I. M., Jones, R. L., Saiz-Lopez, A., and Plane, J. M. C.: Measurements of NO3, N2O5, OIO, I2, water vapour and aerosol optical depth by broadband
cavity ring down spectroscopy during the NAMBLEX campaign, Atmos. Chem. Phys. Discuss., to be submitted, 2005b.
ACPD
5, 12177–12254, 2005 Overview of NAMBLEX D. E. Heard et al. Title Page Abstract Introduction Conclusions References Tables Figures J I J I Back Close Full Screen / EscPrint Version Interactive Discussion
EGU UV spectrometer absorbing at 254 nm to make measurements from 3 m up the 23 m
tower every 10 s, reporting them as 1 min averages for the entire campaign, (2) The University of Leeds used a 254 nm UV photometric O3 analyser (Model 49C, Thermo Environmental Instruments Inc. (TEI), USA) sampling above Container 1 at a height of ∼5 m (Fig. 1) and reported 1 min averages for the entire campaign, (3) The
Univer-5
sity of Leicester also used a 254 nm UV photometric O3 analyser (Model TEI 49C), which was primarily deployed on the NERC Dornier 228-101 research aircraft (Purvis et al., 2005, this issue), with measurements only made at the Mace Head site at the end of the campaign (17–20 August, 26 August–4 September) from Building B (at a height of ∼4 m). The maximum and minimum 1-min averaged O3mixing ratio (DEFRA)
10
was 53.4 ppbv and 6.3 ppbv respectively, with a campaign average of 29.0±6.5 ppbv, consistent with average summer concentrations (30.3 ppbv in August 1990–1992) (Der-went et al., 1994; Monks, 2005; Simmonds et al., 1997). The agreement between the instruments is good.
Figure 7 shows correlation plots with respect to the DEFRA measured O3 for 17–
15
20 August and 26 August–4 September when all three instruments were measuring simultaneously, from which the following best-fit linear regressions were found:
Leic(O3)=[0.906 × DEFRA(O3)]+ 3.4 ppbv (1)
Leeds(O3)=[0.791 × DEFRA(O3)]+ 2.5 ppbv (2)
Differences in calibration can be ruled out because during NAMBLEX all three
instru-20
ments were independently calibrated on site by the National Physics Laboratory (NPL) using a certified standard and all three instruments were very close to this calibration standard. In addition a GAW O3audit was carried out by EMPA Swiss Federal Labora-tories for Materials Testing and Research during the campaign (21–26 August) and all three instruments were checked against a TEI-49C PS (primary standard). While both
25
Leicester and Leeds instruments were within GAW specifications, they actually were not as well calibrated as they could have been – the factory settings for background
ACPD
5, 12177–12254, 2005 Overview of NAMBLEX D. E. Heard et al. Title Page Abstract Introduction Conclusions References Tables Figures J I J I Back Close Full Screen / EscPrint Version Interactive Discussion
EGU and slope were a little different. The Leicester instrument was calibrated and the
set-tings were adjusted to give more or less perfect agreement with the primary standard. Although the Leeds instrument was not adjusted, the calibration was applied to the final data.
PS= [DEFRA × 1.011] − 0.39 ppbv (3)
5
PS=[Leicester × 1.065]−0.93 ppbv (before calibration) (4)
PS=[Leicester × 0.999]−0.01 ppbv (after calibration) (5)
PS=[Leeds × 1.027] + 1.68 ppbv (6)
The observed differences between the instruments are most likely due to losses upon the surfaces of inlet tubing. As all instruments were within 20% of one another, these
10
effects were not investigated further. The Leeds measurements were used to constrain the models for the calculation of free-radical concentrations, whereas the DEFRA data series was used for the interpretation of sampled air masses and correlations with longer lived species.
3.2. CO and H2
15
CO and H2 were measured by AGAGE (http://agage.eas.gatech.edu/) using a RGA3 (Residual Gas analyzer) hot mercuric oxide reduction gas detector coupled with UV detection. Alternate calibration and ambient air measurements were recorded every 40 min during the campaign except for a period between the 1 and 2 August and be-tween the 17 and 21 August because of technical difficulties. For modelling purposes
20
missing CO data at these times were inferred from the correlation with acetylene (Smith et al, 2005, this issue):
ACPD
5, 12177–12254, 2005 Overview of NAMBLEX D. E. Heard et al. Title Page Abstract Introduction Conclusions References Tables Figures J I J I Back Close Full Screen / EscPrint Version Interactive Discussion
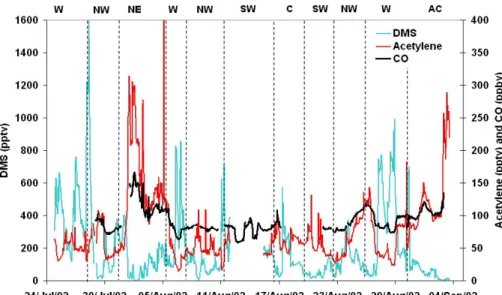
EGU An average of 91.3±18.9 ppbv was observed for CO through the campaign with a
min-imum of 58 ppbv and maxmin-imum of 197 ppbv. A time-series for CO is shown on Fig. 8 along with acetylene and DMS.
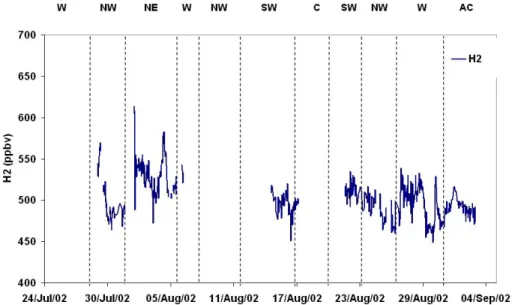
The time-series for H2, a relatively minor contributor to the reactive loss of OH (∼6%) is shown in Fig. 9. The campaign average of 503.4±24.9 ppbv is slightly lower than the
5
globally averaged value of 531 ppbv, but is consistent with the minimum at Mace Head occurring during August/September (Novelli et al., 1999). The concentration of H2 is lower in the northern hemisphere when compared to the southern hemisphere except at very high latitudes, because in addition to reaction with OH the other main sink for this species is uptake by soils which is larger in the northern hemisphere.
10
3.3. CH4
Atmospheric CH4 concentrations were determined by AGAGE every 40 min using a Gas Chromatograph-Flame Ionisation Detector (GC-FID) and are shown in Fig. 10, together with propane and CO. Although the lifetime for CH4 is long (∼9 years), cor-relations with NMHC for example propane, (C3H8), and also CO, are commonly seen
15
(Methven et al., 2001), and can be explained by changes in air mass origin, sources and photochemical history. For NAMBLEX, the following best-fit linear fits were ob-tained:
[CH4]=0.85[C3H8]+ 1754 Rwhole campaign2 =0.58 (8)
[CO]=0.33[CH4]−517.8 Rwhole campaign2 =0.61 (9)
20
CH4 is an important sink for OH, and when CH4 measurements were not available, concentrations were inferred from the correlation with propane (Smith et al., 2005, this issue).
ACPD
5, 12177–12254, 2005 Overview of NAMBLEX D. E. Heard et al. Title Page Abstract Introduction Conclusions References Tables Figures J I J I Back Close Full Screen / EscPrint Version Interactive Discussion
EGU 3.4. Non-methane hydrocarbons (NMHCs) and oxygenated volatile organic
com-pounds (o-VOCs)
A total of 23 C2-C7 NMHC (including dimethyl sulphide (DMS)) and three o-VOCs, (methanol, acetone and acetaldehyde), were measured simultaneously with 40 min resolution during the campaign using a newly developed automated dual channel
5
Perkin Elmer GC-FID coupled to a thermal desorption sampling system. More de-tails are given in Hopkins et al. (2002). Formaldehyde (HCHO) measurements are discussed in the next section. Figures 8, 10 and 11 show time-series for some NMHC species during NAMBLEX, with excellent data coverage except for 13–16 August (failed pump). The larger NMHC and >C3 oxygenates were also measured using an
Agi-10
lent 6890 GC with two independent columns connected via a valve modulator device (Hamilton and Lewis., 2003). The NMHC data were used in conjunction with observed CH4, CO, NOx, NOyand O3data to produce a chemical climatology, which is discussed in Sect. 6. Possible sources of NMHC include direct anthropogenic and biogenic emis-sion, whereas for the o-VOCs another source is oxidation of precursor NMHC along
15
the sampled trajectory. For o-VOCs, possible sinks include reaction with OH, deposi-tion to the ocean, and photolysis, and these points are discussed in Lewis et al. (2005, this issue). Methanol deposition to the ocean and DMS flux from the ocean during NAMBLEX have been discussed in detail in Carpenter et al. (2004).
3.5. Formaldehyde (HCHO)
20
HCHO was measured using two independent techniques during NAMBLEX and al-though the sampling position of the instruments were 200 m apart, the campaign of-fered an opportunity for intercomparison. The University of Leeds deployed a Gas Chromatograph with pulsed discharge Helium Ionisation Detection (GC-pd-HID), with selective cryogenic trapping, which was situated in the laboratory at the top site (300 m
25
from the ocean at high tide, 25 m a.s.l.), whilst UEA used the Hantzsch method, utilis-ing a glass coil scrubber with derivitisation of HCHO and UV fluorescence detection,
ACPD
5, 12177–12254, 2005 Overview of NAMBLEX D. E. Heard et al. Title Page Abstract Introduction Conclusions References Tables Figures J I J I Back Close Full Screen / EscPrint Version Interactive Discussion
EGU with the instrument deployed at the shoreline site in container 5 (panel b, Fig. 1). The
time-series for the two methods, together with a model comparison, are discussed in Still et al. (2005, this issue). The temporal variation of the two sets of measurements correlated closely, but an offset was observed between them.
3.6. Inorganic (H2O2) and organic (CH3OOH) peroxides
5
Speciated peroxide measurements were also measured by two instruments positioned in close proximity at the shoreline site (panel b, Fig. 1), enabling an intercomparison. UEA (Container 5) used scrubbing of peroxides into solution followed by the catalysed reduction of peroxides by para hydroxyl phenyl acetic acid (POPHA), followed by fluo-rescence detection of the products formed. Reaction with the enzyme catalase, which
10
selectively removes H2O2 prior to measurement, enables speciated measurements of total peroxide and H2O2. The University of Leeds (Building A) deployed an instrument which scrubbed peroxide into solution using a nebulisation reflux concentrator, followed by separation by High Performance Liquid Chromatography (HPLC) and postcolumn enzyme derivatisation with fluorescence detection (Morgan and Jackson, 2002). The
15
measurements from NAMBLEX are discussed in Jackson et al. (2005)4. 3.7. Reactive halogen species (RHS)
Reactive organo-halogens including CH3I (methyl iodide), C2H5I (ethyl io-dide), CH2IC2H5, (1-iodopropane) and CH3CHICH3 (2-iodopropane), CH2ICl (chloroiodomethane), CH2I2(diodomethane), CH2Br2(dibromomethane), CHBr2Cl
(di-20
bromochloromethane), CHBr3 (bromoform), and CHCl3 (chloroform) were measured by a GC-MS (Gas-Chromatography-Mass Spectrometry) system operated by the Uni-versity of York (Container 2) (Wevill and Carpenter, 2004). CHBr3measurements made by the University of York during NAMBLEX and during a 2.5 year period by a GC-MS
4
Jackson, A., Morgan, R. B., Mills, G., et al.: Gas phase hydroperoxide measurements at Mace Head, Ireland, during the NAMBLEX campaign, in preparation, 2005.
ACPD
5, 12177–12254, 2005 Overview of NAMBLEX D. E. Heard et al. Title Page Abstract Introduction Conclusions References Tables Figures J I J I Back Close Full Screen / EscPrint Version Interactive Discussion
EGU system operated by the University of Bristol (Building B) are discussed in Carpenter
et al. (2005, this issue), with evidence of a terrestrial source. The good agreement between CHCl3concentrations measured by the two systems is also discussed.
I2, OIO, IO, and BrO were detected using the UEA DOAS instrument from spectra in the regions 535–575 nm, 535–575 nm, 430–460 nm, and 345–359 nm, respectively,
5
with a time resolution of 30 min. These represent the first measurements of I2 in the atmosphere, a compound which itself may be the major source of atmospheric iodine in many coastal regions rich in macro-algae. First estimations of its contribution to the global iodine budget are considered in Saiz-Lopez and Plane (2004) who show that this species may well be a significant component. NAMBLEX was also the first time
10
BrO had been measured in mid-latitude regions. The presence of I2, IO and OIO in measurable concentrations during the night was of particular interest, as previously discussed for NAMBLEX in Saiz-Lopez and Plane (2004) and Saiz-Lopez et al. (2004). A mechanism for the gas and aerosol-phase chemistry of iodine, including the nucle-ation of particles, was developed and is discussed in Saiz-Lopez et al. (2005a, this
15
issue) and McFiggans et al. (2004).
The Broadband cavity ringdown spectrometer (BBCRDS), developed by Cambridge University (Container 6, Fig. 1b), was deployed for the first time during NAMBLEX, and is discussed in Bitter et al. (2005a, this issue). The technique uses a Nd:YAG pumped modeless dye laser with broad spectral output which enters a high-finesse cavity
con-20
taining highly reflecting mirrors. Measurements of OIO and I2 were performed with a spatial resolution of 2 m by recording wavelength resolved ringdown times around 570 nm using a clocked charge coupled device (CCD) camera. Exchanging the cavity mirrors and laser dye enabled measurements of the NO3radical and its reservoir com-pound N2O5to be performed around 660 nm. Aerosol optical depths and water vapour
25
concentrations were also measured in both wavelength regions (Bitter et al., 2005b, this issue)3.
ACPD
5, 12177–12254, 2005 Overview of NAMBLEX D. E. Heard et al. Title Page Abstract Introduction Conclusions References Tables Figures J I J I Back Close Full Screen / EscPrint Version Interactive Discussion
EGU 3.8. NO3
NO3 was measured during the campaign using both the DOAS technique (with the telescope and receiving optics situated in Building A (Fig. 1) and the long-path almost entirely over the ocean) and the in situ BBCRDS technique, situated in Container 6 (Fig. 1), sampling on land but close to the shore. The two time-series for NO3provided
5
a unique opportunity to examine horizontal gradients in the radical’s concentration in air advected across the land/ocean interface, as discussed in Bitter et al. (2005b, this issue)3. In addition a vertically-pointing Zenith sky spectrometer was deployed to mea-sure the slant column density (SCD) variation of NO3as a function of the solar zenith angle (SZA) during sunrise, from which vertically resolved NO3 concentrations in the
10
MBL and free troposphere were determined. The NO3time-series from the DOAS and Zenith sky spectrometers, and a discussion of night-time chemistry, are presented in Saiz-Lopez et al. (2005b, this issue).
3.9. NO, NO2, total NOy, PAN, alkyl nitrates, and HNO3
Measurements of nitric oxide (NO), nitrogen dioxide (NO2), total NOyand total NOy
mi-15
nus nitric acid (HNO3) were made by a 4-channel analyser which detected the chemilu-minescence produced upon reaction of NO with O3. NO2was first converted to NO by a photolysis converter before detection and the NOymeasurements were made with a gold converter which reduced all NOyspecies including PAN, NO2, HNO3, and organic nitrates to NO before detection. The converter was run at 300◦C in the presence of
20
carbon monoxide (CO). Nitric acid was determined by subtracting the signal from two identical NOyconverters, one of which had a length of nylon tube between the inlet and the converter to remove the HNO3before detection. Full details of the instrument with detection limits etc are quoted in Brough et al. (2003) and are reproduced in Table 1.
Peroxy acetyl nitrate (PAN) was measured by a standard GC-ECD (Gas
25
Chromatography-Electron Capture Detection) method. A 2 ml sample of air, dried with a NafionTM dryer, was injected onto a 10 m length and 0.53 mm diameter, MXT-200
ACPD
5, 12177–12254, 2005 Overview of NAMBLEX D. E. Heard et al. Title Page Abstract Introduction Conclusions References Tables Figures J I J I Back Close Full Screen / EscPrint Version Interactive Discussion
EGU column (Thames Restek Ltd) and separation was isothermal at 15◦C with nitrogen
as the carrier gas. Detection was by ECD and the duty cycle of the instrument was 10 min. Calibrations (using the acetone/air/NO photolysis method) were usually per-formed twice a day at single PAN concentrations and blanks were perper-formed every few days by inserting a length of stainless steel tube into the inlet line and heating to
5
120◦C. Full calibration curves were performed at the start and end of the campaign. A detection limit of 15 pptv (s/N=3) was achieved with an estimated total uncertainty (based on NO standard, NO conversion efficiency, gas flows and instrument precision) of ±16%.
The measurement of NOxand NOyspecies were unfortunately compromised by local
10
contamination problems. This gave rise to large excursions in the signals of NO, NO2 and NOy, possibly due to a shared inlet with the PERCA which uses NO to detect RO2 radicals. In spite of this the measurements can be used for many purposes, particularly after subtraction of the contaminant peaks. Figure 12 shows a plot of NO, NO2and NOy expressed as hourly averages without removal of contamination.
15
The nitric oxides NO and NO2(NOx) are converted into more highly oxidised forms in the atmosphere such as HNO3, PAN and organic nitrates. The total amount of oxidised nitrogen present is referred to as NOy and NOz (NOz=NOy-NOx). A good test of the performance of the NOyinstrumentation is to compare the measured NOy signal with the sum of NO, NO2, HNO3 and PAN, most of which are determined independently.
20
This is shown in Fig. 13 where the two quantities (NOymeasured and NOycalculated) are shown to coincide throughout the campaign.
The sum of HNO3and PAN also coincides with the NOzsignal calculated from NOy -NOx throughout much of the campaign (not shown) suggesting that the total organic nitrate signal (ΣRONO2) is small. Figure 14 shows a plot of NOy, HNO3 and PAN
25
for the NAMBLEX campaign. The sum of the two products of atmospheric oxidation (PAN+HNO3) is approximately 50% of the NOyon many occasions. In cleaner air how-ever the two products can dominate, as is shown towards the end of the campaign. The small amount of NOx present in clean air is very likely produced from decomposition
ACPD
5, 12177–12254, 2005 Overview of NAMBLEX D. E. Heard et al. Title Page Abstract Introduction Conclusions References Tables Figures J I J I Back Close Full Screen / EscPrint Version Interactive Discussion
EGU of the PAN, or possibly a minor contribution from local soil emission; the NOx will then
be quickly converted to HNO3 by reaction of NO2 with OH, and HNO3 will be rapidly removed by dry deposition to any surface including the sea. Investigations into this pro-cess are on-going, but the combination of these data with other Mace Head datasets for these species will allow the budget of reactive nitrogen in marine boundary air, over
5
the North Atlantic, to be assembled for all types of conditions experienced during this campaign.
3.10. Photolysis rates
Photolysis frequencies were measured using one j-(NO2) fixed-bandwidth radiometer (FR) (above Container 5, Fig. 1b), two j-(O1D) fixed-bandwidth filter radiometers (above
10
Containers 1 and 5, Fig. 1b), and a spectroradiometer (SR) (above Container 5, Fig. 1b) by the University of Leicester (Edwards and Monks, 2003) and the University of Leeds. All instruments used an upward pointing 2π sr (solar radiation) integrating spherical dome made of ground-quartz with an artificial horizon and all instruments had an inte-gration time of 1 min. The fixed-bandwidth radiometers measure solar radiation using
15
a PMT after transmission through optical filters that mimic the wavelength-dependent product of the absorption cross-section (σ) and photo-dissociation quantum yield (φ) of either O3or NO2. Thus, the output signal of the filter radiometer is proportional to the specific photolysis frequency and is calibrated by actinometry (see Monks et al., 2004). The spectroradiometer uses a single imaging spectrograph and a diode array detector
20
to spectrally resolve sunlight in the range 285–710 nm, and raw intensities are con-verted to actinic fluxes (F) using primary irradiance standards (NIST) (see Hofzuma-haus et al., 2004). Photolysis frequencies are then calculated using these fluxes and tabulated absorption cross-section and photo-dissociation quantum yield data, as de-scribed in Monks et al. (2004). Of particular interest during NAMBLEX are j-(O1D),
25
j-(NO2), j-(HCHO), j-(CH3CHO), j-(CH3COCH3), j-(HONO), j-(H2O2), j-(CH3CO2H),
j-(HOI) and j-(HOBr).
j-ACPD
5, 12177–12254, 2005 Overview of NAMBLEX D. E. Heard et al. Title Page Abstract Introduction Conclusions References Tables Figures J I J I Back Close Full Screen / EscPrint Version Interactive Discussion
EGU (NO2), respectively. For j-(O1D) the agreement is reasonable, with the observed scatter
attributable to inadequacies in both the j-(O1D) FR and SR measurements. The slight curvature at low elevation sun, high solar zenith angles (SZAs), corresponding to low values of j-(O1D) highlights the shortcomings of filter radiometers at high SZAs, where the path length through the atmosphere is longer, and as a consequence, shifts the
5
wavelength dependent spectral distribution of j-(O1D) (σO3(λ)×φO1D(λ)×F (λ), see for example Monks et al., 2004) to longer wavelengths (Bohn et al., 2004; Hofzumahaus et al., 2004). In addition, the single spectrograph spectroradiometer used here inherently suffers from stray light effects (see Edwards and Monks, 2003, for details), which can have a significant effect on the measured actinic flux at short wavelengths (towards
10
the 290 nm cut-off region) at all SZAs. A significant amount of scatter will be observed due to the modification of the spectral actinic flux by clouds not being factored into the filter radiometer calibration (Monks et al., 2004). For j-(NO2) there is excellent agreement between the SR and FR data. The slight curvature at high SZAs seen in Fig. 15a for j-(O1D) and the significant scatter at all SZAs are both absent, because
15
the action spectrum for j-(NO2), (σNO2(λ)×φO3P(λ)×F (λ)) occurs at longer wavelengths (290–420 nm) compared with that for j-O1D (280–320 nm), and so is much less affected by changes in absorption from variations in the overhead O3column, increased optical path-length at high SZAs or modifications by clouds.
Uninterrupted measurements over 39 days were recorded, however, some short
20
term gaps in the SR measurements occurred owing to instrumental problems. For the constrained box modelling studies, missing SR data were estimated using the FR measurements using the correlation method as described in Sommariva et al. (2005)2 (this issue). Figure 16a shows actinic flux, and Figs. 16b and c diurnal variations for
j-(O1D), j-(NO2), j-(HONO), j-(HCHO) (radical H+HCO and non-radical CO+H2
chan-25
nels), j-(CH3CHO) and j-(CH3COCH3), all calculated from the actinic flux, for 18 August 2002, which was typical of the clean conditions encountered.
The structure in the mornings is due to the presence of clouds which attenuate the radiation (Monks et al., 2004). j-(HCHO NR) (non-radical), and j-(HCHO R) (radical)
ACPD
5, 12177–12254, 2005 Overview of NAMBLEX D. E. Heard et al. Title Page Abstract Introduction Conclusions References Tables Figures J I J I Back Close Full Screen / EscPrint Version Interactive Discussion
EGU show wider profiles compared with j-(O1D) because absorption occurs at longer
wave-lengths. The measurement of a wider range of photolysis frequencies compared with previous campaigns at Mace Head has assisted enormously with the quantification of the budget for many species, especially free-radicals, and has enabled photolysis fre-quencies required by the model to be inputted directly, reducing model uncertainties.
5
Previously, j-values other than j-(O1D) and j-(NO2) had to be calculated from j-(O1D) and/or j-(NO2) whilst making assumptions about attenuation factors at different wave-lengths (Carslaw et al., 2002, 1999a).
3.11. OH, HO2and (HO2+ΣRO2) free-radicals
OH and HO2 measurements were made simultaneously with 30 s time-resolution
us-10
ing two independent fluorescence cells, and are discussed in Smith et al. (2005, this issue). The FAGE (Fluorescence Assay by Gas Expansion) technique uses laser-induced fluorescence spectroscopy at low-pressure and the instrument was located in Container 1 (Fig. 1, panel b), with considerably improved detection limits compared with previous deployments at Mace Head (Table 1). Measurements of the sum of HO2
15
and ΣRO2 (where R represents an organic group, for example CH3) were reported with 1 min time-resolution by a dual channel PERCA (PEroxy Radical Chemical Am-plifier). Full details of the PERCA instrument can be found in Fleming et al. (2005, this issue), with the major improvement from previous deployments being the addition of a second channel which enables a continuous measure of the background signal,
20
improving signal-to-noise ratios. Comparisons for OH, HO2and HO2+ΣRO2are made with the calculations of a detailed model based on the MCM in later papers of this issue (Sommariva et al., 2005a and b2, this issue; Fleming et al., 2005, this issue). Further discussion of the coupling observed between the HOx and XOx families can be found in Bloss et al. (2005).
ACPD
5, 12177–12254, 2005 Overview of NAMBLEX D. E. Heard et al. Title Page Abstract Introduction Conclusions References Tables Figures J I J I Back Close Full Screen / EscPrint Version Interactive Discussion
EGU 3.12. Measurements of aerosols
3.12.1. Aerosol size- and number-distributions and hygroscopic growth factors As can be seen in Table 1, a wide range of instrumentation was deployed during NAM-BLEX by NUI, Galway, TNO Holland and the Universities of Manchester, Birmingham, Edinburgh, and Leeds to measure a large number of aerosol parameters. Number
5
densities of aerosols as a function of their dry and wet diameters from 3 nm to 20 µm diameter were made at several heights using a scanning mobility particle sizer (SMPS), a Grimm optical particle counter (OPC), a differential mobility particle sizer (DMPS), a forward scattering spectrometer probe (FSSP) and other optical particle counters, and are discussed in full by Coe et al. (2005, this issue)5. Most measurements were made
10
at two heights (7 and 22 m) using a home-built sampling manifold attached to the 23 m tower (Fig. 1). Coe et al. (2005, this issue)5also investigate if the aerosol size distribu-tion is affected by local effects induced by changes in tide height. Aerosol optical depth was measured using BBCRDS by the University of Cambridge and reported within Bit-ter et al. (2005b, this issue)3. The sea spray source function, describing the amount
15
of sea spray aerosol produced at the sea surface as a function of environmental con-ditions, is highly uncertain. To better constrain these, a sea spray flux package was used. Vertical wind speed was measured with a sonic anemometer. Concentrations of particles larger than 10 nm were measured with a CPC. Size segregated measure-ments of sea spray aerosol were made with an optical particle counter with an inlet
20
heated to 600◦C which effectively removed all volatile aerosol components other than sea spray, as confirmed by inlet temperature scans up to 900◦C. Due to losses in the inlet system, only submicron particles were retained. Their concentrations were binned
5
Coe, H., Allan, J., Alfarra, M., Bower, K., Flynn, M., McFiggans, G., Topping, D., Williams, P., Dall’Osto, M., Beddows, D., and Harrison, R.: A physical and chemical characterisation of aerosol particles during the North Atlantic Boundary Layer Experiment, Atmos. Chem. Phys. Discuss., to be submitted, 2005.