HAL Id: hal-02919296
https://hal.archives-ouvertes.fr/hal-02919296
Submitted on 22 Aug 2020
HAL is a multi-disciplinary open access
archive for the deposit and dissemination of
sci-entific research documents, whether they are
pub-lished or not. The documents may come from
teaching and research institutions in France or
abroad, or from public or private research centers.
L’archive ouverte pluridisciplinaire HAL, est
destinée au dépôt et à la diffusion de documents
scientifiques de niveau recherche, publiés ou non,
émanant des établissements d’enseignement et de
recherche français ou étrangers, des laboratoires
publics ou privés.
Spectroscopic study of MATLAS-2019 with MUSE: An
ultra-diffuse galaxy with an excess of old globular
clusters
Oliver Müller, Francine R. Marleau, Pierre-Alain Duc, Rebecca Habas,
Jérémy Fensch, Eric Emsellem, Mélina Poulain, Sungsoon Lim, Adriano
Agnello, Patrick Durrell, et al.
To cite this version:
Oliver Müller, Francine R. Marleau, Pierre-Alain Duc, Rebecca Habas, Jérémy Fensch, et al..
Spec-troscopic study of MATLAS-2019 with MUSE: An ultra-diffuse galaxy with an excess of old globular
clusters. Astronomy and Astrophysics - A&A, EDP Sciences, 2020, 640, pp.A106.
�10.1051/0004-6361/202038351�. �hal-02919296�
A&A 640, A106 (2020) https://doi.org/10.1051/0004-6361/202038351 c O. Müller et al. 2020
Astronomy
&
Astrophysics
Spectroscopic study of MATLAS-2019 with MUSE: An ultra-diffuse
galaxy with an excess of old globular clusters
?
,
??
Oliver Müller
1, Francine R. Marleau
2, Pierre-Alain Duc
1, Rebecca Habas
1, Jérémy Fensch
3, Eric Emsellem
3,4,
Mélina Poulain
2, Sungsoon Lim
5, Adriano Agnello
6, Patrick Durrell
7, Sanjaya Paudel
8,
Rubén Sánchez-Janssen
9, and Remco F. J. van der Burg
41 Observatoire Astronomique de Strasbourg (ObAS), Universite de Strasbourg – CNRS, UMR 7550, Strasbourg, France
e-mail: [email protected]
2 Institut für Astro- und Teilchenphysik, Universität Innsbruck, Technikerstraße 25/8, Innsbruck 6020, Austria
3 Univ. Lyon, ENS de Lyon, Univ. Lyon 1, CNRS, Centre de Recherche Astrophysique de Lyon, UMR5574, 69007 Lyon, France 4 European Southern Observatory, Karl-Schwarzschild-Str. 2, 85748 Garching, Germany
5 University of Tampa, 401 West Kennedy Boulevard, Tampa, FL 33606, USA 6 DARK, Niels-Bohr Institute, Lyngbyvej 2, Copenhagen, Denmark
7 Department of Physics & Astronomy, Youngstown State University, Youngstown, OH 44555, USA 8 Department of Astronomy, Yonsei University, Seoul 03722, Republic of Korea
9 UK Astronomy Technology Centre, Royal Observatory, Blackford Hill, Edinburgh EH9 3HJ, UK
Received 5 May 2020/ Accepted 8 June 2020
ABSTRACT
The MATLAS deep imaging survey has uncovered a plethora of dwarf galaxies in the low density environment it has mapped. A frac-tion of them are unusually extended and have low surface brightness. Among these so-called ultra-diffuse galaxies, a few seem to host an excess of globular clusters (GCs). With the integral field unit spectrograph MUSE we have observed one of these galaxies – MAT-LAS J15052031+0148447 (MATMAT-LAS-2019) – located toward the nearby group NGC 5846 and measured its systemic velocity, age, and metallicity, and that of its GC candidates. For the stellar body of MATLAS-2019 we derive a metallicity of −1.33+0.19−0.01dex and an age of 11.2+1.8−0.8Gyr. For some of the individual GCs and the stacked GC population, we derive consistent ages and metallicities. From the 11 confirmed GCs and using a Markov Chain Monte Carlo approach we derived a dynamical mass-to-light ratio of 4.2+8.6−3.4M /L .
This is at the lower end of the luminosity-mass scaling relation defined by the Local Group dwarf galaxies. Furthermore, we could not confirm or reject the possibility of a rotational component in the GC system. If present, this would further modify the inferred mass. Follow-up observations of the GC population and of the stellar body of the galaxy are needed to assess whether this galaxy lacks dark matter, as was suggested for the pair of dwarf galaxies in the field of NGC 1052, or if this is a misinterpretation arising from systematic uncertainties of the method commonly used for these systems and the large uncertainties of the individual GC velocities.
Key words. galaxies: kinematics and dynamics – galaxies: stellar content – galaxies: dwarf
1. Introduction
The Mass Assembly of early Type gaLAxies with their fine Structures (MATLAS) survey is a large observing pro-gram designed to study low surface brightness features in the outskirts of nearby massive elliptical galaxies. The sur-vey was conducted using MegaCam at the Canada-France-Hawaii Telescope (CFHT). It reaches surface brightnesses of 28.5−29.0 mag arcsec2in the g-band while achieving high image
quality, thereby enabling the detection of low surface brightness structures together with their globular cluster (GC) population (Duc et al. 2015). It is therefore an excellent data set in which to search for hitherto undetected dwarf galaxies. Habas et al.
(2020) identified 2210 dwarf galaxy candidates with MATLAS. Among these, ∼4% (Marleau et al., in prep.) fall into the cat-egory of ultra-diffuse galaxies (UDGs). These are galaxies that
? The reduced datacube is only available at the CDS via
anony-mous ftp tocdsarc.u-strasbg.fr(130.79.128.5) or viahttp:// cdsarc.u-strasbg.fr/viz-bin/cat/J/A+A/640/A106
?? Based on observations collected at the European Southern
Obser-vatory under ESO program 0103.B-0635(B).
have effective radii larger than 1.5 kpc and a low surface bright-ness (Sandage & Binggeli 1984; van Dokkum et al. 2015), and appear in both cluster and field environments (van der Burg et al. 2016). Their extreme low baryonic mass density makes them ideal probes for dark matter (Silk 2019; Sales et al. 2020;
Prole et al. 2019; Wasserman et al. 2019; Mancera Piña et al. 2019) and alternative models of gravity (Haghi et al. 2019;
Bílek et al. 2019;Islam & Dutta 2019;Moffat & Toth 2019). Two of the most discussed UDGs (e.g., Hayashi & Inoue 2018; Kroupa et al. 2018; Martin et al. 2018; Ruiz-Lara et al. 2019;Müller et al. 2019a; Nusser 2020;Haslbauer et al. 2019) are the now famous NGC 1052-DF2 (van Dokkum et al. 2018) and NGC 1052-DF4 (van Dokkum et al. 2019). These galaxies appear to have a deficiency of dark matter. This conclusion is based on the velocity dispersion measured from a handful of GCs that these systems host (van Dokkum et al. 2018, 2019) and, in the case of NGC 1052-DF2, the stellar body of the galaxy (Emsellem et al. 2019;Danieli et al. 2019). If this inter-pretation holds, it would be puzzling that an old dwarf galaxy with an age estimate of 8.9 ± 1.5 Gyr (Fensch et al. 2019) hosts no massive dark matter halo. In the standard framework of
Open Access article,published by EDP Sciences, under the terms of the Creative Commons Attribution License (https://creativecommons.org/licenses/by/4.0), which permits unrestricted use, distribution, and reproduction in any medium, provided the original work is properly cited.
225 226 227 228 RA 0.0 0.5 1.0 1.5 2.0 2.5 3.0 Dec NGC 5806 NGC 5813 NGC 5831 NGC 5838 NGC 5846 NGC 5854 NGC 5864 NGC 5869 MB> − 15 −17 ≤ MB< −15 −19 ≤ MB< −17 MB< −19
MATLAS cov rag MATLAS-2019
other
MATLAS UDG candidates
1000
1200
1400
1600
1800
2000
2200
2400
velocity [km/s]
1000
1500
2000
2500
velocity [kms]
0.0
2.5
5.0
7.5
10.0
12.5
N
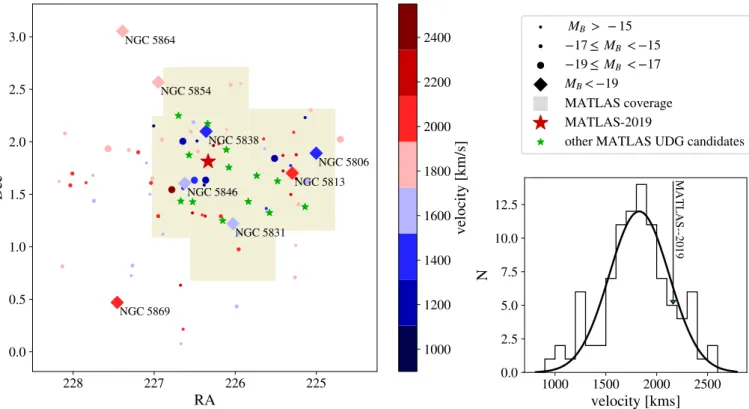
MATLAS --2019Fig. 1.Environment of the NGC 5846 group of galaxies. The large diamonds correspond to giant galaxies and the dots to dwarf galaxies, further dissected by their apparent magnitudes. MATLAS-2019 is indicated with the red star, the remaining UDG candidates are marked as green stars. The colors correspond to the velocities. The MATLAS survey field is indicated as a shaded region. Velocities not taken from MATLAS-2019 are taken fromEigenthaler & Zeilinger(2010) and presented as a histogram in the bottom right corner.
cosmology a primordial dwarf galaxy should always be sur-rounded by a vast dark matter halo unless it is of tidal ori-gin (Kroupa 2012). This interpretation of a lack of dark matter has been debated, questioning the real distances of the galax-ies (Trujillo et al. 2019; Monelli & Trujillo 2019;Danieli et al. 2020), the effects of tidal interactions (Ogiya 2018;Müller et al. 2019b), or rotation (Emsellem et al. 2019; Lewis et al. 2020). The two UDGs, NGC 1052-DF2 and NGC 1052-DF4, as the names suggest, reside in the same field. Therefore it is imper-ative to study such objects in different environments.
We have compiled a list of UDGs (Marleau et al., in prep.) from the MATLAS dwarf galaxy catalog (Habas et al. 2020) and identified a number of systems with a high number of GC candi-dates associated with them, which are similar to NGC 1052-DF2 and NGC 1052-DF4. The GC catalog has been compiled from the MATLAS multiband images, using color and size-proxy criteria to exclude foreground stars and background galaxies (see details inLim et al. 2017). The candidate with the highest number of putative GCs – MATLAS J15052031+0148447, referred to here as MATLAS-2019 as this is the 2019th object in the MATLAS dwarf catalog – was found in the field of the NGC 5846 group of galaxies at a mean distance of 26 Mpc (Cappellari et al. 2011). This X-ray bright group is the most massive galaxy group in the nearby universe and has a mean velocity of 1828 ± 295 km s−1, by considering the galaxies
from Eigenthaler & Zeilinger (2010, 74 galaxies), Ann et al.
(2015, 8 galaxies, after removing duplicates), Mahdavi et al.
(2005, 3 galaxies, after removing duplicates), and NASA/IPAC Extragalactic Database (9 galaxies, after removing duplicates). The central early-type galaxy NGC 5846 is at a distance of 26.3 Mpc, based on the GC luminosity function (Humphrey 2009). MATLAS-2019 was identified as a potential group
member byMahdavi et al.(2005), andForbes et al.(2019) have independently conducted a detailed photometric study of this GC-rich UDG candidate based on data from the VST Early-type GAlaxy Survey (VEGAS) survey. At least in projection MATLAS-2019 is at the heart of the group (see Fig. 1), with an on-sky separation of 0.35 deg to NGC 5846 (corresponding to 164 kpc at the distance of NGC 5846).
In this article, we present a spectroscopic analysis of the UDG candidate MATLAS-2019 and its rich GC population. Table1 compiles all the important information on this galaxy. In Sect.2we present the observations, data reduction, and spec-troscopy of the stellar body and the GCs, in Sect.3we discuss the properties of the GCs, in Sect.4we derive a dynamical mass estimate from the GC population and discuss the amount of dark matter derived from the dynamical mass, and in Sect.5we sum-marize our results.
2. Observations, data reduction, and spectroscopy
For the UDG candidate MATLAS-2019 we requested 12 observation blocks (OBs) with the Multi-unit spectroscopic explorer (MUSE) mounted at the Very Large Telescope at Cerro Paranal, of which 3 were taken in Period 103 (PI: Francine Marleau) under program 0103.B-0635. The data were reduced via the MUSE pipeline (Weilbacher et al. 2020) wrapped within the pymusepipe python package pymusepipe1 (Emsellem et al. 2019), which was previously used to reduce MUSE data taken for the UDG NGC 1052-DF2. This pipeline takes all raw data available in the European Southern Observatory science archive and produces a combined and calibrated (i.e., bias and flat-field
1 https://github.com/emsellem/pymusepipe
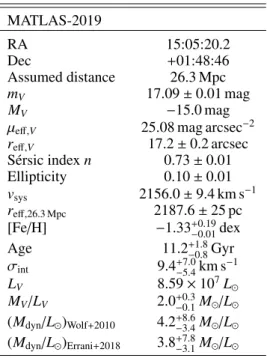
O. Müller et al.: Spectroscopic study of MATLAS-2019 with MUSE Table 1. Characterization of the UDG MATLAS-2019.
MATLAS-2019 RA 15:05:20.2 Dec +01:48:46 Assumed distance 26.3 Mpc mV 17.09 ± 0.01 mag MV −15.0 mag µeff,V 25.08 mag arcsec−2 reff,V 17.2 ± 0.2 arcsec Sérsic index n 0.73 ± 0.01 Ellipticity 0.10 ± 0.01 vsys 2156.0 ± 9.4 km s−1 reff,26.3 Mpc 2187.6 ± 25 pc [Fe/H] −1.33+0.19−0.01dex Age 11.2+1.8−0.8Gyr σint 9.4+7.0−5.4km s −1 LV 8.59 × 10⁷L MV/LV 2.0+0.3−0.1M /L (Mdyn/L )Wolf+2010 4.2+8.6−3.4M /L (Mdyn/L )Errani+2018 3.8+7.8−3.1M /L
corrected, astrometrically calibrated, wavelength calibrated, and flux calibrated) data cube. The sky background was kept in the derived stacked data cube, and only then removed via the usage of Zurich Atmosphere Purge (ZAP) packages (Soto et al. 2016), as was done for NGC 1052-DF2 (Emsellem et al. 2019). The total integration time on target was 7783 s or 2.16 h.
The extraction of the systemic velocity was done employ-ing penalized pixel fittemploy-ing (pPXF,Cappellari & Emsellem 2004;
Cappellari 2017) and follows the same procedure as we have employed for NGC 1052-DF2 (Emsellem et al. 2019;
Fensch et al. 2019). The stellar spectrum of the galaxy itself was extracted using a circular aperture (given its proximity to zero ellipticity): the radius of the aperture was set to 57 px to opti-mize the signal to noise (S/N) ratio. To create a mask for the spectrum extraction, we collapsed the full 3D cube into a 2D image. On this 2D image, point sources and background galaxies were masked based on the sources detected with Source Extrac-tor (Bertin & Arnouts 1996; Barbary 2016) with a 3σ thresh-old. Due to some blending issues we manually masked some of the brightest sources within the galaxy. Furthermore, we masked some additional sources that were not picked up by Source Extractor. After manually masking any strong sky features of the spectra, we derived a systemic velocity with pPXF and the eMILES library (Vazdekis et al. 2016) using the most prominent absorption lines between 4800 and 8800 Å, namely Hβ, Mg, Fe, Hα, and CaT. However, depending on the S/N not all lines are visible. We use a set of single stellar population (SSP) spectra with a Kroupa initial mass function (IMF), metallicities ([Fe/H]) ranging from solar down to −2.27 dex, and ages from 70 Myr to 14.0 Gyr. The spectra from the SSP library were convolved with the line-spread function as described inGuérou et al.(2017) (see also the appendix ofEmsellem et al. 2019). A variance spectrum was measured on the masked data cube and added to pPXF. For the galaxy we measure a velocity of 2156.4±5.6 km s−1. Because
only 3 out of the 12 requested OBs were taken, the S/N is too low to apply a binning scheme for an estimation of the stel-lar velocity dispersion, as originally intended. To test whether we could boost the signal, we weighted the pixels according to the Sérsic profile of the galaxy with the optimal extraction
algorithm (Horne 1986) of MUSE Python Data Analysis Frame-work (MPDAF,Bacon et al. 2016), giving more weight to the pixels near the center and less to the pixels in the outskirts, where fewer photons arrive. However, this led to a minimal change in the velocity estimation, due to the fact that the stellar profile is considerably flat – one of the key properties of UDGs.
The uncertainties of the velocities are derived via a wild bootstrap approach, such as we have taken in Emsellem et al.
(2019). Namely, at each wavelength we randomized the sign of the residual and added it to the best fit spectrum. We repeated this 1000 times. The 1σ standard deviation of the resulting velocity distribution then gives the error.
To search for globular clusters in the MUSE data cube, we again ran Source Extractor on the 2D image to find all point sources and applied pPXF with circular apertures on top of the objects. To boost the signal, we weighted the signal with a Gaussian with kernel width equals to the measured image quality (∼4.5 px or 1.1 arcsec). Point sources were rejected if the velocity was ±100 km s−1 away from the galactic velocity. This range was selected to avoid missing any potential GCs with large uncertainties, but still being larger than the typical velocity dispersion of ∼20 to 30 km s−1 for such low surface brightness dwarf galaxies. Each remaining spectrum was then examined and a final GC catalog was produced. The S/N ratio per pixel is measured in a region between 6600 and 6800 Å. It is calculated as the mean fraction between the flux and the square root of the variance. The variance itself was rescaled, being multiplied by the Chi2 value estimated from the best pPXF fit, to provide a
more direct account of the local noise. In total we find 11 GCs (see Fig.2). Ten out of the 11 GCs were in the GC candidate list based on the MATLAS gri images. From this MATLAS GC list, two candidates have been uncovered as stars and another two are too faint for spectroscopy in MUSE. However, if we stack together these two candidates we get a reasonable spectrum from which we can derive a velocity (2184.0 ± 12.8 km s−1), which
is consistent with the velocity of the UDG. This indicates that these are also likely to be GCs of MATLAS-2019, so we con-sider them as GC candidates. In Table2and Fig.3we present the line-of-sight velocities for the galaxy, the GCs, and the stacked MATLAS GC candidates.
3. Globular cluster system of MATLAS-2019
In this section we discuss the properties of the GC system. This includes the distribution of the GCs, their brightness, age, and metallicity estimates.
3.1. General properties of the GC system
The UDG MATLAS-2019 has a rich population of GCs. The GCs appear to be isotropically distributed, with no preferential alignment. The mean separation to the center of the galaxy is 8.0 arcsec, which corresponds to 1.0 kpc at the putative distance of 26.3 Mpc. The most distant GC is at 19.6 arcsec within the MUSE field of view, meaning a physical distance of 2.5 kpc, which roughly coincides with the effective radius of the galaxy. Half the GCs are within 6.0 arcsec (0.8 kpc). Interestingly, all the bright GCs are concentrated in the central region of the galaxy (see Fig. 2), with the brightest one, GC6, being located only 1.6 arcsec (0.2 kpc) away from the photometric galaxy center. The luminosity and putative distance of GC6 is MV = −9.6 mag,
making it compatible with being both a nuclear star cluster (NSC) and a GC (see, e.g., Fig. 8 in Fahrion et al. 2020a). Its
Fig. 2.Left: MATLAS true-color image (composite g+ r + i). Middle: residual g-band image, with a galaxy model subtracted. The confirmed GCs (red) and GC candidates (blue) are labeled. The rejected MATLAS GC candidates are indicated in yellow. Right: region from which the galactic spectrum is extracted indicated with a color map. Brighter colors correspond to a larger signal in the displayed MUSE stacked image. North is to the top and east is to the left.
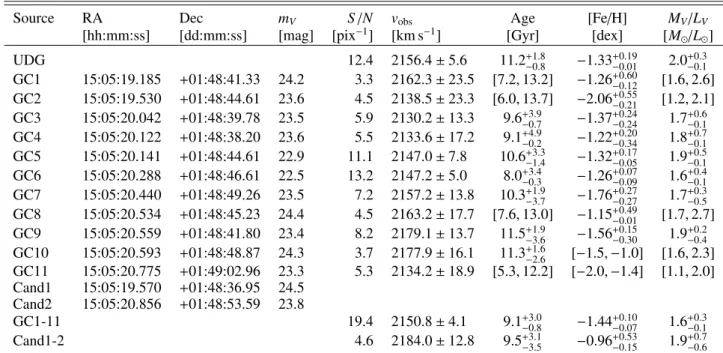
Table 2. Positions and measurements of the unresolved/point-like sources and the UDG.
Source RA Dec mV S/N vobs Age [Fe/H] MV/LV
[hh:mm:ss] [dd:mm:ss] [mag] [pix−1] [km s−1] [Gyr] [dex] [M /L ] UDG 12.4 2156.4 ± 5.6 11.2+1.8−0.8 −1.33+0.19−0.01 2.0+0.3−0.1 GC1 15:05:19.185 +01:48:41.33 24.2 3.3 2162.3 ± 23.5 [7.2, 13.2] −1.26+0.60−0.12 [1.6, 2.6] GC2 15:05:19.530 +01:48:44.61 23.6 4.5 2138.5 ± 23.3 [6.0, 13.7] −2.06+0.55−0.21 [1.2, 2.1] GC3 15:05:20.042 +01:48:39.78 23.5 5.9 2130.2 ± 13.3 9.6+3.9−0.7 −1.37+0.24−0.24 1.7+0.6−0.1 GC4 15:05:20.122 +01:48:38.20 23.6 5.5 2133.6 ± 17.2 9.1+4.9−0.2 −1.22+0.20−0.34 1.8+0.7−0.1 GC5 15:05:20.141 +01:48:44.61 22.9 11.1 2147.0 ± 7.8 10.6+3.3−1.4 −1.32+0.17−0.05 1.9+0.5−0.1 GC6 15:05:20.288 +01:48:46.61 22.5 13.2 2147.2 ± 5.0 8.0+3.4−0.3 −1.26+0.07−0.09 1.6+0.4−0.1 GC7 15:05:20.440 +01:48:49.26 23.5 7.2 2157.2 ± 13.8 10.3+1.9−3.7 −1.76+0.27−0.27 1.7+0.3−0.5 GC8 15:05:20.534 +01:48:45.23 24.4 4.5 2163.2 ± 17.7 [7.6, 13.0] −1.15+0.49−0.01 [1.7, 2.7] GC9 15:05:20.559 +01:48:41.80 23.4 8.2 2179.1 ± 13.7 11.5+1.9−3.6 −1.56+0.15−0.30 1.9+0.2−0.4 GC10 15:05:20.593 +01:48:48.87 24.3 3.7 2177.9 ± 16.1 11.3+1.6−2.6 [−1.5, −1.0] [1.6, 2.3] GC11 15:05:20.775 +01:49:02.96 23.3 5.3 2134.2 ± 18.9 [5.3, 12.2] [−2.0, −1.4] [1.1, 2.0] Cand1 15:05:19.570 +01:48:36.95 24.5 Cand2 15:05:20.856 +01:48:53.59 23.8 GC1-11 19.4 2150.8 ± 4.1 9.1+3.0−0.8 −1.44+0.10−0.07 1.6+0.3−0.1 Cand1-2 4.6 2184.0 ± 12.8 9.5+3.1−3.5 −0.96+0.53−0.15 1.9+0.7−0.6
velocity is slightly offset from the velocity of the stellar body, but still well within the uncertainties. The total luminosity of GC6 is 19.6 mag in the V-band, which is ∼30 times fainter than that of the stellar body.
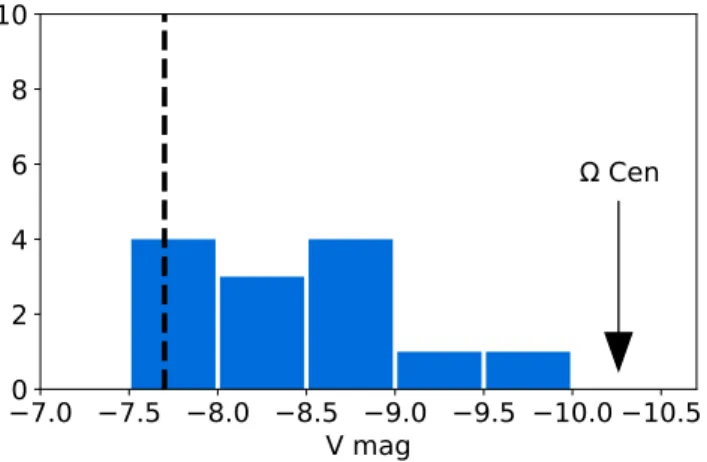
The brightest GC of MATLAS-2019 has MV = −9.6 mag,
almost as bright as Ω Cen (see Fig. 4), which is unexpect-edly bright. This is similar to the GC population of NGC 1052-DF2, with the brightest GC having a similar luminosity to Ω Cen (van Dokkum et al. 2018). The GC luminosity function (Rejkuba 2012) and the specific frequency will be the topic of a future work.
3.2. Age and metallicity
For some of the GCs we were able to estimate a metallicity and age. We derived these properties from the weights of the SSP models. The estimations are provided in Table 2. Addi-tionally, we stacked the spectra of all the GC members of
Fig. 3.Velocities derived from the dominant absorption lines. The dots correspond to the velocities of the GCs, the square corresponds to the stacked spectra of the two remaining MATLAS GC candidates. The red line and shaded region indicate the velocity of the stellar body of the UDG and the corresponding uncertainty.
MATLAS-2019. In doing so we reach S /N = 19 px−1,
which yields a more robust estimation of the mean metallic-ity and age of the GCs. For the stacked GC population, we
O. Müller et al.: Spectroscopic study of MATLAS-2019 with MUSE
−10.5
−10.0
−9.5
−9.0
−8.5
−8.0
−7.5
−7.0
V mag
0
2
4
6
8
10
Ω Cen
Fig. 4. Globular cluster luminosity function of MATLAS-2019 pre-sented as a histogram, assuming a distance of 26.3 Mpc. The black line denotes the putative peak of the globular cluster luminosity function at the given distance.
derive a metallicity of [Fe/H] = −1.44+0.10−0.07dex and an age of 9.1+3.0−0.8Gyr. For the stellar body of MATLAS-2019 we derive [Fe/H] = −1.33+0.19−0.01dex and an age of 11.2+1.8−0.8Gyr. These val-ues are consistent with each other, a finding similar to the one in NGC 1052-DF2 (Fensch et al. 2019). The uncertain-ties are derived from the 16% and 84% intervals from the previously described bootstrap. Where the bootstrap did not converge, we present the interval within which 68% of the estimates fall (again presented in Table 2). From the weighted metallicities and ages we calculated the mass-to-light ratio of the stellar population. The uncertainties are again estimated from the bootstrap. In Fig. 5 we present how these numbers relate to the luminosity-metallicity relation of nearby dwarf galaxies and the metallicity-age relation for Milky Way GCs and the GCs of the massive galaxies of the Fornax cluster, as well as the properties derived for NGC 1052-DF2 (Fensch et al. 2019). The metallicity of MATLAS-2019 is consistent with other nearby dwarf galaxies and follows the luminosity-metallicity scaling relation. The GCs of MATLAS-2019 are also con-sistent with the metallicity-age relation as measured with MUSE in the Fornax 3D project (Fahrion et al. 2020b,c). In this respect, there is nothing out of the ordinary in these systems.
4. Dark matter content in MATLAS-2019
From the velocities of the GCs we can derive a velocity dis-persion and ultimately the dynamical mass of the system. In the following we infer the dynamical mass of MATLAS-2019 employing Bayesian considerations. We first assume a com-pletely pressure-supported system and later generalize it for an additional rotational component.
4.1. Dynamical mass estimation of a pressure-supported system
Assuming that the globular clusters trace the underlying gravita-tional potential, are in dynamical equilibrium, and are pressure-support dominated, their velocity dispersion can be used to estimate the total mass of the system. For this we need to esti-mate the free parameters, namely the intrinsic velocity disper-sion σint and the systemic velocity vGCs, of all GCs combined.
-16 -14 -12 -10 -8 -6 -3 -2.5 -2 -1.5 -1 -0.5 <[Fe/H]> MATLAS-2019 NGC1052-DF2 (Fensch+2019) Cen A Group (Crnojevic+19, Müller+19) Local Group (McConnachie 2012)
-3 -2.5 -2 -1.5 -1 -0.5 [Fe/H] 6 7 8 9 10 11 12 13 14 age [Gyr] MATLAS-2019 GCs MATLAS-2019 GCs, stacked NGC1052-DF2 GCs (Fensch+2019) MW GCs (VandenBerg+13) Fornax 3D GCs (Fahrion+20a,b) M V [mag]
Fig. 5.Top: luminosity-metallicity relation for the Local Group dwarfs (gray dots, McConnachie 2012), Centaurus group dwarfs (gray tri-angles, Crnojevi´c et al. 2019; Müller et al. 2019c), NGC 1052-DF2 (blue point, Fensch et al. 2019), and MATLAS-2019 (red point). Bottom: metallicity-age relation for Milky Way GCs (gray dots, VandenBerg et al. 2013), GCs from 23 galaxies of the Fornax clus-ter (turquoise dots,Fahrion et al. 2020b,c), the stacked GC population of NGC 1052-DF2 (blue square,Fensch et al. 2019), and the GCs and stacked GC population of MATLAS-2019 (small red points and large red square).
The log likelihood function is given by
log L= N X i=1 log √ 1 2πσobs ! −(vobs,i− vGCs) 2 2σ2 obs , (1) with σ2 obs= σ 2 int+ δ 2 v,i, (2) A106, page 5 of10
vsys
= 2150.9
+5.34.9km s
12120 2140 2160 2180 2200
vsys
[km s
1]
8
16
24
32
40
int[k
m
s
1]
8 16 24 32 40
int[km s
1]
int= 9.4
+7.05.4km s
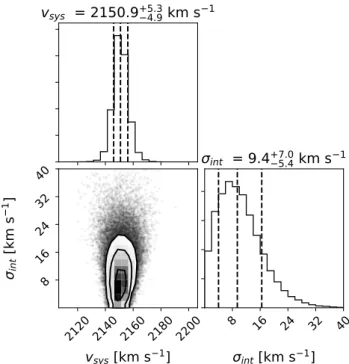
1Fig. 6.Sampled posterior distribution from our Markov chain Monte Carlo analysis of the velocity dispersion and systemic velocity of the GC system. The three dashed lines indicate the 16, 50, and 84 per-centiles, which correspond to the upper and lower uncertainty bound-aries, and the best parameter estimation (i.e., the median).
where N is the number of tracers, σobsis the observed
veloc-ity dispersion, which is a combination of the true velocveloc-ity dis-persion σint and the observational uncertainties δv, vobs is the
observed velocity, and vGCs is the systemic velocity of all GCs
combined. The two variables vGCsand σint are the parameters
in which we are interested. We impose a non-informative prior (Agnello & Bruun, in prep.), which suppresses velocity disper-sions that are too small2. We use a Markov chain Monte Carlo
(MCMC) approach to sample the two unknown parameters. For this purpose, we use the python package emcee with 100 walk-ers, 100 iterations of burn-ins, and finally 10 000 steps along the chains. The resulting posterior distribution is shown in Fig. 6. The errors are given by the 68% (i.e., 1σ in frequentist statistics) bounds. We derive an intrinsic velocity dispersion of the GC and candidate system of σint= 9.4+7.0−5.4km s−1and a systemic velocity
of vGCs= 2150.9+5.3−4.9km s−1, respectively.
Next, we estimate the dynamical mass-to-light ratio Mdyn/LV
within one de-projected half-light radius r1/2. The dynamical
mass Mdynwithin r1/2is given by (Wolf et al. 2010)
Mdyn(r1/2)=
4 reffσ2int
G , with r1/2= 4
3reff, (3)
where G is the gravitational constant and reff is the measured
effective radius (coming from a 2D Sérsic fit). The luminos-ity LV is derived from the g-band magnitude using Lupton
(2005) and a (g − r) color of 0.59 mag. With an absolute V-band
2 We also tested a uniform prior of 1 for v
GCsbetween ±50 around the
mean of the observed velocities and 0 < σint < 30 km s−1. Everywhere
else the probability is set to 0. Using this prior instead only slightly change the result on the order of 1 km s−1, which is well within the
uncertainties. The difference is that the flat prior gives more realiza-tions of very small velocity dispersions (<4 km s−1). These are highly
unrealistic, as it would be less than what is expectedto arise from the baryonic content alone.
magnitude of −15.0 (adopting a distance of 26.3 Mpc) we get LV = 8.59 × 10⁷L . The effective radius at a putative distance
of 26.3 Mpc is reff = 2187.6 pc. Putting all this together yields
a dynamical mass within one de-projected half-light radius of Mdyn = 18.0+37.1−14.8 × 10
7M
and finally a dynamical
mass-to-light ratio of Mdyn/LV = 4.2+8.6−3.4M /L . For the uncertainties
in the distance, we adopted a conservative lower limit of 22 Mpc and an upper limit of 32 Mpc, corresponding to the respectively lower and higher estimated distances of the massive galaxies in the field. If we instead use the more recent mass estimator by
Errani et al. (2018), which updated the estimator provided by
Amorisco & Evans(2011), Mdyn(1.8 reff)=
6.5 reffσ2int
G , (4)
we derive a dynamical mass-to-light ratio within 1.8 reff
(encom-passing 87% of the total luminosity) of 3.8+7.8−3.1M /L . The two
estimators yield consistent values, which shows that the choice of the mass estimator does not change the result.
We consider how this compares to other galaxies. We use the Spitzer Photometry and Accurate Rotation Curves (SPARC) database provided by Lelli et al. (2016, 2017), which gives a measure of the observed acceleration gobsin terms of the
accel-eration expected by the baryons gbar. While this radial
acceler-ation relacceler-ation (RAR) is strictly speaking purely observacceler-ational, the deviation from unity gives information about the dark mat-ter content of the galaxy. If gobsis equal to gbar, the acceleration
the galaxy experiences due to gravity can be solely explained by the baryonic content of the galaxy – no need for dark matter. On the other hand, if gobsis much larger than gbarwe need to invoke
dark matter, or alternative gravity models (e.g., modified New-tonian dynamics MOND,Milgrom 1983;Famaey & McGaugh 2012) to explain the observations.
FromLelli et al.(2017) we can calculate gobs= 3 σ2int r1/2 , (5) gbar =Γ VG LV 2 r2 1/2 · (6)
The parameterΓV is the stellar mass-to-light ratio (MV/LV). In
Fig.7left panel, we show the RAR, together with our estima-tion for MATLAS-2019, the dwarf galaxies of the Local Group, and other UDGs. The observed acceleration of the UDG is close to unity, meaning that its baryonic content is able to explain the measured velocity dispersion alone. With a Mdyn/LV ratio
of only 4, this is expected. Taking this at face value, the UDG appears to be lacking dark matter. However, the uncertainties are large. The upper 1σ error bound yields a Mdyn/LV ratio of 14,
which would be consistent with the RAR and the dwarf galax-ies of the Local Group. At 2σ the Mdyn/LV is 25, fully
con-sistent with the Local Group dwarfs. This becomes even more evident when the Mdyn/LV ratio as a function of the luminosity
is compared to Local Group dwarf galaxies. This is shown in Fig.7, right panel. The UDG, together with NGC 1052-DF2 and NGC 1052-DF4, follows the scaling relation as defined by Local Group dwarf galaxies and is comparable to the dwarf irregulars (dIrr) IC 1613 and NGC 6822 (Kirby et al. 2014).
4.2. Dynamical mass estimation with rotation
The previous assessment of the dynamical mass was based on the assumption that the system is fully pressure supported. An addi-tional rotaaddi-tional component can change the results. In the case
O. Müller et al.: Spectroscopic study of MATLAS-2019 with MUSE −12.5−12.0−11.5−11.0−10.5−10.0 −9.5 −9.0 −8.5 log
(
gbar) [) s
−2]
−1
3.0 312.5 312.0 311.5 311.0 310.5 310.0 39.5 39.0 38.5 lo g(
gob s) [
)
s
−2]
MATLAS-2019 (this work)
NGC1052-DF2 (Emsellem+19)
NGC1052-DF4 (van Dokkum+19)
Virgo UDGs (Toloba+18)
Coma UDGs (Chilingarian+19)
Local Group dwarfs (Lelli+17)
10
410
510
610
710
8 LVL7
]
10
010
110
210
310
4⊙
Mdy n/
LV)
1/2M7
/
L7]
MATLAS-2019 ⊙2()s 5o0k)
NGC1052-DF2 ⊙Emsellem+19)
NGC1052-DF4 (van Dokkum+19)
Virgo UDGs (Toloba+18)
Coma UDGs (Chilingarian+19)
Local Group dSph (Walker+09)
Local Group dIrrs (Kirby+14)
Fig. 7.Left: radial acceleration relation (RAR) byLelli et al.(2017). The black dots correspond to the Local Group dwarfs compiled inLelli et al. (2017). The red dot plus lines give the measured values for MATLAS-2019 and its uncertainties (1 and 2σ), respectively. The blue dot is the UDG NGC 1052-DF2 observed with MUSE (Emsellem et al. 2019), and the yellow dot is NGC 1052-DF4 (van Dokkum et al. 2019). The cyan and violet squares are UDGs in the Virgo cluster (Toloba et al. 2018) and the Coma cluster (Chilingarian et al. 2019), respectively. The dashed line corresponds to unity. Right: mass-to-light ratios for Local Group dwarf dSph (black dots,Walker et al. 2009) and dIrr (gray dots,Kirby et al. 2014), MATLAS-2019 (red dot), NGC 1052-DF2 (blue dot,Emsellem et al. 2019), NGC 1052-DF4 (yellow dot,van Dokkum et al. 2019), and the UDGs in the Virgo cluster (cyan diamonds,Toloba et al. 2018) and the Coma cluster (violet diamonds,Chilingarian et al. 2019) as a function of their luminosities.
of NGC 1052-DF2, a rotational signal for both the stellar body (Emsellem et al. 2019) and the GC system (Lewis et al. 2020) was found, while the former could not be confirmed by indepen-dent measurements (Danieli et al. 2019). Let us now consider an additional rotational component for the GC system. For this, we follow the description byLewis et al.(2020). The log likelihood function is given by log L= N X i=1 log √ 1 2πσobs ! −(vobs,i− (vrot(θ)+ vGCs)) 2 2σ2obs , (7) with σ2 obs= σ 2 int+ δ 2 v,i, (8) vrot(θ)= A sin (θi−φ), (9)
where vrot describes the additional rotational component, φ the
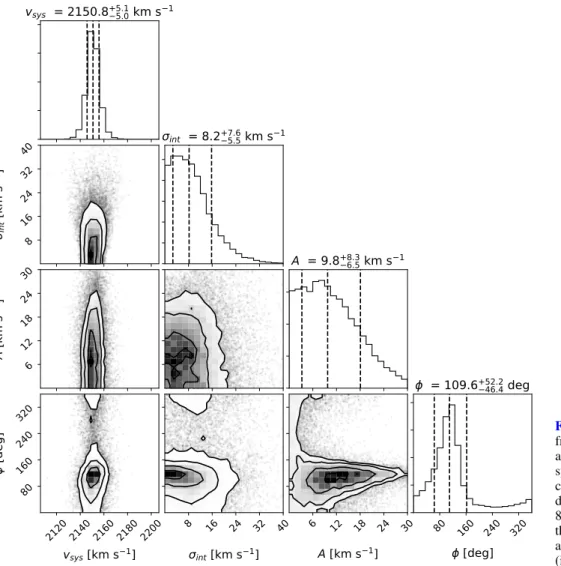
rotation axis, θ the angle between the line from the center of the galaxy to the GC and the east direction, measured counterclock-wise, and A is the amplitude of the rotation velocity. We sam-ple over the unknown parameters using a MCMC approach, as before. We use flat priors as it was done inLewis et al.(2020). The results are shown in Fig. 8. We find a best separation of φ = 110+52
−46deg and A= 9.8+8.3−6.5km s
−1. For the latter, the
poste-rior distribution is mainly flat within 0 to 10 km s−1. This poste-rior distribution and the best-parameter estimation with its errors can neither confirm nor rule out a rotational component of the GC system. In the following, we take the best fit at face value and assume that there is indeed a rotational component for the sake of testing its impact on the mass estimation. In Fig.9we present the position-velocity diagram for the best-fit rotation axis. For
that, we have calculated the 2D separations of each GC to the rotation axis given by the angle θ and fixed at the center of the galaxy.
Following the description ofLewis et al.(2020) the dynami-cal mass is estimated with
Mdyn(r1/2)= vrot sin (i) !2 + σ2 int r1/2 G · (10)
Here, an additional problem becomes evident – we do not know the inclination i of the rotational system (if there is any). As the ellipticity of the UDG is close to zero, we can start by assuming that the inclination is 90◦, in other words, we see the rotation
sys-tem perfectly edge-on. In this case, the Mdyn/LV ratio is 2.6+3.6−1.8.
However, in this case, the roundness of the object would be puz-zling, as low surface brightness dwarf galaxies tend to be best described as oblate-triaxial spheroids (Sánchez-Janssen et al. 2019). Is the shape of the dwarf galaxy a good indicator for the inclination of its GC system? For NGC 1052-DF2 this is not the case. There, the rotation axis of the GCs was found to be roughly perpendicular to the major axis of the galaxy (Lewis et al. 2020). If the GC system inherited a dynamic memory from an accretion event, no a priori alignment can be expected. Therefore, we can-not constrain the inclination with the ellipticity of MATLAS-2019. Smaller inclinations will increase the Mdyn/LV ratio to
3.0+4.4−2.2 (60◦), 3.9+6.0 −2.8 (45
◦), and 6.2+11.1
−4.6 (30
◦). These values
are again ambiguous, with the lower values indicating a lack of dark matter, and the larger values being consistent with dark-matter-dominated dwarf galaxies. To conclude, the data at hand cannot firmly constrain the existence of a rotational component.
v
sys= 2150.8
+5.15.0km s
18
16
24
32
40
int[k
m
s
1]
int= 8.2
+7.65.5km s
16
12
18
24
30
A
[k
m
s
1]
A = 9.8
+8.36.5km s
12120 2140 2160 2180 2200
v
sys[km s
1]
80
160
240
320
[d
eg
]
8 16 24 32 40
int[km s
1]
6 12 18 24 30
A [km s
1]
80 160 240 320
[deg]
= 109.6
+52.246.4deg
Fig. 8. Sampled posterior distribution from our Markov chain Monte Carlo analysis of the velocity dispersion and systemic velocity, including a rotational component of the GC system. The three dashed lines indicate the 16th, 50th, and 84th percentiles, which correspond to the upper and lower uncertainty bound-aries, and the best parameter estimation (i.e., the median).
4.3. MATLAS-2019 in modified Newtonian dynamics
When the initial claim for the dark-matter-deficient UDG NGC 1052-DF2 came up (van Dokkum et al. 2018), this was used as a falsification for alternative gravity models like MOND (Milgrom 1983, see alsoFamaey & McGaugh 2012). In MOND-like theories, the baryons mimic the behavior of dark matter, so an absence of a phantom dark matter halo3would be inconsistent
with the theory. However, this assessment ignores a peculiar phe-nomenon in MOND, the so-called external field effect (EFE, see, e.g.,Haghi et al. 2019for a recent discussion), which can arise when a galaxy resides in an external gravitational potential. This EFE can lower the velocity dispersion of the system, making it appearing Newtonian, that is, dark matter free. For NGC 1052-DF2 it was shown that the EFE induced by NGC 1052 can miti-gate the tension (Kroupa et al. 2018;Famaey et al. 2018).
We considered MATLAS-2019 in terms of MOND. In an isolated case, the expected MONDian velocity dispersion is cal-culated from the baryonic mass of the galaxy. Transforming its V-band magnitude with a M/L ratio of 2.0 gives σMOND =
17.9 km s−1, which is marginally above the one sigma upper limit
of our measured velocity dispersion, but well within two sigma. The EFE calculation for the UDG cannot be conducted so
eas-3 In MOND, the term phantom dark matter is used to describe a
behav-ior that is expected of dark matter in standard gravity. This means that the galaxy should exhibit a higher velocity dispersion than that given by its baryonic content derived under Newton’s law.
5.0 2.5 0.0 2.5 5.0 7.5 10.0 12.5 15.0
[arcsec]
2120
2140
2160
2180
2200
v
sys[k
m
/s]
Fig. 9.Position-velocity diagram for the GC system, using the 2D dis-tance to the best-fit rotation axis with angle θ. Red and blue indicates whether the GCs are red or blueshifted with respect to the velocity of the GC system.
ily, because the influence of all the nearby giant galaxies has to be taken into account. We refer to a future work but note that the EFE will push down the expected MONDian value of the velocity dispersion. One caveat though: if MATLAS-2019 is completely dominated by the EFE, it should be quickly dis-solving, as the galaxy has no phantom dark matter protecting it against tidal forces (Milgrom 2015, see also a similar discussion byBílek et al. 2019for the UDG DF-44 in the Coma cluster).
O. Müller et al.: Spectroscopic study of MATLAS-2019 with MUSE
5. Discussion and conclusions
With MUSE we have followed up the dwarf galaxy MAT-LAS J15052031+0148447 (MATLAS-2019), which has a rich globular cluster system and is located in the NGC 5846 group of galaxies. The object turned out to have also been detected in the VEGAS survey byForbes et al.(2019). We obtained spectra of the stellar body and its GC candidates. We have confirmed 11 to be real GCs associated to the galaxy and two additional as likely candidates. The mean velocity of the GC system derived from our MCMC approach is consistent with the velocity of the galaxy (vgal = 2156.4 ± 5.6 km s−1). The velocity of the galaxy
itself is consistent with the velocity distribution of the NGC 5846 group of galaxies (vgroup = 1828.4 ± 295.2 km s−1). If the dwarf
galaxy is at the distance of the NGC 5846 group, its brightest GC would be rather intriguing, having a similar luminosity toΩ Cen.
For some of the GCs we were able to derive a metallicity and age. Additionally, the stacked GC spectrum allowed us to derive a metallicity and age estimate for the GC population and with [Fe/H] = −1.44+0.10−0.07dex and an age of 9.1+3.0−0.8Gyr is compatible with the one derived from the stellar body of MATLAS-2019 with [Fe/H] = −1.33+0.19−0.01dex and an age of 11.2+1.8−0.8Gyr. This shows that both the galaxy and the GCs are old and metal poor. Comparing the metallicities of the stellar body and the GCs to nearby dwarf galaxies and GCs, respectively, we find consistent results.
From the individual GC velocities, we have derived a veloc-ity dispersion, yielding Mdyn/LV within one de-projected
half-light radius of 4.2+8.6−3.4M /L . Using another mass estimator
within 1.8 times the effective radius, we derive a Mdyn/LV ratio
of 3.9+8.1−3.1M /L , which is consistent with the previous estimate.
Within the uncertainties, these values are consistent with the dark-matter-dominated dwarf galaxies in the Local Group, as well as the two apparently dark-matter-deficient galaxies in the NGC 1052 group. In contrast to NGC DF2 and NGC 1052-DF4, the association of MATLAS-2019, which belongs to a rich, X-ray luminous group of galaxies, should be much less ambigu-ous.
For the analysis of the dynamical mass, we used the distance of 26.3 Mpc from the central body of the galaxy group, namely NGC 5846 (vNGC 5846 = 1712 km s−1). There is
a notably high difference in velocity between the two bod-ies. This could either mean that the UDG is on its infall into the group, or even farther behind. The latter would lower the Mdyn/LV ratio. In velocity space, the closest
galax-ies are NGC 5869 (vNGC 5869 = 2065 km s−1) and NGC 5813
(vNGC 5813 = 1956 km s−1). These galaxies have distance
esti-mates of 24.9 Mpc and 31.3 Mpc, respectively. While the former would change the derived Mdyn/LV ratio to 4.4 M /L , the latter
would lower it to 3.5 M /L . The conclusions remain the same.
For NGC 1052-DF2, indications of a rotational signal of the GC system were found. We asked whether this could be the case for MATLAS-2019 as well. Here, an analysis including the angles of the GCs for a rotational component of the GC system remained inconclusive. For the moment, rotation can-not be ruled out. Assuming that a rotation of the GC system is present, the unknown inclination angle of the rotational compo-nent of MATLAS-2019 makes it difficult to confine the Mdyn/LV
ratio. An edge-on system would lead to a dark-matter-deficient galaxy, a larger inclination would instead make it consistent with dark-matter-dominated dwarf galaxies. For the future, the confir-mation of a rotational component could shed new light on the formation scenario of these systems. It is possible that the
GCs were accreted and retained their dynamical memory, which could further lead to misinterpretation of the mass content of these galaxies.
The GC population is not always a good indicator of the mass of a system, as was shown for the Fornax dwarf spheroidal (Mateo et al. 1991). For Fornax, the GC system can yield a total mass of the object free of dark matter, while the stellar body sug-gests a M/L ratio of 10 and more (Walker et al. 2009), leaving ample space for dark matter.Laporte et al.(2019) further showed that even when solely considering the GC system of Fornax, the observation can be interpreted as “overmassive”, “just right”, or “lacking dark matter”, due to large uncertainties from observa-tions, mass estimators, scatter in the mass-concentration relation, and tidal stripping. A sample of just a few GCs yields order-of-magnitude systematic uncertainties in the velocity dispersion and in the mass (Laporte et al. 2019), which will not be reflected in the given numbers presented here. Another caveat that has to be taken into account is that the system is not necessarily station-ary enough to have reliable ensemble estimates, introducing even more biases. Even by ignoring these effects, the 1σ upper limit of the mass of the galaxy, the derived Mdyn/LVratio is consistent
with other dwarf galaxies from the Local Group, therefore allow-ing for a fair share of dark matter. In other words, while the mea-sured velocity dispersion of MATLAS-2019 taken at face value could be interpreted as a lack of dark matter, the uncertainties – both systematic and observational – do not rule out one or the other option. Therefore, measuring the stellar internal kinemat-ics of the UDG is ultimately needed to understand whether there is a lack of dark matter in this galaxy.
Acknowledgements. We thank the referee for the constructive report, which helped to clarify and improve the manuscript. The corner plots were created with the open source python package corner (Foreman-Mackey 2016) The authors thank Katja Fahrion for providing the table of GCs used in Fig.5. O.M. thanks Nicolas Martin for interesting discussions concerning the dynamical mass esti-mation. O.M. is grateful to the Swiss National Science Foundation for finan-cial support. S.P. acknowledges support from the New Researcher Program (No. 2019R1C1C1009600) through the National Research Foundation of Korea. A.A. was supported by a grant from VILLUM FONDEN (project number 16599). This project is partially funded by the Danish council for independent research under the project “Fundamentals of Dark Matter Structures”, DFF–6108-00470.
References
Amorisco, N. C., & Evans, N. W. 2011,MNRAS, 411, 2118
Ann, H. B., Seo, M., & Ha, D. K. 2015,ApJS, 217, 27
Bacon, R., Piqueras, L., Conseil, S., Richard, J., & Shepherd, M. 2016, Astrophysics Source Code Library [record ascl:1611.003]
Barbary, K. 2016,J. Open Source Softw., 1, 58
Bertin, E., & Arnouts, S. 1996,A&AS, 117, 393
Bílek, M., Müller, O., & Famaey, B. 2019,A&A, 627, L1
Cappellari, M. 2017,MNRAS, 466, 798
Cappellari, M., & Emsellem, E. 2004,PASP, 116, 138
Cappellari, M., Emsellem, E., Krajnovi´c, D., et al. 2011,MNRAS, 413, 813
Chilingarian, I. V., Afanasiev, A. V., Grishin, K. A., Fabricant, D., & Moran, S. 2019,ApJ, 884, 79
Crnojevi´c, D., Sand, D. J., Bennet, P., et al. 2019,ApJ, 872, 80
Danieli, S., van Dokkum, P., Conroy, C., Abraham, R., & Romanowsky, A. J. 2019,ApJ, 874, L12
Danieli, S., van Dokkum, P., Abraham, R., et al. 2020,ApJ, 895, L4
Duc, P.-A., Cuillandre, J.-C., Karabal, E., et al. 2015,MNRAS, 446, 120
Eigenthaler, P., & Zeilinger, W. W. 2010,A&A, 511, A12
Emsellem, E., van der Burg, R. F. J., Fensch, J., et al. 2019,A&A, 625, A76
Errani, R., Peñarrubia, J., & Walker, M. G. 2018,MNRAS, 481, 5073
Fahrion, K., Müller, O., Rejkuba, M., et al. 2020a,A&A, 634, A53
Fahrion, K., Lyubenova, M., Hilker, M., et al. 2020b,A&A, 637, A26
Fahrion, K., Lyubenova, M., Hilker, M., et al. 2020c,A&A, 637, A27
Famaey, B., & McGaugh, S. S. 2012,Liv. Rev. Relativ., 15, 10
Famaey, B., McGaugh, S., & Milgrom, M. 2018,MNRAS, 480, 473
Fensch, J., van der Burg, R. F. J., Jeˇrábková, T., et al. 2019,A&A, 625, A77
Forbes, D. A., Gannon, J., Couch, W. J., et al. 2019,A&A, 626, A66
Foreman-Mackey, D. 2016,J. Open Source Softw., 1, 24
Guérou, A., Krajnovi´c, D., Epinat, B., et al. 2017,A&A, 608, A5
Habas, R., Marleau, F. R., Duc, P.-A., et al. 2020,MNRAS, 491, 1901
Haghi, H., Kroupa, P., Banik, I., et al. 2019,MNRAS, 487, 2441
Haslbauer, M., Banik, I., Kroupa, P., & Grishunin, K. 2019,MNRAS, 489, 2634
Hayashi, K., & Inoue, S. 2018,MNRAS, 481, L59
Horne, K. 1986,PASP, 98, 609
Humphrey, P. J. 2009,ApJ, 690, 512
Islam, T., & Dutta, K. 2019,Phys. Rev. D, 100, 104049
Kirby, E. N., Bullock, J. S., Boylan-Kolchin, M., Kaplinghat, M., & Cohen, J. G. 2014,MNRAS, 439, 1015
Kroupa, P. 2012,PASA, 29, 395
Kroupa, P., Haghi, H., Javanmardi, B., et al. 2018,Nature, 561, E4
Laporte, C. F. P., Agnello, A., & Navarro, J. F. 2019,MNRAS, 484, 245
Lelli, F., McGaugh, S. S., & Schombert, J. M. 2016,AJ, 152, 157
Lelli, F., McGaugh, S. S., Schombert, J. M., & Pawlowski, M. S. 2017,ApJ, 836, 152
Lewis, G. F., Brewer, B. J., & Wan, Z. 2020,MNRAS, 491, L1
Lim, S., Peng, E. W., Duc, P.-A., et al. 2017,ApJ, 835, 123
Lupton, R. 2005, Transformations Between SDSS Magnitudes and Other Systems, https://www.sdss3.org/dr10/algorithms/ sdssUBVRITransform.php/
Mahdavi, A., Trentham, N., & Tully, R. B. 2005,AJ, 130, 1502
Mancera Piña, P. E., Fraternali, F., Adams, E. A. K., et al. 2019,ApJ, 883, L33
Martin, N. F., Collins, M. L. M., Longeard, N., & Tollerud, E. 2018,ApJ, 859, L5
Mateo, M., Olszewski, E., Welch, D. L., Fischer, P., & Kunkel, W. 1991,AJ, 102, 914
McConnachie, A. W. 2012,AJ, 144, 4
Milgrom, M. 1983,ApJ, 270, 365
Milgrom, M. 2015,MNRAS, 454, 3810
Moffat, J. W., & Toth, V. T. 2019,MNRAS, 482, L1
Monelli, M., & Trujillo, I. 2019,ApJ, 880, L11
Müller, O., Famaey, B., & Zhao, H. 2019a,A&A, 623, A36
Müller, O., Rich, R. M., Román, J., et al. 2019b,A&A, 624, L6
Müller, O., Rejkuba, M., Pawlowski, M. S., et al. 2019c,A&A, 629, A18
Nusser, A. 2020,ApJ, 893, 66
Ogiya, G. 2018,MNRAS, 480, L106
Prole, D. J., Hilker, M., van der Burg, R. F. J., et al. 2019,MNRAS, 484, 4865
Rejkuba, M. 2012,Ap&SS, 341, 195
Ruiz-Lara, T., Trujillo, I., Beasley, M. A., et al. 2019,MNRAS, 486, 5670
Sales, L. V., Navarro, J. F., Peñafiel, L., et al. 2020,MNRAS, 494, 1848
Sánchez-Janssen, R., Puzia, T. H., Ferrarese, L., et al. 2019,MNRAS, 486, L1
Sandage, A., & Binggeli, B. 1984,AJ, 89, 919
Silk, J. 2019,MNRAS, 488, L24
Soto, K. T., Lilly, S. J., Bacon, R., Richard, J., & Conseil, S. 2016,MNRAS, 458, 3210
Toloba, E., Lim, S., Peng, E., et al. 2018,ApJ, 856, L31
Trujillo, I., Beasley, M. A., Borlaff, A., et al. 2019,MNRAS, 486, 1192
VandenBerg, D. A., Brogaard, K., Leaman, R., & Casagrande, L. 2013,ApJ, 775, 134
van der Burg, R. F. J., Muzzin, A., & Hoekstra, H. 2016,A&A, 590, A20
van Dokkum, P. G., Abraham, R., Merritt, A., et al. 2015,ApJ, 798, L45
van Dokkum, P., Danieli, S., Cohen, Y., et al. 2018,Nature, 555, 629
van Dokkum, P., Danieli, S., Abraham, R., Conroy, C., & Romanowsky, A. J. 2019,ApJ, 874, L5
Vazdekis, A., Koleva, M., Ricciardelli, E., Röck, B., & Falcón-Barroso, J. 2016,
MNRAS, 463, 3409
Walker, M. G., Mateo, M., Olszewski, E. W., et al. 2009,ApJ, 704, 1274
Wasserman, A., van Dokkum, P., Romanowsky, A. J., et al. 2019,ApJ, 885, 155
Weilbacher, P. M., Palsa, R., Streicher, O., et al. 2020, A&A, in press,https: //doi.org/10.1051/0004-6361/202037855
Wolf, J., Martinez, G. D., Bullock, J. S., et al. 2010,MNRAS, 406, 1220