HAL Id: hal-02989657
https://hal.archives-ouvertes.fr/hal-02989657
Submitted on 5 Nov 2020HAL is a multi-disciplinary open access
archive for the deposit and dissemination of sci-entific research documents, whether they are pub-lished or not. The documents may come from teaching and research institutions in France or abroad, or from public or private research centers.
L’archive ouverte pluridisciplinaire HAL, est destinée au dépôt et à la diffusion de documents scientifiques de niveau recherche, publiés ou non, émanant des établissements d’enseignement et de recherche français ou étrangers, des laboratoires publics ou privés.
Synthesis and Characterization of Double Solid Solution
(Zr,Ti) 2 (Al,Sn)C MAX Phase Ceramics
Bensu Tunca, Thomas Lapauw, Rémi Delville, Daniel Neuville, Louis Hennet,
Dominique Thiaudière, Thierry Ouisse, Joke Hadermann, Jozef Vleugels,
Konstantina Lambrinou
To cite this version:
Bensu Tunca, Thomas Lapauw, Rémi Delville, Daniel Neuville, Louis Hennet, et al.. Synthesis and Characterization of Double Solid Solution (Zr,Ti) 2 (Al,Sn)C MAX Phase Ceramics. Inorganic Chem-istry, American Chemical Society, 2019, 58 (10), pp.6669-6683. �10.1021/acs.inorgchem.9b00065�. �hal-02989657�
1
Synthesis and characterization of double solid
solution (Zr,Ti)
2
(Al,Sn)C MAX phase ceramics
Bensu Tuncaa,b,*, Thomas Lapauwb, Rémi Delvillea, Daniel R. Neuvillec, Louis Hennetd,
Dominique Thiaudièree, Thierry Ouissef, Joke Hadermanng, Jozef Vleugelsb and Konstantina
Lambrinoua,h
a
SCK•CEN, Boeretang 200, B2400 Mol, Belgium
b
KU Leuven, Department of Materials Engineering, Kasteelpark Arenberg 44, B-3001 Leuven, Belgium
c
Géomatériaux, Institut de Physique de Globe de Paris, CNRS-USPC, 75005 Paris, France
d
CNRS-CEMHTI, Université d'Orléans, 45071 Orléans, France
e
Synchrotron SOLEIL, L'Orme des Merisiers, Saint-Aubin, 91192 Gif-sur-Yvette, France
f
Université Grenoble-Alpes, CNRS, Grenoble INP, LMGP, F-38000 Grenoble, France
g
University of Antwerp, Department of Physics, Electron Microscopy for Materials Research (EMAT), Groenenborgerlaan 171, B-2020 Antwerp, Belgium
h
Centre for Electron Microscopy and Materials Analysis (EMMA), University of Huddersfield, United Kingdom
Keywords
MAX Phases, Double Solid Solutions, CTE, Lattice Distortions, XRD
2
Quasi phase-pure (>98 wt%) MAX phase solid solution ceramics with the (Zr,Ti)2(Al0.5,Sn0.5)C stoichiometry and variable Zr/Ti ratios were synthesized by both
reactive hot pressing and pressureless sintering of ZrH2, TiH2, Al, Sn, and C powder mixtures.
The influence of the different processing parameters, such as applied pressure and sintering atmosphere, on phase purity and microstructure of the produced ceramics was investigated. The addition of Sn to the (Zr,Ti)2AlC system was the key to achieve phase purity. Its effect on
the crystal structure of a 211-type MAX phase was assessed by calculating the distortions of the octahedral M6C and trigonal M6A prisms due to steric effects. The M6A prismatic
distortion values were found to be smaller for Sn containing double solid solutions compared to the (Zr,Ti)2AlC MAX phases. The coefficient of thermal expansion along the <a> and <c>
directions was measured by means of Rietveld refinement of high-temperature synchrotron X-ray diffraction data of (Zr1-x,Tix)2(Al0.5,Sn0.5)C MAX phase solid solutions with x = 0, 0.3, 0.7
and 1. The thermal expansion coefficient data of the Ti2(Al0.5,Sn0.5)C solid solution were
compared with those of the Ti2AlC and Ti2SnC ternary compounds. The thermal expansion
anisotropy increased in the (Zr,Ti)2(Al0.5,Sn0.5)C double solid solution MAX phases as
compared to the Zr2(Al0.5,Sn0.5)C and Ti2(Al0.5,Sn0.5)C end-members.
1. Introduction
The MAX phases are an intriguing class of ceramics with metallic-like properties that stem from their nanolaminated crystal structure consisting of M6X octahedra interleaved with
atomic A layers. The MAX phases have the Mn+1AXn general stoichiometry, with n = 1
(211-type), 2 (312-(211-type), or 3 (413-type). The M element corresponds to an early transition metal, A is a group 12-16 element, and X can be either C or N. They are good electrical and thermal conductors, damage tolerant, and machineable like most metals. Some MAX phases are also characterized by an excellent resistance to corrosion, and oxidation and good high-temperature mechanical properties like many ceramics.1 There are currently around 70
3
different ternary MAX phases, while the MAX phase family continues to expand steadily either by the discovery of new ternary compounds or the synthesis of higher-order solid solutions.
The synthesis of MAX phase solid solutions allows tailoring of the produced material properties according to the needs of the end application. Substituting M, A and/or X with other elements not only leads to new MAX phases with improved oxidation,2–6 fracture toughness,7,8 strength,4,7 and self-healing properties,3,9 but also to new ordered structures. Experimental and/or theoretical work on solid solutions revealed the existence of out-of-plane chemically ordered MAX (o-MAX) phases with the (M1/3,M´2/3)3AX2 (312) stoichiometry,
such as (Mo2/3,Ti1/3)3AlC2,10,11 (Cr2/3,Ti1/3)3AlC2,12–15 (Ti2/3,Zr1/3)3AlC2,16 (Mo2/3Sc1/3)3AlC2,17
and (Cr1/2,V1/2)3AlC,18 as well as (M1/2,M´1/2)4AX3 (413) compositions, such as
(Mo1/2,Ti1/2)4AlC3,11 (Cr0.5,V0.5)4AlC3,18 and (Zr1/2,Ti1/2)4AlC3.16 In addition to out-of-plane
ordering, in-plane-ordered MAX phases (i-MAX) with the (M1/3,M´2/3)2AlC stoichiometry
were recently discovered, such as (Cr2/3,Sc1/3)2AlC,21 (Cr2/3,Y1/3)2AlC,19 (Cr2/3,Zr1/3)2AlC,20
and (Mo2/3,Sc1/3)2AlC.21
Due to their remarkable properties and versatility ** I don’t understand what you want mean by versatility? , the MAX phases are considered for nuclear fuel cladding applications, both for Gen-II/III light water reactors (LWRs) and Gen-IV lead-cooled fast reactors (LFRs). The consideration of the MAX phases for nuclear fuel cladding applications excludes the use of elements with a large neutron cross-section (e.g., Hf, Ta, Mo, Cd, etc.) and focuses on the possible use of elements with small neutron cross-section, such as zirconium (Zr). Moreover, material synthesis should take into account the radiotoxicity of the nuclear waste that must unavoidably be treated/stored at the end of the fuel cycle; therefore, only MAX phase carbides and their solid solutions have so far been considered for fuel cladding applications, as the neutron irradiation of nitrogen (N) generates the long-lived 14C isotope. Another important
4
consideration with respect to MAX phase synthesis for the nuclear sector is phase purity, so as to mitigate in-service material disintegration due to anisotropic irradiation swelling and/or coefficient of thermal expansion (CTE) mismatch between constituent phases.
High phase purity is also crucial for the determination of the intrinsic properties of the MAX phase ceramics. In earlier work, (Zr,Ti)3AlC2 and (Zr,Ti)2AlC solid solution MAX phases
were produced with the aim of improving the oxidation resistance of Zrn+1AlCn MAX
phases.16,22,23 Unfortunately, these solid solution MAX phases had large amounts of secondary phases, similar to the MAX phases produced in the Zr-Al-C system, whereby 67 wt% Zr2AlC
was accompanied by 33 wt% ZrCx and 61 wt% Zr3AlC2 was accompanied by 31 wt% ZrCx
and 8 wt% Al2Zr.22,23 Phase-pure Ti-Al-C based MAX phases, on the other hand, have already
been reported in literature.24–26
Recent work by Lapauw et al. illustrated the improvement of phase purity of Zr2AlC-based
ceramics by partially substituting Zr with Nb and Al with Sn; the produced double 211-type MAX phases solid solutions had the (Zr0.8,Nb0.2)2(Al0.5,Sn0.5)C stoichiometry and contained
no rock-salt-like (Nb,Zr)C carbides.27 These authors associated phase purity with the modification of crystal lattice distortions, due to the creation of solid solutions on both M and A sites in the Mn+1AXn phase compounds. They showed that both Nb and Sn additions
decreased the prismatic distortions in the crystal lattice, while the Sn addition increased the octahedral distortion. This steric approach proposed the minimization of the MAX phase lattice distortions by selecting similar-sized M and A atoms, thereby increasing the phase purity of the produced MAX phase ceramics.
The present work investigated the effect of the partial substitution of Al by Sn in the
(Zr,Ti)2AlC MAX phase solid solution. This approach produced quasi phase-pure
(Zr,Ti)2(Al,Sn)C double solid solution MAX phase-based ceramics. The present work also
5
on phase purity. The resulting microstructure and crystal structure changes of the constituent phases were characterized and their CTEs were measured. The CTE values along <a> and <c> directions were compared with those of Ti2AlC28–30 and Ti2SnC. Since no CTEa and
CTEc data were available on the Ti2SnC compound, they were measured on powders from
milled Ti2SnC single crystals.
2. Experimental Section 2.1. Material Synthesis
ZrH2 (<6 μm, >99% purity, grade G, Chemetall, Germany), TiH2 (<8 μm, >99% purity, grade
V/M, Chemetall, Germany), Al (<5 μm, >99% purity, AEE, United States), Sn (< 5 µm, >99% purity, AEE, United States) and C (<5 μm, >99% purity, Asbury Graphite Mills, United States) powders were used as starting materials for MAX phase synthesis. Specifically, the 211 stoichiometry was targeted in this study, with a (Zr,Ti):(Al,Sn):C starting powder ratio of 2:1.1:0.95. The excess Al was intended to compensate for the partial loss of molten Al during heating (i.e., Tm(Al) 660C). The sub-stoichiometric C content was
required to compensate for the inward diffusion of C from the graphite die/punch setup during sintering.
The powders were dry mixed in a multidirectional mixer (Turbula type) in polyethylene bottles at 75 rpm for 48 h. Reactive hot pressing (RHP, W100/150-2200-50 LAX, FCT Systeme, Frankenblick, Germany) in vacuum (10 Pa) was used as reference sintering technology. In addition, four different production routes were studied mainly to investigate their effect on phase purity, crystal structure changes, and lattice distortions. These routes differed in applied pressure (either during cold compaction, CC, or during sintering) and/or the sintering atmosphere, as summarised in Table 1. The nomenclature used throughout the text to refer to the different processing routes were: ‘RHP’ for ceramics produced by Reactive
6
Hot Pressing, RHP, in vacuum, ‘Ar’ for ceramics pressurelessly sintered in high-temperature furnace (LINN-1800HT, LINN, Eschenfelden, Germany) under flowing argon (Ar, >99.998% purity, ppm H2O, ppm O), and ‘CIP’ for ceramics Cold Isostatically Pressed (CIP,
EPSI, Temse, Belgium).
All sintering routes used a heating rate of 25°C/min, a target temperature of 1450°C and a dwell time of 30 minutes. The dimensions of the ceramics products were: 30 mm, height
5 mm for the RHP ceramics, and 10 mm, height 5 mm for the CIP ceramics. Since an earlier study16 revealed relatively large quantities ( 60 wt%) of (Zr,Ti)2AlC phase for a Zr:Ti
ratio of 30:70, this Zr:Ti ratio was initially kept constant to assess the influence of the Al:Sn ratio, which varied from 100:0, 90:10, 80:20 to 50:50 for the RHP0 route. An additional set of exploratory samples with a fixed Al:Sn ratio of 90:10 (relatively minor Sn addition) was produced by RHP6/30 with Zr:Ti ratios of 100:0, 80:20, 50:50 and 70:30, and was later used to study the gradual change in lattice distortions as function of the Sn content. Powder batches with a 50:50 Al:Sn ratio, M:A:C ratio of 2:1.1:0.95, and Zr:Ti ratios of 100:0, 70:30, 50:50, 30:70, 0:100 were reactive sintered according to the RHP6/30 and RHP30 routes. Additionally, Zr:Ti ratios of 10:90 and 90:10 were pressurelessly sintered (RHP0, CIP/RHP/0 and CIP/Ar/0), as summarised in Table 2.
Table 1. Processing routes used for (Zr,Ti)2(Al,Sn)C MAX phase synthesis in this work. All
ceramics were sintered at 1450°C for 30 min; P = pressure.
Route Uniaxial CC (Mpa) CIP (Mpa) Sintering Atmosphere P During Heating (Mpa) P During Dwell (Mpa) Pressure-assisted RHP6/30 30 / vacuum 6 30 RHP30 30 / vacuum 0 30
7 sintering Pressureless sintering RHP0 30 / vacuum 0 0 CIP/RHP/0 / 200 vacuum 0 0 CIP/Ar/0 / 200 Argon 0 0
Single-phase Ti2SnC was synthesized as follows: first, single-crystal flakes were grown in a
high-temperature solution, whereby Sn and Ti with equal atomic concentrations (Sn:Ti = 1:1) were heated to 1800°C in a closed graphite crucible in an Ar atmosphere. Carbon was provided by high-temperature crucible wall dissolution. After 2 h at 1800°C, the crucible was slowly cooled to 1000°C in 5 days, before stopping the induction heating. Crystals with surface area up to 1 cm2 were extracted from the solidified flux by etching the latter in highly concentrated HCl. Powder was obtained by ball milling the Ti2SnC crystals.
2.2. Characterization
Phase identification was performed by X-ray diffraction (XRD) in the 5-75° 2θ range with a step size of 0.02° and a time of 0.2 s per step, using Cu Kα radiation at 30 kV and 10 mA in a
Bragg Brentano geometry (X-Ray diffractometer, Bruker D2 Phaser, BRUKER). Measurements were directly performed on the top surface of the ceramic disks, after grinding off the outer carbide layer. The XRD patterns were subjected to Rietveld refinement using the Materials Analysis Using Diffraction (MAUD) software.31
Density measurements were done based on the Archimedes principle. Lacquer was used to seal open porosity, thus preventing water penetration into the pores of the produced ceramics. For microstructural characterization, top surfaces of the samples were polished and examined by scanning electron microscopy (SEM, Nova NanoSEM 450, FEI), using backscattered and secondary electron imaging. Electron backscattered diffraction (EBSD) measurements were performed to investigate the effect of applied pressure during sintering on the texture of the
8
produced ceramics (Nova NanoLab 600 DualBeam, FEI, FIB/SEM equipped with an EBSD detector). The chemical composition of the constituent phases was determined by energy dispersive X-ray spectroscopy (EDS) both in the SEM and the transmission electron microscope (TEM). TEM samples were prepared using a focused ion beam (FIB, Nova NanoLab 600 DualBeam, FEI), using 30 kV Ga ions for milling and 5 kV Ga ions for cleaning. TEM examination was done on a JEOL ARM200F Cs-corrected scanning transmission electron microscope (S/TEM), using selected area diffraction patterns (SAED). For measuring the CTE of the produced ceramics, high-temperature transmission XRD measurements were done in the DIFFABS beam line at SOLEIL Synchrotron (Paris, France). Measurements on (Zr1-x,Tix)2(Al0.5,Sn0.5)C with x = 0, 0.3, 0.5, 0.7, 1 were done on ceramics
that were pressurelessly sintered in vacuum in the hot press (RHP0 in Table 1). These sintered MAX phase ceramics were crushed manually in a mortar and loaded into a 0.5 mm hole pierced in the central flattened section of a 1 mm PtRh10% heating wire.32 The confinement of a small powder quantity in such small hole ensures temperature homogeneity. The heating rate was adjusted by manually controlling the current flowing through the Pt wire; the current was calibrated with respect to the corresponding temperature in accordance to a calibration procedure using melting standards. This allowed for measuring in the transmission mode using a focused monochromatic parallel X-ray beam with energy of 17 keV and a wavelength of 0.72932 Å. The diffracted signal was collected with a 2D XPAD detector in the 5-45° 2θ range. A high-purity Ar gas flow prevented excessive oxidation during heating. Measurements were collected from room temperature up to 1500°C in steps of 100°C and at a heating rate of 100°C/min. The powder remained 2 min at each target temperature for data collection. The XRD patterns were subjected to Rietveld refinement using MAUD software.
9
High-temperature XRD measurements for the determination of the CTE of Ti2SnC were
performed on a Rigaku Smartlab setup equipped with an Anton Paar DHS1100 chamber with a graphite dome. XRD measurements were carried out under nitrogen (N2) atmosphere in a
Bragg-Brentano geometry with a 1D detector with Cu and Cu in the 10-150° 2θ range. All XRD patterns were refined using the MAUD software. The refined parameters included the lattice cell parameters a and c, zM (i.e., M element z coordinate in the M2AX unit
cell), atomic occupancies for the Zr/Ti and Al/Sn sites, scale parameters and microstrain parameters using the Popa rules33. Powder diffraction simulations were done by the
POWDERCELL software.34
3. Results and Discussion
3.1. Synthesis of (Zr,Ti)2(Al0.5,Sn0.5)C MAX Phase Ceramics
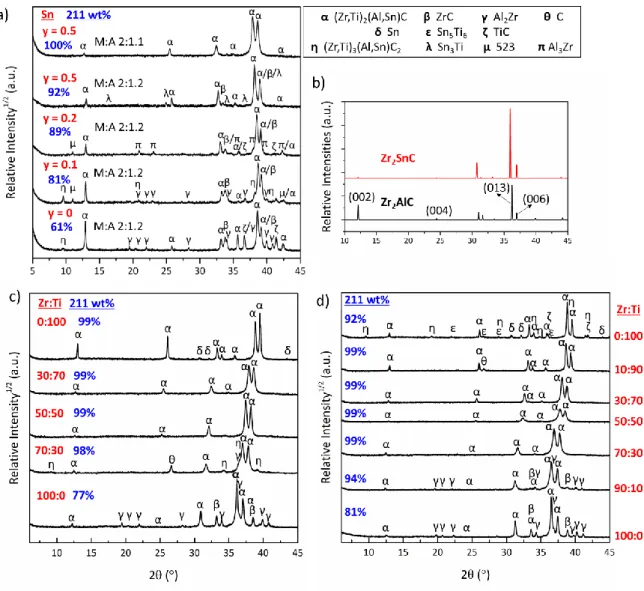
The influence of the Sn:Al content on the phase purity of (Zr,Ti)2(Al1-y,Sny)C ceramics was
initially investigated at a fixed Zr:Ti ratio of 30:70, using the RHP0 processing route. The XRD patterns of the produced (Zr0.3,Ti0.7)2(Al1-y,Sny)C ceramics are presented as a function of
the Sn content, y, in Figure 1a. Upon increasing the Sn content from y = 0 to 0.5, the content of the competing (Zr,Ti)C carbide and Al-Zr intermetallics, such as Al2Zr and Al3Zr,
significantly decreased from 39 to 8 wt% for a (Zr,Ti):(Al,Sn):C starting powder stoichiometry of 2:1.2:0.95. Decreasing the content of A elements in the starting powder to 2:1.1:0.95 reduced the fraction of intermetallics below the XRD detection level. Due to the partial substitution of Al by Sn, the characteristic (002) and (004) MAX phase peaks lost most of their intensity, as illustrated by the theoretical powder diffraction simulation of the Zr2AlC
and Zr2SnC in Figure 1b.
With a fixed Sn content (y = 0.5) and overall (Zr,Ti):(Al,Sn):C starting powder stoichiometry of 2:1.1:0.95, 211 MAX phases with various Zr:Ti ratios were successfully synthesized via all
10
five investigated synthesis routes (Table 1). Figure 1c and 1d show representative XRD patterns of (Zr,Ti)2(Al0.5,Sn0.5)C ceramics sintered according to route RHP6/30 and RHP0,
respectively, as function of the Zr:Ti ratio.
Table 2 summarises the constituent phases of the (Zr,Ti)2(Al0.5,Sn0.5)C ceramics, which were
determined by XRD Rietveld refinements, as function of composition and synthesis route. For an accurate weight percentage analysis during Rietveld analysis, EDS elemental analysis data from specific phases were used as input for the Zr:Ti and Al:Sn atomic occupancy. The occupancy refinements for the 211 phases hardly deviated from these input values, confirming the overall chemistry of the identified phases. The competing carbide and intermetallic phases showed a limited substitutional solubility for the Zr/Ti and Al/Sn pairs, but the exact compositions of these phases were not studied in detail. However, little or no elemental substitution occurred in the most abundant, competing intermetallic phase Al2Zr, since its
lattice parameters were in agreement with literature data35 and the EDS elemental maps (Figure 2) did not detect significant amounts of Sn and/or Ti. The wt% error in the reported phase assemblies is estimated to be 1 wt%.
11
Figure 1. (a) XRD patterns of the (Zr0.3,Ti0.7)2(Al1-y,Sny)C with variable Sn content, y. (b)
Simulated powder XRD patterns of Zr2AlC and Zr2SnC.22,36 XRD patterns of ceramics with
variable Zr:Ti ratio synthesised by the RHP6/30 (c) and RHP0 (d) processing routes. The 211 MAX phase content, as obtained by Rietveld refinements, is indicated by blue characters.
Note that the detection limit of the XRD technology is around 1-2 wt%. The SEM investigation of produced ceramics indicated as phase-pure by XRD, on the other hand, revealed minor amounts of intermetallics, such as Al2Zr, as well as Al2O3. Image thresholding
12
they were embedded as inclusions in the MAX phase ceramic matrix (see Figure 2 and Figure 3). Table 2 shows the phase assembly as determined by XRD/Rietveld analysis.
Table 2. Constituent phases of the (Zr,Ti)2(Al0.5,Sn0.5)C ceramics as function of composition
and synthesis route. Phase assembly determined by XRD Rietveld analysis, where the error in the refined weight percentages is estimated to be 1 wt%. Ceramics with a proportion of the 211 phase wt% content 90% are highlighted using bold characters; t.a. = trace amount.
All five processing routes allowed synthesizing 211 phase rich ceramics in the Zr-Ti-Al-Sn-C system. Zr2(Al0.5,Sn0.5)C proved to be the most challenging phase to produce with high purity,
Ti at% 211 Binary Carbide Intermetallic Others
Uniaxial Cold Pressing 0 77 ZrC (8) Al2Zr (15)
30 98 Al2Zr (t.a.) 312 (2)
6 MPa during heating 50 >99 Al2Zr (t.a.) 30 MPa during dwell 70 >99
In vacuum 100 >99 Sn (t.a.)
0 66 ZrC (9) 312 (25)
Uniaxial Cold Pressing 30 98 Al3Zr2 (2)
50 >99 Al3Zr2 (t.a.) 30 MPa during dwell 70 >99
In vacuum 100 >99 Sn (t.a.)
0 81 ZrC (7) Al2Zr (12)
10 94 ZrC (2) Al2Zr (4)
Uniaxial Cold Pressing 30 99 Al2Zr (t.a.)
50 >99
In vacuum 70 >99
90 >99
100 92 TiC (4) Ti2Sn (t.a.) 312 (2), Sn (2)
0 85 ZrC (10) Al2Zr (4), Al3Zr2 (t.a.), Sn3Ti5 (t.a.) Cold isostatic pressing 10 92 ZrC (8)
30 96 ZrC (2) Ti2Sn (2)
50 98 ZrC (1), TiC (t.a.) Ti2Sn (t.a.)
In vacuum 70 97 TiC (2) Ti2Sn (t.a.)
90 95 TiC (5)
100 68 TiC (10) 312 (22)
0 64 ZrC (9) Al2Zr (2), SnZr3 (t.a.) Al2O3 (18), ZrO2 (7) Cold isostatic pressing 10 84 ZrC (5), TiC (2) Al2Zr (7), Ti2Sn (2)
30 90 ZrC (3), TiC (t.a.) Ti2Sn (t.a.) 312 (2), Sn (5) 50 84 TiC (3), ZrC (t.a.) Al3Zr2 (2) Sn (10)
In Argon 70 86 TiC (3) Ti2Sn (t.a.) 312 (t.a.), Sn (8)
90 89 TiC (3) Ti2Sn (t.a.), Sn3Ti5 (t.a.) 312 (2), Sn (3)
100 98 Ti2Sn (t.a.) 312 (t.a.) CIP/RHP/0 CIP/Ar/0 Phase distribution (wt%) Method RHP6/30 RHP30 RHP0
13
with a maximum yield of 85 wt% in the CIP/RHP/0 route, with about 10 wt% ZrC, 4 wt% Al2Zr and trace amounts of other intermetallics. It might be possible to further optimise the
phase content by changing the synthesis temperature and dwell time, which were kept constant in this work. With Ti addition up to a Zr:Ti ratio of 50:50, phase purity significantly improved to reach 98 wt% for all RHP routes. The occasional intermetallics and Al2O3
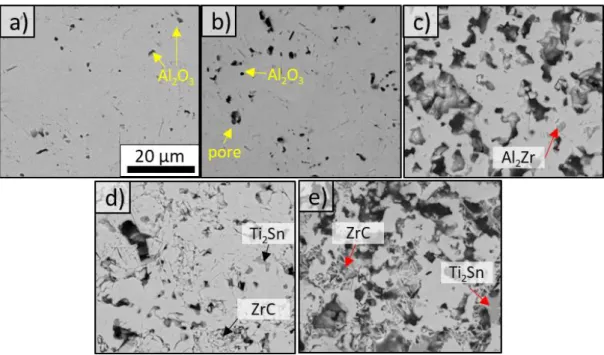
phases observed by SEM and TEM in the near fully dense ceramics (Figure 2, Figure 3a and 3b) were found to be present at the triple junctions or as thin layers in-between the MAX phase grains.
Figure 2. TEM/EDS elemental maps of RHP6/30 (Zr0.5,Ti0.5)2(Al0.5,Sn0.5)C ceramics showing
14
Figure 3. Backscattered SEM images of the porosity in (Zr0.7,Ti0.3)2(Al0.5,Sn0.5)C ceramics as
function of the processing route: (a) RHP6/30, (b) RHP30, (c) RHP0, (d) CIP/RHP/0 and (e) CIP/Ar/0.
The phase purity of the ceramics sintered in vacuum (RHP) was hardly influenced by the selected pressure and loading conditions, indicating that the synthesis of near phase-pure MAX phase ceramics in the (Zr,Ti)2(Al,Sn)C system is relatively straightforward.
CIPed ceramics always contained up to 10 wt% of binary carbides, the formation of which was not observed in the other processing routes, except for the Zr2(Al0.5,Sn0.5)C and
Ti2(Al0.5,Sn0.5)C end-members This might be due to the higher compaction pressure during
CIP that results in a better contact between the carbon and hydrides, limiting the interdiffusivity of molten Al and resulting in more binary carbides. The ceramics sintered in Ar had a substantially lower phase purity than their vacuum-sintered counterparts, except for the Ti2(Al0.5,Sn0.5)C composition. This could be attributed to the fact that the Ar trapped in the
closed porosity affected the elemental diffusion required for MAX phase formation; this hypothesis is supported by the large isolated bubbles/pores ( 40-80 μm) observed in these
15
ceramics. Moreover, approximately 18 wt% Al2O3 and 7 wt% ZrO2 (monoclinic) were found
in the Zr2(Al0.5,Sn0.5)1.1C0.95 starting powder mixture sintered under Ar flow, indicating that
this powder acted as a getter for the oxygen impurities (< 2 ppm) in Ar.
In ceramics containing larger amounts of the Al2Zr phase, such as the Zr2(Al0.5,Sn0.5)C
ceramic produced by RHP0, the Al:Sn occupancy in the MAX phase differed from the initial 50:50 ratio resulting in more Sn-rich (Al:Sn 33:67) 211 phases. In ceramics containing both Zr and Ti, the 211 phases had slightly more Ti than the theoretically targeted value, due to the formation of Al2Zr or ZrC. In general, increasing the Zr content formed more Al2Zr, thereby
incorporating more Sn in the MAX phase structure. EDS point analyses performed on the produced ceramics showed that the Zr:Ti and Al:Zr ratios in the initial powder mixtures were preserved in the sintered MAX phase ceramics. This is shown in Table 3 for ceramics synthesised according to the RHP0 processing route.
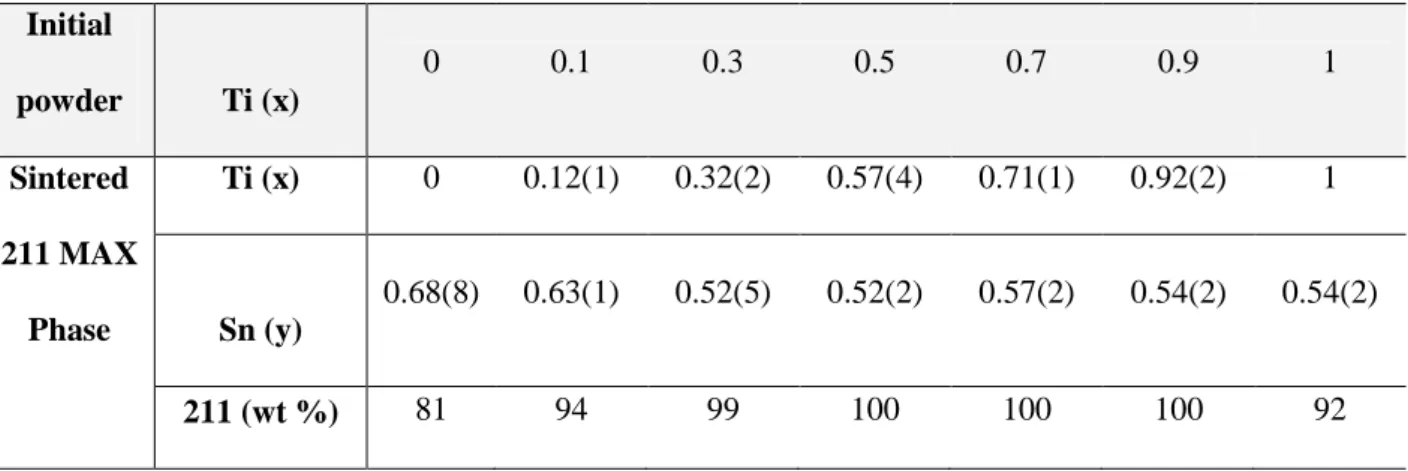
Table 3. EDS analyses showing the Ti and Sn content in sintered RHP0 (Zr1-x,Tix)2(Al
1-y,Sny)C ceramics. The data are tabulated according to the Ti content, x, in the (Zr
1-x,Tix)2(Al0.5,Sn0.5)C starting powder mixture. Errors in the refined weight percentages are 1
wt%. Initial powder Ti (x) 0 0.1 0.3 0.5 0.7 0.9 1 Sintered 211 MAX Phase Ti (x) 0 0.12(1) 0.32(2) 0.57(4) 0.71(1) 0.92(2) 1 Sn (y) 0.68(8) 0.63(1) 0.52(5) 0.52(2) 0.57(2) 0.54(2) 0.54(2) 211 (wt %) 81 94 99 100 100 100 92
16
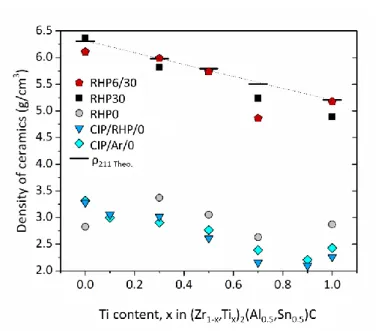
Density data of sintered (Zr1-x,Tix)2(Al0.5,Sn0.5)C ceramics as function of composition and
processing route are plotted in Figure 4 along with the theoretical density of the 211 compounds. All RHP6/30 and RHP0/30 grades were nearly fully dense, although limited residual porosity was observed by SEM in some ceramics, such as the one with xTi = 0.3
produced by RHP30. Ceramics with xTi = 0.7 grades had, for some unknown reason, a higher
porosity. The RHP0, CIP/RHP/0 and CIP/Ar/0 grades had an open porosity of 40-53%, due to the fact that no pressure was applied during sintering. The density of these pressurelessly sintered grades were similar, with RHP0 being slightly higher than the other grades, except for the xTi = 0 ceramic that contained a considerable amount of the lighter ZrC and Al2Zr
phases. SEM was used to correlate porosity with the processing route study on metallographic cross-sections of (Zr0.7,Ti0.3)2(Al0.5,Sn0.5)C ceramics (Figure 3).
Figure 4. Density of sintered (Zr(1-x),Tix)2(Al0.5,Sn0.5)C ceramics as function of composition
and processing route. The dashed line and horizontal markers represent the theoretical density of the 211 compounds.
17
The crystal structure of the new MAX phase solid solution was confirmed by TEM on RHP6/30 (Zr0.5,Ti0.5)2(Al0.5,Sn0.5)C. The SAED patterns in Figure 5 show the [ ] and
[1 ] zone axes of 211 MAX phase grains.
Figure 5. SAED patterns corresponding to the [ ] (a) and [1 ] (b) zone axes of a RHP6/30 (Zr0.5,Ti0.5)2(Al0.5,Sn0.5)C grain.
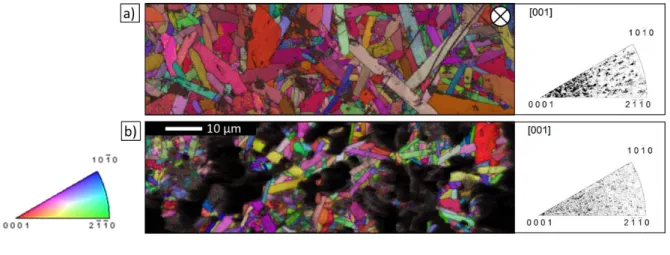
In terms of microstructure, pressure-assisted sintering resulted in elongated 211 MAX phase lamellae with preferential basal texture. In the pressurelessly sintered ceramics, 211 grains with random orientation were observed, as expected and confirmed by EBSD. The effect of the applied pressure on the texture in the produced ceramics is illustrated in Figure 6, which compares the EBSD orientation maps and inverse pole figures of RHP30 and RHP0 (Zr0.7,Ti0.3)2(Al0.5,Sn0.5)C ceramics. EBSD maps were collected from the top surfaces of the
ceramic discs; this surfaces were subjected to compressive stresses during processing (i.e., during cold compaction and/or sintering). The dense RHP30 ceramic had a stronger basal texture than the porous RHP0 one, with basal planes aligned parallel to the top disc surface.
18
Figure 6. EBSD grain orientation maps and corresponding inverse pole figures of (Zr0.7,Ti0.3)2(Al0.5,Sn0.5)C ceramics produced by (a) RHP30 (pressure applied perpendicular to
the surface marked by ) and (b) RHP0.
3.2. Lattice Parameters and Compliance with Vegard’s Law
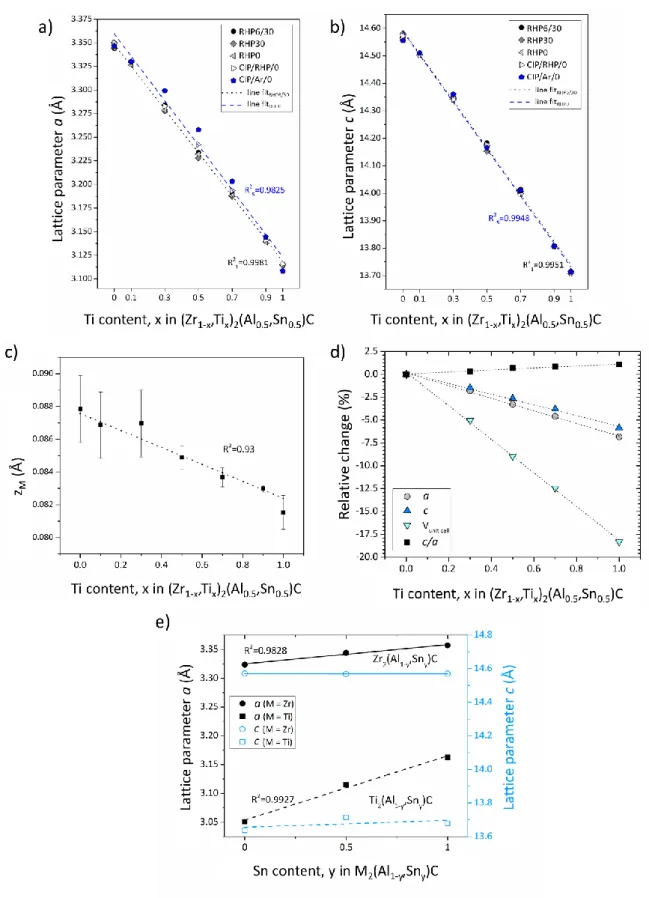
The lattice parameters a and c of (Zr1-x,Tix)2(Al0.5,Sn0.5)C ceramics, which were obtained by
Rietveld refinement as function of the Ti content, x, are plotted in Figure 7 (all numerical data are provided in Table S1 of the supporting information). The uncertainty in lattice parameter determination is estimated to be in the order of 10-4 Å. The lattice parameters evolve linearly as function of the Ti content, according to Vegard’s law for solid solutions; this holds for all synthesis routes, as shown in Figure 7a and 7b. The relative changes in the lattice parameters, c/a ratio, and unit cell volume of ceramics evolve linearly as function of the Ti content, as shown for the (Zr1-x,Tix)2(Al0.5,Sn0.5)C ceramics sintered via RHP6/30 in the
Figure 7d. The change in average relative z-coordinate of the M-atom in the 211 structure, i.e., the zM parameter, is shown in Figure 7c, also following Vegard’s law over the full
compositional range, except from a slight deviation at the Ti content of x = 0.3. The lattice parameter evolution of the end-members as function of the Sn:Al ratio is presented in Figure
19
7e. Data for the ternary MAX phases (y = 0 and 1) were taken from literature,22,28,37,38 whereas the data for the M2(Al1-y,Sny)C phases with y = 0.5 were measured experimentally.
Although the a lattice parameter changes with varying the Al:Sn ratio, the c lattice parameter hardly changes.
Overall, the lattice parameters of the double solid solution MAX phases synthesized in this work follow Vegard’s law for solid solutions, confirming that Zr and Al can be simultaneously substituted by Ti and Sn. This is no surprise, since (Zr,Ti)2AlC, Ti2(Al,Sn)C
and Zr2(Al,Sn)C MAX phases have been produced before.3,16,39 A linear evolution in lattice
parameters was observed, irrespective of the processing route (i.e., in both pressureless and pressure-assisted sintering). The lattice parameters, especially the a parameter, of the CIP/Ar/0 sintered ceramics produced with a starting powder Ti content of x = 0.3-0.7 appeared to slightly deviate from the other processing routes (see Figure 7a), which might be associated to slight variations in the Al:Sn and/or Zr:Ti ratios in these materials.
20
Figure 7. Lattice parameters a (a) and c (b) of (Zr1-x,Tix)2(Al0.5,Sn0.5)C as function of the
synthesis route. (c) Average relative z-coordinate values of the M-atom in the 211 structure, zM, for all processing routes. (d) Relative lattice parameter changes, c/a ratio, and unit cell
21
volume for RHP6/30 (Zr1-x,Tix)2(Al0.5,Sn0.5)C as function of the Ti content. (e) Lattice
parameters a and c as function of the Sn content, y, in the M2(Al1-y,Sny)C ceramics. The
values corresponding to ternary MAX phases (y = 0 and 1) were taken from literature.22,28,37,38,40
3.3. Lattice Distortions in (Zr1-x,Tix)2(Al0.5,Sn0.5)C MAX Phase Ceramics
The MAX phases are built by alternating M6X octahedra and M6A trigonal prisms. Using the
refined a, c and zM values (with uncertainties of 10-4 Å), the octahedron (Od)41 and trigonal
prism (Pd)1,42 distortions of the unit cells can be calculated. The ideal cubic MX octahedron of
rock salt structures is distorted in the Mn+1AXn phases; in fact, this octahedral distortion, Od,
can be calculated using the a, c and zM for the 211 MAX phase as follows:41
(1)
Similarly, the distortion of the M6A trigonal prisms in the 211 structure, Pd, can be calculated
from a, c and zM as follows:1,42
(2)
Ideally, both distortion values are 1 for close-packed spheres in a 211 structure with an ideal c/a ratio of 2√6 ≈ 4.89 and a canonical zM position of 1⁄12 ≈ 0.0833. When both Od and Pd
values are >1, the c axis is under compression. The a, c and zM values obtained by Rietveld
refinement analysis (see Figure 7 and Table S1 in the supporting information) were used to calculate the distortion values. Figure 8 is a plot of the measured and calculated Od, Pd values
and the Od/Pd ratio for the RHP6/30 and RHP0 (Zr1-x,Tix)2(Al0.5,Sn0.5)C grades as function of
the Ti content, x, along with literature values for the four parent ternary MAX phases (Ti2AlC, Ti2SnC, Zr2AlC and Zr2SnC), and experimental data on the (Zr,Ti)2AlC16 and
22
wt% phase purity (determined by XRD) produced in this study; in fact, these materials are also the only phase-pure ceramics ever produced in the Zr-Ti-Al-Sn-C system. All numerical values and literature data are presented in Figure S1 of the supporting information.
All calculated Od and Pd values were >1, indicating compression along the c axis. Ti2SnC had
the highest Ti6C Od distortion of 1.192, whereas Zr2AlC27 had the highest Zr6Al Pd distortion
of 1.101. These values agree with the available literature data.22,40 The Ti2SnC distortion
values found in literature were not experimentally determined but calculated,38,40,42 and were added to Figure 8 along with the values that were experimentally determined in this work. In general, increasing Ti (decreasing Zr) and increasing Sn (decreasing Al) increased Od. The
distortion data of the RHP6/30 and RHP0 (Zr,Ti)2(Al0.5,Sn0.5)C grades were comparable. The
Pd values evolved in the opposite manner, i.e., decreased with increasing both Ti and Sn, as
shown in Figure 8b. Substituting Zr by Ti in the (Zr1-x,Tix)2(Al1-y,Sny)C stoichiometry
increases Od and decreases Pd linearly with x. Similarly, substituting Al by Sn up to y = 0.5
increases Od and decreases Pd at constant x.
Figure 8. Lattice distortions Od (a), Pd (b) and Od/Pd ratio (c) for the RHP6/30 and RHP0
(Zr,Ti)2(Al0.5,Sn0.5)C grades as a function of the Ti content, x, along with literature reference
23
(Zr,Ti)2AlC16 and (Zr,Ti)2(Al0.9,Sn0.1)C grades. The green shaded areas represent the 211
ceramics with wt% phase purity produced in this study.
The green shaded areas corresponding to phase-pure MAX phases in Figure 8a and 8b are associated with lower Pd and higher Od values with an Od/Pd ratio very close to 1.00, as shown
in Figure 8c. As expected, the solid solution compositions that are located between the end-members have intermediate distortion values. Whereas Od is smaller in Zr- and Al-rich MAX
phases, Pd values are smaller in Ti- and Sn-rich compounds. It is worthwhile noting that the
lowest and highest values of the Od/Pd ratio belong to Zr2AlC and Ti2SnC, respectively
(Figure 8c). While the synthesis of Zr2AlC produced a ceramic with 33 wt% competing
phases (mainly ZrCx),22 Ti2SnC has been synthesized almost phase-pure.44,45 Ti2SnC is
typically accompanied by Sn minor inclusions that form preferentially at grain boundaries; in this study, Sn was observed at grain boundaries in Ti2(Al0.5,Sn0.5)C ceramics sintered at
1450°C. This sintering temperature is high for a Sn-containing MAX phase, considering that the melting point of Sn is very low (Tm(Sn) 232C) and previous studies reported Ti2SnC
decomposition to TiC and Sn at 1250°C.45 Some applications could benefit from a highly distorted (in Od) Ti2SnC with outward diffusing Sn, taking into account that Sn has been
reported to have crack self-healing properties in vacuum.46 Similarly, crack-healing SnO2 is
formed in air when kept at 800°C for 1 h.47 The green shaded area around Od/Pd 1 in Figure
8c ranges from Zr2SnC to Ti2AlC. These two ternary MAX phases can be produced
phase-pure, as reported in literature,28,48 while Zr2AlC with Od/Pd (low Od and high Pd) suffers
from the formation of a competing binary carbide,22 and Ti2SnC with Od/Pd (high Od and
low Pd) suffers from outward Sn diffusion and low-temperature degradation.44,45,49
Although the data discussed here only represent a small group of the MAX phase family in the Zr-Ti-Al-Sn-C system, it is clear that decreasing the prismatic distortion of the crystal
24
lattice by substituting Zr by Ti and Al by Sn could be used as a guide for the production of phase-pure 211 MAX phases. The findings of this work support fully the original work of Lapauw et al.,27 where the aforementioned guidelines were experimentally validated in the Zr-Nb-Al-Sn-C system.
3.4. Thermal Expansion Coefficients (CTEs)
Due to their anisotropic hexagonal crystal structure, the MAX phases are typically characterised by anisotropic thermal expansion, which might trigger microcracking in polycrystalline MAX phase-based ceramics with a non-optimised microstructure. The synthesis of solid solutions could help to tailor the CTE anisotropy of MAX phase-based ceramics, as already reported for Cr2(Alx,Ge1-x)C ceramics, where an isotropic thermal
expansion could be obtained for the Cr2(Al0.75,Ge0.25)C stoichiometry.50 The isotropic CTE of
this particular solid solution can be attributed to the fact that the end-members have an opposite thermal expansion behaviour in the a and c directions, i.e., Cr2GeC had a larger
expansion in the c direction, whereas Cr2AlC had a larger expansion in the a direction.
Unfortunately, the thermal expansion properties of Zr2AlC have not yet been reported,
whereas to our knowledge only dilatometer-measured CTE data are available for Zr2SnC and
Ti2SnC.48 The CTE of Ti2AlC is well studied and it is higher in the <c> direction than in the
<a> direction, similar to most MAX phases.28,29
The experimentally-determined lattice parameter evolution as function of temperature for both (Zr1-x,Tix)2(Al0.5,Sn0.5)C system and Ti2SnC is given in Table S2 of the supporting
information. The a and c parameters expanded linearly with temperature, and the CTEs in the <a> and <c> directions, a and c, were calculated as follows:
and
25 whereas the mean CTE1 was calculated as follows:
(4)
a, c and (dilatometer) data existing in literature for Ti2AlC and Ti2SnC are plotted in
Figure 9a together with the respective experimental data obtained for Ti2SnC and
Ti2(Al0.5,Sn0.5)C in this work. There is a noticeable discrepancy between the Ti2AlC CTE
values that were reported and those experimentally observed. This could be attributed to the processing route and the phase purity of each material. For example, for one of the data points reported in literature, high-temperature XRD data for the CTE determination was collected from a phase-pure, powder sample.28 On the other hand, in another study, the sample used was impure, i.e., contained 38±1 wt.% Ti5Al2C3 (“523”), 32±1 wt.% Ti2AlC (“211”), 18±1
wt.% Ti3AlC2 (“312”), and 12±1 wt.% (Ti0.5,Al0.5)Al; moreover, this sample was bulk and
measured by neutron diffraction.29 According to Figure 9a, Ti2SnC is almost isotropic with a
slightly higher a (8.2710-6 K-1) than c (8.1910-6 K-1), these values were substantially
lower than those determined by dilatometry (10.010-6 K-1).48 Although there is some deviation in the available literature data for Ti2AlC,28–30 it is safe to claim that the c and, by
extension, the c/ a ratio of Ti2(Al,Sn)C decrease with Sn addition.
The c/ a ratio values for the (Zr1-x,Tix)2(Al0.5,Sn0.5)C double solid solutions are plotted in
Figure 9b, revealing that the thermal expansion anisotropy of the (Zr1-x,Tix)2(Al0.5,Sn0.5)C
solid solutions is higher than that of the Zr2(Al0.5,Sn0.5)C and Ti2(Al0.5,Sn0.5)C end-members.
Both the c and the a for (Zr1-x,Tix)2(Al0.5,Sn0.5)C are low between x = 0.3 and 0.7 (Figure
9c). Due to the failure of the synchrotron measurements on (Zr0.5,Ti0.5)2(Al0.5,Sn0.5)C,
presumably due to misalignment of the X-ray beam, no CTE data were obtained for this compound. The CTE data plotted as function of composition in Figure 9b (numerical data in Table S2 of the supporting information) cannot be fitted with a linear function, as opposed to
26
what was observed in the Cr2(Alx,Ge1-x)C system.50 The linear increase in a and c in the
Cr2(Alx,Ge1-x)C system with increasing Ge content was accompanied by a linear increase in
both Od and Pd values.
Despite the fact that lattice parameters c and a decreased linearly and the c/a ratio increased linearly with increasing Ti content, x, in (Zr1-x,Tix)2(Al0.5,Sn0.5)C (see Figure 7d), the CTEs
did not evolve linearly as a function of the composition, indicating that they might be affected by the lattice distortions. In fact, it was found that the a and c values were better fitted
with polynomial functions and were accompanied by Pd and Od with opposite trends as
function of the Ti content, x. The CTE minimum in around x = 0.3 might be attributed to the opposite trends in Od and Pd as a function of x while Od/Pd 1, as shown in Figure 9c.
Despite the fact that c appears rather stable in (Zr1-x,Tix)2(Al0.5,Sn0.5)C compounds with x up
to 0.7, the a clearly goes through a minimum around x = 0.5 (Figure 9c). For all double
27
Figure 9. (a) Measured CTE data for Ti2(Al0.5,Sn0.5)C and Ti2SnC, and literature CTE values
of the Ti2AlC and Ti2SnC end-members28,29,48,30). (b) c/ a ratios of (Zr1-x,Tix)2(Al0.5,Sn0.5)C
solid solutions and Zr2(Al0.5,Sn0.5)C and Ti2(Al0.5,Sn0.5)C end-members. (c) Lattice distortions
Od and Pd for the (Zr1-x,Tix)2(Al0.5,Sn0.5)C solid solutions, as measured by XRD on RHP6/30
ceramics and plotted together with the a and c values.
28
Near phase-pure (>98 %) (Zr1-x,Tix)2(Al0.5,Sn0.5)C double solid solution MAX phase ceramics
with x = 0.1 to 1.0 were synthesized by reactive hot pressing under 30 MPa, as well as by pressureless sintering for 30 min at 1450°C in vacuum. Sintering under vacuum gave better results, irrespective of the applied pressure, as compared to the Ar atmosphere. The hot pressed ceramics were fully densified, whereas the pressurelessly sintered ones had a residual porosity of up to 50%. XRD phase purity was achieved, while occasional Al2Zr, Ti2Sn,
Al3Zr2 intermetallics, Al2O3 and (Zr,Ti)C carbides were identified by SEM as minor phases in
the high-purity ceramics.
The a and c lattice parameters and the relative z-coordinate of the M-atom in the 211 structure,zM, of the (Zr1-x,Tix)2(Al0.5,Sn0.5)C ceramics decreased linearly with increasing the
Ti content, x, following Vegard’s law and indicating a complete solid solubility of Zr and Ti at a fixed Al:Sn ratio of 50:50. Similarly, the lattice parameters of Zr2(Al0.5,Sn0.5)C and
Ti2(Al0.5,Sn0.5)C followed Vegard’s law with respect to the Zr2AlC-Zr2SnC and Ti2
AlC-Ti2SnC end-members.
The octahedron, Od, and trigonal prism, Pd, distortions of the lattice in (Zr
1-x,Tix)2(Al0.5,Sn0.5)C and (Zr1-x,Tix)2AlC solid solutions were calculated from experimental a, c, and zM data and were compared with those of ternary end-member data calculated from
existing literature data. All 211 solid solution distortions fell within the boundaries of the four Zr2AlC, Ti2AlC, Zr2SnC and Ti2SnC end-members. The most distorted lattices were found to
be Zr2AlC (highest Pd) and Ti2SnC (highest Od). Adding Ti in the (Zr1-x,Tix)2(Al1-y,Sny)C
system up to x = 1 increased Od and decreased Pd, both linearly, whereas adding Sn up to y =
0.5 increased Od and decreased Pd. Decreasing the trigonal distortion, Pd and approaching to
Od/Pd ≈ 1, by alloying with both Ti and Sn proved to be key in obtaining phase-pure (Zr
29
The a and c of ternary Ti2SnC was determined to be 8.2710-6 K-1 and 8.1910-6 K-1,
respectively, indicating an almost isotropic thermal expansion. The CTE of (Zr
1-x,Tix)2(Al0.5,Sn0.5)C with x = 0, 0.3, 0.7, 1 was higher in the c direction than in the a direction,
and evolved through a minimum around x = 0.3, resulting in a concomitant maximum in the
c/ a ratio.
In support of the original work of Lapauw et al.,27 forming double solid solutions improved the phase purity of (Zr,Ti)2(Al0.5,Sn0.5)C MAX phase ceramics synthesised via different
processing routes (with or without pressure). The synthesis of MAX phase ceramics with high phase purity is an important milestone in assessing the true potential of such innovative materials for nuclear fuel cladding applications by allowing the determination of intrinsic mechanical properties, compatibility with the coolant (corrosion, oxidation) and resistance to irradiation.
ASSOCIATED CONTENT Supporting Information.
The following files are available free of charge.
Numerical values of CTE, a, z, zM, Od, Pd and Od/Pd of (Zr1-x,Tix)2(Al1-y,Sny)C MAX phases
(PDF)
AUTHOR INFORMATION Corresponding Author E-mail: [email protected] ORCID
30 Bensu Tunca 0000-0001-8611-3636
Author Contributions
B.T., main author, conducted most of the experiments. T.L., co-author, assisted in the experimental part. D.R.N., L.H., D.T. and R.D. contributed to the high-temperature synchrotron experiments. T.O. for conduction/supervision of Ti2SnC single-crystal production
and high-temperature XRD measurements. R.D., J.H., J.V. & K.L. for supervision of the scientific work and revision of the manuscript. All authors have approved the final version of the manuscript.
Notes
The authors declare no competing interests. ACKNOWLEDGEMENTS
H. Roussel and D. Pinek are acknowledged for the Ti2SnC single-crystal production and
high-temperature XRD measurements performed at Grenoble INP-LMGP-CMTC. This research was funded partly by the European Atomic Energy Community's (Euratom) Seventh Framework Programme FP7/2007-2013 under grant agreement No. 604862 (FP7 MatISSE), and partly by the Euratom research and training programme 2014-2018 under grant agreement No. 740415 (H2020 IL TROVATORE). T. Lapauw thanks the Agency for Innovation by Science and Technology (IWT), Flanders, Belgium, for PhD Grant No. 131081. B. Tunca acknowledges the financial support of the SCK•CEN Academy for Nuclear Science and Technology. All authors gratefully acknowledge Synchrotron SOLEIL for the allocated time at the DIFFABS beamline in association with project 20161410 entitled “Investigation of (Zr-Ti)-Al-C MAX phases with in-situ high-temperature XRD”, and the Hercules Foundation for project AKUL/1319 (CombiS(T)EM).
31
REFERENCES
(1) Barsoum, M. W. MAX Phases Properties of Machinable Ternary Carbides and
Nitrides; WILEY-VCH Verlag GmbH & Co. KGaA, 2013.
(2) Salama, I.; El-Raghy, T.; Barsoum, M. W. Oxidation of Nb2AlC and (Ti,Nb)2AlC in
Air. J. Electrochem. Soc. 2003, 150 (3), C152-C158.
(3) Bei, G.; Pedimonte, B.-J.; Fey, T.; Greil, P. Oxidation Behavior of MAX Phase Ti2Al(1−x)SnxC Solid Solution. J. Am. Ceram. Soc. 2013, 96 (5), 1359–1362.
(4) Gu, J.; Pan, L.; Yang, J.; Yu, L.; Zhang, H.; Zou, W.; Xu, C. Mechanical Properties and Oxidation Behavior of Ti-Doped Nb4AlC3. J. Eur. Ceram. Soc. 2016, 36, 1001–
1008.
(5) Zhang, H. B.; Zhou, Y. C.; Bao, Y. W.; Li, M. S. Improving the Oxidation Resistance of Ti3SiC2 by Forming a Ti3Si0.9Al0.1C2 Solid Solution. Acta Mater. 2004, 52, 3631–
3637.
(6) Zhou, Y.; Zhang, H.; Liu, M.; Wang, J.; Bao, Y. Preparation of TiC Free Ti3SiC2 with
Improved Oxidation Resistance by Substitution Of Si with Al. Mater. Res. Innov. 2004, 8 (2), 97–102.
(7) Yu, W.; Li, S.; Sloof, W. G. Microstructure and Mechanical Properties of a Cr2Al(Si)C Solid Solution. Mater. Sci. Eng. A 2010, 527 (21–22), 5997–6001.
(8) Lapauw, T.; Tytko, D.; Vanmeensel, K.; Huang, S.; Choi, P.-P.; Raabe, D.; Caspi, E. N.; Ozeri, O.; to Baben, M.; Schneider, J. M.; Lambrinou, K.; Vleugels, J. (Nbx, Zr
1-x)4AlC3 MAX Phase Solid Solutions: Processing, Mechanical Properties, and Density
32
(9) Berger, O.; Leyens, C.; Heinze, S.; Baben, M.; Schneider, J. M. Self-Healing of Yttrium-Doped Cr2AlC MAX Phase Coatings Deposited by HIPIMS. Proc. 4th Int.
Conf. Self-healing Mater. (ICSHM 2013) 2013, 319–323.
(10) Anasori, B.; Halim, J.; Lu, J.; Voigt, C. A.; Hultman, L.; Barsoum, M. W. Mo2TiAlC2:
A New Ordered Layered Ternary Carbide. Scr. Mater. 2015, 101, 5–7.
(11) Anasori, B.; Dahlqvist, M.; Halim, J.; Moon, E. J.; Lu, J.; Hosler, B. C.; Caspi, E. N.; May, S. J.; Hultman, L.; Eklund, P.; Rosén, J.; Barsoum, M. W. Experimental and Theoretical Characterization of Ordered MAX Phases Mo2TiAlC2 and Mo2Ti2AlC3. J.
Appl. Phys. 2015, 118 (9), 094304.
(12) Liu, Z.; Zheng, L.; Sun, L.; Qian, Y.; Wang, J.; Li, M. (Cr2/3Ti1/3)3AlC2 and
(Cr5/8Ti3/8)4AlC3: New MAX-Phase Compounds in Ti-Cr-Al-C System. J. Am. Ceram.
Soc. 2014, 97 (1), 67–69.
(13) Liu, Z.; Wu, E.; Wang, J.; Qian, Y.; Xiang, H.; Li, X.; Jin, Q.; Sun, G.; Chen, X.; Wang, J.; Li, M. Crystal Structure and Formation Mechanism of (Cr2/3Ti1/3)3AlC2
MAX Phase. Acta Mater. 2014, 73, 186–193.
(14) Horlait, D.; Grasso, S.; Al Nasiri, N.; Burr, P. A.; Lee, W. E. Synthesis and Oxidation Testing of MAX Phase Composites in the Cr-Ti-Al-C Quaternary System. J. Am. Ceram. Soc. 2015, 690 (36501), 682–690.
(15) Burr, P. A.; Horlait, D.; Lee, W. E. Experimental and DFT Investigation of (Cr,Ti)3AlC2 MAX Phases Stability. Mater Res Lett 2017, 5 (3), 144-157.
(16) Tunca, B.; Lapauw, T.; Karakulina, O. M.; Batuk, M.; Cabioc’h, T.; Hadermann, J.; Delville, R.; Lambrinou, K.; Vleugels, J. Synthesis of MAX Phases in the Zr-Ti-Al-C System. Inorg. Chem. 2017, 56 (6), 3489–3498.
33
(17) Meshkian, R.; Tao, Q.; Dahlqvist, M.; Lu, J.; Hultman, L.; Rosen, J. Theoretical Stability and Materials Synthesis of a Chemically Ordered MAX Phase, Mo2ScAlC2,
and Its Two-Dimensional Derivate Mo2ScC2 MXene. Acta Mater. 2017, 125, 476–
480.
(18) Caspi, E. N.; Chartier, P.; Porcher, F.; Damay, F.; Cabioc, T. Ordering of (Cr,V) Layers in Nanolamellar (Cr0.5V0.5)n+1AlCn Compounds. Mater. Res. Lett. 2015, 3 (2),
100–106.
(19) Lu, J.; Thore, A.; Meshkian, R.; Tao, Q.; Hultman, L.; Rosen, J. Theoretical and Experimental Exploration of a Novel In-Plane Chemically Ordered (Cr2/3M1/3)2AlC
MAX Phase with M = Sc and Y. Cryst. Growth Des. 2017, 17 (11), 5704–5711. (20) Chen, L.; Dahlqvist, M.; Lapauw, T.; Tunca, B.; Wang, F.; Lu, J.; Meshkian, R.;
Lambrinou, K.; Blanpain, B.; Vleugels, J.; Rosen, J. Theoretical Prediction and Synthesis of (Cr2/3Zr1/3)2AlC i-MAX Phase. Inorg. Chem. 2018, 57 (11), 6237-6244.
(21) Tao, Q.; Dahlqvist, M.; Lu, J.; Kota, S.; Meshkian, R.; Halim, J.; Palisaitis, J.; Hultman, L.; Barsoum, M. W.; Persson, O. Å.; Rosen, J. Two-Dimensional Mo1.33C
MXene with Divacancy Ordering Prepared from Parent 3D Laminate with in-Plane Chemical Ordering. Nat. Publ. Gr. 2017, 8, 14949.
(22) Lapauw, T.; Lambrinou, K.; Cabioc’h, T.; Halim, J.; Lu, J.; Pesach, A.; Rivin, O.; Ozeri, O.; Caspi, E. N.; Hultman, L.; Eklund, P.; Rosén, J.; Barsoum, M. W.; Vleugels, J. Synthesis of the New MAX Phase Zr2AlC. J. Eur. Ceram. Soc. 2016, 36
(8), 1847–1853.
(23) Lapauw, T.; Halim, J.; Lu, J.; Cabioc’h, T.; Hultman, L.; Barsoum, M. W.; Lambrinou, K.; Vleugels, J. Synthesis of the Novel Zr3AlC2 MAX Phase. J. Eur.
34
(24) Barsoum, M. W.; Brodkin, D.; El-Raghy, T. Layered Machinable Ceramics for High Temperature Applications. 1997, 36 (5), 53–541.
(25) Peng, C.; Wang, C. A.; Song, Y.; Huang, Y. A Novel Simple Method to Stably Synthesize Ti3AlC2 Powder with High Purity. Mater. Sci. Eng. A 2006, 428 (1–2), 54–
58.
(26) Li, L.; Zhou, A.; Xu, L.; Li, Z.; Wang, L. Synthesis of High Pure Ti3AlC2 and Ti2AlC
Powders from TiH2 Powders as Ti Source by Tube Furnace. J. Wuhan Univ. Technol.
Mater. Sci. Ed. 2013, 28 (5), 882–887.
(27) Lapauw, T.; Tunca, B.; Potashnikov, D.; Pesach, A.; Ozeri, O.; Vleugels, J.; Lambrinou, K. The Double Solid Solution (Zr,Nb)2(Al,Sn)C MAX Phase: A Steric
Stability Approach. Sci. Rep. 2018, 8 (1), 12801.
(28) Barsoum, M. W.; El-Raghy, T.; Ali, M. Processing and Characterization of Ti2AlC,
Ti2AlN, and Ti2AlC0.5N0.5. Metall. Mater. Trans. A 2000, 31 (7), 1857–1865.
(29) Lane, N. J.; Vogel, S. C.; Caspi, ad N.; Barsoum, M. W. High-Temperature Neutron Diffraction and First-Principles Study of Temperature-Dependent Crystal Structures and Atomic Vibrations in Ti3AlC2, Ti2AlC, and Ti5Al2C3. J. Appl. Phys. 2013, 113,
183519.
(30) Barsoum, M. W.; Salama, I.; El-Raghy, T.; Golczewski, J.; Seifert, H. J.; Aldinger, F.; Porter, W. D.; Wang, H. Thermal and Electrical Properties of Nb2AlC, (Ti,Nb)2AlC
and Ti2AlC. Metall. Mater. Trans. A 2002, 33 (9), 2775–2779.
(31) Lutterotti, L., Matthies, S., & Wenk, H. MAUD: A Friendly Java Program for Material Analysis Using Diffraction. CPD Newsl. 1999, 21, 14–15.
35
(32) Neuville, D. R.; Hennet, L.; Florian, P.; de Ligny, D. In Situ High-Temperature Experiments. Rev. Mineral. Geochemistry 2014, 78 (1), 779–800.
(33) Popa, N. C.; IUCr. The (Hkl) Dependence of Diffraction-Line Broadening Caused by Strain and Size for all Laue Groups in Rietveld Refinement. J. Appl. Crystallogr. 1998, 31 (2), 176–180.
(34) Kraus, W.; Nolzeb, G.; IUCr. POWDER CELL – a Program for the Representation and Manipulation of Crystal Structures and Calculation of the Resulting X-Ray Powder Patterns. J. Appl. Crystallogr. 1996, 29 (3), 301–303.
(35) Kematick, R. J.; Franzen, H. F. Thermodynamic Study of the Zirconium-Aluminum System. J. Solid State Chem. 1984, 54 (2), 226–234.
(36) Kanoun, M. B.; Goumri-Said, S.; Reshak, A. H. Theoretical Study of Mechanical, Electronic, Chemical Bonding and Optical Properties of Ti2SnC, Zr2SnC, Hf2SnC and
Nb2SnC. Comput. Mater. Sci. 2009, 47 (2), 491–500.
(37) Vincent, H.; Vincent, C.; Mentzen, B. F.; Pastor, S.; Bouix, J. Chemical Interaction between Carbon and Titanium Dissolved in Liquid Tin: Crystal Structure and Reactivity of Ti2SnC with Al. Mater. Sci. Eng. A256 1998, 83–91.
(38) Zhou, Y. C.; Dong, H. Y.; Wang, X. H.; Chen, S. Q. Electronic Structure of the Layered Ternary Carbides Ti2SnC and Ti2GeC. J. Phys. Condens. Matter 2000, 12
(46), 9617–9627.
(39) Ali, M. A.; Hossain, M. M.; Jahan, N.; Islam, A. K. M. A.; Naqib, S. H. Newly Synthesized Zr2AlC, Zr2(Al0.58Bi0.42)C, Zr2(Al0.2Sn0.8)C, and Zr2(Al0.3Sb0.7)C MAX
Phases: A DFT Based First-Principles Study. Comput. Mater. Sci. 2017, 131, 139– 145.
36
(40) Kanoun, M. B.; Goumri-Said, S.; Jaouen, M. Steric Effect on the M Site of
Nanolaminate Compounds M2SnC (M = Ti, Zr, Hf and Nb). J. Phys. Condens. Matter
2009, 21 (4), 045404.
(41) Hug, G.; Jaouen, M.; Barsoum, M. W. X-Ray Absorption Spectroscopy, EELS, and Full-Potential Augmented Plane Wave Study of the Electronic Structure of Ti2AlC,
Ti2AlN, Nb2AlC and (Ti0.5Nb0.5)2AlC. Phys. Rev. B 2005, 71 (2), 024105.
(42) Hug, G. Electronic Structures of and Composition Gaps among the Ternary Carbides Ti2MC. Phys. Rev. B - Condens. Matter Mater. Phys. 2006, 74 (18), 1–7.
(43) Jeitschko, W.; Nowotny, H.; Benesovsky, F. Kohlenstoffhaltige Ternaire Verbindungen (H-Phase). Monatshefte für Chemie 1963, 332, 2–6.
(44) Barsoum, M. W.; Yaroschuk, G.; Tyagi, S. Fabrication and Characterization of M2SnC
(M = Ti, Zr, Hf and Nb). Scr. Mater. 1997, 37 (10), 1583–1591.
(45) Li, S. B.; Bei, G. P.; Zhai, H. X.; Zhou, Y. Bimodal Microstructure and Reaction Mechanism of Ti2SnC Synthesized by a High-Temperature Reaction Using Ti/Sn/C
and Ti/Sn/TiC Powder Compacts. J. Am. Ceram. Soc. 2006, 89 (12), 3617–3623. (46) Li, S.; Zhang, L.; Yu, W.; Zhou, Y. Precipitation Induced Crack Healing in a Ti2SnC
Ceramic in Vacuum. Ceram. Int. 2017, 43 (9), 6963–6966.
(47) Li, S.; Bei, G.; Chen, X.; Zhang, L.; Zhou, Y.; Mačkoví, M.; Spiecker, E.; Greil, P. Crack Healing Induced Electrical and Mechanical Properties Recovery in a Ti2SnC
Ceramic. J. Eur. Ceram. Soc. 2016, 36, 25–32.
(48) El-Raghy, T.; Chakraborty, S.; Barsoum, M. W. Synthesis and Characterization of Hf2PbC, Zr2PbC and M2SnC (M = Ti, Hf, Nb or Zr). J. Eur. Ceram. Soc. 2000, 20
37
(49) Jeitschko, W.; Nowotny, H.; Benesovsky, F. Carbides of Formula T2MC. J.
Less-Common Met. 1963, 7, 133–138.
(50) Cabioch, T.; Eklund, P.; Mauchamp, V.; Jaouen, M.; Barsoum, M. W. Tailoring of the Thermal Expansion of Cr2(Alx,Ge1-x)C Phases. 2013, 2 (33), 897–904.
38
Supporting information
Table S1. Experimental a, c and zM data for (Zr1-x,Tix)2(Al0.5Sn0.5)C MAX phases
Method Ti (x) a (Å) c (Å) zM (Å) RHP6/30 0.00 3.344 14.568 0.088 0.30 3.284 14.350 0.085 0.50 3.234 14.184 0.085 0.70 3.190 14.014 0.083 1.00 3.115 13.714 0.082 RHP30 0.00 3.350 14.581 0.086 0.30 3.278 14.347 0.089 0.50 3.228 14.153 0.085 0.70 3.187 14.007 0.083 1.00 3.114 13.715 0.083 RHP0 0.00 3.345 14.563 0.086 0.10 3.326 14.503 0.086 0.30 3.279 14.343 0.087 0.50 3.232 14.174 0.085 0.70 3.188 13.996 0.084 0.90 3.139 13.806 0.083 1.00 3.115 13.707 0.082
39 CIP/RHP/0 0.00 3.350 14.573 0.088 0.10 3.330 14.504 0.085 0.30 3.283 14.341 0.090 0.50 3.242 14.175 0.084 0.70 3.194 13.998 0.085 0.90 3.141 13.806 0.083 1.00 3.116 13.709 0.080 CIP/Ar/0 0.00 3.347 14.555 0.091 0.10 3.330 14.511 0.090 0.30 3.299 14.360 0.085 0.50 3.258 14.165 0.086 0.70 3.203 14.010 0.083 0.90 3.144 13.808 0.083 1.00 3.108 13.713 0.081
40
Table S2. Tabulated CTE data of (Zr,Ti)2(Al,Sn)C measured between RT and 1500°C.
MAX Phase Linear Fit (Å) R2 α (10-6 K-1) αav (10-6 K-1) αc /αa Method
Zr2(Al0.5,Sn0.5)C 0.98061 7.19(1) 7.33 1.06 XRD 0.99337 7.61(1) (Zr0.7,Ti0.3)2(Al0.5,Sn0.5)C 0.99427 6.62(1) 6.91 1.13 XRD 0.99849 7.48(1) (Zr0.3,Ti0.7)2(Al0.5,Sn0.5)C 0.99427 6.94(1) 7.15 1.09 XRD 0.99502 7.58(1) Ti2(Al0.5,Sn0.5)C 0.99142 8.23(1) 8.36 1.05 XRD 0.99805 8.62(1)
41 Ti2AlC 7.1(3) 8.07 1.41 XRD 28 10.0(5) 8.2(2) Dilatometer28 Ti2AlC 9.0(1) 9.2 1.07 Neutron Diffraction29 9.6(1) 8.7 Dilatometer30 Ti2SnC 10.0(2) Dilatometer48 Zr2SnC 8.3(2) Dilatometer48 Ti2SnC 0.9983 8.27(1) 8.24 0.99 XRD 0.9956 8.19(1) XRD
42
The Od and Pd values for the (Zr1-x,Tix)2(Al0.5,Sn0.5)C phases calculated in this work using
equations (1) and (2), along with the available literature data indicating the measurement method 22,38,40–43 are summarised in Figure S1a and b. A colour code was used to indicate maximum distortions (>>1 ) in red and minimum distortion values ( ) in green. Od/Pd
ratios are tabulated in Figure S1c with deviations in any direction from Od/Pd=1 are coloured
towards red, and Od/Pd are coloured green. The Ti2SnC distortion values found in
literature were not experimentally determined but calculated 38,40,42 and were added to Figure S1 along with the experimentally determined values in this work. Measurement method when available was also indicated either as X-Ray Diffraction (XRD), Neutron Powder Diffraction (NPD) or Extended X-Ray Absorption Fine Structure (EXAFS). ‘*’ indicates near phase pure ( 95wt %) MAX phases synthesised in this work or reported in literature. The corners of the figures are occupied by the ternary carbides (end members) relevant to this study, such as Zr2AlC, Ti2AlC, Zr2SnC and Ti2SnC. In between each corner ternary MAX phase, the
relevant solid solution MAX phases can be found with a composition change in Ti/Zr content in the horizontal direction, whereas the Sn/Al content changes in vertical direction.
43
O
d Zr2AlC Ti2AlC x 0 0.2 0.5 0.8 1 1.034 1.044 1.047 1.059 1.067 NPD22 1.034 1.067 EXAFs41 XRD22 1.061 1.081 42 Zr2(Al0.5,Sn0.5)C Soleil 1.020 1.027 1.054 1.057 Soleil Ti2(Al0.5,Sn0.5)C 1.057 1.090 1.080 1.105 1.109 NPD27 1.082 1.129 40 XRD27 1.085 1.192 XRD43 1.078 1.184 38 40 1.084 1.136 42 x 0 0.3 0.5 0.7 1 Zr2SnC Ti2SnC a)44
P
d Zr2AlC Ti2AlC x 0 0.2 0.5 0.8 1 1.101 1.092 1.088 1.081 1.072 NPD22 1.101 1.072 EXAFS41 XRD22 1.089 1.059 42 Zr2(Al0.5,Sn0.5)C Soleil 1.096 1.090 1.078 1.073 Soleil Ti2(Al0.5,Sn0.5)C 1.097 1.081 1.081 1.071 1.067 NPD27 1.092 1.073 40 XRD27 1.090 1.058 XRD43 1.088 1.071 38 40 1.081 1.066 42 x 0 0.3 0.5 0.7 1 Zr2SnC Ti2SnC b)45
O
d/P
d Zr2AlC Ti2AlC x 0 0.2 0.5 0.8 1 0.939 0.956 0.962 0.979 0.995* NPD22 0.939 0.995* EXAFS41 XRD22 0.974 1.021* 42 Zr2(Al0.5,Sn0.5)C Soleil 0.931 0.943* 0.978* 0.986* Soleil Ti2(Al0.5,Sn0.5)C 0.964 1.008* 0.999* 1.032* 1.039* NPD27 0.991* 1.053* 40 XRD27 0.995* 1.127* XRD43 0.991* 1.106* 38 40 1.003* 1.066* 42 x 0 0.3 0.5 0.7 1 Zr2SnC Ti2SnCFigure S1. Od (a), Pd (b) and Od/Pd values for the (Zr1-x,Tix)2(Al0.5,Sn0.5)C phases synthesized
with RHP6/30 calculated in this work, along with the available literature data and measurement methods. ‘*’ indicates the ceramics that can be produced with 95wt % phase purity. Horizontal axis is Ti content, x. The colour scale for (a) and (b) reflects the values as “high” (in red) and “low” (in green). For (c), Od/Pd values closer to 1 is indicated as green
while any deviation coloured towards red. c)


![Figure 5. SAED patterns corresponding to the [ ] (a) and [1 ] (b) zone axes of a RHP6/30 (Zr 0.5 ,Ti 0.5 ) 2 (Al 0.5 ,Sn 0.5 )C grain](https://thumb-eu.123doks.com/thumbv2/123doknet/14792585.602061/18.892.216.685.240.437/figure-saed-patterns-corresponding-zone-axes-rhp-grain.webp)