GRS 1739-278 OBSERVED AT VERY LOW LUMINOSITY WITH XMM-NEWTON AND NuSTAR
F. Fürst1, J. A. Tomsick2, K. Yamaoka3,4, T. Dauser5, J. M. Miller6, M. Clavel2, S. Corbel7,8, A. Fabian9, J. García10, F. A. Harrison1, A. Loh7, P. Kaaret11, E. Kalemci12, S. Migliari13,14, J. C. A. Miller-Jones15, K. Pottschmidt16,17,
F. Rahoui18,19, J. Rodriguez7, D. Stern20, M. Stuhlinger13, D. J. Walton1,20, and J. Wilms5
1
Cahill Center for Astronomy and Astrophysics, California Institute of Technology, Pasadena, CA 91125, USA
2
Space Sciences Laboratory, University of California, Berkeley, CA 94720, USA
3
Solar-Terrestrial Environment Laboratory, Nagoya University, Furo-cho, Chikuka-ku, Nagoya, Aichi 464-8601, Japan
4
Division of Particle and Astrophysical Science, Graduate School of Science, Nagoya University, Furo-cho, Chikuka-ku, Nagoya, Aichi 464-8602, Japan
5
Dr. Karl-Remeis-Sternwarte and ECAP, Sternwartstr. 7, D-96049 Bamberg, Germany
6
Department of Astronomy, The University of Michigan, Ann Arbor, MI 48109, USA
7
Laboratoire AIM(CEA/IRFU-CNRS/INSU-Université Paris Diderot), CEA DSM/IRFU/SAp, F-91191 Gif-sur-Yvette, France
8
Station de Radioastronomie de Nançay, Observatoire de Paris, PSL Research University, CNRS, Univ. Orléans, F-18330 Nançay, France
9
Institute of Astronomy, Madingley Road, Cambridge CB3 0HA, UK
10
Harvard-Smithsonian Center for Astrophysics, Cambridge, MA 02138, USA
11
Department of Physics and Astronomy, University of Iowa, Iowa City, IA 52242, USA
12Faculty of Engineering and Natural Sciences, Sabancı University, Orhanlı-Tuzla, 34956 Istanbul, Turkey 13
European Space Astronomy Centre(ESAC), E-28692 Villanueva de la Cañada, Madrid, Spain
14Department of Quantum Physics and Astrophysics & Institute of Cosmos Sciences, University of Barcelona, E-08028 Barcelona, Spain 15
International Centre for Radio Astronomy Research—Curtin University, GPO Box U1987, Perth, WA 6845, Australia
16
CRESST, Department of Physics, and Center for Space Science and Technology, UMBC, Baltimore, MD 21250, USA
17
NASA Goddard Space Flight Center, Greenbelt, MD 20771, USA
18
European Southern Observatory, D-85748 Garching bei Munchen, Germany
19
Department of Astronomy, Harvard University, Cambridge, MA 02138, USA
20
Jet Propulsion Laboratory, California Institute of Technology, Pasadena, CA 91109, USA
Received 2016 August 2; revised 2016 September 20; accepted 2016 September 22; published 2016 November 22 ABSTRACT
We present a detailed spectral analysis of XMM-Newton and NuSTAR observations of the accreting transient black hole GRS1739−278 during a very faint low hard state at ∼0.02% of the Eddington luminosity (for a distance of 8.5 kpc and a mass of 10M). The broadband X-ray spectrum between 0.5 and 60 keV can be well-described by a
power-law continuum with an exponential cutoff. The continuum is unusually hard for such a low luminosity, with a photon index ofΓ=1.39±0.04. We find evidence for an additional reflection component from an optically thick accretion disk at the 98% likelihood level. The reflection fraction is low, with refl=0.043-+0.0230.033. In
combination with measurements of the spin and inclination parameters made with NuSTAR during a brighter hard state by Miller et al., we seek to constrain the accretion disk geometry. Depending on the assumed emissivity profile of the accretion disk, we find a truncation radius of 15–35 Rg (5–12 RISCO) at the 90% confidence limit.
These values depend strongly on the assumptions and we discuss possible systematic uncertainties.
Key words: accretion, accretion disks– stars: black holes – X-rays: binaries – X-rays: individual (GRS 1739-278)
1. INTRODUCTION
Galactic black hole(BH) transients typically undergo a very characteristic pattern during an outburst: during thefirst part of the rise, up to luminosities around 10% of the Eddington luminosity(LEdd), they are in a so-called low/hard state. In this
state the X-ray spectrum is dominated by a power law with a photon indexΓ between ≈1.4–1.8 with almost no contribution from the thermal accretion disk spectrum. At higher Eddington rates, the source switches to the high/soft state, where a steeper power law is observed and the thermal accretion disk dominates the soft X-ray spectrum (see, e.g., Remillard & McClintock 2006for a description of BH states). Compelling
evidence exists that in the soft state the accretion disk extends to the innermost stable circular orbit (ISCO), enabling spin measurements through relativistically smeared reflection fea-tures and thermal continuum measurements (e.g., Nowak et al.2002; Miller et al.2002; Steiner et al.2010; Kolehmainen et al.2014; McClintock et al.2014; Petrucci et al.2014; Miller et al.2015; Parker et al. 2016).
At the end of an outburst,the source transitions back to the low/hard state, albeit typically at much lower luminosities (≈1%–4% LEdd) in a hysteretic behavior (see, e.g.,
Maccarone2003; Kalemci et al.2013). It has been postulated
that the accretion disk recedes, i.e., the inner accretion disk radius Rin is no longer at the ISCO. Instead, the inner regions
are replaced by an advection dominated accretionflow (ADAF) in the inner few gravitational radii(e.g., Narayan & Yi 1995; Esin et al. 1997). Many observational results in a sample of
different sources are at least qualitatively consistent with such a truncated disk as measured by, e.g., the frequency and width of quasi-periodic oscillations or multi-wavelength spectroscopy (see, e.g., Zdziarski et al. 1999; Esin et al. 2001; Kalemci et al.2004; Tomsick et al.2004).
It is still not clear, however, at what luminosity the truncation occurs and how it is triggered. There have been several reports of broad iron lines (implying a non-truncated disk) in the brighter part of the low/hard state (>1% LEdd) for
GX339−4 (Miller et al. 2006; Reis et al. 2011; Allured et al. 2013) as well as for other systems (Reis et al. 2010; Reynolds et al. 2010), including GRS1739−278 (Miller
et al.2015, hereafterM15).
Studies conducted recently mostly claim evidence for moderate (tens of gravitational radii Rg) truncation at
intermediate luminosities (≈0.5%–10% LEdd) in the low/hard
state (Shidatsu et al. 2011; Allured et al. 2013; Petrucci et al. 2014; Plant et al. 2014). At a luminosity of
L=0.14% LEdd in GX339−4, Tomsick et al. (2009)
mea-sured a narrowFe Kaline, indicating a significant truncation. While this suggests that gradual truncation may occur, it is not clear that Rinis only set by the luminosity(Kolehmainen et al.
2014; Petrucci et al. 2014; García et al. 2015). A more
complex situation than a simple correlation with luminosity is also supported by recent measurements of the disk truncation at ∼10 Rg in GX339−4 during intermediate states, i.e., during
state transitions, at luminosities of 5%–10% LEdd (Tamura
et al.2012; Fürst et al.2016a).
Besides the truncation radius, the geometry of the hot electron gas, or corona, is still unclear. It is very likely compact, and it has been postulated that it might be connected to the base of the jet, though a commonly accepted model has not yet emerged (see, e.g., Markoff et al. 2005; Reis & Miller2013). NuSTAR and Swift observations of GX339−4 in
the low/hard state found that the reflector seems to see a different continuum than the observer, i.e., a hotter part of the corona(Fürst et al.2015). This indicates a temperature gradient
and a complex structure of the corona and seems to be independent of the spectral state(Parker et al.2016).
It is clear from previous studies that the largest truncation radius is expected at the lowest luminosities, i.e., at the end and beginning of an outburst. High-quality data in this state are traditionally difficult to obtain, given the low flux and necessary precise scheduling of the observations before the source vanishes into quiescence. With a combination of XMM-Newton (Jansen et al. 2001) and the Nuclear Spectroscopy
Telescope Array (NuSTAR, Harrison et al. 2013), however,
such observations are now possible.
Here we report on XMM-Newton and NuSTAR observations of the BH transient GRS1739−278 in the declining phase of its very long outburst in 2014/2015 (Figure 1). GRS1739
−278 is a transient BH candidate, discovered by Granat (Paul
et al.1996; Vargas et al.1997). It is most likely located close to
the Galactic center at a distance of ≈8.5 kpc. The large extinction(AV=14±2, Greiner et al.1996) makes a spectral identification of the companion difficult, but from photometric data, Marti et al.(1997) and Chaty et al. (2002) infer a late-type
main-sequence star of at least F5V or later.
GRS1739−278 was classified as a BH candidate given its similarity in spectral evolution to other transient BHs, as well as the presence of a very strong 5 Hz QPO in the soft-intermediate state (Borozdin et al. 1998; Borozdin & Trudolyubov2000).
During the beginning of the 2014/2015 outburst, NuSTAR measured a strong reflection spectrum and a relativistically broadened iron line in a bright low/hard state (M15). These
authors could constrain the size of the corona, assuming a lamppost model, to be <22 Rg and the truncation radius to
= -+
Rin 5 43Rg. In the lamppost geometry, the corona is assumed
to be a point-like source located on the spin axis of the BH and shining down onto the accretion disk(Matt et al.1991; Dauser et al.2013). The luminosity during this observation was around
8%LEdd (assuming a canonical mass of 10M), at which no
truncation of the accretion disk is expected.
After the first NuSTAR observation, the source continued with a typical outburst evolution and faded to very low luminosities around MJD57000. However, it probably never reached quiescent levels and Swift/XRT and BAT monitoring indicated that it also did not switch back to a stable low/hard state. A detailed description of the evolution will be presented by A.Loh et al. (2016, in preparation). Around MJD57272 the monitoring data indicated a stable transition to the low/hard state had occurred, confirmed by a brightening in the radio. We then triggered simultaneous XMM-Newton and NuSTAR observations to observe a very faint hard state, and found GRS1739−278 at ∼0.02% LEdd.
The rest of the paperis structured as follows. In Section 2,we describe the data reduction and calibration. In Section 3,we present the spectral analysis and compare it to results byM15. In the last section, Section 4, we discuss our results and put them into context.
2. DATA REDUCTION AND OBSERVATION 2.1. NuSTAR
NuSTAR observed GRS1739−278 on MJD57281 (ObsID 80101050002) for a good exposure time, after standard screening, of 43 ks per module. We extracted the NuSTAR data using HEASOFT v6.15 and the standard nupipeline v1.4.1 from a 50″ region centered on the J2000 coordinates of GRS1739−278. On both focal plane modules (FPMs) the source was located in an area of enhanced background due to straylight from sources outside the fieldofview, dominated by GX3+1. We tested different background regions and found that the exact choice only marginally influences the source spectrum. We obtained good agreement between FPMA and FPMB. Despite the high background level we obtained a detection up to 60 keV. We used NuSTAR data between 3–60 keV and rebinned them to a signal-to-noise ratio (S/N) of 6per bin and at least twochannels per bin (Figure2(a)).
2.2. XMM-Newton
We obtained simultaneous XMM-Newton observations
with a good exposure time of 79 ks in EPIC-pn
Figure 1. Swift/BAT (15–50 keV, orange; Krimm et al. 2013) and MAXI/ GSC (2–20 keV, green; Matsuoka et al. 2009) monitoring light curve of GRS1739−278. The NuSTAR observations (3–79 keV) are marked by black diamonds, the one presented by Miller et al.(2015) occurred around 150 days, the one presented here around 680 days. All data are shown in observed(i.e., absorbed) count rates rescaled to mCrab fluxes in the respective energy band of the instrument. The right-hand y-axis gives the average measured NuSTAR countrate of the observation. The inset shows a zoom-in on the 2015 data, including Swift/XRT (Burrows et al.2005) data (3–9 keV, blue triangles) and the XMM-Newton observation (1–10 keV, red square). Due to the crowded source region, the MAXI data suffer from increased background of about 40 mCrab and are therefore not shown in the inset. Note that the inset y-axes are scaled logarithmically.
(Strüder et al. 2001)using the timing mode (ObsID
0762210201). XMM-Newton data were extracted using SAS v14.0.0. The source spectrum was extracted from columns
RAWX 33–42 and the background from columns RAWX
50–60 using only single and double events (PATTERN 0–4). The first 15 ks of the observation were strongly contaminated by background flares, and we excluded these data. The background continued to be elevated throughout the whole observation, in particular influencing the spectrum below 1 keV. In the remainder of thispaper, we therefore use EPIC-pn data between 0.6 and 10 keV, rebinned to an S/N of 5 with at least 5 channels per bin.
We also obtained EPIC-MOS (Turner et al. 2001) data in
timing mode. Due to a hot column, calibration of the MOS 1 timing mode is difficult and we therefore ignore these data. For the MOS 2 data, the source spectrum was extracted from columns RAWX 294–314 and the background from columns RAWX 260–275 using only single events (PATTERN=0) with FLAG=0. MOS 2 data add up to a good exposure time of 35 ks and were rebinned to a S/N of 5 with at least 3 channels per bin between 0.7 and 10 keV. They agree very well with the EPIC-pn data(Figure 2).
3. SPECTRAL ANALYSIS
Using the Interactive Spectral Interpretation System (ISIS v1.6.2, Houck & Denicola2000) we fit the XMM-Newton and
NuSTAR spectra simultaneously. Uncertainties are reported at the 90% confidence level unless otherwise noted. We allowed for a cross-calibration constant(CC) between the instruments to take differences in absolute flux calibration into account. All fluxes are given with respect to NuSTAR/FPMA. The other instruments are within a few percent of these values, besides MOS 2, which measures fluxes up to 15% lower. This discrepancy is within the expected uncertainty of the MOS timing mode.
We model the absorption using an updated version of the tbabs21 model and its corresponding abundance vector as described by Wilms et al.(2000) and cross-sections by Verner
et al.(1996). As found byM15and other previous works, the column density is around 2×1022cm−2, in agreement with the estimates from the dust scattering halo found around GRS1739−278 (Greiner et al.1996).
Using an absorbed power-law continuum with an exponen-tial cutoff provides a statistically acceptable fit, with cred2 =1.08 (χ2=1023) for 946 degrees of freedom (dof). The best-fit values are given in Table 1 and the residuals are shown in Figure2(b). Small deviations around 1 keV can be
attributed to known calibration uncertainties in the EPIC instruments.
Compared to the earlier observation discussed byM15, the spectrum of the later observation discussed here is significantly harder, with a lower photon index Γ and a higher folding energy Efold (labeled Ecut in the cutoffpl model and inM15). This is not only true when compared to the simple
cutoff power-law model of M15, which does not provide an adequate fit to their data, but also when compared to the underlying continuum when adding an additional reflection component(see Table 1 inM15).
The cutoffpl is continuously curving(even far below the folding energy) and does not necessarily accurately describe a Comptonization spectrum (Fabian et al. 2015; Fürst et al.
2016b). We therefore also tested the Comptonization model
nthcomp (Zdziarski et al. 1996; Życki et al. 1999) and
founda comparable fit with cred2 =1.08 (χ2=1022) for 945
dof (Table 1). We found a plasma temperature of
= -+
kTe 15.5 2.76.3keV, which, when multiplied with the expected factor of 3, agrees well with the measured folding energy of the cutoffpl.
We next searched for signatures of reflection, which is present in all low/hard state spectra of accreting BHs, even at low luminosities (see, e.g., Tomsick et al. 2009; Fürst et al. 2015). To model the reflection, we use the xillver
model v0.4a (García & Kallman 2010; García et al. 2013),
which self-consistently describes the iron line and Compton hump. The model is based on a cutoff power law as the input continuum, and we therefore also use the cutoff power law to describe the continuum spectrum.
With this model we find a statistically good fit with cred2 =1.06 (χ2=1005) for 943 dof.We show this model with the data and the contribution of the reflection in Figure 2(a) and its residuals in Figure 2(c). This is an
improvement ofΔχ2=15 for 3 fewer dof. According to the sample-corrected Akaike Information Criterion (AIC, Akaike 1974), this is a significant improvement of
ΔAIC=8.8, i.e., at >98% likelihood (Burnham et al.2011).
We find a low, but well-constrained reflection fraction of
= -+
0.045
refl 0.0220.044 and a high ionization parameter of
x - = -+ log erg cm s 1 3.22 0.27 0.43
( ( )) . The iron abundance AFe is
not well constrained, but seems to prefer values >2.5 solar, relative to the solar abundances by Grevesse & Sauval(1998),
on which the xillver model is based(Table 1). Fixing the
iron abundance to 1 times solar results in a slightly worsefit with cred2 =1.07 (χ2=1013) for 944 dof, but none of the other parameters changesignificantly. We cannot constrain the Figure 2. (a) Data and best-fit xillver model. XMM-Newton/EPIC-pn is
shown in green, MOS 2 in orange, NuSTAR/FPMA in red, and FPMB in blue. The dashed lines show the contribution of the reflection in each instrument. (b) Residuals to the cutoff power-law model. (c) Residuals to the reflection (xillver) model. Data were rebinned for visual clarity.
21
ratio between neutral and ionized iron due to small contribution of the reflection component to the overall spectrum.
While the phenomenological models presented above provide a statistically very good fit, they do not contain information about the geometry of the X-ray producing region. To obtain information about the geometry we need to study the strong relativistic effects close to the BH, in particular the relativistic broadening of the reflection features. These features have been used byM15in the bright hard state data to measure the spin of the BH in GRS1739−278 to be a=0.8±0.2 and constrain the radius of the inner accretion disk to be close to the ISCO.
Due to the low count rates and low reflection strength, our data do not allow us to constrain all parameters of the relativistic smearing models. We therefore fix values that are unlikely to change on timescales of the outburst, namely the inclination i and the iron abundance AFe, to the values found by
M15for the relxilllp model: i=32°.5 and AFe=1.5. We fix the spin to a=0.8, the best-fit value of the relxill model by M15, as it was unconstrained in their lamppost geometry(relxilllp) model. By fixing the inclination, we ignore possible effects of a warped disk.
We model the relativistic effects using the relxill model (Dauser et al. 2013; García et al. 2014) with the emissivity
described by a power law with an index of 3, which is appropriate for a standard Shakura–Sunyaev accretion disk and an extended corona (Dabrowski et al. 1997). We also set the
outer disk radius to rout=400 Rg. This model gives a goodfit
with cred2 =1.07 (χ2=1012) for 943 dof, and its best-fit parameters are shown in Table1. Thisfit is statistically slightly worse compared to the xillver model, but presents the more physically realistic description of the spectrum. The main driver of reduced statistical quality is the iron abundance, which we heldfixed. If we allow it to vary, we find a fit with
cred2 =1.07 (χ2=1332) for 1246 dof, i.e., the same as for the xillver model. However, as in the xillver model, the iron abundance is only weakly constrained and the other parameters do not change significantly. Thus, we keep it fixed at the better constrained value fromM15for the remainder of this work. We only obtain a lower limit on the inner accretion disk radius, Rin>15 Rg.
Allowing for a variable emissivity index does not improve the fit significantly and results in a similar constraint for the inner radius (Rin>15 Rg). The emissivity index itself is not
constrained between 3q10. The often used broken power-law emissivity profile can therefore not be constrained either, in particular because the expected break radius is smaller than the inner accretion disk radius we find (see M15, and references therein).
For the most self-consistent description of the reflection and relativistic blurring we use the relxilllp model, i.e., assuming a lamppost geometry for the corona. While this is a simplified geometry in which the corona is assumed to be a point source on the spin axis at a given height H above the BH (see, e.g., Dauser et al.2013), it is the only geometry where the
reflection fraction can be calculated self-consistently based on ray-tracing calculations.22
This model also gives an acceptable fit with
cred2 =1.07 (χ2=1012) for 943 dof; see Table1. Compared to the previous model, the reflection fraction is now expressed in terms of coronal height. We obtain a lower limit for the inner radius Rin>35 Rg, while the coronal height H is completely
unconstrained over the allowed range of 3–100 Rg (where the
lower limit is set by the ISCO for a BH with spin a=0.8 and Table 1
Best-fit Model Parameters.
Parameter Cutoffpl Nthcomp Xillver Relxill Relxilllp
-NH (1022cm 2) 2.13±0.05 1.44±0.06 2.17+-0.050.07 2.16-+0.050.06 2.16-+0.050.06 (10-11erg cm-2s-1)a 2.89±0.06 2.79±0.05 -+ 2.90 0.040.07 2.91±0.06 2.91±0.06 Γ 1.40±0.04 1.637-+0.0140.016 1.409-+0.0260.038 1.404-+0.0310.030 1.404-+0.0310.030 Efold kT (keV) 56-+1015 15.5-+6.32.7 61-+1020 58-+1014 58-+1014 AFe L L 5.0-+2.55.1 1.5c 1.5c x -log (erg cm s 1) L L -+ 3.22 0.270.43 3.22-+0.460.23 3.24-+0.490.22 refl L L 0.045-+0.0220.044 0.08-+0.050.06 0.099 b i L L 32.5c 32.5c 32.5c Rin (Rg) L L L >15 >35 Rout (Rg) L L L 400c 400c H (Rg) L L L L 30-+27100 q L L L 3c L a L L L 0.8c 0.8c CCB 0.979-+0.0240.025 0.979-+0.0240.025 0.984+-0.0290.022 0.980-+0.0240.025 0.980-+0.0240.025 CCpn 0.960-+0.0190.020 0.949±0.020 0.958-+0.0260.015 0.954±0.020 0.954±0.020 CCMOS 0.884-+0.0230.024 0.872-+0.0230.024 0.884+-0.0290.020 0.880-+0.0230.024 0.880-+0.0230.024 c d.o.f.2 1022.70/946 1022.48/945 1005.78/943 1012.06/943 1012.31/943 cred2 1.081 1.082 1.067 1.073 1.073 Note. a between 1–30 keV. b
calculated self-consistently from the best-fit values of a, Rin, Rout, and H. c
fixed.
22
In principle, the reflection fraction can be calculated in this way for any geometry(see, e.g., Wilkins & Fabian2012), but such calculations are too computationally intensive to be performed whilefitting astrophysical data.
the upper limit is determined to be at a height where changes in H only influence the model marginally).
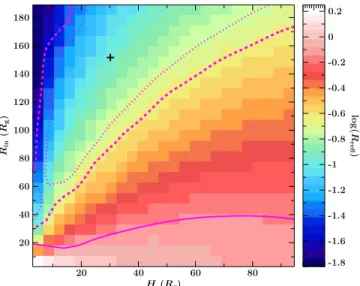
As both H and Rin are directly related to the reflection
fraction, and the reflection fraction is relatively well con-strained, as shown in the relxill model, we expect a strong degeneracy between these parameters. We therefore calculate a confidence contour between them, shown in Figure 3. While this confirms the degeneracy between these two parameters, an inner radius<17.5 Rgis ruled out at the 99% confidence level
for all values of H.
As the reflection fraction is taken into account self-consistently in this model, we can calculate it based on the values for H and Rin (and a and rout,which have been held fixed). Similar values for the reflection can be achieved over a wide range of values for H and Rin, as shown by the
color-coded map in the background of Figure 3. The confidence contours follow areas of constant reflection fraction closely.
4. DISCUSSION AND CONCLUSION
We have presented a spectral analysis of XMM-Newton and NuSTAR observations of GRS1739−278 during a very faint hard state. The luminosity between 1 and 80 keV was about 3×1035erg s−1, i.e., only about 0.02% of the Eddington luminosity for a prototypical 10M BH at a distance of
8.5 kpc. The XMM-Newton and NuSTAR spectra agree very well and provide, despite the low source flux, a high-quality spectrum between 0.5 and 60 keV. While the reflection features are weak, they are still detected at >98% confidence in our data.
The spectrum is very hard,with a photon index around 1.4 and a folding energy at ∼60 keV. It is somewhat surprising to find such a hard spectrum at the very low Eddington luminosity observed. Typically, the photon index decreases with decreas-ing flux only down to a transitional luminosity of ∼1% LEdd,
after which the photon index begins to increase again with lower luminosities (see, e.g., Tomsick et al. 2001; Wu & Gu 2008; Yang et al. 2015). During quiescence, the photon
index has been seen to increase toΓ 2 (Corbel et al. 2006; Plotkin et al. 2013). The lowest photonindices at the
transitional luminosity are typically ∼1.5 (Wu & Gu 2008; Kalemci et al.2013).
We observe a harder photon index at roughly two orders of magnitude below the typically expected transition luminosity. Our inferred Eddington luminosity depends on the assumption of mass and distance, but even with their large uncertainties, it is difficult to increase the luminosity by two orders of magnitude. In any case, the measured hard photon index is at the lower end of known indices and comparable to the hardest spectrum found by Belloni et al.(2002) for XTEJ1550−564.
This may indicate that thermal Comptonization in an optically thin plasma is still the dominating effect in GRS1739−278, even though a strong radio jet is present (e.g., A.Loh et al. 2016, in preparation), as a jet-dominated synchrotron spectrum would result in a softer photon index(Esin et al.1997; Yang et al.2015).
A faint hard state of the prototypical transient BH binary GX339−4 was presented by Fürst et al. (2015), at an
estimated luminosity of 0.94% LEdd. We found that the
spectrum incident on the reflector was harder than the observed continuum, with a best-fit photon index of G =1.31-+0.310.01. This
is similar to the values we measure for GRS1739−278. Fürst et al.(2015) argue that the inner parts of the corona, which are
preferentially intercepted and reprocessed by the accretion disk, might be hotter than parts farther away from the BH, which are more likely to be visible by a distant observer. If in GRS1739 −278 the accretion disk is truncated or its inner parts are optically thin, we would have a direct line of sight toward the hot inner parts of the corona, explaining the observed hard power law.
In GRS1739−278 we find a relatively low folding energy of ∼60 keV. In the nthcomp Comptonization model we find a corresponding low electron temperature around 16 keV (result-ing in a high optical depth of τ>3;Sunyaev & Titarchuk 1980). Such a cool corona is unusual at these low
luminosities(Tomsick et al.2001; Miyakawa et al.2008; Fürst et al. 2015). However, there are a few examples of other BH
systems that have shown a low cutoff energy together with a hard photon index(e.g., GRO J1655−40;Kalemci et al.2016).
We note thatM15also found a relatively low cutoff energy of 28 keV, cooler than in our observation. It is therefore possible that GRS1739−278 has a generally cooler corona than comparable BH binaries.
We applied two relativistic reflection models to the GRS1739−278 data, with different assumptions: either assuming a constant emissivity index of q=3 or a self-consistent emissivity and reflection fraction in the lamppost geometry. In both cases we find a significantly truncated accretion disk at the 90% confidence limit at Rin>15 Rg and
>35 Rg, respectively. In the self-consistent lamppost model, we
can even rule out an accretion disk with an inner radius20 Rg
at the 99% level. However, all these values are strongly dependent on our assumptions. In the following, we will discuss three assumptions influencing the systematic uncertainties.
The coronal and disk geometry: While the lamppost geometry is likely a significant simplification of the real geometry (e.g., by assuming a point-like corona), there are strong indications that the X-ray corona is compact, at least at luminosities L1%LEdd (e.g., Reis & Miller 2013).
Figure 3. Confidence contours of χ2 for the self-consistent relxilllp
model as a function of coronal height H and inner radius Rin. The lines indicate
the 1σ (dotted), 90% (dashed), and 99% (solid) confidence levels for two parameters of interest. The 99% level only provides a lower limit to the inner radius. The cross marks the best-fit value. The color-coded map in the background shows the corresponding reflection fraction according to the scale on the right.
Furthermore, when describing the emissivity with a broken power law, values resembling the lamppost geometry of a corona close to the BH, i.e., a very steep inner index and a much flatter outer index, are often found (e.g., Wilkins & Fabian2012,M15). However, the coronal structure in the very
low hard state, as observed here, is much less certain, and the applicability of a lamppost corona is unclear. For example, if most parts of the inner accretion disk are replaced by an ADAF, the ADAF itself could act as the Compton upscattering hot electron gas. In this case the inner accretion disk would naturally be truncated as well.
We note that the non-relativistic xillver model provides a good fit to the data and that the relativistic models are consistent with a neutral ionization parameter. This could indicate that the reflection occurs very far away from the BH, maybe in neutral material independent of the accretion disk or possibly on the companion’s surface. This would be possible for strongly beamed and misaligned coronal emission and is also consistent with a strongly truncated accretion disk.
It is possible that the corona is outflowing and thereby beaming most of its radiation away from the accretion disk. In this case, we would observe a low reflection fraction despite a non-truncated accretion disk (Beloborodov 1999). This model
is particularly relevant if the corona is associated with the base of a relativistic jet, which is known to be present due to the strong flux in the radio (A.Loh et al. 2016, in preparation). However, the data quality does not allow us to constrain such an outflow and we can therefore not quantitatively assess this possibility.
Inclination: Here we assume an inclination of 32°.5, as found by M15 for the lamppost geometry. In the model preferred byM15, with an emissivity described by a broken power law, theyfind 43°.2 instead. When using this higher inclination, we find a truncated accretion disk at >28 Rg at the 90% level, and
we can no longer constrain the radius at the 99% level, even with the self-consistent lamppost model (i.e., all inner radii between 3 and 200 Rg are allowed at the 99% level). It is
possible that the inclination of the accretion disk changed between the two observations, e.g., due to a warped disk(e.g., Tomsick et al.2014), so that a large range of values is possible.
Our data do not allow us to constrain the disk inclination independently.
Outer radius: as we find that our data are consistent with large values of the inner truncation radius (Rin 200 Rg), we
investigate if the choice of the outer accretion disk radius influences the constraints. As the reflection fraction is calculated self-consistently from the size of the accretion disk in the relxilllp model, a change in outer radius will influence the inferred reflection fraction. The typical assump-tion in most relativistic reflection models is an outer radius of 400 Rg, which is justified for steep emissivity indices. To
confirm that this choice does not influence our measurement, we stepped the outer radius from 400 Rgto 1000 Rg(the upper
limit of the relxilllp model) and find consistent values of Rin≈20 Rg at the 99% limit.
Another important parameter for relativistic reflection models is the BH spin, a, which we held fixed at 0.8, as found by M15. While this value is not well constrained, changes of the spin do not influence the spectral fits in our case, given the large inner radius wefind. Even for a non-spinning BH, our lower limits are far outside the ISCO, which would be
at 6 Rg. The exact value of the spin parameters therefore does
not change our conclusions.
In conclusion, we have shown that the combination of XMM-Newton and NuSTAR allows us to get a more detailed look at BH accretion at lower Eddington luminosities than ever before. We can constrain the underlying continuum very well andfind strong indications that the accretion disk is truncated at a minimum of 15 Rg, i.e.,∼5 RISCO for a BH with spin a=0.8.
However, even with these data, a unique determination of the geometry of the corona and the accretion disk in this state cannot be found due to the lack of photons as well as strong degeneracies in the models.
We thank the referee for their helpful comments. We thank the schedulers and SOC of XMM-Newton and NuSTAR for making these observations possible. Based on observations obtained with XMM-Newton, an ESA science mission with instruments and contributions directly funded by ESA Member States and NASA. This work is based upon work supported by NASA under award No. NNX16AH17G. J.A.T. acknowledges partial support from NASA under Swift Guest Observer grants
NNX15AB81G and NNX15AR52G. E.K.acknowledges
support of TUBITAK Project No 115F488. S.C. and A.L. acknowledge funding support from the French Research National Agency: CHAOS project ANR-12-BS05-0009 and the UnivEarthS Labex program of Sorbonne Paris Cité (ANR-10-LABX-0023 and ANR-11-IDEX-0005-02). J.C.A. M.-J. is the recipient of an Australian Research Council Future Fellowship (FT140101082). This work was supported under NASA contract No. NNG08FD60C, and made use of data from the NuSTAR mission, a project led by the California Institute of Technology, managed by the Jet Propulsion Laboratory, and funded by the National Aeronautics and Space Administration. We thank the NuSTAR Operations, Software and Calibration teams for support with the execution and analysis of these observations. This research has made use of the NuSTAR Data Analysis Software (NuSTARDAS) jointly developed by the ASI Science Data Center (ASDC, Italy) and the California Institute of Technology(USA). We would like to thank John E. Davis for the slxfig module, which was used to produce all figures in this work. This research has made use of MAXI data provided by RIKEN, JAXA and the MAXI team. The Swift/BAT transient monitor results were provided by the Swift/BAT team. This research has made use of a collection of ISIS functions (ISISscripts) provided by ECAP/Remeis observatory and MIT (http://www.sternwarte. uni-erlangen.de/isis/).
Facilities: NuSTAR, XMM.
REFERENCES Akaike, H. 1974,ITAC,19, 716
Allured, R., Tomsick, J. A., Kaaret, P., & Yamaoka, K. 2013,ApJ,774, 135 Belloni, T., Colombo, A. P., Homan, J., et al. 2002,A&A,390, 199 Beloborodov, A. M. 1999,ApJL,510, L123
Borozdin, K. N., Revnivtsev, M. G., Trudolyubov, S. P., et al. 1998, AstL, 24, 435
Borozdin, K. N., & Trudolyubov, S. P. 2000,ApJL,533, L131
Burnham, K. P., Anderson, D. R., & Huyvaert, K. P. 2011, Behav. Ecol. Sociobiol., 65, 23
Burrows, D. N., Hill, J. E., Nousek, J. A., et al. 2005,SSRv,120, 165 Chaty, S., Mirabel, I. F., Goldoni, P., et al. 2002,MNRAS,331, 1065 Corbel, S., Tomsick, J. A., & Kaaret, P. 2006,ApJ,636, 971
Dabrowski, Y., Fabian, A. C., Iwasawa, K., et al. 1997,MNRAS,288, L11 Dauser, T., García, J., Wilms, J., et al. 2013,MNRAS,430, 1694
Esin, A. A., McClintock, J. E., Drake, J. J., et al. 2001,ApJ,555, 483 Esin, A. A., McClintock, J. E., & Narayan, R. 1997,ApJ,489, 865 Fabian, A. C., Lohfink, A., Kara, E., et al. 2015,MNRAS,451, 4375 Fürst, F., Grinberg, V., Tomsick, J. A., et al. 2016a,ApJ,828, 34 Fürst, F., Müller, C., Madsen, K. K., et al. 2016b,ApJ,819, 150 Fürst, F., Nowak, M. A., Tomsick, J. A., et al. 2015,ApJ,808, 122 García, J., Dauser, T., Lohfink, A., et al. 2014,ApJ,782, 76 García, J., Dauser, T., Reynolds, C. S., et al. 2013,ApJ,768, 146 García, J., & Kallman, T. R. 2010,ApJ,718, 695
García, J. A., Steiner, J. F., McClintock, J. E., et al. 2015,ApJ,813, 84 Greiner, J., Dennerl, K., & Predehl, P. 1996, A&A,314, L21
Grevesse, N., & Sauval, A. J. 1998,SSRv,85, 161
Harrison, F. A., Craig, W., Christensen, F., et al. 2013,ApJ,770, 103 Houck, J. C., & Denicola, L. A. 2000, in ASP Conf. Ser. 216, Astronomical
Data Analysis Software and Systems IX, ed. N. Manset, C. Veillet, & D. Crabtree(San Francisco, CA: ASP),591
Jansen, F., Lumb, D., Altieri, B., et al. 2001,A&A, 365, 6
Kalemci, E., Begelman, M. C., Maccarone, T. J., et al. 2016, MNRAS, 463, 615
Kalemci, E., Dinçer, T., Tomsick, J. A., et al. 2013,ApJ,779, 95 Kalemci, E., Tomsick, J. A., Rothschild, R. E., et al. 2004,ApJ,603, 231 Kolehmainen, M., Done, C., & Díaz Trigo, M. 2014,MNRAS,437, 316 Krimm, H. A., Holland, S. T., Corbet, R. H. D., et al. 2013,ApJS,209, 14 Maccarone, T. J. 2003,A&A,409, 697
Markoff, S., Nowak, M. A., & Wilms, J. 2005,ApJ,635, 1203
Marti, J., Mirabel, I. F., Duc, P. A., & Rodriguez, L. F. 1997, A&A,323, 158 Matsuoka, M., Kawasaki, K., Ueno, S., et al. 2009,PASJ,61, 999
Matt, G., Perola, G. C., & Piro, L. 1991, A&A,247, 25
McClintock, J. E., Narayan, R., & Steiner, J. F. 2014,SSRv,183, 295 Miller, J. M., Fabian, A. C., Wijnands, R., et al. 2002,ApJL,570, L69 Miller, J. M., Homan, J., Steeghs, D., et al. 2006,ApJ,653, 525
Miller, J. M., Tomsick, J. A., Bachetti, M., et al. 2015,ApJL,799, L6(M15) Miyakawa, T., Yamaoka, K., Homan, J., et al. 2008,PASJ,60, 637
Narayan, R., & Yi, I. 1995,ApJ,452, 710
Nowak, M. A., Wilms, J., & Dove, J. B. 2002,MNRAS,332, 856 Parker, M. L., Tomsick, J. A., Kennea, J. A., et al. 2016,ApJL,821, L6 Paul, J., Bouchet, L., Churazov, E., & Sunyaev, R. 1996, IAUC,6348 Petrucci, P. O., Cabanac, C., Corbel, S., et al. 2014,A&A,564, A37 Plant, D. S., Fender, R. P., Ponti, G., et al. 2014,MNRAS,442, 1767 Plotkin, R. M., Gallo, E., & Jonker, P. G. 2013,ApJ,773, 59 Reis, R. C., Fabian, A. C., & Miller, J. M. 2010,MNRAS,402, 836 Reis, R. C., & Miller, J. M. 2013,ApJL,769, L7
Reis, R. C., Miller, J. M., Fabian, A. C., et al. 2011,MNRAS,410, 2497 Remillard, R. A., & McClintock, J. E. 2006,ARA&A,44, 49
Reynolds, M. T., Miller, J. M., Homan, J., & Miniutti, G. 2010,ApJ,709, 358 Shidatsu, M., Ueda, Y., Tazaki, F., et al. 2011,PASJ,63, 785
Steiner, J. F., McClintock, J. E., Remillard, R. A., et al. 2010,ApJL,718, L117 Strüder, L., Briel, U., Dennerl, K., et al. 2001,A&A,365, L18
Sunyaev, R. A., & Titarchuk, L. G. 1980, A&A,86, 121 Tamura, M., Kubota, A., Yamada, S., et al. 2012,ApJ,753, 65 Tomsick, J. A., Corbel, S., & Kaaret, P. 2001,ApJ,563, 229 Tomsick, J. A., Kalemci, E., & Kaaret, P. 2004,ApJ,601, 439 Tomsick, J. A., Nowak, M. A., Parker, M., et al. 2014,ApJ,780, 78 Tomsick, J. A., Yamaoka, K., Corbel, S., et al. 2009,ApJL,707, L87 Turner, M. J. L., Abbey, A., Arnaud, M., et al. 2001,A&A,365, L27 Vargas, M., Goldwurm, A., Laurent, P., et al. 1997,ApJL,476, L23 Verner, D. A., Ferland, G. J., Korista, K. T., & Yakovlev, D. G. 1996,ApJ,
465, 487
Wilkins, D. R., & Fabian, A. C. 2012,MNRAS,424, 1284 Wilms, J., Allen, A., & McCray, R. 2000,ApJ,542, 914 Wu, Q., & Gu, M. 2008,ApJ,682, 212
Yang, Q. X., Xie, F. G., Yuan, F., et al. 2015,MNRAS,447, 1692 Zdziarski, A. A., Johnson, W. N., & Magdziarz, P. 1996, MNRAS,
283, 193
Zdziarski, A. A., Lubiński, P., & Smith, D. A. 1999,MNRAS,303, L11 Życki, P. T., Done, C., & Smith, D. A. 1999,MNRAS,309, 561