HAL Id: cea-00864242
https://hal-cea.archives-ouvertes.fr/cea-00864242
Submitted on 14 Feb 2019
HAL is a multi-disciplinary open access
archive for the deposit and dissemination of
sci-entific research documents, whether they are
pub-lished or not. The documents may come from
teaching and research institutions in France or
L’archive ouverte pluridisciplinaire HAL, est
destinée au dépôt et à la diffusion de documents
scientifiques de niveau recherche, publiés ou non,
émanant des établissements d’enseignement et de
recherche français ou étrangers, des laboratoires
An extremely luminous panchromatic outburst from the
nucleus of a distant galaxy
A. J. Levan, N. R. Tanvir, S. B. Cenko, D.A. Perley, K. Wiersema, J. S.
Bloom, A. S. Fruchter, A. de Ugarte Postigo, P. T. O’Brien, N. Butler, et al.
To cite this version:
A. J. Levan, N. R. Tanvir, S. B. Cenko, D.A. Perley, K. Wiersema, et al.. An extremely luminous
panchromatic outburst from the nucleus of a distant galaxy. Science, American Association for the
Advancement of Science, 2011, 333 (6039), pp.199-202. �10.1126/science.1207143�. �cea-00864242�
An extremely luminous panchromatic outburst from
the nucleus of a distant galaxy
A. J. Levan,
1∗N. R. Tanvir,
2S. B. Cenko,
3D. A. Perley,
3K. Wiersema,
2J. S. Bloom,
3A. S. Fruchter,
4A. de Ugarte Postigo,
5P. T. O’Brien,
2N. Butler,
3,6A. J. van der Horst,
7G. Leloudas,
5A. N. Morgan,
3K. Misra,
4G. C. Bower,
3J. Farihi,
2R. L. Tunnicliffe,
1M. Modjaz,
3,8J. M. Silverman,
3J. Hjorth,
5C. Th¨one,
9A. Cucchiara,
3J. M. Castro Cer´on,
10A.J. Castro-Tirado,
9J. A. Arnold,
11M. Bremer,
12J. P. Brodie,
11T. Carroll,
13M. C. Cooper,
14,15P. A. Curran,
16R. M. Cutri,
17J. Ehle,
13, D. Forbes,
18J. Fynbo,
5J. Gorosabel,
9J. Graham,
4,29S. Guziy,
9D. I. Hoffman,
19P. Jakobsson,
20A. Kamble,
21T. Kerr,
13M. M. Kasliwal,
19C. Kouveliotou,
22D. Kocesvki,
11N. M. Law,
22P. E. Nugent,
23E. O. Ofek,
19D. Poznanski,
3,6,23R. M. Quimby,
19E. Rol,
24A. J. Romanowsky,
11R. S´anchez-Ram´ırez,
9S. Schulze,
20N. Singh,
11R. L. C. Starling,
2R. G. Strom,
27P. J. Wheatley,
1R. A. M. J. Wijers,
26J. M. Winters,
27T. Wold,
13D. Xu
28∗
To whom correspondence should be addressed; E-mail: a.j.levan@warwick.ac.uk
Variable X-ray and γ-ray emission is characteristic of the most extreme
phys-ical processes in the Universe, and studying the sources of these energetic
photons has been a major driver in astronomy for the past 50 years. Here
we present multiwavelength observations of a unique γ-ray selected transient,
discovered by Swift, which was accompanied by bright emission across the
electromagnetic spectrum, and whose properties are unlike any previously
ob-served source. We pinpoint the event to the center of a small, star-forming
galaxy at redshift z = 0.3534. Its high-energy emission has lasted much longer
than any gamma-ray burst, while its peak luminosity was ∼100 times higher
than bright active galactic nuclei. The association of the outburst with the
ter of its host galaxy suggests that this phenomenon has its origin in a new, rare
mechanism associated with a massive black hole in the nucleus of a galaxy
Surveys of the sky at short wavelengths (X-ray and γ-ray) reveal a much more dynamic
Universe than seen at optical wavelengths. Many sources vary substantially, and the most
ex-treme transform from invisibility to the brightest objects in the sky, sometimes on timescales
of seconds. The sources of such bursts of high-energy radiation have proven difficult to trace,
but coherent observational programmes have shown that some fraction originate in the Milky
Way, either from isolated neutron stars with intense magnetic fields (1), or from binary systems
containing neutron stars and black holes (2). Some, long lived, but variable X- and γ-ray
emis-sion originates in active galaxies (3), while the brightest and perhaps most spectacular class are
the long-duration gamma-ray bursts (long-GRBs) which are detected at a rate of ∼ 2 per week
by current missions such as the Swift satellite (4), and are now thought to originate from the
collapse of massive stars in the distant Universe (5, 6).
In this paper we present observations, spanning radio to γ-ray, of a new type of transient,
GRB 110328A/Swift J164449.3+573451, hereafter Sw 1644+57. It is more luminous than any
active galaxy, yet longer lived than any long-GRB. It defies placement into any of the classes of
object described above, and suggests a new channel for the creation of highly energetic transient
events.
Sw 1644+57 was first detected by the Swift Burst Alert Telescope (BAT) at 12:57:45 UT
on 28 March 2011 (10). It was characterized as a long image trigger, with a low count rate
(not sufficient to trigger the instrument) but a duration of > 1000s, allowing a point source to
be recovered in the image plane. Swift follow-up observations with the Ultraviolet and Optical
Telescope (UVOT) and X-ray Telescope (XRT) only began 1475 s after the initial outburst.
No source was seen in the UVOT observations, but a bright point source was found with the
on a timescale of minutes), it remained bright and highly variable for a prolonged period, and
went on to re-trigger the BAT on three further occasions over the next 48 hours (49).
Re-examination of previous γ-ray observations of this region showed that the source appears to
have been present a few days before the initial trigger, but not at earlier times (9). Equally
unlike any normal long-GRB, the source remained bright in the X-rays for more than two weeks
(see Figure 1). The early X-ray behaviour showed the same dramatic flaring seen by BAT, with
flares having time-scales of hours, and with broadly similar shapes. After the first 48 hours the
X-rays maintained a more constant level, albeit with episodic brightening and fading spanning
more than an order of magnitude in flux.
Our first ground based observations of Sw 1644+57 began approximately two hours after
the burst trigger, with the Gemini-North Telescope in Hawaii. Unfortunately, poor weather
conditions meant that only shallow observations were possible, and these did not yield any
candidate optical counterpart to a limit of r ∼ 22.1. At 13 hours post-trigger we obtained
imaging with the Nordic Optical Telescope (NOT) on La Palma, which revealed a R = 22.5
magnitude source consistent with the X-ray localisation (11). Our examination of archival
images obtained with the Palomar Transient Factory (PTF) revealed this source to be present
at approximately the same brightness more than a year prior to the outburst, and indeed our
subsequent optical monitoring (below) confirms the optical flux is dominated by the host galaxy.
Early analysis of the X-ray/γ-ray data was used to argue that the transient was most likely
a source within the Milky Way (12). However, our spectroscopy of the optical counterpart
with Gemini-North (13), the Gran Telescopio Canarias (GTC) in La Palma (14), and the Keck
Telescope in Hawaii (15) showed strong emission lines of hydrogen and oxygen (as well as
absorption lines from a moderate age stellar population), consistent with a star-forming galaxy
at a systemic redshift of z = 0.3534 ± 0.0002 (see Figure 2). Thus we concluded Sw 1644+57
was a source at cosmological distance with extremely unusual properties, and this sparked a
global follow-up campaign in an effort to elucidate its nature.
We continued to monitor the field from the ground in the optical and near infrared (nIR)
with Gemini-North, the United Kingdom Infrared Telescope (UKIRT), NOT, PAIRITEL and
GTC, obtaining observations from the B-band (435 nm) to the L-band (3780 nm). In contrast
to the non-varying behaviour in the optical, these data showed that at nIR wavelengths the
source fluctuated by more than a factor of 3 in flux over several days, indicating that the
γ-ray transient was also producing considerable longer-wavelength emission. Our detection in
the L-band (270 ± 50 µJy) at a level more than an order of magnitude above our limit from
WISE
on any quiescent emission from the host galaxy at 3.4 µm emphasises this point (16).
The infrared variations roughly track those of the X-ray (see Figure 1), but are certainly not
perfectly correlated, suggesting multiple emission components.
We triggered a target of opportunity observation with the Chandra X-ray Observatory,
which took place about 6.5 days after the initial outburst. This confirmed that the X-ray
lightcurve is frequently highly variable on timescales of seconds (Figure 1). Specifically our
Chandra
observations show that factor of 2 changes in flux continued to occur on ∼ 100 s even
at comparatively late times. However, our photometry of individual optical and nIR images
(with a time resolution of 20−60 s) does not reveal rapid variability in the nIR light. In the
optical r-band little variability was seen (< 10%) on all time-scales, indicating that the host
galaxy dominates the optical emission. We conclude that the transient has a very red
optical-nIR colour, which may be due to a high dust column along the line of sight. The dust hypothesis
would be consistent with the high hydrogen column density inferred from the X-ray spectrum
(10
22cm
−2), which implies host extinction of A
V
∼ 6 (17) and together these findings suggest
that the source is situated in a dense and dusty region, such as a galactic nucleus (see
Supple-mentary Online Material for more information).
(19) at the same location. Our millimeter observations from IRAM confirm this, and radio
(1.4. and 4.8 GHz) observations from Westerbork Synthesis Radio Telescope (WSRT) show
a bright source, which brightened over the first week following the outburst (Figure 1, lower
panel). These observations demonstrate that Sw 1644+57was emitting strong radiation across
the electromagnetic spectrum.
The character of the host galaxy and the position of the transient within it are potentially
important clues to the nature of Sw 1644+57, and to this end, we obtained observations with the
Hubble Space Telescope
on 4 April 2011. In the nIR the image remains unresolved, consistent
with emission from the transient still dominating, but in the optical wavebands we clearly detect
the light of the host galaxy. The WFC3 IR position of the transient falls within 0.03 arcseconds
(1σ, < 150 pc at z = 0.3534) of the center of the host galaxy (see Figure 3). We additionally
obtained VLBA observations of Sw 1644+57 on 1 April 2011, providing another precise
as-trometric position, with an offset from the center of the host of 0.04 ± 0.07 arcseconds, further
strengthening the association with the nucleus of the host [see also (20)].
The host galaxy itself appears compact, and non-interacting, with a half-light radius in the
optical of r
h= 1.04 kpc, and an absolute magnitude of M
V= −18.19 (comparable in
luminos-ity to the Large Magellanic Cloud). Subtraction of a point source from the HST F606W image
suggests an upper limit to the transient magnitude in that band of 30% of the host light, or a
magnitude of 24.1 (AB). The measured ratios of emission lines are consistent with them
orig-inating from a normal star forming galaxy that has not, at least until now, contained an active
nucleus. The inferred star formation rate of the host is 0.5 M
yr
−1.
Our observations clearly show that the transient originates from the center of a galaxy at
cosmological distances. At this redshift (which corresponds to a luminosity distance d
L=
1.81 Gpc, assuming H
0= 73 km s
−1Mpc
−1, Ω
Λ= 0.73, Ω
M= 0.27), the the brightest
The total energy output in the first ∼ 10
6s after outburst of ∼ 10
53erg, is equivalent to ∼
10% of the rest energy of the Sun. While these numbers are not abnormal for long-duration
GRBs, the properties of this outburst are clearly distinct from the long-GRB population. First,
the repetition of the γ-ray trigger 4 times in 48 hours is unheard of for long-GRBs, which
are destructive, and non-repeating events. Further, the duration of bright X-ray emission is
much longer than has ever been seen for any long-GRB [e.g., (21, 22)], persisting at L
X∼
10
47erg s
−1two weeks after the initial event. This, together with the origin in the core of its
host galaxy, lead us to infer that Sw 1644+57 most likely originates from the central massive
black hole. However, the X-ray luminosity of Sw 1644+57 is well beyond the bright end of
the quasar luminosity function (23), and is more luminous (by a factor of ∼ 100) than flares
from the brightest blazars [e.g., (3)]. Interestingly, though, its optical luminosity is a factor of
∼ 10
4fainter than a bright QSO [e.g., (24)], implying either differing emission processes or
(as in fact seems to be the case from the red colour) a particularly high dust column within the
host. The overall energetics and long-duration, together with the order-of-magnitude variations
in flux over 100 s timescales, make it clear that we are observing a new and unprecedented
astrophysical object (Figure 4).
The peak luminosity corresponds to the Eddington luminosity of a ∼ 10
10M
black hole. It
is highly unlikely that a moderate sized galaxy like the host of Sw 1644+57 could contain such
a massive black hole – indeed, our SED fitting of the host galaxy implies its total stellar mass
is less than this value (see SOM). Hence Sw 1644+57 is either accreting at a super-Eddington
rate, or has its total energy modified by relativistic beaming (or both). A companion paper (1)
considers the possibility that the source of this event is the tidal disruption of a star around the
central black hole.
The discovery of a new class of extremely energetic γ-ray transient after many years of
intensive monitoring of the γ-ray sky highlights the rarity of this phenomenon. Studies of
similar events in the future may lead to insight into the nature and fuelling of active galactic
nuclei, or even provide electromagnetic smoking guns of black hole – black hole mergers,
where the debris of the merger can result in a stellar disruption rate of ∼ 0.1 yr
−1(25), raising
the possibility that sensitive observations could uncover multiple events from a single galaxy.
However, we note that Sw 1644+57 has emitted most of its radiation over the three weeks of
its apparent existence relatively smoothly. It was only the presence of short, powerful bursts
early on that alerted us to its presence, thus raising the possibility that other similar, but rather
less variable, objects could easily be going undetected. Future sensitive and wide field X-ray
observations of the sky offer the promise of finding more events like Sw 1644+57, as well as
new classes of X-ray and γ-ray transients.
References and Notes
1. C. Kouveliotou, et al., Nature 393, 235 (1998).
2. F. Aharonian, et al., Science 309, 746 (2005).
3. I. Donnarumma, et al., ApJL 691, L13 (2009).
4. N. Gehrels, E. Ramirez-Ruiz, D. B. Fox, Annual Review of Astronomy and Astrophysics 47,
567 (2009).
5. J. Hjorth, et al., Nature 423, 847 (2003).
6. S. E. Woosley, J. S. Bloom, ARA&A 44, 507 (2006).
7. J. C. Cummings, et al., GCN 11823 (2011).
8. T. Sakamoto, et al., GCN 11842 (2011).
10. J. Bloom, et al., A relativistic jetted outburst from a massive black hole fed by a tidally
disrupted star (2011). Submitted.
11. G. Leloudas, et al., GCN 11830 (2011).
12. S. D. Barthelmy, et al., GCN 11824 (2011).
13. A. Levan, N. Tanvir, K. Wiersema, D. Perley, GCN 11833, (2011).
14. C. Thoene, et al., GCN 11834 (2011).
15. S. B. Cenko, et al., GCN 11874 (2011).
16. D. Hoffman, et al., GCN 11933 (2011).
17. P. Predehl, J. H. M. M. Schmitt, A&A 293, 889 (1995).
18. A. Zauderer, E. Berger, D. A. Frail, A. Soderberg, GCN 11836, 1 (2011).
19. A. Zauderer, et al., GCN 11841 (2011).
20. A. Brunthaler, et al., GCN 11911 (2011).
21. C. Kouveliotou, et al., ApJ 608, 872 (2004).
22. J. A. Nousek, et al., ApJ 642, 389 (2006).
23. Y. Ueda, M. Akiyama, K. Ohta, T. Miyaji, ApJ 598, 886 (2003).
24. D. W. Just, et al., ApJ 665, 1004 (2007).
25. N. Stone, A. Loeb, MNRAS 412, 75 (2011).
27. L. C. Ho, ApJ 699, 626 (2009).
28. D. A. Kann, et al., ApJ 720, 1513 (2010).
29. P. A. Evans, et al., MNRAS 397, 1177 (2009).
30. S. Komossa, et al., ApJL 603, L17 (2004).
31. We gratefully acknowledge the efforts of the many observatories whose data is presented
here. We particularly thank Daniele Malesani for assistance in the calibration of the optical
photometry, Mike Irwin for assistance with the UKIRT data, Derek Fox for help with the
PTF data, and Kevin Hurley and J. Xavier Prochaska for assistance in obtaining the Keck
data. Full acknowledgements are given in the Supplementary online material.
1Department of Physics, University of Warwick, Coventry, CV4 7AL, UK
2Department of Physics and Astronomy, University of Leicester, Leicester, LE1 7RH, UK 3Department of Astronomy, University of California, Berkeley, CA 94720-3411, USA 4Space Telescope Science Institute, 3700 San Martin Drive, Baltimore, MD 21218, USA
5Dark Cosmology Centre, Niels Bohr Institute, University of Copenhagen, 2100 Copenhagen, Denmark 6NASA Einstein Fellow
7Universities Space Research Association, NSSTC, 320 Sparkman Drive, Huntsville, AL 35805, USA 8Columbia Astrophysics Lab, Columbia University, NYC, NY 10024, USA
9Instituto de Astrof´ısica de Andaluc´ıa (IAA-CSIC), Glorieta de la Astronom´ıa s/n, E-18008 Granada, Spain. 10Herschel Science Operations Centre, ESAC, ESA, PO Box 78, 28691 Villanueva de la Caada, Madrid, Spain 11UCO/Lick Observatory, University of California, Santa Cruz, 1156 High Street, Santa Cruz, CA 95064, USA 12Institut de RadioAstronomie Millim´etrique, 300 rue de la Piscine, Domaine Universitaire, 38406 Saint Martin d’H`eres, France
14Center for Galaxy Evolution, University of California, Irvine, 4129 Frederick Reines Hall, Irvine, CA 92697 15Hubble Fellow
16AIM, CEA/DSM - CNRS, Irfu/SAP, Centre de Saclay, Bat. 709, FR-91191 Gif-sur-Yvette Cedex, France 17Infrared Processing and Analysis Center, California Institute of Technology, Pasadena, CA, 91125, USA 16Centre for Astrophysics & Supercomputing, Swinburne University, Hawthorn VIC 3122, Australia
18Institute for the Physics and Mathematics of the Universe, University of Tokyo, Kashiwa-shi, Chiba 277-8568, Japan
19Cahill Center for Astrophysics, California Institute of Technology, Pasadena, CA, 91125, USA
20Centre for Astrophysics & Cosmology, Science Institute, University of Iceland, Dunhaga 5, IS-107 Reykjavik,
Iceland
21Center for Gravitation and Cosmology, University of Wisconsin-Milwaukee, 1900 E Kenwood Blvd,
Milwau-kee, WI - 53211, USA
22Space Science Office, VP62, NASA/Marshall Space Flight Center Huntsville, AL 35812, USA
23SLAC National Accelerator Center, Kavli Institute for Particle Astrophysics and Cosmology, 2575 Sand Hill Rd, MS 29, Menlo Park, Ca 94025, USA
24Dunlap Institute for Astronomy & Astrophysics, University of Toronto, Toronto M5S 3H4, Ontario, Canada 25Computational Cosmology Center, Lawrence Berkeley National Laboratory, 1 Cyclotron Road, Berkeley, CA
94720, USA
26Astronomical Institute, University of Amsterdam, Science Park 904, 1098 XH Amsterdam, The Netherlands 27Netherlands Institute for Radio Astronomy (ASTRON), Postbus 2, 7990 AA Dwingeloo, The Netherlands 28Benoziyo Center for Astrophysics, Faculty of Physics, Weizmann Institute of Science, Rehovot, 76100, Israel 29Department of Physics and Astronomy, Johns Hopkins University, Baltimore, MD 21218
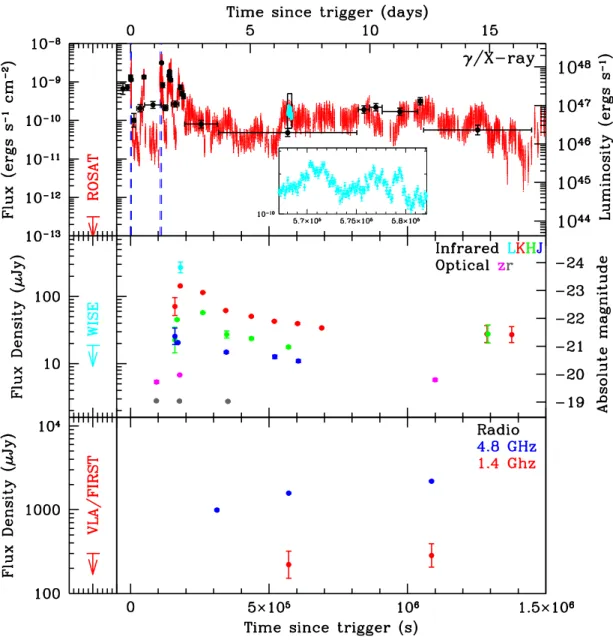
Figure 1: The X-ray, infrared and radio lightcurves of Sw 1644+57: The top panel shows
the XRT (0.3–10 keV; in red) and BAT (15–50 keV; in black) flux against observed time since
the initial outburst trigger time, where the right hand axis indicates the luminosity of the event.
The inset panel shows the dense sampling of our Chandra observation. The dashed blue
ver-tical lines show the times of subsequent triggers of the BAT. The middle-panel shows our nIR
lightcurve of this event (host flux not subtracted). The lower panel shows our 4.8 GHz lightcurve
obtained from the WSRT, demonstrating a rising radio lightcurve. The left hand panels
repre-sent pre-existing observation of the location of Sw 1644+57 and the limits on transient emission
at this time (1), they clearly demonstrate the large amplitude of this outburst in the X-ray and
infrared.
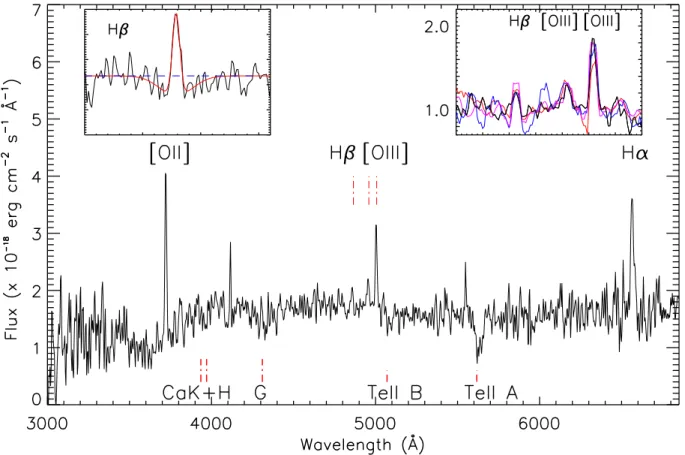
Figure 2: Spectroscopy of the host galaxy of Sw 1644+57. The main panel shows our
ob-servations obtained at the GTC plotted against rest-frame wavelength. The left inset shows the
H β line as seen in the first Gemini GMOS spectrum. Prominent stellar atmosphere absorption
is visible. The inset on the right shows the first Gemini spectrum (red), the second Gemini
spectrum (blue), the Keck spectrum (magenta) and the GTC spectrum (black) covering the Hβ
and [O III] doublet, all rebinned to the lower resolution of the GTC spectra. No emission line
variability is apparent.
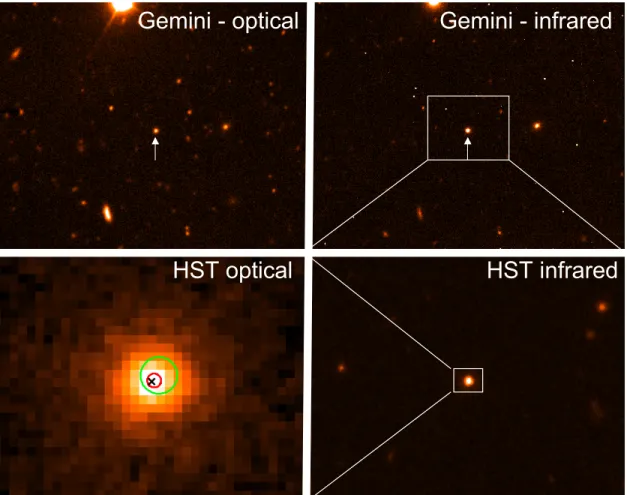
Gemini - optical
Gemini - infrared
HST infrared
HST optical
Figure 3:
Discovery images of Sw 1644+57 and its host galaxy. The top panels show
our ground based imaging in the optical r-band (top left), and infrared K-band (top right). The
images are oriented north up, east left, and are approximately 1 arcminute in height, the location
of Sw 1644+57 is indicated with arrows. The lower panels show zoomed in regions of our later
time observations with HST. The source is unresolved in our WFC IR (F160W) imaging (bottom
right), and is likely dominated by light from the transient. In contrast the source is clearly
resolved in our WFC UVIS (F606W) imaging (bottom left, 1 arcsecond across), and contains at
most a 30% contribution from the transient. This image also shows our astrometric constraints
on the location of Sw 1644+57 upon its host. The cross hair indicates the optically derived
centroid of the host galaxy. The blue circle shows the location of the transient inferred from
our WFC IR observations, while the larger green circle shows the offset (due to the systematic
uncertainty in tying coordinate frames) from our VLBI position. All available positions for the
transient light are consistent with the center, and thus potentially the nucleus, of the galaxy.
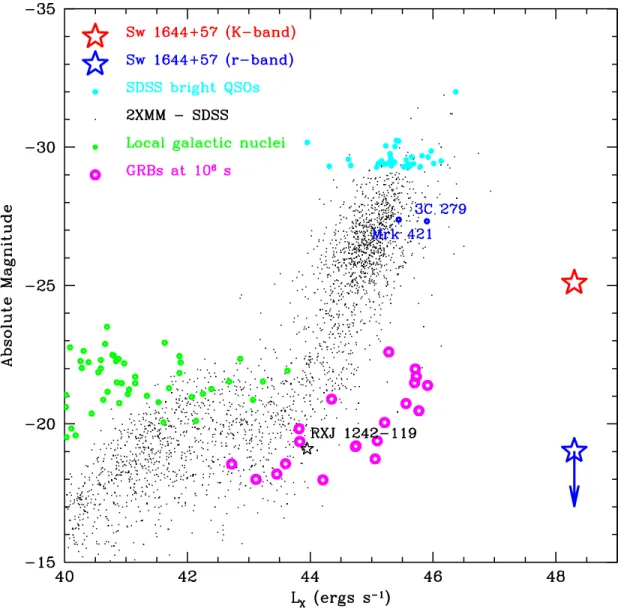
Figure 4: The uniqueness of transient Sw 1644+57. The plot shows the peak X-ray luminosity
and optical/nIR absolute magnitude of Sw 1644+57, in comparison to the properties of the
most luminous quasars and blazars (3C 279 and Mrk 421, marked). We show for comparison
a sample of all objects within the 2XMM survey with high confidence (> 2σ) association with
objects in SDSS of known redshift < 3 (based on (26)) and a sample of more local galaxies
[from (27), note optical magnitudes include contribution from the host galaxy]. We also plot
the late time luminosity of a sample of bright GRB afterglows (extrapolated from (15, 28)),
which are relevant since Sw 1644+57 stays within an order of magnitude of its brightest peak,
even 10
6seconds after the outburst began. Finally, we also plot the location of the candidate
Supplemental Online Material
:
“An extremely luminous panchromatic outburst from
the nucleus of a distant galaxy”
We adopt cosmological parameters of H0 = 73 km s−1Mpc−1, ΩΛ = 0.73 and Ωm = 0.27. At a redshift of z = 0.3534, the luminosity distance is 1814.8 Mpc and 1 arcsec represents 4.803 kpc in projection. These are identical parameters to those used in our companion paper (1)
1
The uniqueness of Sw 1644+57
In the main text we argue (in particular in Fig. 4) that Sw 1644+57 does not belong to any known class of high-energy transient sources, and therefore represents a novel astrophysical phenomenon. Here, we provide further justification of this claim by comparing Sw 1644+57 to other luminous optical, X- and γ-ray sources, in particular gamma-ray bursts (GRBs) and active galactic nuclei (AGN).
1.1
Comparison with gamma-ray bursts
A relatively wide variety of astrophysical sources are capable of generating sufficiently bright outbursts of high-energy radiation to trigger the current generation of gamma-ray satellites. These sources span an incredible range of the observable universe, from electrical discharges associated with thunderstorms on Earth (2) to the deaths of the earliest known stars (3, 4).
The association of Sw 1644+57 with a galaxy at z = 0.3534 immediately rules out all but the most luminous of these gamma-ray outbursts. While repeated high-energy triggers and rapid X-ray variability at late times have been seen before in events discovered by the Swift satellite1, these sources are not known to generate anywhere near the total energy release observed from Sw 1644+57 (Eiso≈ 1053erg).
Gamma-ray bursts (GRBs) are the most luminous class of these high-energy transients (Liso≈ 1050–1052erg s−1), and Sw 1644+57 was initially classified as a long-duration [i.e., resulting from massive star core-collapse (9)] GRB (10). But two important properties distinguish Sw 1644+57 from long-duration GRBs2, clearly establishing it as a distinct class of high-energy transient.
First, unlike soft gamma-ray repeaters, long-duration GRBs are destructive events. The duration of the prompt gamma-ray emission, dictated by stellar debris accreting onto the newly-formed compact object, is typically ∆t ∼ 1–10 s. While late-time (t ∆t) engine activity can manifest as bright X-ray flares (11), no long-duration GRB has ever caused subsequent gamma-ray triggers of the Swift satellite in the manner of Sw 1644+57. The dramatically different timescale associated with the “prompt” emission (4 triggers over a period of 48 hours) is strongly suggestive of a distinct origin from long-duration GRBs.
In addition to the longer time scale associated with the gamma-rays, the X-ray (0.3–10 keV) emission from Sw 1644+57 is quite unlike any known GRB afterglow. In Figure 5 we compare the X-ray light curve of Sw 1644+57 with a representative sample of long-duration GRBs. While many GRBs exhibit an extended period of relatively flat emission [the so-called “plateau” phase (12)], no other long-duration GRB declines so little over the first ∼ 2 weeks of its evolution. The long-lived light curve also makes the late-time emission significantly 1For example, soft gamma-ray repeaters (5) can generate multiple high-energy triggers, and the unusual Galactic transient GRB 070610 exhibited dramatic X-ray and optical flaring not typically seen from gamma-ray bursts (6–8).
2Given the extreme duration and large luminosity, we also consider it extremely unlikely Sw 1644+57 is a member of the short-duration class of GRBs.
more luminous than normal long-duration GRBs. Together, the longer time scales associated with both the X-ray and gamma-ray emission, as well as the large X-ray luminosity, are indicative that a significantly more massive black hole is responsible for the observed emission from Sw 1644+57 [an idea explored in detail in our companion paper (1)].
Finally, we note that the astrometric coincidence with the center of the host galaxy is relatively unique amongst long-duration GRBs (at least those with observed with sufficiently high angular resolution). Given their association with star formation, it is not surprising that in general the location of long-duration GRBs is highly correlated with host galaxy light (in particular the blue light generated by massive stars (13, 14)). It is nonetheless unusual (though not unprecedented) for a long-duration GRB afterglow observed with the exquisite angular resolution of HST to be astrometrically consistent with the nucleus of its host galaxy.
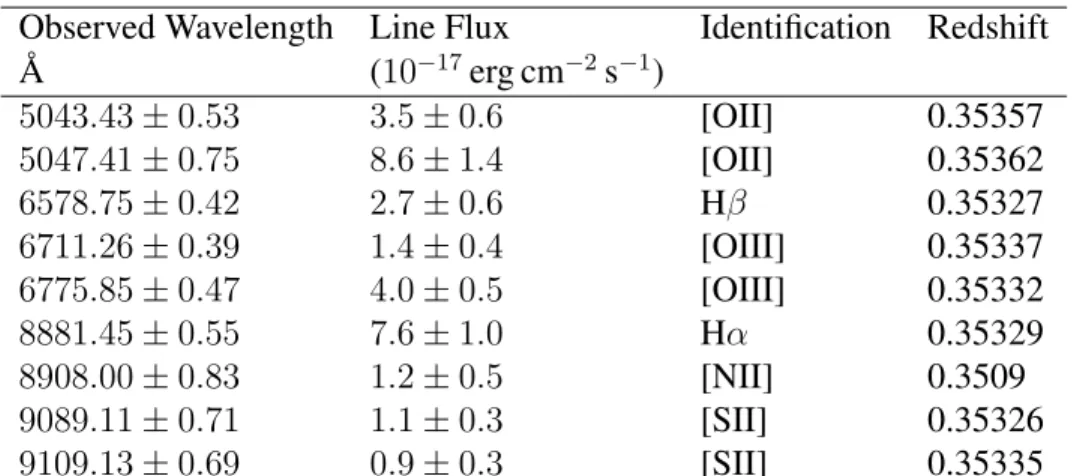
Figure 5: A comparison of the properties of Sw 1644+57 with those of GRB afterglows [from
(15)]. The left hand panel shows a logarithmic time and flux axis, since GRBs usually decay as
powerlaw’s. The right hand panel shows the same plot, but with a linear time axis. It is clear
that Sw 1644+57 is much longer lived than any GRB engine yet observed, and is two orders of
magnitude brighter (in flux) at 10
6s than observed for the brightest GRBs. No other GRB at
similar redshift has ever appeared so bright at late times, and the afterglow of Sw 1644+57 is
also a factor of 10-100 brighter in luminosity at late times than the brightest GRBs (see Figure
4, main article).
1.2
Comparison with active galactic nuclei
Given the long lived nature of the emission, and its location in the core of the host galaxy, it is also relevant to consider the comparison to the different manifestations of active galactic nuclei (AGN). The majority of AGN (e.g. LINERS, Seyferts, etc.) are of moderate X-ray and optical luminosity, and in this respect are not comparable to an exceptionally bright object like Sw 1644+57. The brighter AGN are the luminous quasars, and the blazars. These can reach X-ray luminosities approaching 1046erg s−1, with corresponding optical absolute magnitudes of
−30 or brighter. Furthermore, the blazars are intrinsically the most variable AGN, and can show rapid ∼ 2 factor variation in their lightcurves. However, Sw 1644+57 exhibits much more rapid variability, of order a factor of 100 in just a few hundred seconds, and is also reaches peak luminosity in excess of 1048ergs s−1. This is shown graphically in Figure 4 of the main text where we compare the X-ray luminosity and optical absolute magnitude of Sw 1644+57 against those of QSO, Blazars, other AGN and GRB afterglows 106seconds post burst. As can be seen, Sw 1644+57 stands apart from any object previously observed, and leads us to conclude we are dealing with a previously unobserved, and extremely energetic phenomenon.
2
Observations
2.1
Pre-event imaging
2.1.1
Palomar Transient Factory (PTF)
As part of the Palomar Transient Factory [PTF (16, 17)], pre-outburst optical (R-band) imaging of the field of Sw 1644+57 were obtained with the Palomar 48 inch Oschin Schmidt telescope over the time period from 2009 May to 2010 October. In a stacked frame of all available data (77 individual images), we find a faint, unresolved source at location α = 16h44m49.983s, δ = +57◦34059.720(J2000.0). Astrometry was performed relative to 23 objects from the 2MASS point source catalog (18). The uncertainty in this position, including both the statistical error in the centroiding process and systematic error from the astrometric tie, is ≈ 250 mas in each coordinate. Using stars in the field calibrated via our LRIS imaging, we measure a magnitude of R = 22.09 ± 0.26. This is marginally brighter than the value derived from our post-outburst imaging; however, given the somewhat different filters and the large uncertainty in this measurement, we do not consider this discrepancy particularly significant.
2.1.2
Wide-field Infrared Survey Explorer (WISE)
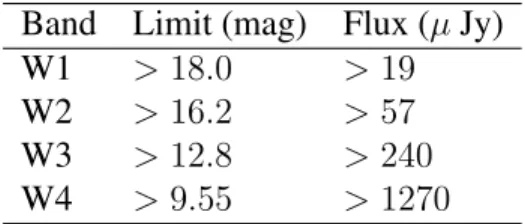
In addition to the optical imaging described above, the location of Sw 1644+57 was observed by the Wide-field Infrared Survey Satellite (WISE) (19) between 25 - 28 Jan 2010. Observations were obtained in each of the 3.4, 4.6, 12 and 22 micron bands (W1–4 respectively), with a total of 39 individual images per band included in each filter co-add. The resulting limits are shown in Table 1. These images suggest the host galaxy itself is not extremely red, and confirm that the vast majority of the flux in our mid-IR measurement (see below) is originating in the afterglow.
Table 1: Catalog of WISE observations
Band
Limit (mag)
Flux (µ Jy)
W1
> 18.0
> 19
W2
> 16.2
> 57
W3
> 12.8
> 240
W4
> 9.55
> 1270
2.2
Optical imaging
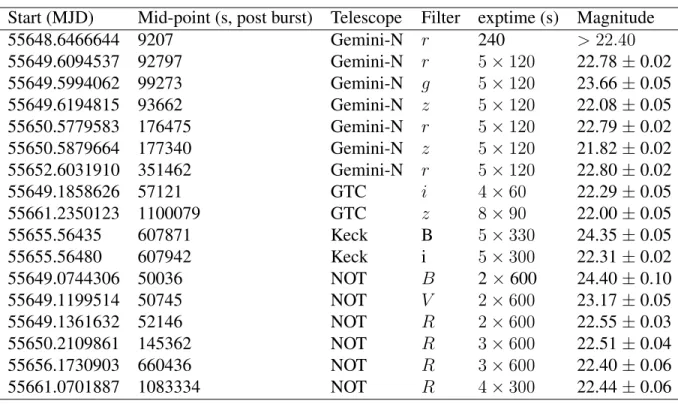
We obtained extensive optical imaging of Sw 1644+57 using the Gemini-North Telescope, the Nordic Optical Telescope (NOT), the Gran Telescopio CANARIAS (GTC) and the Keck I telescope. A log of optical observations
Start (MJD)
Mid-point (s, post burst)
Telescope
Filter
exptime (s)
Magnitude
55648.6466644
9207
Gemini-N
r
240
> 22.40
55649.6094537
92797
Gemini-N
r
5 × 120
22.78 ± 0.02
55649.5994062
99273
Gemini-N
g
5 × 120
23.66 ± 0.05
55649.6194815
93662
Gemini-N
z
5 × 120
22.08 ± 0.05
55650.5779583
176475
Gemini-N
r
5 × 120
22.79 ± 0.02
55650.5879664
177340
Gemini-N
z
5 × 120
21.82 ± 0.02
55652.6031910
351462
Gemini-N
r
5 × 120
22.80 ± 0.02
55649.1858626
57121
GTC
i
4 × 60
22.29 ± 0.05
55661.2350123
1100079
GTC
z
8 × 90
22.00 ± 0.05
55655.56435
607871
Keck
B
5 × 330
24.35 ± 0.05
55655.56480
607942
Keck
i
5 × 300
22.31 ± 0.02
55649.0744306
50036
NOT
B
2 × 600
24.40 ± 0.10
55649.1199514
50745
NOT
V
2 × 600
23.17 ± 0.05
55649.1361632
52146
NOT
R
2 × 600
22.55 ± 0.03
55650.2109861
145362
NOT
R
3 × 600
22.51 ± 0.04
55656.1730903
660436
NOT
R
3 × 600
22.40 ± 0.06
55661.0701887
1083334
NOT
R
4 × 300
22.44 ± 0.06
Table 2: Optical photometry of Sw 1644+57, obtained from Gemini-N, the GTC and the NOT.
is shown in Table 2. The data were all processed through IRAF in the normal way, and magnitudes and fluxes were extracted via aperture photometry of the source in comparison to objects in the field. Photometric calibration was based on standard stars, observed by the Nordic Optical Telescope, and confirmed by comparison to published zeropoints for our Gemini-North observations.
To search for variability we performed point spread function matched image subtraction, using the ISIS pack-age (20). To obtain the cleanest subtractions we limit ourselves to impack-ages taken from the same telescope on differ-ent nights. Since each telescope offers a reasonable time baseline this enables us to search for optical variability over the course of the first week post burst.
In our optical (r- and R-band) imaging there is no evidence for any variable source within the host galaxy of Sw 1644+57, with the most constraining limits coming from our Gemini observations. To estimate the limiting magnitude of these subtractions we seed our first epoch images with artificial point spread functions of known magnitude, and use these to photometrically calibrate our subtracted images. From this we estimate that any vari-able source within the host of Sw 1644+57 had a magnitude fainter than r > 25.5 (3σ), in our earliest observations. This evidence does not necessarily preclude the presence of an optically variable transient which contributes sim-ilar flux to all epochs over our range of observation to date, however, it suggests that the variation in the flux between the observations was < 0.23 µJy.
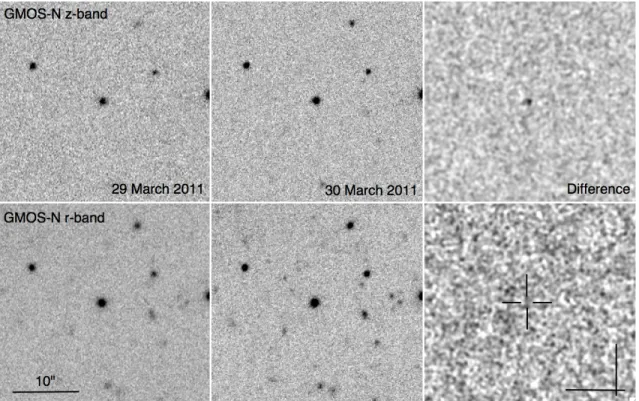
While our r-band observations do not yield any evidence of transient emission, we clearly detect a variable source in our z-band imaging, as shown in Figure 6. The source is seen to brighten between our first and second epoch of z-band observations which were taken 26 and 49 hours after the initial outburst. The X-ray lightcurve over the same time period is also seen to brighten, although by a much larger amplitude.
Figure 6: Our Gemini/GMOS imaging of Sw 1644+57. The top panels show of z-band imaging
obtained on 29 and 30 March 2011, and the result of a PSF matched image subtraction. The
bottom panels represent the same, but for our r-band imaging. In the z-band we clearly see
residual emission, brightening between the two observations. In the r-band, no such variation is
obvious, consistent with Sw 1644+57 originating on a highly dusty sightline which diminishes
the transient optical flux. Images are North up and East to the left
2.3
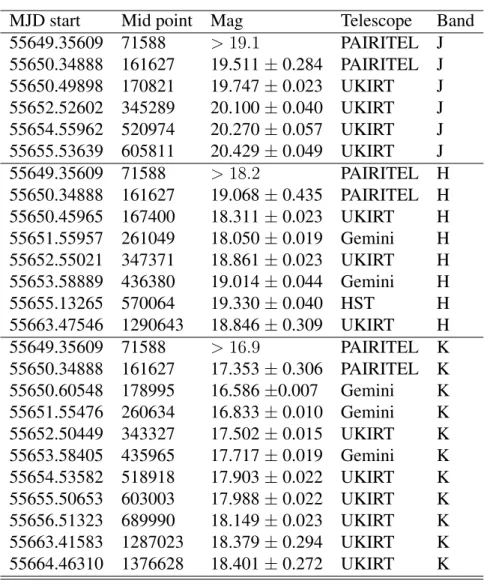
Infrared imaging
We obtained IR observations of Sw 1644+57with PAIRITEL, UKIRT and Gemini-North. A log of observations is shown in Table 3. The PAIRITEL and UKIRT observations were both pipeline processed using dedicated, instrument specific pipelines. The Gemini-North data were reduced using the standard NIRI package within IRAF. Photometric calibration was taken relative to 2MASS, and the resulting photometry is shown in Table 3.
We additionally obtained thermal IR observations of Sw 1644+57 with NIRI in the L-band. For this we used the 30 co-adds of 1 s exposures at each of 58 random dither positions, and used the f/32 camera to avoid saturation. Unfortunately in this imaging both the science and standard observations (of FS 138) showed substantial elongation of the point spread function. However, we were able to extract detection of the afterglow of Sw 1644+57. This provides a magnitude of L0 = 14.9 ± 0.2 (vegamag), or, correspondingly a flux of 0.27 ± 0.05 mJy at 3.78 microns.
2.4
Limits on rapid variability
We obtained 81, 20-second observations of Sw 1644+57in the i-band with OSIRIS on the GTC on 30 March 2001. We can use these to place limits on any rapid variability within the optical data, similar to that observed in the X-rays. Photometry of the counterpart relative to two comparison stars in the image, shows no sign of variability
MJD start
Mid point
Mag
Telescope
Band
55649.35609
71588
> 19.1
PAIRITEL
J
55650.34888
161627
19.511 ± 0.284
PAIRITEL
J
55650.49898
170821
19.747 ± 0.023
UKIRT
J
55652.52602
345289
20.100 ± 0.040
UKIRT
J
55654.55962
520974
20.270 ± 0.057
UKIRT
J
55655.53639
605811
20.429 ± 0.049
UKIRT
J
55649.35609
71588
> 18.2
PAIRITEL
H
55650.34888
161627
19.068 ± 0.435
PAIRITEL
H
55650.45965
167400
18.311 ± 0.023
UKIRT
H
55651.55957
261049
18.050 ± 0.019
Gemini
H
55652.55021
347371
18.861 ± 0.023
UKIRT
H
55653.58889
436380
19.014 ± 0.044
Gemini
H
55655.13265
570064
19.330 ± 0.040
HST
H
55663.47546
1290643
18.846 ± 0.309
UKIRT
H
55649.35609
71588
> 16.9
PAIRITEL
K
55650.34888
161627
17.353 ± 0.306
PAIRITEL
K
55650.60548
178995
16.586 ±0.007
Gemini
K
55651.55476
260634
16.833 ± 0.010
Gemini
K
55652.50449
343327
17.502 ± 0.015
UKIRT
K
55653.58405
435965
17.717 ± 0.019
Gemini
K
55654.53582
518918
17.903 ± 0.022
UKIRT
K
55655.50653
603003
17.988 ± 0.022
UKIRT
K
55656.51323
689990
18.149 ± 0.023
UKIRT
K
55663.41583
1287023
18.379 ± 0.294
UKIRT
K
55664.46310
1376628
18.401 ± 0.272
UKIRT
K
over the time baseline of the observations. Given the non-detection of any afterglow emission in the deep r-band images taken with Gemini-N the non-detection of rapid variability within these images is not surprising.
In addition, the short timescales for IR observations naturally lend themselves to studies of short time scale variation. We therefore photometer our individual NIRI frames separately, and find no evidence for rapid variability during their timeframe.
At first sight this would seem to imply that the IR variations, while tracking the broad shape of the X-ray lightcurve, do not show evidence for rapid variation. However, we note that at the time of our first epoch of NIRI observations (which provide 18x60s resolution) the X-ray afterglow of Sw 1644+57 was also not apparently rapidly variable.
2.5
Optical spectroscopy
We obtained multiple epochs of spectroscopy of Sw 1644+57 using the GTC, Gemini-North and Keck II tele-scopes. Data reduction and analysis of these data is provided below.
The first spectroscopy of Sw 1644+57 was obtained using the OSIRIS instrument on the 10.4m Gran Telesco-pio CANARIAS (GTC), starting 15.7 hours after the burst. We used the R300B grism with a 1 arcsecond wide slit and a 2 × 2 binning, taking three exposures of 1200 seconds starting on 04:43 UT on March 29, 2011. Data were reduced using tasks in IRAF, using calibration data (bias frames, flatfields and arc frames) taken the same night. Flux calibration was done using spectra of standard star Ross 640.
We obtained two epochs of spectroscopy of the transient and its host galaxy using the Gemini Multi-Object Spectrograph (GMOS) on Gemini-North. The first spectrum was taken using the R400 grating with a 1.000 slit width and using a standard 2 × 2 binning. Four 600 s exposures were taken, using dithers in spatial and dispersion directions (central wavelengths 6000 and 6050 ˚A), with observations starting at 13:16 UT on March 29, 2011.
The second spectrum was taken using the same grism, slitwidth and binning, but used a central wavelength of 8000 ˚A. Two exposures of 720 s were obtained in the so-called “nod & shuffle” mode to achieve accurate subtraction of nightsky emission lines (21). No dithering in dispersion direction was performed. Observations started 14:51 UT on April 1st, 2011.
The data of both epochs were reduced using the Gemini GMOS data reduction packages within IRAF. Flat-fields and Cu+Ar arc lamp spectra taken just before the science data were used for calibration. Flux calibration was achieved using observations of standard star Hiltner 600 (22) and photometry was used to bring the spectra to an absolute flux scale. Finally, the spectra were corrected for a Galactic reddening of E(B − V ) = 0.02, assuming RV = 3.1.
Finally, we obtained moderate-resolution (R ≡ λ/∆λ ≈ 2500) spectra at the location of Sw 1644+57 with the DEep Imaging Multi-Object Spectrograph [DEIMOS; (23)] mounted on the 10 m Keck II telescope on 2011 March 31 (beginning at 14:55 UT) and 2011 April 4 (beginning at 14:38 UT). The instrument was configured with the 600 lines mm−1grating with a central wavelength of 6900 ˚A (7200 ˚A) on 2011 March 31 (2011 April 4), providing a spectral resolution of 3.5 ˚A (FWHM) and wavelength coverage from ≈ 4500–9500 ˚A. We implement a modified version of the DEEP2 DEIMOS pipeline3to rectify and background-subtract our spectra. The pipeline bias-corrects, flattens, traces the slit, and fits a two-dimensional wavelength solution to the slit by modeling the sky lines. This final step provides a wavelength for each pixel. The slit is then sky subtracted (in both dimensions) and rectified, producing a rectangular two-dimensional spectrum where each pixel in a given column has the same wavelength. From this point we proceed with standard reduction procedures, using the standard star BD+33 2642 for flux calibration. To account for slit losses, we renormalized each spectrum based on the observed R-band magnitude of the optical counterpart (R = 22.6 mag).
Observed Wavelength
Line Flux
Identification
Redshift
˚
A
(10
−17erg cm
−2s
−1)
5043.43 ± 0.53
3.5 ± 0.6
[OII]
0.35357
5047.41 ± 0.75
8.6 ± 1.4
[OII]
0.35362
6578.75 ± 0.42
2.7 ± 0.6
Hβ
0.35327
6711.26 ± 0.39
1.4 ± 0.4
[OIII]
0.35337
6775.85 ± 0.47
4.0 ± 0.5
[OIII]
0.35332
8881.45 ± 0.55
7.6 ± 1.0
Hα
0.35329
8908.00 ± 0.83
1.2 ± 0.5
[NII]
0.3509
9089.11 ± 0.71
1.1 ± 0.3
[SII]
0.35326
9109.13 ± 0.69
0.9 ± 0.3
[SII]
0.35335
Table 4: Optical emission lines from Sw 1644+57 based on our Keck DEIMOS observations.
These line fluxes are also consistent with those inferred from our GTC and Gemini observations.
2.6
Host spectroscopic properties
In our spectra we find nebular emission lines corresponding to [OII] λλ3726,3728, Hβ, [OIII] λλ4959,5007, Hα, [NII] λ6583, and [SII] λλ6716,6731, all at a common redshift of z = 0.3534 ± 0.0002, consistent with previously reported values (24,25). A listing of all well-detected emission lines, with emission fluxes and centroids determined from Gaussian fits, is provided in Table 4, based on measurements from our Keck spectroscopy. The uncertainties in the line fluxes are dominated in nearly all cases by uncertainty in the strength of the continuum emission. All lines are unresolved, both spectrally and spatially, and show no significant evidence of variability between epochs (see Figure 2, main article).
We can estimate the extinction along the line of sight to the source using the observed intensity ratios of host-galaxy Balmer emission lines. We find that (LHα/LHβ)obs = 2.8 ± 0.6. Assuming Case B recombination (26) and the relation from (27), we find E(B − V )gas = −0.01 ± 0.15 mag. Applying the extinction law derived for star-forming galaxies [e.g., (27)], this corresponds a limit on the rest-frame V -band extinction for the stellar continuum of AV < 0.8 mag (3σ).
To determine the origin of these emission lines, we resort to a diagnostic, or BPT diagram [Baldwin, Phillips & Terlevich (28, 29))]. The atoms could be ionised by the hard power-law spectrum generated by gas accretion onto a central SMBH (i.e., an AGN), UV photons from young, massive O and B stars (i.e., star formation), or as part of a phenomenon known as a Low Ionisation Nuclear Emission-line Region [LINER; (30)], which are likely related to AGN, possibly resulting from changes to the geometry of the disc at low accretion levels (e.g., (31)). The observed ratios between various atomic species, since they are highly sensitive to the nature of the ionizing continuum, can be used to distinguish between these alternatives.
In figure 7, (SOM) we plot the ratio of L[O III]λ5009/LHβagainst L[N II]λ6583/LHα. Empirical (32, 33) and theoretical (34) dividing lines between the various classes of objects are plotted, as well as a series of analogous measurements from the MPA/JHU value-added SDSS catalog4. The optical counterpart of Sw 1644+57 clearly falls within the phase space of star-forming galaxies. In other words, there is no evidence for nuclear activity (i.e., an AGN) based solely on the optical spectra (35).
We can calculate the current star formation rate based on the strength of the Hα and [OII] emission lines. Using the calibration from (36), we find SFRHα = 0.3±0.1 M yr−1, and SFR[OII]= 0.7±0.2 M yr−1. Taking the average, we adopt a value of SFR≈ 0.5 M yr−1; the errors above likely underestimate the true uncertainty, as
Figure 7: Diagnostic emission-line diagrams for the optical counterpart of Sw 1644+57. The
empirical dividing line between star-forming and active galaxies from (32) is shown as the
solid line, while analogous dividing lines from (33) are indicated with dashed-dotted lines.
The theoretical dividing line from (34) is plotted as a dashed line. Analogous measurements
for SDSS galaxies from the MPA-JHU value-added catalog are shown as gray dots. The optical
counterpart falls firmly on the locus of star-forming galaxies, with no indication for any previous
nuclear activity (i.e., an AGN).
they do not incorporate any effects of the assumed star-formation calibration.
Using the derived line fluxes from Table 4, we have measured the metallicity of the host galaxy based on our DEIMOS and GMOS spectra following the technique described in (37). Using the scales from (38) (PP04), we find 12 + log(O/H) = 8.38 ± 0.16 based on the N 2 / Hα diagnostic (PP04-N2Hα), and 12 + log(O/H) = 8.43+0.12−0.14 based on the O 3 / N 2 (PP04-O3N2) prescription. Likewise, we find 12 + log(O/H) = 8.60+0.19−0.17on the scale of (34) (KD02), and log(O/H) = 8.53 ± 0.22 on the scale of (39) (M91). Given the most recent estimate of the solar oxygen abundance [log(O/H) = 8.70; (40)], together with the relative robustness of Te-based metallicity scale (41), which the PP04-O3N2 scale is close to, we conclude the host metallicity is Z ≈ 0.5Z . A comparison with SDSS samples of galaxies, as well as those of SN Ib/c and GRBs is shown in Figure 8 (SOM). This suggests that the host of Sw 1644+57 has a typical metallicity for its luminosity.
In addition to emission lines, continuum emission is detected over most of the spectral range, showing many (stellar) absorption features (e.g., G band, Na I, Mg I, Fe I, Ca H + K, Balmer line absorption) characteristic of an older (older than a few hundred Myr) population. To derive the Hβ emission line flux we fit simultaneously the continuum, the stellar absorption component and the emission line flux, where the lines are fit using Gaussians. In the first Gemini spectrum, which has highest signal to noise, we find a restframe equivalent width for the Hβ absorption of 8.2 ± 1.1 ˚A. A similar fit on Hδ is not possible as the signal to noise is too low to reliably characterize the absorption component. A similar fit on Hγ suffers from the presence of residuals from a nearby telluric emission line in the red absorption wing, but a ∼ 4σ detection of absorption was found with restframe equivalent width 11.7 ± 2.4 ˚A.
2.7
Host photometric properties
In principle we can use SED fitting to the observed host photometry to extract measurements of the luminosity of the host of Sw 1644+57 in various wavebands. Of particular importance is the stellar mass, which among the global properties of a galaxy is most closely linked to the size of its the central black hole.
The stellar mass of a galaxy is normally estimated using a measurement of the rest-frame K-band (2 µm) luminosity multiplied by a constant (of order unity in Solar units). Unfortunately, as long as the transient remains bright, a direct measurement of the infrared host flux is impossible. Fortunately, the transient contributes much less to the optical light: the resolved HST F606W observations constrain the contribution of the transient to at most 30% of the light in this filter (see below), and blueward of this band the contribution should be even less. Even in the NIR, the faintest measurement in each filter can be used to place a conservative upper limit on the host-galaxy flux; further constraints are provided by WISE pre-imaging of the field at 3.4 µm. Hence we can fit template models using these values as hard upper limits to allowable IR flux.
In Figure 9, we plot the photometric constraints on the galaxy flux (that is, with the transient light removed) against different models of the stellar SED using the population-synthesis templates of (42). While a diverse set of different models (from young starbursts to evolved, quiescent populations) are nominally consistent with the observations, we can nevertheless bracket the possible range of K-band fluxes and back out a maximum and minimum luminosity. Using a stellar mass-to-light ratio of M∗/LK= 0.4 in Solar units (following (43)) the range of stellar masses consistent with the data is approximately 109− 1010M
.
2.8
Hubble Space Telescope
We obtained Hubble Space Telescope (HST) observations of Sw 1644+57 on 4 April 2011, beginning at 03:03 UT. At this epoch we observed four dithered exposures in F110W in the IR channel of the Wide Field Camera 3, and 3 dithered exposures in the F606W within the UVIS channel. These observations were combined with multidrizzleto provide images with final pixel scales of 0.067 and 0.03300respectively.
The HST images contain two stars that are common to both the 2MASS (18) and UCAC3 (44) catalogs (see table 5). Both of these catalogs have small astrometric errors (≤ 0.0700); we therefore averaged their astrometric
Figure 8: Host-galaxy luminosity (M
B) and host-galaxy metallicity (in terms of oxygen
abun-dance) at the sites of Swift J164449.3+573451 (”Sw 1644+57”), nearby broad-lined SN Ic (SN
Ic-bl: blue circles) and broad-lined SN Ic connected with GRBs (SN-bl/GRB): red squares).
The oxygen abundances are in the (20) PP04-O3N2 scale. Yellow points are values for local
star-forming galaxies in SDSS (25), re-calculated in the (20) scale for consistency, and
illus-trate the empirical luminosity-metallicity (LZ) relationship for galaxies. The host galaxy of Sw
1644+57 is broadly consistent with the bulk of SDSS galaxies at that luminosity. For more
details see (37)
Star
ID
RA (J2000)
Dec (J2000)
A
2MASS 16445096+5735316
16:44:50.964
+57:35:31.64
B
2MASS 16444843+5734057
16:44:48.432
+57:34:05.74
A
3UC 296-121315
16:44:50.965
+57:35:31.69
B
3UC 296-121311
16:44:48.432
+57:34:05.82
Table 5: 2MASS and UCAC3 positions for two stars lying the field of view of our WFC3
UVIS and IR observations, and used for astrometric calibration. The ID’s A and B refer to the
locations of the stars in Figure 10
in the WFC3/UVIS images, the saturation is mild in the WFC3/IR images. Thus centroiding the light will still give a position to an accuracy better than than our drizzled pixel scale of 0.067 arcsec. Additionally it is possible to use the diffraction spikes of a bright star to estimate its location. These two methods agreed, again to a fraction of a drizzled IR pixel. As expected, the orientation and scale of the HST IR image World Coordinate System agreed within the errors with the astrometric positions of the two stars. We therefore used the stars only to update the absolute astrometric reference position of the image and not its orientation or scale. Following this procedure, we obtain a position for the IR source of RA = 16:44:49.9345, Dec = +57:34:59.673 J2000, with an estimated error of 0.0700in each coordinate. Our derived position differs from the VLBA (see below) position by less than 0.0300in both coordinates.
The host galaxy of GRB 110328A is clearly resolved in the HST WFC3 F606W image. The galaxy profile has a full-width half maximum (FWHM) of about 0.1300compared to a FWHM of about 0.08500for stars in the image. To determine a maximum contribution to the host galaxy magnitude from the transient we subtracted scaled stellar point source functions (PSFs) from both the centroid of the galaxy light, as well as from location of the IR source, which in our best estimate lies about 0.01600, from the galaxy centroid. We find that we subtract up to 20% of galaxy light in this manner without causing unreasonable deviations in the galaxy’s light profile. However, a PSF containing ∼ 30% of the galaxy’s light causes clear errors, with depression of the central galaxy flux relative to the surroundings, and thus is a fairly hard upper limit to the total light in the transient. This corresponds to an F606W magnitude of 24.1 AB.
2.9
Chandra X-ray Observatory (CXO)
Following the discovery of the host galaxy of Sw 1644+57 we initiated Target of Opportunity observations with the Chandra X-ray Telescope. These observations were obtained of 4 April 2011, beginning at 02:30 UT, and utilised the High Resolution Camera in imaging mode (HRC-I). Using the standard cleaned event file we extract both images and lightcurves of the data, with the lightcurve shown in Figure 2 of the main paper, in 100s bins. The afterglow of Sw 1644+57 is strongly detected in the images, with a total of ∼ 50, 000 counts obtained over the course of the observation, at a mean count rate of ∼ 3 counts per second. Since the HRC is primarily an imaging and timing instrument we do not create spectra, but instead convert counts to flux by assuming the spectral model from Swift XRT PC mode observations taken at approximately the same epoch.
We additionally perform astrometry between the CXO observations and our ground based Gemini and UKIRT observations. We identify 5 X-ray sources with optical counterparts in our UKIRT/Gemini image, and these are shown in Table 6. We then perform relative astrometry between these images, allowing us to place the position of the X-ray afterglow on the ground based frames with an accuracy of ∼ 0.2500. The resulting position is offset 0.07 ± 0.2500from the centre of the host galaxy, fully consistent with a nuclear origin.
Object
RA(J2000)
DEC(J2000)
Afterglow
16:44:49.905
57:34:59.82
1
16:45:05.036
57:37:41.41
2
16:44:22.354
57:35:43.88
3
16:44:21.893
57:36:15.17
4
16:44:41.285
57:35:04.94
5
16:45:02.019
57:37:40.99
Table 6: The locations of Chandra sources used for optical/X-ray astrometry. The positions are
given in the world co-ordinate system of the Chandra image, but since relative astrometry is
performed, the precise co-ordinates are not important.
2.10
Swift Observations
2.10.1
XRT
In Figure 1 (main article) we plot the X-ray lightcurve of Sw 1644+57 from the Swift-XRT and Chandra. This lightcurve was created following the method described in (15), and retrieved from the online XRT repository5. As noted in the main text the lightcurve is characterized by large scale variability, even at relatively late times after burst the variability is of order a factor 102, on timescales of 1000 seconds. We highlight this in figure ?? (SOM), where we show zoomed in regions around two flares, which occurred on the second day. In particular we have overlayed these flares to a common time axis (by folding with a time period of 34300s) to demonstrate their broad similarity in morphology, especially during the decay.
In order to fit and describe the strong observed spectral variability (45, 46), we divide the XRT spectra into time-contiguous segments, containing > 500 cts (0.3–10 keV). This results in 139 PC mode spectra spanning the time 6.08 ksec to 1372.09 ksec after the BAT trigger and 461 WT mode spectra spanning the time 1.49 ksec to 191.67 ksec after the BAT trigger (with corresponding total exposures of 228.77 ksec and 14.33 ksec, respectively). The spectral reductions and fitting are performed as described in (47).
We find that the time-resolved spectra are well-fit by an absorbed powerlaw model with time-varying nor-malization, absorption column NH, and photon index Γ. The average column in addition to the Galactic value (1.66 × 1020cm−2; (48)) is (1.2 ± 0.1) × 1022at z = 0.35343, and time variations about this value do not appear to be statistically significant. However, the flux and photon index exhibit a strong anti-correlation (see below). The time-average photon index is Γ = 1.80 + / − 0.25, dominated by the PC mode data with an average flux of (1.6 ± 0.9) × 10−10 erg cm−2 s−1. (The quoted flux uncertainty here reflects the flux variation rather than the statistical uncertainty in any given 500 count epoch.) The WT mode data span a higher flux region of the emission ((2.3 ± 1.4) × 10−9 erg cm−2s−1) and have a harder mean photon index of Γ = 1.6 ± 0.2, which is consistent with that measured for the BAT at similar epochs (see below). We note that the BAT lightcurve closely tracks the X-ray lightcurve.
As discussed in Kennea et al. (46) and Bloom et al. (45), the X-ray hardness tracks the X-ray flux. Consistently, we see that the best-fit powerlaw index increases with decreasing flux, with high-flux values corresponding to the quoted value of 1.6 for the WT mode data above and low-flux values just after the bright WT mode X-ray flares of Γ = 3. The spectra in these regions of flux decline can also be well-modelled assuming a (nearly) constant X-ray flux normalization and a fixed, single powerlaw index (e.g., Γ = 1.6), but allowing for an exponential cutoff which starts above the X-ray bandpass and passes into the X-ray bandpass as the source flux declines, reaching Ecut≈ 1 keV. The specific values for these cutoffs depends on the value we fix for Γ.
2.10.2
BAT
In Figure 1 (main article) we also plot the BAT data. These data are taken from the online repository6 and were subsequently re-binned to have S/N= 3 (15-50 keV band). To convert these count rates to fluxes, we jointly fit the overlapping XRT data during the flare region from 2342.8 to 2715.1 ksec. Consistent with BAT only fits from (49) and the XRT-only fits described above, we find the BAT and XRT spectra are jointly described-well (χ2/ν = 587.0253/457) by an absorbed powerlaw spectrum with photon index Γ = 1.62 ± 0.05. The normalization at 1 keV is 0.48 ± 0.03 ± 0.5 mJy, and the inferred column density is NH = 1.50 ± 0.08 × 1022 cm−2(z = 0.3434).
There is modest evidence (3.2 − σ significant; ∆χ2= 9.93 for 1 additional degree of freedom) for a cutoff in the BAT spectrum at νF ν peak energy of Ep71+66−22keV. Using this spectral fit, we the convert the measured BAT count rate to 15-50 keV fluxes, which are overplotted on in Figure 1 of the main journal. This fit does not therefore take into account the fine detail that may be present in the spectral evolution over time, but shows broadly that the BAT flux does trace that seen with the XRT.
2.10.3
UVOT
The Swift-UVOT instrument began observing the field of Sw 1644+57 1482 s after the initial BAT trigger, starting the usual automatic sequence of observations. No optical or ultraviolet counterpart was detected at the location of Sw 1644+57 in either single frames or coadded images (50).
After the first two days, observations were obtained in “filter of the day” mode. We coadded these late-time ob-servations using the HEASOFT v6.10 distribution of the UVOT reduction tools. In particular a single combined frame has been obtained using the uvotimsum task. Upper limits were then obtained with the uvotsource task, following the procedure described by (51) and applying the latest UV filters zero points (52). In Table 7 we report 3σ limits for the bluest UVOT filters.
Time (UT)
Exposure (s)
Filter
Frequency (Hz)
Mag
Flux (mJy)
March 31
11220
white
8.64 × 10
14> 23.94
< 5.13 × 10
−4March 31
11411
u
8.56 × 10
14> 23.00
< 9.05 × 10
−4April 1
20899
uvw1
1.16 × 10
15> 23.27
< 4.37 × 10
−4April 3
15235
uvm2
1.35 × 10
15> 23.05
< 4.65 × 10
−4April 6
13030
uvw2
1.48 × 10
15> 23.26
< 3.66 × 10
−4Table 7: Log of Swift UVOT observations and upper limits
2.11
VLBA Observations
Sw 1644+57 was observed on 1 and 3 April 2011 with the Very Long Baseline Array (VLBA). On both dates, observations began at 0530 UT and continued for 4 hours. Observations were obtained at a sky frequency of 8.4 GHz and with a recording bandwidth of 512 Mbps and correlated in full Stokes mode. The bright, compact source 3C 345 was used to calibrate instrumental delay and phase terms. The ICRS reference source J1638+5720 was used as phase calibrator in a switching cycle of 4 minutes with Sw 1644+57. Observations were also obtained of the nearby compact object J1657+5705 every 30 minutes. A prior amplitude corrections were applied. Calibration of the linear polarization leakage terms was obtained using J1638+5720. Each source was imaged in Stokes I, Q,
and U on both days. We also merged together visibility data from both dates and produced joint images. We show an image of the source in Stokes I and in polarized intensity in Fig. 12.
In Table 8 we summarize the results for GRB 110328A. We include results for each date and for the merged data. Columns give (1) the epoch of observation; (2) synthesized beam size; (3) seconds of right ascension; (4) arcseconds of declination; (5) flux density; (6) polarization fraction (2σ upper limit); and (7) rms fractional variations on hourly timescales (2σ upper limit). The coordinates are given relative to the position of (16h44m, +57◦34’).
The source is point-like in all three images, implying an upper limit to the size of ∼ 1 mas. The compact source size confirms the non-thermal nature of the source and can be used to argue for relativistic motion (1). The source is constant in flux density between the two epochs and there is no evidence for variability on shorter timescales at a level of 17%. No linear polarization is detected with a 2σ upper limit of 2.7% in the merged data.
The positions are relative to the ICRS position of J1638+5720, 16h38m13.s4563 57◦20’23.”979. Formally, the position of the source changes by 177 ± 45 microarcsec and 73 ± 47 microarcsec between the two epochs. These differences are likely dominated by systematic errors, thus we do not believe the data require significant proper motion. Refined analysis including use of updated Earth orientation parameters may permit us to reduce systematic errors, and several further epochs are planned over the coming months. For reference note than an apparent motion of 10c will be produce an offset of 174 microarcsec in 100 days.
2.12
Westerbork Synthesis Radio Telescope
We additionally obtained observations with the Westerbork Synthesis Radio Telescope (WSRT) at 1.4 and 4.8 GHz. We used the Multi Frequency Front Ends (53) in combination with the IVC+DZB back end in continuum mode, with a bandwidth of 8x20 MHz. Gain and phase calibrations were performed with the calibrators 3C 48 and 3C 286. The observations have been analysed using the Multichannel Image Reconstruction Image Analysis and Display (MIRIAD) (54) software package. We observed the source at three epochs, the first observation was carried out at 4.8 GHz, and the other two at both 1.4 and 4.8 GHz. A log of these observations and the resulting fluxes are shown in Table 9.
2.13
IRAM
The IRAM Plateau de Bure Interferometer [PdBI, France (55)] observed the Sw 1644+57 source on 31 March (22:10 UT - 1 Apr 00:35 UT) at 102.5 GHz, using its compact 5-antenna configuration. The counterpart was detected on the phase centere co-ordinates within the 3.36 x 2.30 arcsec (98.44 deg) primary beam of the antennas. The flux density measurement yielded 20.8 ± 0.1 mJy.
Acknowledgements
A.J.L. and N.R.T. acknowledge support from STFC. Swift, launched in November 2004, is a NASA mission in partnership with the Italian Space Agency and the UK Space Agency. Swift is managed by NASA Goddard. Penn State University controls science and flight operations from the Mission Operations Center in University Park, Pennsylvania. Los Alamos National Laboratory provides gamma-ray imaging analysis. S.B.C. acknowl-edges generous support from Gary and Cynthia Bengier, the Richard and Rhoda Goldman Fund, NASA/Swift grant NNX10AI21G, NASA/Fermi grant NNX1OA057G, and NSF grant AST-0908886. A.J.vdH. was supported by NASA grant NNH07ZDA001-GLAST. GL is supported by a grant from the Carlsberg foundation. M.M. is supported by the Hubble Fellowship grant HST-HF-51277.01-A, awarded by STScI, which is operated by AURA under NASA contract NAS5-26555. The Dark Cosmology Centre is funded by the DNRF. This work makes use of data obtained by the Chandra X-ray Observatory (OBSID = 12920). Based on observations made with
![Figure 5: A comparison of the properties of Sw 1644+57 with those of GRB afterglows [from (15)]](https://thumb-eu.123doks.com/thumbv2/123doknet/14781708.596854/17.918.140.778.377.687/figure-comparison-properties-sw-grb-afterglows.webp)
![[PDF] Débuter pas à pas en Algorithme cours et exercices corriges | Cours informatique](data:image/gif;base64,R0lGODlhAQABAIAAAP///wAAACH5BAEAAAAALAAAAAABAAEAAAICRAEAOw==)