HAL Id: insu-01769812
https://hal-insu.archives-ouvertes.fr/insu-01769812
Submitted on 5 Jul 2018HAL is a multi-disciplinary open access archive for the deposit and dissemination of sci-entific research documents, whether they are pub-lished or not. The documents may come from teaching and research institutions in France or abroad, or from public or private research centers.
L’archive ouverte pluridisciplinaire HAL, est destinée au dépôt et à la diffusion de documents scientifiques de niveau recherche, publiés ou non, émanant des établissements d’enseignement et de recherche français ou étrangers, des laboratoires publics ou privés.
Supercritical river terraces generated by hydraulic and
geomorphic interactions
Edwin R.C. Baynes, Dimitri Lague, Jean-Jacques Kermarrec
To cite this version:
Edwin R.C. Baynes, Dimitri Lague, Jean-Jacques Kermarrec. Supercritical river terraces generated by hydraulic and geomorphic interactions. Geology, Geological Society of America, 2018, 46 (6), pp.499-502. �10.1130/G40071.1�. �insu-01769812�
1 Supercritical river terraces generated by hydraulic and geomorphic interactions
1
Edwin R.C. Baynes*, Dimitri Lague, and Jean-Jacques Kermarrec 2
Univ Rennes, CNRS, Géosciences Rennes - UMR 6118, 35000 Rennes, France 3
*E-mail address: [email protected] 4
5
ABSTRACT 6
The alternating cycle of valley widening through lateral erosion (‘strath planation’) and valley 7
narrowing through vertical incision into bedrock (‘strath terrace abandonment’) due to 8
variations in sediment supply (Q¬s) relative to river transport capacity (Qsc) is a common 9
feature in many mountainous environments, yet our understanding of the mechanics of the 10
processes that drive this landscape change remains poorly quantified. Here, we used an 11
experimental and numerical study to identify the geomorphic and hydraulic controls driving 12
the response of mixed bedrock-alluvial rivers to variable sediment supply, water discharge 13
and tectonic tilting. The experimental channels exhibit a multi-stage response of channel 14
narrowing, stripping of the alluvial cover in a downstream migrating incision wave followed by 15
destabilization of the bed and development of a single vertical step in the bed profile 16
(‘knickpoint’) when the hydraulic conditions are supercritical. In our experiments headward 17
erosion by knickpoints is the most efficient process of strath terrace abandonment, 18
contributing the majority of the total vertical incision in a short period of time. We show 19
experimentally, that knickpoint developing under supercritical flow conditions, driving the 20
rapid response of fluvial systems to upstream perturbations in Qs/Qsc despite no base-level 21
fall. This has implications for the understanding of distributions of strath terrace ages, the 22
inference of baselevel variations from knickpoint propagation, and how landscapes respond 23
to climatic or tectonic perturbations. 24
INTRODUCTION 25
Past cycles of global climatic change have had consequences for the hydrological regime 26
and the pattern of sediment production and transport within landscapes (Schumm and 27
Parker, 1973; Fuller et al., 2009; Wobus et al., 2010). The balance between the flux of 28
sediment entering a mixed bedrock-alluvial river (Qs) and the capacity of the river to 29
transport that sediment (Qsc) is important in setting the landscape morphology, such as the 30
generation and preservation of flights of strath terraces above the active channel (e.g., 31
Pazzaglia et al., 1998; Wegmann and Pazzaglia, 2002). 32
2 Several mechanisms have been proposed for the generation of strath ‘terraces’, including 33
climate driven oscillations in Qs/Qsc resulting in valley widening (high Qs/Qsc) or vertical 34
incision (low Qs/Qsc) (Bull, 1990; Hancock and Anderson, 2002). The presence of strath 35
terraces within a fluvial system have also been shown to result from headward incision by 36
‘base-level knickpoints’ initiated by fault throw or tectonically driven base level fall (Finnegan, 37
2013; Finnegan and Balco, 2013), unsteady lateral river erosion (Limaye and Lamb, 2016), 38
bedrock structure (Wohl, 2008), the cutoff and migration of river meander bends (Finnegan 39
and Dietrich, 2011), sea level highstands (Merritts et al., 1994), river capture (Stokes et al., 40
2002). The influence of tectonics in generating strath terraces is usually limited to the 41
consideration to the initiation of headward migrating incision waves (e.g., Finnegan 2013), 42
while the impact of regional landscape tilting is rarely considered. A clear identification of the 43
mechanism of strath terrace formation is important for the interpretation of the presence and 44
pattern of strath terraces within a landscape to date past climate changes (e.g., Fuller et al., 45
2009; Stokes et al., 2017), estimate fluvial incision rates (e.g., Lavé and Avouac, 2001), or to 46
help calibrate empirical models of fluvial erosion (Finnegan, 2013). However, a universal 47
model of strath terrace formation is currently limited by an incomplete understanding of the 48
mechanics of vertical and lateral erosion in bedrock and difficulties in identifying the erosional 49
pattern during the response of channel processes to perturbations in Qs/Qsc from preserved 50
strath terrace age distributions. 51
Here, we present a physical modeling study that explores the mechanisms of channel 52
response and resulting terrace geometry to three scenarios of perturbations to Qs/Qsc. The 53
first two experiments explore the response of a channel following a sudden perturbation to 54
Qs/Qsc from the same initial conditions while the third explores the impact of a gradual 55
decrease in Qs/Qsc, through progressive tilting of the experiment. The experiments identify 56
patterns of erosional response including the resulting preserved terrace morphology, aiding 57
the interpretation of terrace age distributions in natural landscapes for purposes such as the 58
reconstruction of climate or tectonic histories (e.g., Fuller et al., 2009; Stokes et al., 2017) 59
60
EXPERIMENTAL SETUP 61
Experiments have been used extensively to explore the dynamics of bedrock channels, 62
including abrasion processes (e.g., Johnson and Whipple, 2007), the dynamics of bedrock 63
plucking (e.g., Dubinski and Wohl, 2013), the mechanics of waterfall erosion in homogenous 64
bedrock (e.g., Baynes et al., 2018), and landscape stability (e.g., Hasbargen and Paola, 65
2000). We used the 80 cm long, 30 cm wide and 20 cm deep Bedrock River Experimental 66
Incision Tank at the Université de Rennes (Fig. 1; S1), with an initial configuration of a thin (2 67
3 cm) layer of well-sorted sand (grain size = 250 µm) overlying homogenous silica paste (grain 68
size = 45 µm). The cohesive silica paste material is commonly used to represent bedrock 69
and is eroded by hydraulic shear under clear water flow in the absence of sediment (e.g., 70
Turowski et al., 2005; Turowski et al., 2006; Turowski, 2007) and the experimental channels 71
in this study exhibit a similar hydraulic scaling of width and slope to natural bedrock rivers 72
(Baynes et al., 2018). No direct scaling between our experiments and a particular target 73
natural system is sought but the behavior of the experiment is similar to that observed in 74
natural systems, allowing the dynamics of processes and their controls to be explored 75
quantitatively (Hooke, 1968; SI Section 1). 76
Constant input water discharge, set within 2% by a regulated pump on the inflow pipe, was 77
fed into a reservoir upstream of the inlet, and sediment was added using a Gericke infinite 78
screw feeder system. The channel outlet elevation was fixed, although it was free to migrate 79
across the width of the box, and sediment was collected in a reservoir beyond the outlet to 80
avoid deposition in the channel as a result of the outlet. The same initial conditions for the 81
first two experiments were Q = 1.5 l/min, Qs = 13.33 g/min, slope = 4.5°, selected after 82
previous experiments for the best combination of parameters to generate an alluvial river at 83
equilibrium conditions inset in the sand material. Channel slope, width and depth were free to 84
evolve during the course of the experiment through erosion (vertical and lateral) and 85
deposition. After 37 minutes, once the channel had reached a constant width, one parameter 86
was altered while all others kept constant to represent a sudden shift in Qs/Qsc; experiment 87
1: Qs reduced to 0 g/min, experiment 2: Q doubled to 3 l/min. In the third experiment, Qs and 88
Q were maintained constant throughout but the slope was increased from an initial slope of 89
2.5° at a continuous rate of 1° per hour for 4.7 hours, gradually decreasing Qs/Qsc. A Leica 90
ScanStation 2 Terrestrial Laser Scanner (green laser footprint = 3 mm) was programmed to 91
collect point clouds of the topography every 2 min. The topography was then gridded with a 92
pixel size of 2 mm, and combined with the hydrodynamic model Floodos (Davy et al., 2017), 93
to evaluate the hydraulic conditions within the channel (e.g., Froude number) and to quantify 94
the evolution of the channel geometry (e.g. width and depth) during the experiments (SI 95
Section 2). 96
EXPERIMENTAL RESULTS AND DISCUSSION 97
Changing Qs/Qsc had a significant, rapid and complex impact on the initial stable state 98
(channel width: 150 mm) in the first two experiments. Following the removal of input Qs in 99
experiment 1, an initial narrowing of the channel coincided with a downstream migrating 100
incision wave initiated at the inlet that removed the alluvial cover (Fig. 2A), exposing the 101
bedrock surface to erosion. The removal of input Qs led to Qs/Qsc = 0, providing capacity for 102
4 the flow to entrain and strip the sediment stored in the alluvial bed. Further narrowing of the 103
channel occurred until the bed destabilized into a series of steps (spaced at 25-30 mm with 104
height of 3-5 mm, at t = 83 min) in the bedrock surface that evolved into a single vertical step 105
(15-20 mm in height at t = 111 min) that migrated upstream as a knickpoint, depositing 106
material downstream of the plunge pool (Fig. 2A). The same multi-stage process of 107
downstream stripping of alluvial cover followed by knickpoint development and headward 108
erosion also occurred in experiment 2 where Q was doubled (SI Section 3). The 109
development of steps before the generation of a single knickpoint were not observed in the 110
topographic data from experiment 2 as the channel evolved from downstream stripping to 111
headward erosion within the time period between successive laser scans (t = 120 s; Fig. 112
S5B). Despite this, the knickpoint formed mid-channel in the absence of any base level fall or 113
tectonic uplift. 114
The initial stages of experiment 3 (until t ~100 min) were characterized by an alluvial fan-like 115
regime near the inlet with cone-shaped deposits frequently reworked by high lateral channel 116
mobility (Fig. 2B) while the slope increased (Fig. S5C). As Qs/Qsc decreased, the flow 117
focused into a narrower single thread, triggering the onset of a downstream incision wave of 118
the alluvial cover. Subsequently, a knickpoint developed in the bedrock (t = ~208 min) which 119
retreated upstream in the same manner as the other experiments (Fig. 2B; SI Section 3). In 120
each experiment, the stripping of alluvial cover by the downstream incision wave coincided 121
with a significant narrowing of the channel inset in the alluvial cover, with the narrowest width 122
occurring in bedrock when a knickpoint had formed (Fig. 2B). The channel narrowing 123
associated with the incision of both the alluvial cover and the bedrock led to the 124
abandonment of the formerly active bed at higher elevations, representing the generation of 125
strath terraces seen in natural environments. However, the rates of vertical incision and 126
terrace abandonment were not spatially or temporally constant during the experiments, with 127
the highest local rates of vertical incision associated with the downstream stripping of 128
sediment and the headward migration of the knickpoints through bedrock (Fig. 2B; SI Section 129
4). A similar contribution to total vertical incision by knickpoint migration was identified in 130
Hawai’i (Mackey et al., 2014). 131
The Floodos hydrodynamic model output (SI Section 5; Fig. S10) shows that the sequence of 132
steps, and subsequently the knickpoint, developed in experiment 1 where flow had a Froude 133
number > 1. The Froude number, a dimensionless number defined as the ratio of the inertia 134
forces to gravitational forces, characterizes the transition from subcritical to supercritical flow 135
when Fr > 1. During supercritical flow, interactions between the flow and the bed are 136
inherently unstable (Yokokwa et al., 2013; Izumi et al., 2017; Scheingross and Lamb, 2017), 137
and the development of steps in the bedrock surface occur during our experiments when the 138
5 flow conditions exceed the threshold Froude number for supercritical flow. We therefore refer 139
to these features as ‘supercritical knickpoints’ to distinguish them from ‘base-level 140
knickpoints’. Subsequently, we refer to the terraces generated by the passage of supercritical 141
knickpoints as ‘supercritical terraces’. 142
IMPLICATIONS FOR THE UNDERSTANDING OF NATURAL LANDSCAPES 143
Our experiments provide direct evidence of the hydraulic processes that lead to strath 144
terrace formation following perturbations to Qs/Qsc. Wobus et al. (2010) show that climate 145
change induced incision was associated with a downstream incision wave due to changes in 146
the relative sediment supply to transport capacity, while base-level induced (e.g, river 147
capture, tectonics) incision was characterized by an upstream migrating incision wave. 148
Crucially, our experiments show that channels in homogenous substrate respond to climatic 149
perturbations through a complex multi-stage incision mechanism, containing a downstream 150
(Fig. 3A) and upstream (Fig. 3C) wave component that both generate terraces, in the 151
absence of any base level fall. 152
The multi-stage nature of the incision (Fig. 3) has important implications for studies that use 153
the age of terraces to reconstruct climatic changes (e.g., Fuller et al., 2009) or rates of fluvial 154
incision and tectonic uplift (e.g., Lavé and Avouac, 2001), due to the time transgressive 155
nature of the terraces generated by this response (Zaprowski et al., 2001). During the 156
downstream incision wave, the upstream parts of the alluvium are abandoned first, while the 157
opposite is true during the upstream incision wave, leading to spatially variable terrace ages 158
(Fig. 3D). If it is incorrectly assumed that the entire length of a terrace was abandoned at the 159
same time, the average vertical incision rate calculated from a single terrace abandonment 160
age would be misleading due to the failure to identify the erosion history of an incision wave 161
and the spatially and temporally non-uniform nature of the river incision (Finnegan et al., 162
2014). Strategic sampling of high-resolution point ages from terraces may differentiate 163
between strath terrace formation by vertical incision or knickpoint retreat (e.g., samples 164
collected longitudinally from the same terrace surface; Baynes et al., 2015), allowing 165
accurate interpretation of the mechanisms and triggering perturbations that generated them. 166
Knickpoints in a channel are traditionally interpreted as markers of either local lithological 167
boundaries (e.g., Haviv et al., 2010), a history of base level fall or tectonic uplift rate 168
variability (e.g., Finnegan, 2013), or threshold drainage areas for channel incision (Crosby 169
and Whipple, 2006). However, our experiments indicate that the presence of a knickpoint in a 170
channel with homogenous bedrock and constant baselevel is not necessarily diagnostic of 171
any of these sources as knickpoints are generated following perturbations to Qs/Qsc (Fig. 3). 172
Under normal conditions, flow in large natural alluvial rivers where strath terraces are 173
6 commonly found is subcritical, but above-threshold supercritical flow conditions (Fr > 1) can 174
occur due to a combination of driving factors including channel narrowing with variable width 175
and increased discharge (SI Section 5). Base-level terraces are likely to have the same or a 176
similar slope to the active channel bed through parallel knickpoint retreat (Finnegan, 2013), 177
whereas terraces generated during the multi-stage response identified here are steeper than 178
the active channel (Fig. 2, 3) due to new equilibrium conditions with lower sediment supply, 179
higher discharge or continued tilting. An additional diagnostic link could be the highest 180
terrace having a decreasing abandonment age with distance downstream (Fig. 3D) that does 181
not occur during terrace formation driven by base-level fall. Thus, the morphology of terraces 182
and spatial patterns of abandonment ages can be diagnostic of the processes and forcing 183
perturbations that led to terrace generation and should be considered carefully when 184
analyzing topography for the purpose of understanding and reconstructing past tectonic or 185
climatic histories. 186
CONCLUSIONS 187
Landscapes are able to respond rapidly following climatic or anthropogenic perturbations that 188
switch the erosion processes from one regime to another. The transition from lateral erosion 189
and strath planation to channel narrowing, incision and strath terrace abandonment occurs 190
through a multi-stage process of downstream then upstream incision waves. The headward 191
passage of knickpoints can be initiated even in the absence of base level fall, due to the 192
interaction between the channel bed and supercritical flow conditions. The passage of 193
supercritical knickpoints provide an efficient process for the abandonment of strath terraces, 194
and should be considered when using the presence of strath terraces within landscapes to 195
infer past fluvial incision rates or climatic changes, which may be more spatially and 196
temporally variable than previously thought. 197
ACKNOWLEDGMENTS 198
We thank F. Métivier for the loan of the sediment feeder, P. Davy for providing the Floodos 199
code and T. Croissant for his help with the model runs. We thank J. Scheingross, A. Mather, 200
A. Limaye and an anonymous reviewer for constructive comments that helped improve the 201
final version of this manuscript. The research was funded by Marie Sklodowska-Curie 202
Actions Individual Fellowship No. 703230 (to E.B). 203
REFERENCES 204
Baynes, E.R.C., Attal, M., Niedermann, S., Kirstein, L.A., Dugmore, A.J., and Naylor, M., 205
2015, Erosion during extreme flood events dominates Holocene canyon evolution in 206
7 northeast Iceland: Proceedings of the National Academy of Sciences of the United States of 207
America, v. 112, p. 2355–2360, https://doi.org/10.1073/pnas.1415443112. 208
Baynes E.R.C., Lague D., Attal M., Gangloff A., Kirstein L.A., Dugmore A.J., 2018, River self-209
organisation inhibits discharge control on waterfall migration: Scientific Reports 8, 2444, 210
https://doi:10.1038/s41598-018-20767-6 211
Bull, W.B., 1990, Stream-terrace genesis: Implications for soil development: Geomorphology, 212
v. 3, p. 351–367, https://doi.org/10.1016/0169-555X(90)90011-E. 213
Crosby, B.T., and Whipple, K.X., 2006, Knickpoint intiation and distribution within fluvial 214
networks: 236 waterfalls in the Waipaoa River, North Island, New Zealand: Geomorphology, 215
v. 82, p. 16–38, https://doi.org/10.1016/j.geomorph.2005.08.023. 216
Davy, P., Croissant, T., and Lague, D., 2017, A precipiton method to calculate river 217
hydrodynamics, with applications to flood prediction, landscape evolution models and 218
braiding instabilities: Journal of Geophysical Research. Earth Surface, v. 122, p. 1491–1512, 219
https://doi.org/10.1002/2016JF004156. 220
Dubinski, I.M., and Wohl, E., 2013, Relationships between block quaryying, bed shear stress, 221
and stream power: A physical model of block quarrying of a jointed bedrock channel: 222
Geomorphology, v. 180–181, p. 66–81, https://doi.org/10.1016/j.geomorph.2012.09.007. 223
Finnegan, N.J., 2013, Interpretation and downstream correlation of bedrock river terrace 224
treads created from propagating knickpoints: Journal of Geophysical Research. Earth 225
Surface, v. 118, p. 54–64, https://doi.org/10.1029/2012JF002534. 226
Finnegan, N.J., and Dietrich, W.E., 2011, Episodic bedrock strath terrace formation due to 227
meander migration and cutoff: Geology, v. 39, p. 143–146, https://doi.org/10.1130/G31716.1. 228
Finnegan, N.J., and Balco, G., 2013, Sediment supply, base level, braiding, and bedrock 229
river terrace formation: Arroyo Seco, California, USA: Geological Society of America Bulletin, 230
v. 125, p. 1114–1124, https://doi.org/10.1130/B30727.1. 231
Finnegan, N.J., Schumer, R., Finnegan, S., 2014, A signature of transience in bedrock river 232
incision rates over timescales of 104-107 years: Nature, v. 505, p. 391-394, 233
https://doi:10.1038/nature12913 234
Fuller, T.K., Perg, L.A., Willenbring, J.K., and Lepper, K., 2009, Field evidence for climate-235
driven changes in sediment supply leading to strath terrace formation: Geology, v. 37, p. 236
467–470, https://doi.org/10.1130/G25487A.1. 237
8 Hancock, G.S., and Anderson, R.S., 2002, Numerical modelling of fluvial strath-terrace 238
formation in response to oscillating climate: Geological Society of America Bulletin, v. 114, p. 239
1131–1142. 240
Hasbargen, L.E., and Paola, C., 2000, Landscape instability in an experimental drainage 241
basin: Geology, v. 28, p. 1067-1070, https://doi.org/10.1130/0091-242
7613(2000)28<1067:LIIAED>2.0.CO;2 243
Haviv, I., Enzel, Y., Whipple, K.X., Zilberman, E., Matmon, A., Stone, J., and Fifield, K.L., 244
2010, Evolution of vertical knickpoints (waterfalls) with resistant caprock: Insights from 245
numerical modelling: Journal of Geophysical Research, v. 115, p. F03028, 246
https://doi.org/10.1029/2008JF001187. 247
Hooke, R. 1968, Model Geology: Prototype and Laboratory Streams: Discussion: Geological 248
Society of America Bulletin, v. 79, p. 391–94, https://doi.org/10.1130/0016-249
7606(1968)79[391:MGPALS]2.0.CO;2 250
Izumi, N., Yokokawa, M., and Parker, G., 2017, Incisional cyclic steps of permanent form in 251
mixed bedrock-alluvial rivers: Journal of Geophysical Research. Earth Surface, v. 122, p. 252
130–152, https://doi.org/10.1002/2016JF003847. 253
Johnson, J.P.L., and Whipple, K.X., 2007, Feedbacks between erosion and sediment 254
transport in experimental bedrock channels: Earth Surface Processes and Landforms, v. 32, 255
p. 1048–1062, https://doi.org/10.1002/esp.1471. 256
Lavé, J., and Avouac, J.P., 2001, Fluvial incision and tectonic uplift across the Himalayas of 257
central Nepal: Journal of Geophysical Research, v. 106, p. 26561–26591, 258
https://doi.org/10.1029/2001JB000359. 259
Limaye, A.B.S., and Lamb, M.P., 2016, Numerical model predictions of autogenic fluvial 260
terraces and comparison to climate change expectations: Journal of Geophysical Research. 261
Earth Surface, v. 121, p. 512–544, https://doi.org/10.1002/2014JF003392. 262
Mackey, B.H., Scheingross, J.S., Lamb, M.P., and Farley, K.A., 2014, Knickpoint formation, 263
rapid propagation, and landscape response following coastal cliff retreat at the last 264
interglacial sea-level highstand: Kaua’i, Hawai’i: Geological Society of America Bulletin, v. 265
126, p. 925–942, https://doi.org/10.1130/B30930.1. 266
Merritts, D.J., Vincent, K.R., and Wohl, E.E., 1994, Long river profiles, tectonism, and 267
eustasy: A guide to interpreting fluvial terraces: Journal of Geophysical Research, v. 99, p. 268
14031–14050, https://doi.org/10.1029/94JB00857. 269
9 Parker, G., and Izumi, N., 2000, Purely erosional cyclic and solitary steps created by flow 270
over a cohesive bed: Journal of Fluid Mechanics, v. 419, p. 203–238, 271
https://doi.org/10.1017/S0022112000001403. 272
Pazzaglia, F.J., Gardner, T.W., and Merritts, D., 1998, Bedrock fluvial incision and 273
longitudinal profile development over geologic time scales determined by fluvial terraces, in 274
Wohl, E., and Tinkler, K., eds., Bedrock channels: American Geophysical Union Geophysical 275
Monograph Series 107, p. 207–235, https://doi.org/10.1029/GM107p0207. 276
Scheingross, J.S., and Lamb M.P., 2017, A mechanistic model of waterfall plunge-pool 277
erosion into bedrock, Journal of Geophysical Research. Earth Surface, v. 122, p. 2079-2104, 278
https://doi:10.1002/2017JF004195. 279
Schumm, S.A., and Parker, R.S., 1973, Implications of Complex Response of Drainage 280
Systems for Quaternary Alluvial Stratigraphy: Nature, v. 243, p. 99–100. 281
Stokes, M., Mather, A.E., and Harvey, A.M., 2002, Quantification of river-capture-induced 282
base-level changes and landscape development, Sorbas Basin, SE Spain: Geological 283
Society of London, Special Publications, v. 191, p. 23–35, 284
https://doi.org/10.1144/GSL.SP.2002.191.01.03. 285
Stokes, M., Mather, A.E., Belfoul, M., Faik, F., Bouzid, S., Geach, M.R., Cunha, P.P., 286
Boulton, S.J., and Thiel, C., 2017, Controls on dryland mountain landscape development 287
along the NW Saharan desert margin: Insights from Quaternary river terrace 288
sequences(Dades River, south-central High Atlas, Morocco): Quaternary Science Reviews, 289
v. 166, p. 363–379, https://doi.org/10.1016/j.quascirev.2017.04.017. 290
Turowski J.M., 2007, Controls on bedrock channel morphology: experimental and theoretical 291
investigations and comparison with natural channels, University of Cambridge PhD Thesis 292
(http://ethos.bl.uk/OrderDetails.do?uin=uk.bl.ethos.613289). 293
Turowski J.M., Lague D., Hovius N., Crave A., 2005, Dynamics and steady-state geometry of 294
an experimental channel incising cohesive material; Geophysical Research Abstracts. EGU 295
General Assembly 2005, Apr 2005, Vienna, Austria. European Geosciences Union, 296
pp.EGU05-A-05294, 2005, Vol 7 297
Turowski, J.M., Lague, D., Crave, A., and Hovius, N., 2006, Experimental channel response 298
to tectonic uplift: Journal of Geophysical Research, v. 111, F03008, 299
https://doi.org/10.1029/2005JF000306. 300
Wegmann, K.W., and Pazzaglia, F.J., 2002, Holocene strath terraces, climate change, and 301
active tectonics: The Clearwater River basin, Olympic Peninsula, Washington State: 302
10 Geological Society of America Bulletin, v. 114, p. 731–744, https://doi.org/10.1130/0016-303
7606(2002)114<0731:HSTCCA>2.0.CO;2. 304
Wobus, C.W., Tucker, G.E., and Anderson, R.S., 2010, Does climate change create 305
distinctive patterns of landscape incision?: Journal of Geophysical Research, v. 115, p. 306
F04008, https://doi.org/10.1029/2009JF001562. 307
Wohl, E., 2008, The effect of bedrock jointing on the formation of straths in the Cache la 308
Poudre River drainage, Colorado Front Range: Journal of Geophysical Research, v. 113, p. 309
F01007, https://doi.org/10.1029/2007JF000817. 310
Yokokwa, M., Kotera, A., Kyogoku, A., and Izumi, N., 2013, Cyclic steps by bedrock incision, 311
in Fukuoka, S., et al., eds., Advances in River Sediment Research: The Netherlands, CRC 312
Press, p. 629–633. 313
Zaprowski, B.J., Evenson, E.B., Pazzaglia, F.J., and Epstein J.B., 2002, Knickzone 314
propagation in the Black Hills and northern High Plains: A different perspective on the late 315
Cenozoic exhumation of the Laramide Rocky Mountains, Geology, v. 29, p. 547-550, 316 https://doi:10.1130/0091-7613(2001)029<0547:kpitbh>2.0.co;2. 317 318 FIGURES 319 320
Figure 1. : Example of terraces generated in the experiments. The white surface is the silica 321
paste acting as cohesive bedrock and the brown material is sand, acting as coarse material 322
transported as bedload. Progressive channel incision and channel narrowing leads to the 323
abandonment of the previously active river bed, preserved as strath terraces. Inset shows 324
topographic cross-section from A to A’, with terraces labeled in yellow and orange. 325
11 326
Figure 2. (A). Extracted long profiles during experiment 1. Green line (t = 11 min) shows the 327
profile of the alluvial river, with the subsequent stripping of the sediment cover progressively 328
exposing the bedrock surface within the channel. Black solid line (t = 171 min) shows the 329
final long profile. Grey dashed lines indicate the location of preserved terraces at the end of 330
the experiment. Instabilities form mid-channel, developing into a single knickpoint step that 331
propagates upstream. (1): Initial alluvial channel. (2): Downstream stripping of alluvial cover. 332
(3): Cyclic step development. (4): Knickpoint retreat in headward direction. (B): Evolution of 333
channel width (lines) and rate of vertical elevation change (crosses) through time for the 334
experiments (expt 1 = black, expt 2 = blue, expt 3 = red) at a cross-section 25% distance 335
from the channel inlet. Width is plotted using a 10 point moving average and elevation 336
change is plotted using a 5 point moving average. Dashed vertical lines indicates the timing 337
of the perturbation in experiments 1 and 2 at 37 mins (gray), and the timing of the presence 338
of a knickpoint (colored lines). After the perturbation, there was a reduction in channel width 339
during both experiments 1 and 2. Focusing of the flow into a single thread occurred due to 340
the gradual tilting in experiment 3. There was a short period of channel widening between 341
150 and 175 min associated with the erosion of the sediment deposited at the inlet during the 342
initial stages, unrestricting the flow and inundating a larger area and an apparent increase in 343
the channel width. The highest incision rates are associated with (i) the rapid downstream 344
stripping of sediment and (ii) the headward migration of a knickpoint through bedrock. 345
346
Figure 3. Conceptual model showing the stages of supercritical terrace formation. (A) 347
Downstream stripping of sediment cover following perturbation to Qs/Qsc. (B) Under 348
12 supercritical flow conditions, the channel bed destabilizes into series of cyclic steps. (C) 349
Cyclic steps develop into a ‘supercritical knickpoint’, which migrates in an upstream direction 350
abandoning a ‘supercritical river terrace’. Channel narrows at knickpoint, and widens 351
downstream. (D) Conceptual representation of the elevation of the channel bed and 352
corresponding terraces following response shown in (A-C). Arrows on terraces indicate the 353
direction of the incision wave that abandoned them. The upstream part of T1 is abandoned 354
first by the downstream migrating incision wave, and the downstream part of T2 is 355
abandoned first by the upstream migrating knickpoint. Vertical incision rates calculated from 356
point terraces ages (1–4 and 2–2) provide misleading spatial variation in vertical incision, as 357
the majority of the incision actually occurs through the passage of the supercritical 358
knickpoint. 359
13 Supplementary Information
361
SI Section 1: Relevance of experiments for natural channels and experimental setup. 362
Experimental modelling studies of landscape and fluvial dynamics are typically performed 363
using one of two approaches. The first directly scales the experimental prototype to the 364
natural system by ensuring that non-dimensional hydraulic parameters such as the Froude 365
number are scaled strictly and the physical processes (e.g., sediment transport) are the 366
same in both the experimental and natural systems. The second approach relaxes this strict 367
scaling, and seeks a ‘similarity of process’ between the experiment and the natural channel 368
(Hooke, 1968) whereby the behaviour of the processes within the experiment system are 369
qualitatively similar and ‘reasonably effective’ at replicating the behaviour of natural systems 370
despite large differences in the governing dimensionless numbers (Paola et al., 2009). This 371
second approach has the benefit of allowing temporal and spatial timescales to be relaxed, 372
as materials such as silica cement that is eroded by clear water flow can be used to replicate 373
bedrock, and experiments exploring bedrock erosion processes can be performed relatively 374
quickly. It should be noted that the results from these experiments cannot be directly scaled 375
up to any particular natural system. Additionally, the experimental channel is always ‘active’, 376
and the experiments do not include the periods of time between flood events when the 377
channel is not being eroded, creating a difficulty when exploring relative timescales of 378
geomorphic response between the experiments and natural rivers. However, processes such 379
as flow acceleration above the knickpoint lip, cyclic step development, plunge pool erosion, 380
undercutting of the knickpoint face and channel banks, cantilever failure, erosion and 381
transport of cohesive material by hydraulic shear are present in the experiments. The typical 382
width-depth ratio of the experimental channels at the start of the experiments (alluvial 383
channel conditions) is 50-80, similar to that of natural gravel-bedded rivers (Finnegan et al., 384
2005), and the scaling of the channel width with discharge observed in natural rivers is also 385
reproduced in the experiment. Therefore, we can be confident that the experiments are 386
‘reasonably effective’ in replicating natural processes, and the response of the channels to 387
the perturbations (sediment supply, discharge or slope) in the experiments can help inform 388
the response of natural channels to similar forcing. 389
Figure S1 shows the setup used during our experiments in the Bedrock River Experimental 390
Incision Tank at the Université de Rennes. The initial alluvial cover was composed of well-391
sorted sand (grain size = 250 µm), and the homogenous cohesive silica paste used as a 392
bedrock simulant was composed of 61.5% angular silica, 20.5% spherical beads and 18% 393
water. The silica paste was mixed in a cement mixer before being transferred into the box 394
flume and homogenised using a high frequency vibrating needle to re-liquefy the paste (see 395
14 Baynes et al., 2018 for further details related to the properties of the silica paste and the 396
preparation procedure). Flow in the channel is typically laminar with low Reynolds numbers 397
(< 1000), and is input into the channel through a reservoir and the discharge magnitude 398
controlled using a pump. 399
400
Fig. S1: Photograph of the Bedrock River Experimental Incision Tank at Université de
401
Rennes. The blue arrow shows the flow direction within the channel. 402
SI Section 2: Floodos parameters 403
Floodos is a numerical precipiton-based hydrodynamic model (see Davy et al., 2017 for full 404
technical description of the model), and was used here to assess the hydraulic conditions 405
during the experiments. The input topography for Floodos was produced directly by gridding 406
the point clouds, collected from the terrestrial laser scanner at regular time intervals during 407
the experiments, with a pixel size of 2 mm. Floodos was run using the laminar flow option 408
consistent with the relatively low Reynolds number of the experiment (< 1000) across most of 409
the channel under alluvial conditions (Fig. S2). 410
15 411
Fig. S2: (A) Digital Elevation Model from Experiment 1, when the channel is under fully
412
alluvial conditions (t = 33 minutes). (B) Modelled water depth mask using Floodos 413
hydrodynamic model (Davy et al., 2017). (C) Calculated Reynolds number for each pixel of 414
the flow, using the Floodos model output. 415
416
Under the laminar flow conditions, the local vertically averaged velocity U is approximated 417
by: 418
𝑈 = 𝐶𝐻2𝑆, (S1)
419
where C if a friction coefficient in [L-1.T-1], H is local water depth and S is the local channel
420
slope. Equation S1 is obtained by integrating vertically a laminar flow velocity profile 421
assuming steady-uniform flow. In pure laminar flow, C is entirely set by the water viscosity μ 422
and should be approximately C~ρg/3μ where ρ is water density and g is gravitational 423
acceleration. This predicts that at 10°c, C ~ 2.5 x 10⁶ m-1.s-1. Fig. S2 shows the impact of
424
different values of C on the predicted extent of water flowing over a flat surface compared to 425
manual measurements of the wetted area obtained from a photograph taken from above the 426
experiment (Fig. S3A). The simulations of flow extent are relatively similar for all modelled 427
16 values of C, although lower values of C predict a greater level of overflow on the edges in the 428
downstream part. We therefore used the value of C (2.5 x 10⁶ m-1.s-1) for the simulations
429
presented here, due to good consistency with the manual measurements and the theoretical 430
prediction of the friction coefficient based on the water viscosity for flow over a flat surface 431
(Fig. S3) and for channelised flow (Fig. S4). 432
433
434
Fig. S3: (A) Photograph of water flowing over a flat surface (slope = 3.3o, Q = 1 l/min), with
435
black lines indicating edge of water extent measured manually from the image. Flow is from 436
top to bottom in the image. (B-F) Floodos hydrodynamic model output using laminar flow 437
option and different values of the friction coefficient. Black lines are the same as (A) and 438
shown for comparison of modelled against observed flow extent. The predicted theoretical 439
17 value of the friction coefficient (2.5 x 10⁶ m-1 s-1) has a good match with the observed flow 440
extent. For this value, the lateral areas where overflow occurs have flow depth that are 441
extremely low (< 0.1 mm) and represent a negligible fraction of the total discharge. 442
443
Fig. S4: (A) Photograph of experiment 1 (t = 66 mins), with wetted area indicated by the
444
black bars. Flow is from top to bottom in the image. (B) Floodos model water mask coloured 445
by water depth, using friction coefficient of 2.5 x 10⁶ m-1 s-1, for the same time period overlain 446
over the photograph, with the same black bars from (A). The Floodos water mask closely 447
matches the manual measurements of channel width from the photograph throughout the 448
length of the channel. At the left hand side in the downstream reach, a terrace is starting to 449
be abandoned, hence the very low flow depths in this region. 450
451
SI Section 3: Evolution of channel and terrace geometry during experiments 452
This SI section provides the complete experimental data for the evolution of the channel 453
geometry for each of the three experiments. The long profiles were extracted by finding the 454
point of minimum elevation for each row of the grid (Fig. S5). Terraces were defined from the 455
DEM as flat surfaces (elevation within 1mm) and at least 2 cm wide. The channel cross-456
sections (Fig. S6) were extracted from the data at the location of the grid that was 25% of the 457
distance from the inlet to the outlet of the channel. 458
18 460
Fig. S5: (A-C) Extracted long profiles from the three experiments. (A) Experiment 1, where
461
the input sediment flux was stopped after 37 minutes (80 profiles in total). (B) Experiment 2, 462
where the discharge was doubled to 3 l/min after 37 minutes (61 profiles in total). (C) 463
Experiment 3, where the slope was increased at 1o per 60 minutes from an initial slope of 2o 464
for 280 minutes (132 profiles in total). The colour of the lines indicates the evolution during 465
the experiments. The dashed yellow lines in (C) show the initial slope of the experiment 466
(2.5o), and the projected slope of the channel at the end of the tilting if there had been no
467
erosion of the alluvial cover or bedrock (7.2o). The maximum slope achieved in the channel
468
before the onset of the incision of bedrock was ~4.5o. Grey dashed lines in (A) and (B) 469
indicate the elevation of the bedrock surface at the start of each experiment, to show the 470
transition from alluvial stripping and bedrock incision. The same line is not shown in (C) as 471
the elevation of the bedrock surface changed during the course of the experiment due to the 472
tilting. (D-F) Preserved terrace surfaces at the end of each experiment. Solid lines indicate 473
the long profile of the active channel, and dashed lines indicate the location and elevation of 474
terraces. The slope of the upper terraces is greater than the incised active channel. 475
19 477
Fig. S6: Evolution of channel cross-sections at the 25% position from the water inlet.
Cross-478
sections were extracted from this location to ensure it was located over an area that 479
experienced incision and the development and propagation of a knickpoint. Colours 480
represent the same time points as Fig. S1. It can be seen that channel incision occurred 481
under narrow channel width conditions, followed by lateral erosion of the banks leading to 482
channel widening and minor channel aggradation in experiments 2 and 3. Grey dashed lines 483
in (A) and (B) indicate the elevation of the bedrock surface at the start of each experiment, to 484
show the transition from alluvial stripping and bedrock incision. The same line is not shown in 485
(C) as the elevation of the bedrock surface changed during the course of the experiment due 486
to the tilting. 487
488
SI Section 4: Demonstration of the incisional efficiency of the headward erosion 489
process and width-incision coupling 490
Here, we provide further analysis to demonstrate the bedrock erosional efficiency of the 491
headward migration of knickpoints compared to the vertical erosion by hydraulic shear 492
upstream of the knickpoint lip (Fig. S7). Fig. S7A shows selected long profiles from 493
experiment 1 and Fig. S8B shows the rate of elevation change along the profiles between the 494
20 time steps. The largest rates of bedrock elevation change correspond to the locations and 495
time periods when the knickpoint is migrating upstream. 496
497
Fig. S7: (A) Selected long profiles showing alluvial channel just before sediment supply
498
stopped (t = 37 min; black), channel containing cyclic steps, after sediment has been stripped 499
away from the bedrock profile (t = 83 min; purple) and then three long profiles from different 500
stages of knickpoint retreat (t = 102, 119, 137 min; blue, orange and red, respectively). (B) 501
The variation in rate of elevation change with distance along the channel between the 502
different time steps. The consistently high rate of elevation change from t = 37 minutes to t = 503
83 minutes (purple line) corresponds to the time period when the alluvial cover was being 504 stripped downstream. 505 506 SI Section 5: 507
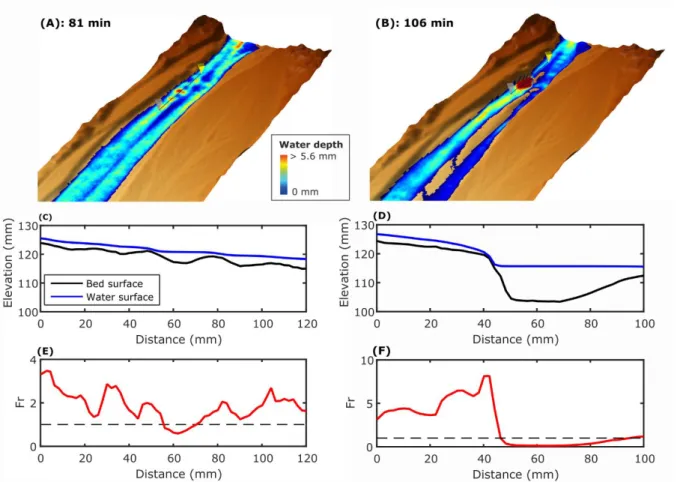
Conditions for cyclic step and knickpoint development 508
21 ‘Supercritical knickpoints’ were generated during the experiments in the absence of any base 509
level fall, after the development of instabilities in the channel bed possibly associated with 510
supercritical flow conditions, when the Froude number (Fr = U/(gH)0.5), is > 1 (Fig. S9; Parker
511
and Izumi, 2000). In this section, we used the Floodos hydrodynamic model output to 512
calculate the Froude number for all locations within the channel (Fig. S8) for selected times 513
of experiment 1 (t = 81 min, when bed instabilities were developing; Fig. S8A, and t = 106 514
min, when a single knickpoint had formed; Fig. S8B). 515
Cyclic steps form under supercritical flow conditions due to an interaction between the 516
channel bed and the flow above it (Izumi et al., 2017), developing a series of steps with 517
transcritical flow that alternates between supercritical and subcritical flow with hydraulic 518
jumps (Fig. S8A). After a single knickpoint formed, a pronounced change in the Froude 519
number and a hydraulic jump is present at the knickpoint lip, with subcritical flow conditions 520
present in the plunge pool downstream (Fig. S8B). The absolute values of Fr are possibly 521
slightly overestimated due to the use of the laminar flow option in Floodos, and some 522
uncertainty related to whether the flow is purely laminar or transitional (Fig. S2). However, 523
the pattern of Fr variation is consistent with cyclic step development as observed and 524
predicted theoretically under supercritical flow conditions (Parker and Izumi, 2000; Izumi et 525
al., 2017). 526
22 528
Fig. S8: Exploration of flow conditions during the development of the self-formed knickpoints.
529
(A-B) Topography during the experiments at selected time steps, with the colours indicating
530
the water depth. (C-D) Profiles for the bed and water surfaces for the reach along the black 531
lines in (A) and (B). (E-F) Extracted Froude number along the same reach as the (C) and (D). 532
533
Supercritical flow in natural rivers 534
Here, we performed a simple test to consider whether supercritical flow conditions can be 535
sustained in natural rivers under steady, uniform flow, by exploring the impact of varying 536
channel width and discharge on the Froude number, assuming a rectangular channel with a 537
constant slope. 538
The flow velocity can be estimated using the Manning’s equation (U = n-1.H2/3. S0.5), where n
539
is the Manning’s roughness coefficient, H is the flow depth, and S is the channel slope. The 540
flow velocity is also given by U = Q / WH, where Q is the discharge and W is the channel 541
width. Substituting these two equations into each other gives the following equation for the 542 flow depth: 543 𝐻 = (𝑛 𝑊𝑄) 3 5 𝑆−103 (S2) 544
23 The Froude number is calculated from the flow velocity, the acceleration due to gravity (g) 545
and the flow depth: (Fr = U/(gH)0.5). Substituting equation S2 into this equation gives the
546
following relationship between the Froude number and the discharge, slope, width and 547
Manning’s roughness coefficient: 548 𝐹𝑟 = 𝑄101 𝑆 9 20 𝑊− 1 10 𝑛− 9 10 𝑔− 1 2 (S3) 549
Eq (S3) shows that in steady uniform flow conditions, the Froude number is mostly sensitive 550
to slope and roughness, with a weak dependency on width and discharge. 551
According to Parker et al., (2007), the channel width and channel slope of a gravel bed river 552
at bankfull discharge conditions can be calculated using the following equations: 553 𝑊𝑏𝑓 = 4.63 𝑔15 𝑄𝑏𝑓0.4( 𝑄𝑏𝑓 √𝑔𝐷50 𝐷502) 0.0667 (S4) 554 𝑆𝑏𝑓 = 0.101 ( 𝑄𝑏𝑓 √𝑔𝐷50 𝐷502) −0.344 (S5) 555
Where Qbf is the bankfull discharge, Wbf is the channel width at bankfull conditions, Sbf is the
556
channel slope at bankfull conditions and D50 is the median grain size. Using these
557
relationships, we calculated the Froude number for bankfull conditions at a range of 558
discharges in an idealized gravel bed river, assuming a median grain size of 10 cm and two 559
values of the Manning’s roughness coefficient. The Froude number at equilibrium conditions 560
using the relationships proposed by Parker et al., (2007) are subcritical, typically in the range 561
0.2-0.3, whatever the value of the bankfull discharge. This shows that in steady uniform flow 562
conditions, single thread gravel bed rivers are not expected to be close to supercriticality, 563
and would not do so even after significant narrowing due to the weak dependency of Fr on 564
channel width (eq. S3). The Parker et al., (2007) relationships (equations S4, S5) are 565
empirical based on a dataset of 72 gravel bed rivers in the UK, Canada, and the USA, which 566
exhibit a degree of universality between them, but do not pertain to braided rivers which are 567
very often the state of rivers during terrace aggradation phases (e.g., Hanson et al., 2006). 568
Using high resolution lidar topography and the Floodos hydrodynamic model, we explored 569
the characteristics of the flow conditions at bankfull conditions for a braided river, the Rakaia 570
river in New Zealand. The present day conditions of the Rakaia are a good analogue both for 571
the initial conditions of the experiments and for the former conditions of many present day 572
rivers that are incised with flights of terraces abandoned on the valley sides (e.g., Charwell 573
River, New Zealand; Bull, 1990). 574
The supercritical flow conditions that initiated the development of cyclic steps in the 575
experiments (Fig. S9) occurred after channels had narrowed following the initial stripping of 576
24 the sediment cover. Therefore, we performed some simple tests using the DEM of the
577
Rakaia river to explore the impact of different constant channel widths with a fixed discharge 578
on the Froude number (Fig. S9A), and the impact of different discharges in a constrained 579
fixed width channel (Fig. S9B). For a fixed discharge, a narrower channel increases the 580
average value of the Froude number and for a fixed width, increased discharge also 581
increases the average values of the Froude number. 582
583
Fig. S9: (A) Impact of channel width on Froude number for a fixed discharge (Q = 2000 m3 s
-584
1). (B) Impact of discharge on Froude number for a fixed width (W = 80 m). As predicted by
585
equation S3, both width and discharge have a small impact on the average Froude number 586
in the channel, but the flow can become supercritical in a few locations. 587
588
The average values of the Froude number remain sub-critical for the scenarios presented in 589
Fig. S9, but the peak values of Fr approach supercriticality due to the local spatial variations 590
in the flow conditions. The numerical simulations in Fig. S11 were carried out using a straight 591
channel, which is overly simplistic for a natural river system. The maps of Froude number for 592
the Rakaia (Fig. S10B) river indicate that flow conditions are not spatially uniform at bankfull 593
discharge and are subcritical (Fr < 1) but the values of the Froude number can be higher 594
(~0.4-0.6) than the values predicted by the relationships of Parker et al., (2007). However, it 595
is possible to have supercritical flow conditions during frequent floods when the flow is 596
focussed into a narrower channel with a spatially non-uniform channel width (Fig. S10C-E). 597
Such conditions may be present in natural settings following a perturbation to the sediment 598
supply or transport capacity and the subsequent stripping of sediment cover and focussing of 599
the flow into a significantly narrower channel with spatially variable width (Fig. 2A). The 600
simulations in Fig. S10 were carried out with no alteration to the channel slope. If the slope of 601
the bedrock surface is steeper than the slope of the alluvial channel flowing over the 602
25 sedimentary deposits (e.g. Finnegan and Balco, 2013), the likelihood of supercritical flow and 603
the possible development of bed instabilities that evolve into knickpoints is increased. We 604
therefore suggest that the processes leading to rapid strath terrace generation through self-605
formed knickpoint retreat, in the absence of any vertical perturbation to the bed elevation, 606
identified in the experiments are possible in natural environments. 607
608 609
610
Fig. S10. (A) Map of water depth for a reach of the Rakaia river, New Zealand, under
611
bankfull conditions (Q = 2000 m3 s-1), modelled using Floodos on a Lidar generated DEM 612
(Released under Creative Commons By Creative Commons Attribution 3.0 New Zealand 613
Link: http://data.linz.govt.nz/license/attribution-3-0-new-zealand/; downloaded from 614
www.opentopography.org; DOI: 10.5069/G9JQ0XZV). (B) Map of Froude number, typically
615
~0.4, with some local areas slightly higher at ~0.6. Channel width variability and degree of 616
channel constriction has impact on the water depth (C) and Froude number at Q = 2000 m3 s -617
1 (D) and Q = 3000 m3 s-1 (E), with increasing degree of supercriticality with increased
618
channel constriction and increased discharge. 619
26 SI References
620
Baynes E.R.C., Lague D., Attal M., Gangloff A., Kirstein L.A., Dugmore A.J., 2018, River self-621
organisation inhibits discharge control on waterfall migration: Scientific Reports 8, 2444, 622
https://doi:10.1038/s41598-018-20767-6 623
Davy P, Croissant T, Lague D (2017) A precipiton method to calculate river hydrodynamics, 624
with applications to flood prediction, landscape evolution models and braiding 625
instabilities. Journal of Geophysical Research. Earth Surface, v. 122, p. 1491–1512, 626
https://doi.org/10.1002/2016JF004156 627
Finnegan N.J., Roe G., Montgomery D.R., Hallet B., 2005, Controls on the channel width of 628
rivers: Implications for modelling fluvial incision of bedrock: Geology, v. 33 (3), p. 229-629
232 630
Hanson PR, Mason JA, Goble RJ (2006) Fluvial terrace formation along Wyoming’s Laramie 631
Range as a response to increased late Pleistocene flood magnitudes. Geomorphology 632
76, 12-25 633
Hooke, R. 1968, Model Geology: Prototype and Laboratory Streams: Discussion: Geological 634
Society of America Bulletin, v. 79, p. 391–94, https://doi.org/10.1130/0016-635
7606(1968)79[391:MGPALS]2.0.CO;2 636
Izumi N, Yokokawa M, Parker G (2017) Incisional cyclic steps of permanent form in mixed 637
bedrock-alluvial rivers. Journal of Geophysical Research. Earth Surface, v. 122, p. 130– 638
152, https://doi.org/10.1002/2016JF003847. 639
Paola, C, K M Straub, D C Mohrig, and L Reinhardt. 2009. “The ``unreasonable 640
Effectiveness’’ of Stratigraphic and Geomorphic Experiments.” Earth-Science Reviews v. 641
97, p. 1–43. 642
Parker G, Izumi N (2000) Purely erosional cyclic and solitary steps created by flow over a 643
cohesive bed. Journal of Fluid Mechanics, v. 419, p. 203–238, 644
https://doi.org/10.1017/S0022112000001403. 645
Parker G, Wilcock PR, Paola C, Dietrich WE, Pitlick J (2007) Physical basis for quasi-646
universal relations describing bankfull hydraulic geometry of single-thread gravel bed 647
rivers. Journal of Geophysical Research, v. 112, F04005. 648
649 650